biopipen 0.21.0__py3-none-any.whl → 0.34.26__py3-none-any.whl
This diff represents the content of publicly available package versions that have been released to one of the supported registries. The information contained in this diff is provided for informational purposes only and reflects changes between package versions as they appear in their respective public registries.
- biopipen/__init__.py +1 -1
- biopipen/core/config.toml +28 -0
- biopipen/core/filters.py +79 -4
- biopipen/core/proc.py +12 -3
- biopipen/core/testing.py +75 -3
- biopipen/ns/bam.py +148 -6
- biopipen/ns/bed.py +75 -0
- biopipen/ns/cellranger.py +186 -0
- biopipen/ns/cellranger_pipeline.py +126 -0
- biopipen/ns/cnv.py +19 -3
- biopipen/ns/cnvkit.py +1 -1
- biopipen/ns/cnvkit_pipeline.py +20 -12
- biopipen/ns/delim.py +34 -35
- biopipen/ns/gene.py +68 -23
- biopipen/ns/gsea.py +63 -37
- biopipen/ns/misc.py +39 -14
- biopipen/ns/plot.py +304 -1
- biopipen/ns/protein.py +183 -0
- biopipen/ns/regulatory.py +290 -0
- biopipen/ns/rnaseq.py +142 -5
- biopipen/ns/scrna.py +2053 -473
- biopipen/ns/scrna_metabolic_landscape.py +228 -382
- biopipen/ns/snp.py +659 -0
- biopipen/ns/stats.py +484 -0
- biopipen/ns/tcr.py +683 -98
- biopipen/ns/vcf.py +236 -2
- biopipen/ns/web.py +97 -6
- biopipen/reports/bam/CNVpytor.svelte +4 -9
- biopipen/reports/cellranger/CellRangerCount.svelte +18 -0
- biopipen/reports/cellranger/CellRangerSummary.svelte +16 -0
- biopipen/reports/cellranger/CellRangerVdj.svelte +18 -0
- biopipen/reports/cnvkit/CNVkitDiagram.svelte +1 -1
- biopipen/reports/cnvkit/CNVkitHeatmap.svelte +1 -1
- biopipen/reports/cnvkit/CNVkitScatter.svelte +1 -1
- biopipen/reports/common.svelte +15 -0
- biopipen/reports/protein/ProdigySummary.svelte +16 -0
- biopipen/reports/scrna/CellsDistribution.svelte +4 -39
- biopipen/reports/scrna/DimPlots.svelte +1 -1
- biopipen/reports/scrna/MarkersFinder.svelte +6 -126
- biopipen/reports/scrna/MetaMarkers.svelte +3 -75
- biopipen/reports/scrna/RadarPlots.svelte +4 -20
- biopipen/reports/scrna_metabolic_landscape/MetabolicFeatures.svelte +61 -22
- biopipen/reports/scrna_metabolic_landscape/MetabolicPathwayActivity.svelte +88 -82
- biopipen/reports/scrna_metabolic_landscape/MetabolicPathwayHeterogeneity.svelte +70 -10
- biopipen/reports/snp/PlinkCallRate.svelte +24 -0
- biopipen/reports/snp/PlinkFreq.svelte +18 -0
- biopipen/reports/snp/PlinkHWE.svelte +18 -0
- biopipen/reports/snp/PlinkHet.svelte +18 -0
- biopipen/reports/snp/PlinkIBD.svelte +18 -0
- biopipen/reports/tcr/CDR3AAPhyschem.svelte +19 -66
- biopipen/reports/tcr/ClonalStats.svelte +16 -0
- biopipen/reports/tcr/CloneResidency.svelte +3 -93
- biopipen/reports/tcr/Immunarch.svelte +4 -155
- biopipen/reports/tcr/TCRClusterStats.svelte +3 -45
- biopipen/reports/tcr/TESSA.svelte +11 -28
- biopipen/reports/utils/misc.liq +22 -7
- biopipen/scripts/bam/BamMerge.py +11 -15
- biopipen/scripts/bam/BamSampling.py +90 -0
- biopipen/scripts/bam/BamSort.py +141 -0
- biopipen/scripts/bam/BamSplitChroms.py +10 -10
- biopipen/scripts/bam/BamSubsetByBed.py +38 -0
- biopipen/scripts/bam/CNAClinic.R +41 -5
- biopipen/scripts/bam/CNVpytor.py +153 -54
- biopipen/scripts/bam/ControlFREEC.py +13 -14
- biopipen/scripts/bam/SamtoolsView.py +33 -0
- biopipen/scripts/bed/Bed2Vcf.py +5 -5
- biopipen/scripts/bed/BedConsensus.py +5 -5
- biopipen/scripts/bed/BedLiftOver.sh +6 -4
- biopipen/scripts/bed/BedtoolsIntersect.py +54 -0
- biopipen/scripts/bed/BedtoolsMakeWindows.py +47 -0
- biopipen/scripts/bed/BedtoolsMerge.py +4 -4
- biopipen/scripts/cellranger/CellRangerCount.py +138 -0
- biopipen/scripts/cellranger/CellRangerSummary.R +181 -0
- biopipen/scripts/cellranger/CellRangerVdj.py +112 -0
- biopipen/scripts/cnv/AneuploidyScore.R +55 -20
- biopipen/scripts/cnv/AneuploidyScoreSummary.R +221 -163
- biopipen/scripts/cnv/TMADScore.R +25 -9
- biopipen/scripts/cnv/TMADScoreSummary.R +57 -86
- biopipen/scripts/cnvkit/CNVkitAccess.py +7 -6
- biopipen/scripts/cnvkit/CNVkitAutobin.py +26 -18
- biopipen/scripts/cnvkit/CNVkitBatch.py +6 -6
- biopipen/scripts/cnvkit/CNVkitCall.py +3 -3
- biopipen/scripts/cnvkit/CNVkitCoverage.py +4 -3
- biopipen/scripts/cnvkit/CNVkitDiagram.py +5 -5
- biopipen/scripts/cnvkit/CNVkitFix.py +3 -3
- biopipen/scripts/cnvkit/CNVkitGuessBaits.py +12 -8
- biopipen/scripts/cnvkit/CNVkitHeatmap.py +5 -5
- biopipen/scripts/cnvkit/CNVkitReference.py +6 -5
- biopipen/scripts/cnvkit/CNVkitScatter.py +5 -5
- biopipen/scripts/cnvkit/CNVkitSegment.py +5 -5
- biopipen/scripts/cnvkit/guess_baits.py +166 -93
- biopipen/scripts/delim/RowsBinder.R +1 -1
- biopipen/scripts/delim/SampleInfo.R +116 -118
- biopipen/scripts/gene/GeneNameConversion.R +67 -0
- biopipen/scripts/gene/GenePromoters.R +61 -0
- biopipen/scripts/gsea/Enrichr.R +5 -5
- biopipen/scripts/gsea/FGSEA.R +184 -50
- biopipen/scripts/gsea/GSEA.R +2 -2
- biopipen/scripts/gsea/PreRank.R +5 -5
- biopipen/scripts/misc/Config2File.py +2 -2
- biopipen/scripts/misc/Plot.R +80 -0
- biopipen/scripts/misc/Shell.sh +15 -0
- biopipen/scripts/misc/Str2File.py +2 -2
- biopipen/scripts/plot/Heatmap.R +3 -3
- biopipen/scripts/plot/Manhattan.R +147 -0
- biopipen/scripts/plot/QQPlot.R +146 -0
- biopipen/scripts/plot/ROC.R +88 -0
- biopipen/scripts/plot/Scatter.R +112 -0
- biopipen/scripts/plot/VennDiagram.R +5 -9
- biopipen/scripts/protein/MMCIF2PDB.py +33 -0
- biopipen/scripts/protein/PDB2Fasta.py +60 -0
- biopipen/scripts/protein/Prodigy.py +119 -0
- biopipen/scripts/protein/ProdigySummary.R +140 -0
- biopipen/scripts/protein/RMSD.py +178 -0
- biopipen/scripts/regulatory/MotifAffinityTest.R +102 -0
- biopipen/scripts/regulatory/MotifAffinityTest_AtSNP.R +127 -0
- biopipen/scripts/regulatory/MotifAffinityTest_MotifBreakR.R +104 -0
- biopipen/scripts/regulatory/MotifScan.py +159 -0
- biopipen/scripts/regulatory/VariantMotifPlot.R +78 -0
- biopipen/scripts/regulatory/motifs-common.R +324 -0
- biopipen/scripts/rnaseq/Simulation-ESCO.R +180 -0
- biopipen/scripts/rnaseq/Simulation-RUVcorr.R +45 -0
- biopipen/scripts/rnaseq/Simulation.R +21 -0
- biopipen/scripts/rnaseq/UnitConversion.R +325 -54
- biopipen/scripts/scrna/AnnData2Seurat.R +40 -0
- biopipen/scripts/scrna/CCPlotR-patch.R +161 -0
- biopipen/scripts/scrna/CellCellCommunication.py +150 -0
- biopipen/scripts/scrna/CellCellCommunicationPlots.R +93 -0
- biopipen/scripts/scrna/CellSNPLite.py +30 -0
- biopipen/scripts/scrna/CellTypeAnnotation-celltypist.R +185 -0
- biopipen/scripts/scrna/CellTypeAnnotation-direct.R +68 -31
- biopipen/scripts/scrna/CellTypeAnnotation-hitype.R +27 -22
- biopipen/scripts/scrna/CellTypeAnnotation-sccatch.R +28 -20
- biopipen/scripts/scrna/CellTypeAnnotation-sctype.R +48 -25
- biopipen/scripts/scrna/CellTypeAnnotation.R +37 -1
- biopipen/scripts/scrna/CellsDistribution.R +456 -167
- biopipen/scripts/scrna/DimPlots.R +1 -1
- biopipen/scripts/scrna/ExprImputation-alra.R +109 -0
- biopipen/scripts/scrna/ExprImputation-rmagic.R +256 -0
- biopipen/scripts/scrna/{ExprImpution-scimpute.R → ExprImputation-scimpute.R} +8 -5
- biopipen/scripts/scrna/ExprImputation.R +7 -0
- biopipen/scripts/scrna/LoomTo10X.R +51 -0
- biopipen/scripts/scrna/MQuad.py +25 -0
- biopipen/scripts/scrna/MarkersFinder.R +679 -400
- biopipen/scripts/scrna/MetaMarkers.R +265 -161
- biopipen/scripts/scrna/ModuleScoreCalculator.R +66 -11
- biopipen/scripts/scrna/PseudoBulkDEG.R +678 -0
- biopipen/scripts/scrna/RadarPlots.R +355 -134
- biopipen/scripts/scrna/ScFGSEA.R +298 -100
- biopipen/scripts/scrna/ScSimulation.R +65 -0
- biopipen/scripts/scrna/ScVelo.py +617 -0
- biopipen/scripts/scrna/Seurat2AnnData.R +7 -0
- biopipen/scripts/scrna/SeuratClusterStats-clustree.R +87 -0
- biopipen/scripts/scrna/SeuratClusterStats-dimplots.R +36 -30
- biopipen/scripts/scrna/SeuratClusterStats-features.R +138 -187
- biopipen/scripts/scrna/SeuratClusterStats-ngenes.R +81 -0
- biopipen/scripts/scrna/SeuratClusterStats-stats.R +78 -89
- biopipen/scripts/scrna/SeuratClusterStats.R +47 -10
- biopipen/scripts/scrna/SeuratClustering.R +36 -233
- biopipen/scripts/scrna/SeuratLoading.R +2 -2
- biopipen/scripts/scrna/SeuratMap2Ref.R +84 -113
- biopipen/scripts/scrna/SeuratMetadataMutater.R +16 -6
- biopipen/scripts/scrna/SeuratPreparing.R +223 -173
- biopipen/scripts/scrna/SeuratSubClustering.R +64 -0
- biopipen/scripts/scrna/SeuratTo10X.R +27 -0
- biopipen/scripts/scrna/Slingshot.R +65 -0
- biopipen/scripts/scrna/Subset10X.R +2 -2
- biopipen/scripts/scrna/TopExpressingGenes.R +169 -135
- biopipen/scripts/scrna/celltypist-wrapper.py +195 -0
- biopipen/scripts/scrna/scvelo_paga.py +313 -0
- biopipen/scripts/scrna/seurat_anndata_conversion.py +98 -0
- biopipen/scripts/scrna_metabolic_landscape/MetabolicFeatures.R +447 -82
- biopipen/scripts/scrna_metabolic_landscape/MetabolicPathwayActivity.R +348 -241
- biopipen/scripts/scrna_metabolic_landscape/MetabolicPathwayHeterogeneity.R +188 -166
- biopipen/scripts/snp/MatrixEQTL.R +217 -0
- biopipen/scripts/snp/Plink2GTMat.py +148 -0
- biopipen/scripts/snp/PlinkCallRate.R +199 -0
- biopipen/scripts/snp/PlinkFilter.py +100 -0
- biopipen/scripts/snp/PlinkFreq.R +291 -0
- biopipen/scripts/snp/PlinkFromVcf.py +81 -0
- biopipen/scripts/snp/PlinkHWE.R +85 -0
- biopipen/scripts/snp/PlinkHet.R +96 -0
- biopipen/scripts/snp/PlinkIBD.R +196 -0
- biopipen/scripts/snp/PlinkSimulation.py +124 -0
- biopipen/scripts/snp/PlinkUpdateName.py +124 -0
- biopipen/scripts/stats/ChowTest.R +146 -0
- biopipen/scripts/stats/DiffCoexpr.R +152 -0
- biopipen/scripts/stats/LiquidAssoc.R +135 -0
- biopipen/scripts/stats/Mediation.R +108 -0
- biopipen/scripts/stats/MetaPvalue.R +130 -0
- biopipen/scripts/stats/MetaPvalue1.R +74 -0
- biopipen/scripts/tcgamaf/Maf2Vcf.py +2 -2
- biopipen/scripts/tcgamaf/MafAddChr.py +2 -2
- biopipen/scripts/tcr/Attach2Seurat.R +3 -2
- biopipen/scripts/tcr/CDR3AAPhyschem.R +211 -143
- biopipen/scripts/tcr/CDR3Clustering.R +343 -0
- biopipen/scripts/tcr/ClonalStats.R +526 -0
- biopipen/scripts/tcr/CloneResidency.R +255 -131
- biopipen/scripts/tcr/CloneSizeQQPlot.R +4 -4
- biopipen/scripts/tcr/GIANA/GIANA.py +1356 -797
- biopipen/scripts/tcr/GIANA/GIANA4.py +1362 -789
- biopipen/scripts/tcr/GIANA/query.py +164 -162
- biopipen/scripts/tcr/Immunarch-basic.R +31 -9
- biopipen/scripts/tcr/Immunarch-clonality.R +25 -5
- biopipen/scripts/tcr/Immunarch-diversity.R +352 -134
- biopipen/scripts/tcr/Immunarch-geneusage.R +45 -5
- biopipen/scripts/tcr/Immunarch-kmer.R +68 -8
- biopipen/scripts/tcr/Immunarch-overlap.R +84 -4
- biopipen/scripts/tcr/Immunarch-spectratyping.R +35 -6
- biopipen/scripts/tcr/Immunarch-tracking.R +38 -6
- biopipen/scripts/tcr/Immunarch-vjjunc.R +165 -0
- biopipen/scripts/tcr/Immunarch.R +63 -11
- biopipen/scripts/tcr/Immunarch2VDJtools.R +2 -2
- biopipen/scripts/tcr/ImmunarchFilter.R +4 -4
- biopipen/scripts/tcr/ImmunarchLoading.R +38 -29
- biopipen/scripts/tcr/SampleDiversity.R +1 -1
- biopipen/scripts/tcr/ScRepCombiningExpression.R +40 -0
- biopipen/scripts/tcr/ScRepLoading.R +166 -0
- biopipen/scripts/tcr/TCRClusterStats.R +176 -22
- biopipen/scripts/tcr/TCRDock.py +110 -0
- biopipen/scripts/tcr/TESSA.R +102 -118
- biopipen/scripts/tcr/VJUsage.R +5 -5
- biopipen/scripts/tcr/immunarch-patched.R +142 -0
- biopipen/scripts/tcr/vdjtools-patch.sh +1 -1
- biopipen/scripts/vcf/BcftoolsAnnotate.py +91 -0
- biopipen/scripts/vcf/BcftoolsFilter.py +90 -0
- biopipen/scripts/vcf/BcftoolsMerge.py +31 -0
- biopipen/scripts/vcf/BcftoolsSort.py +113 -0
- biopipen/scripts/vcf/BcftoolsView.py +73 -0
- biopipen/scripts/vcf/TruvariBench.sh +14 -7
- biopipen/scripts/vcf/TruvariBenchSummary.R +16 -13
- biopipen/scripts/vcf/TruvariConsistency.R +1 -1
- biopipen/scripts/vcf/Vcf2Bed.py +2 -2
- biopipen/scripts/vcf/VcfAnno.py +11 -11
- biopipen/scripts/vcf/VcfDownSample.sh +22 -10
- biopipen/scripts/vcf/VcfFilter.py +5 -5
- biopipen/scripts/vcf/VcfFix.py +7 -7
- biopipen/scripts/vcf/VcfFix_utils.py +13 -4
- biopipen/scripts/vcf/VcfIndex.py +3 -3
- biopipen/scripts/vcf/VcfIntersect.py +3 -3
- biopipen/scripts/vcf/VcfLiftOver.sh +5 -0
- biopipen/scripts/vcf/VcfSplitSamples.py +4 -4
- biopipen/scripts/vcf/bcftools_utils.py +52 -0
- biopipen/scripts/web/Download.py +8 -4
- biopipen/scripts/web/DownloadList.py +5 -5
- biopipen/scripts/web/GCloudStorageDownloadBucket.py +82 -0
- biopipen/scripts/web/GCloudStorageDownloadFile.py +23 -0
- biopipen/scripts/web/gcloud_common.py +49 -0
- biopipen/utils/gene.py +108 -60
- biopipen/utils/misc.py +146 -20
- biopipen/utils/reference.py +64 -20
- biopipen/utils/reporter.py +177 -0
- biopipen/utils/vcf.py +1 -1
- biopipen-0.34.26.dist-info/METADATA +27 -0
- biopipen-0.34.26.dist-info/RECORD +292 -0
- {biopipen-0.21.0.dist-info → biopipen-0.34.26.dist-info}/WHEEL +1 -1
- {biopipen-0.21.0.dist-info → biopipen-0.34.26.dist-info}/entry_points.txt +6 -2
- biopipen/ns/bcftools.py +0 -111
- biopipen/ns/scrna_basic.py +0 -255
- biopipen/reports/delim/SampleInfo.svelte +0 -36
- biopipen/reports/scrna/GeneExpressionInvistigation.svelte +0 -32
- biopipen/reports/scrna/ScFGSEA.svelte +0 -35
- biopipen/reports/scrna/SeuratClusterStats.svelte +0 -82
- biopipen/reports/scrna/SeuratMap2Ref.svelte +0 -20
- biopipen/reports/scrna/SeuratPreparing.svelte +0 -38
- biopipen/reports/scrna/TopExpressingGenes.svelte +0 -55
- biopipen/reports/scrna_metabolic_landscape/MetabolicFeaturesIntraSubset.svelte +0 -31
- biopipen/reports/utils/gsea.liq +0 -110
- biopipen/scripts/bcftools/BcftoolsAnnotate.py +0 -42
- biopipen/scripts/bcftools/BcftoolsFilter.py +0 -79
- biopipen/scripts/bcftools/BcftoolsSort.py +0 -19
- biopipen/scripts/gene/GeneNameConversion.py +0 -66
- biopipen/scripts/scrna/ExprImpution-alra.R +0 -32
- biopipen/scripts/scrna/ExprImpution-rmagic.R +0 -29
- biopipen/scripts/scrna/ExprImpution.R +0 -7
- biopipen/scripts/scrna/GeneExpressionInvistigation.R +0 -132
- biopipen/scripts/scrna/Write10X.R +0 -11
- biopipen/scripts/scrna_metabolic_landscape/MetabolicFeaturesIntraSubset.R +0 -150
- biopipen/scripts/tcr/TCRClustering.R +0 -280
- biopipen/utils/common_docstrs.py +0 -61
- biopipen/utils/gene.R +0 -49
- biopipen/utils/gsea.R +0 -193
- biopipen/utils/io.R +0 -20
- biopipen/utils/misc.R +0 -114
- biopipen/utils/mutate_helpers.R +0 -433
- biopipen/utils/plot.R +0 -173
- biopipen/utils/rnaseq.R +0 -48
- biopipen/utils/single_cell.R +0 -115
- biopipen-0.21.0.dist-info/METADATA +0 -22
- biopipen-0.21.0.dist-info/RECORD +0 -218
biopipen/ns/scrna.py
CHANGED
|
@@ -1,14 +1,8 @@
|
|
|
1
1
|
"""Tools to analyze single-cell RNA"""
|
|
2
2
|
|
|
3
|
+
from pipen.utils import mark
|
|
3
4
|
from ..core.proc import Proc
|
|
4
5
|
from ..core.config import config
|
|
5
|
-
from ..utils.common_docstrs import (
|
|
6
|
-
indent_docstr,
|
|
7
|
-
format_placeholder,
|
|
8
|
-
MUTATE_HELPERS_CLONESIZE,
|
|
9
|
-
)
|
|
10
|
-
|
|
11
|
-
MUTATE_HELPERS_CLONESIZE_INDENTED = indent_docstr(MUTATE_HELPERS_CLONESIZE, " " * 3)
|
|
12
6
|
|
|
13
7
|
|
|
14
8
|
class SeuratLoading(Proc):
|
|
@@ -47,17 +41,19 @@ class SeuratPreparing(Proc):
|
|
|
47
41
|
This process will -
|
|
48
42
|
- Prepare the seurat object
|
|
49
43
|
- Apply QC to the data
|
|
44
|
+
- Integrate the data from different samples
|
|
50
45
|
|
|
51
46
|
See also
|
|
52
47
|
- <https://satijalab.org/seurat/articles/pbmc3k_tutorial.html#standard-pre-processing-workflow-1)>
|
|
53
|
-
- <https://
|
|
48
|
+
- <https://satijalab.org/seurat/articles/integration_introduction>
|
|
54
49
|
|
|
55
50
|
This process will read the scRNA-seq data, based on the information provided by
|
|
56
51
|
`SampleInfo`, specifically, the paths specified by the `RNAData` column.
|
|
57
52
|
Those paths should be either paths to directoies containing `matrix.mtx`,
|
|
58
53
|
`barcodes.tsv` and `features.tsv` files that can be loaded by
|
|
59
54
|
[`Seurat::Read10X()`](https://satijalab.org/seurat/reference/read10x),
|
|
60
|
-
or paths
|
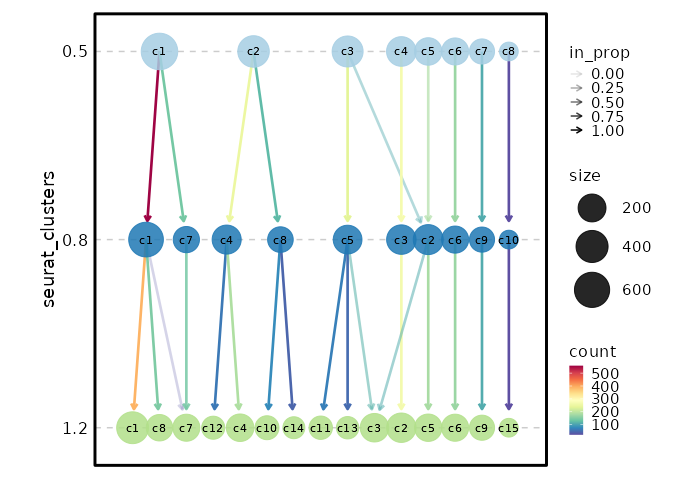
|
55
|
+
or paths of loom files that can be loaded by `SeuratDisk::LoadLoom()`, or paths to
|
|
56
|
+
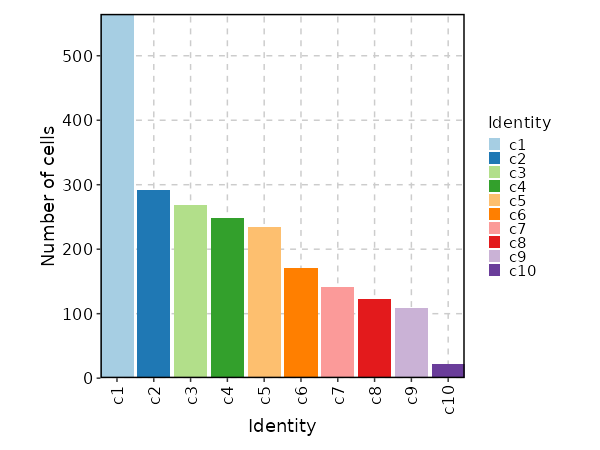
`h5` files that can be loaded by
|
|
61
57
|
[`Seurat::Read10X_h5()`](https://satijalab.org/seurat/reference/read10x_h5).
|
|
62
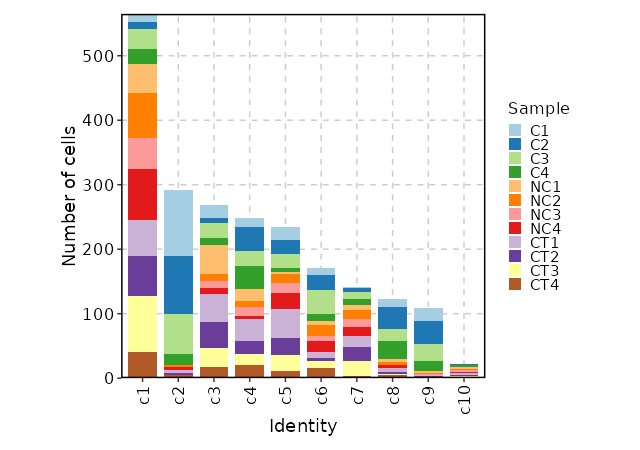
58
|
|
|
63
59
|
Each sample will be loaded individually and then merged into one `Seurat` object, and then perform QC.
|
|
@@ -69,6 +65,20 @@ class SeuratPreparing(Proc):
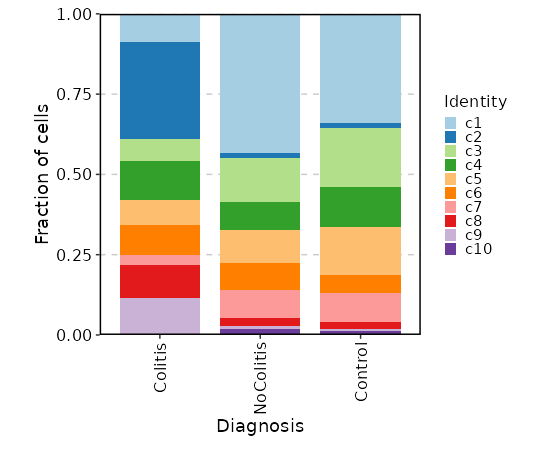
|
|
|
69
65
|
- `precent.hb`: The percentage of hemoglobin genes.
|
|
70
66
|
- `percent.plat`: The percentage of platelet genes.
|
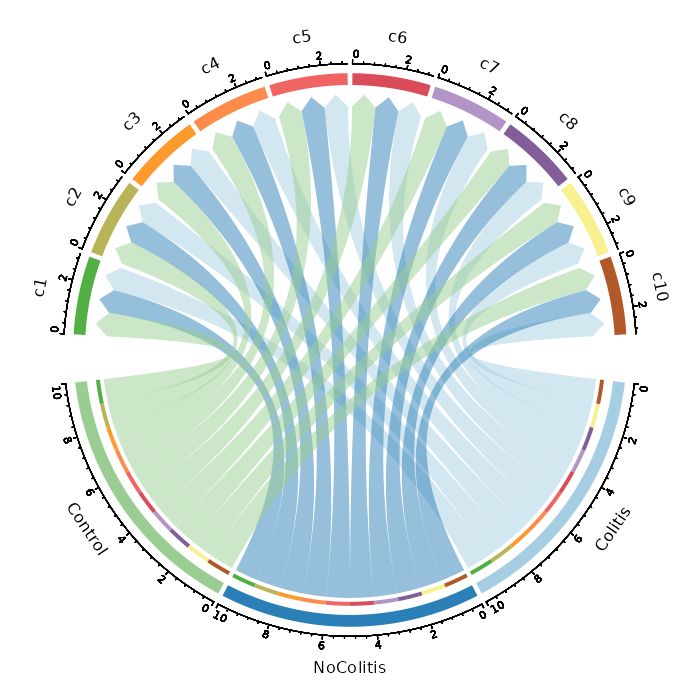
|
71
67
|
|
|
68
|
+
For integration, two routes are available:
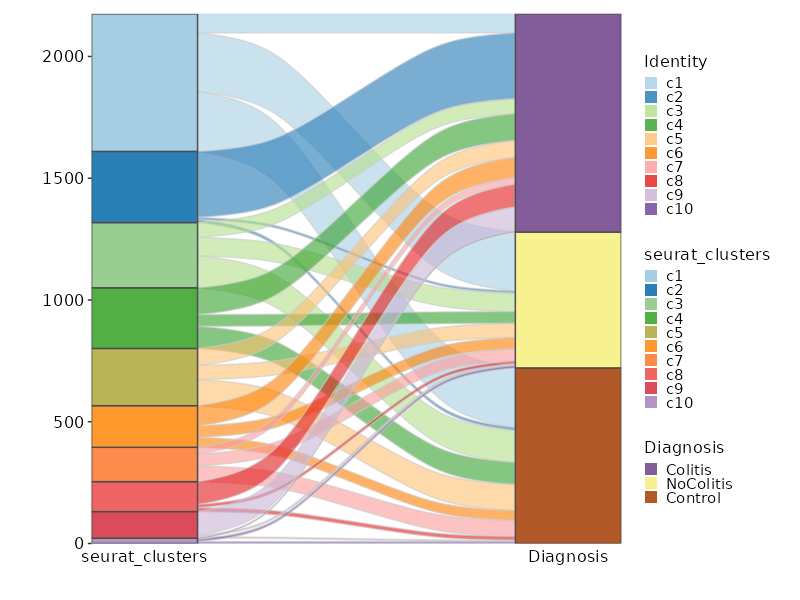
|
|
69
|
+
|
|
70
|
+
- [Performing integration on datasets normalized with `SCTransform`](https://satijalab.org/seurat/articles/seurat5_integration#perform-streamlined-one-line-integrative-analysis)
|
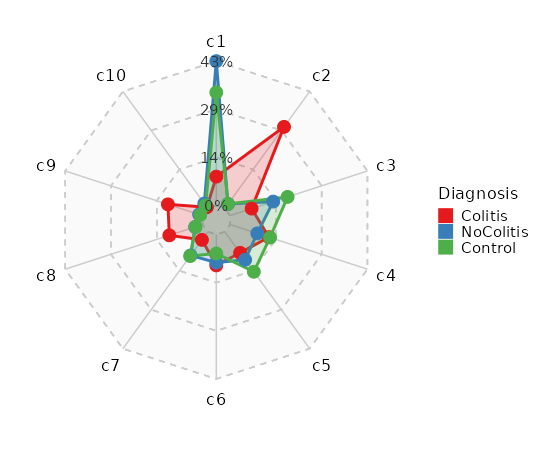
|
71
|
+
- [Using `NormalizeData` and `FindIntegrationAnchors`](https://satijalab.org/seurat/articles/seurat5_integration#layers-in-the-seurat-v5-object)
|
|
72
|
+
|
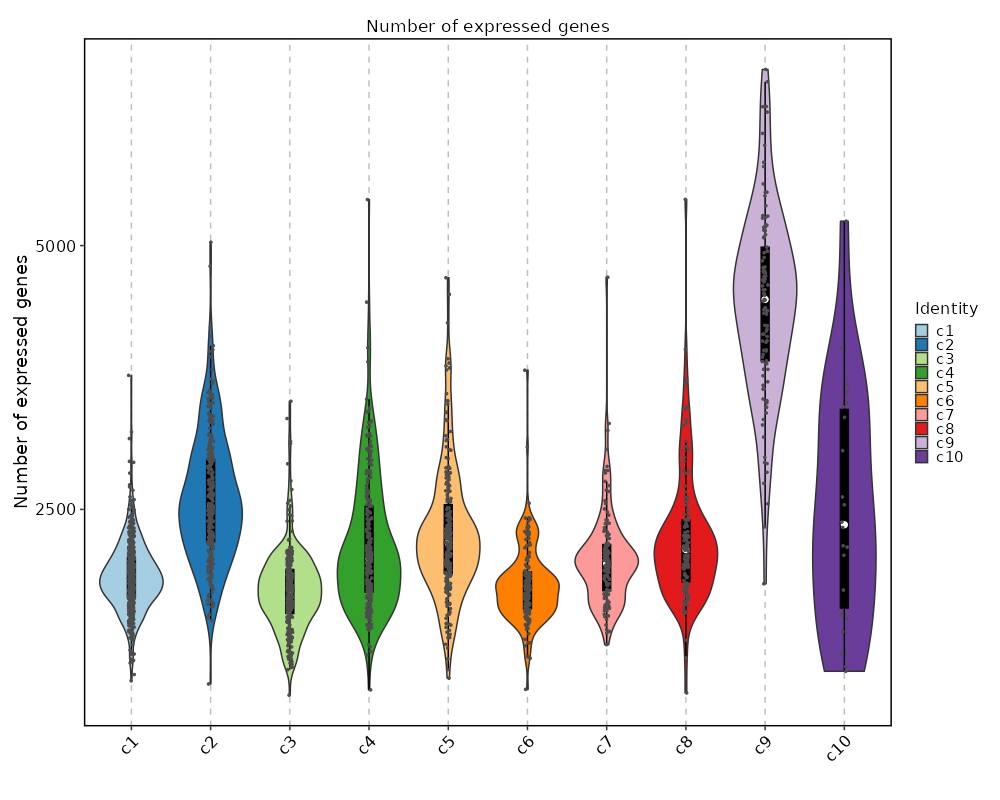
|
73
|
+
/// Note
|
|
74
|
+
When using `SCTransform`, the default Assay will be set to `SCT` in output, rather than `RNA`.
|
|
75
|
+
If you are using `cca` or `rpca` interation, the default assay will be `integrated`.
|
|
76
|
+
///
|
|
77
|
+
|
|
78
|
+
/// Note
|
|
79
|
+
From `biopipen` v0.23.0, this requires `Seurat` v5.0.0 or higher.
|
|
80
|
+
///
|
|
81
|
+
|
|
72
82
|
Input:
|
|
73
83
|
metafile: The metadata of the samples
|
|
74
84
|
A tab-delimited file
|
|
@@ -77,19 +87,34 @@ class SeuratPreparing(Proc):
|
|
|
77
87
|
`RNAData` to assign the path of the data to the samples
|
|
78
88
|
The path will be read by `Read10X()` from `Seurat`, or the path
|
|
79
89
|
to the h5 file that can be read by `Read10X_h5()` from `Seurat`.
|
|
90
|
+
It can also be an RDS or qs2 file containing a `Seurat` object.
|
|
91
|
+
Note that it must has a column named `Sample` in the meta.data to specify the sample names.
|
|
80
92
|
|
|
81
93
|
Output:
|
|
82
|
-
|
|
83
|
-
Note that the cell ids are
|
|
84
|
-
QC plots will be saved in `<job.outdir>/before-qc` and
|
|
85
|
-
`<job.outdir>/after-qc`
|
|
94
|
+
outfile: The qs2 file with the Seurat object with all samples integrated.
|
|
95
|
+
Note that the cell ids are prefixied with sample names.
|
|
86
96
|
|
|
87
97
|
Envs:
|
|
88
98
|
ncores (type=int): Number of cores to use.
|
|
89
99
|
Used in `future::plan(strategy = "multicore", workers = <ncores>)`
|
|
90
100
|
to parallelize some Seurat procedures.
|
|
101
|
+
mutaters (type=json): The mutaters to mutate the metadata to the cells.
|
|
102
|
+
These new columns will be added to the metadata of the Seurat object and
|
|
103
|
+
will be saved in the output file.
|
|
104
|
+
min_cells (type=int): The minimum number of cells that a gene must be
|
|
105
|
+
expressed in to be kept. This is used in `Seurat::CreateSeuratObject()`.
|
|
106
|
+
Futher QC (`envs.cell_qc`, `envs.gene_qc`) will be performed after this.
|
|
107
|
+
It doesn't work when data is loaded from loom files or RDS/qs2 files.
|
|
108
|
+
min_features (type=int): The minimum number of features that a cell must
|
|
109
|
+
express to be kept. This is used in `Seurat::CreateSeuratObject()`.
|
|
110
|
+
Futher QC (`envs.cell_qc`, `envs.gene_qc`) will be performed after this.
|
|
111
|
+
It doesn't work when data is loaded from loom files or RDS/qs2 files.
|
|
91
112
|
cell_qc: Filter expression to filter cells, using
|
|
92
113
|
`tidyrseurat::filter()`.
|
|
114
|
+
It can also be a dictionary of expressions, where the names of the list are
|
|
115
|
+
sample names.
|
|
116
|
+
You can have a default expression in the list with the name "DEFAULT" for
|
|
117
|
+
the samples that are not listed.
|
|
93
118
|
Available QC keys include `nFeature_RNA`, `nCount_RNA`,
|
|
94
119
|
`percent.mt`, `percent.ribo`, `percent.hb`, and `percent.plat`.
|
|
95
120
|
|
|
@@ -100,25 +125,138 @@ class SeuratPreparing(Proc):
|
|
|
100
125
|
|
|
101
126
|
```toml
|
|
102
127
|
[SeuratPreparing.envs]
|
|
128
|
+
|
|
103
129
|
cell_qc = "nFeature_RNA > 200 & percent.mt < 5"
|
|
104
130
|
```
|
|
105
131
|
will keep cells with more than 200 genes and less than 5%% mitochondrial
|
|
106
132
|
genes.
|
|
107
133
|
///
|
|
108
134
|
|
|
109
|
-
gene_qc (ns): Filter genes.
|
|
135
|
+
gene_qc (ns): Filter genes.
|
|
110
136
|
`gene_qc` is applied after `cell_qc`.
|
|
111
137
|
- min_cells: The minimum number of cells that a gene must be
|
|
112
138
|
expressed in to be kept.
|
|
139
|
+
- excludes: The genes to exclude. Multiple genes can be specified by
|
|
140
|
+
comma separated values, or as a list.
|
|
113
141
|
|
|
114
142
|
/// Tip | Example
|
|
115
143
|
```toml
|
|
116
144
|
[SeuratPreparing.envs]
|
|
145
|
+
|
|
117
146
|
gene_qc = { min_cells = 3 }
|
|
118
147
|
```
|
|
119
148
|
will keep genes that are expressed in at least 3 cells.
|
|
120
149
|
///
|
|
121
150
|
|
|
151
|
+
qc_plots (type=json): The plots for QC metrics.
|
|
152
|
+
It should be a json (or python dict) with the keys as the names of the plots and
|
|
153
|
+
the values also as dicts with the following keys:
|
|
154
|
+
* kind: The kind of QC. Either `gene` or `cell` (default).
|
|
155
|
+
* devpars: The device parameters for the plot. A dict with `res`, `height`, and `width`.
|
|
156
|
+
* more_formats: The formats to save the plots other than `png`.
|
|
157
|
+
* save_code: Whether to save the code to reproduce the plot.
|
|
158
|
+
* other arguments passed to
|
|
159
|
+
[`biopipen.utils::VizSeuratCellQC`](https://pwwang.github.io/biopipen.utils.R/reference/VizSeuratCellQC.html)
|
|
160
|
+
when `kind` is `cell` or
|
|
161
|
+
[`biopipen.utils::VizSeuratGeneQC`](https://pwwang.github.io/biopipen.utils.R/reference/VizSeuratGeneQC.html)
|
|
162
|
+
when `kind` is `gene`.
|
|
163
|
+
|
|
164
|
+
use_sct (flag): Whether use SCTransform routine to integrate samples or not.
|
|
165
|
+
Before the following procedures, the `RNA` layer will be split by samples.
|
|
166
|
+
|
|
167
|
+
If `False`, following procedures will be performed in the order:
|
|
168
|
+
* [`NormalizeData`](https://satijalab.org/seurat/reference/normalizedata).
|
|
169
|
+
* [`FindVariableFeatures`](https://satijalab.org/seurat/reference/findvariablefeatures).
|
|
170
|
+
* [`ScaleData`](https://satijalab.org/seurat/reference/scaledata).
|
|
171
|
+
See <https://satijalab.org/seurat/articles/seurat5_integration#layers-in-the-seurat-v5-object>
|
|
172
|
+
and <https://satijalab.org/seurat/articles/pbmc3k_tutorial.html>
|
|
173
|
+
|
|
174
|
+
If `True`, following procedures will be performed in the order:
|
|
175
|
+
* [`SCTransform`](https://satijalab.org/seurat/reference/sctransform).
|
|
176
|
+
See <https://satijalab.org/seurat/articles/seurat5_integration#perform-streamlined-one-line-integrative-analysis>
|
|
177
|
+
|
|
178
|
+
no_integration (flag): Whether to skip integration or not.
|
|
179
|
+
NormalizeData (ns): Arguments for [`NormalizeData()`](https://satijalab.org/seurat/reference/normalizedata).
|
|
180
|
+
`object` is specified internally, and `-` in the key will be replaced with `.`.
|
|
181
|
+
- <more>: See <https://satijalab.org/seurat/reference/normalizedata>
|
|
182
|
+
|
|
183
|
+
FindVariableFeatures (ns): Arguments for [`FindVariableFeatures()`](https://satijalab.org/seurat/reference/findvariablefeatures).
|
|
184
|
+
`object` is specified internally, and `-` in the key will be replaced with `.`.
|
|
185
|
+
- <more>: See <https://satijalab.org/seurat/reference/findvariablefeatures>
|
|
186
|
+
|
|
187
|
+
ScaleData (ns): Arguments for [`ScaleData()`](https://satijalab.org/seurat/reference/scaledata).
|
|
188
|
+
`object` and `features` is specified internally, and `-` in the key will be replaced with `.`.
|
|
189
|
+
- <more>: See <https://satijalab.org/seurat/reference/scaledata>
|
|
190
|
+
|
|
191
|
+
RunPCA (ns): Arguments for [`RunPCA()`](https://satijalab.org/seurat/reference/runpca).
|
|
192
|
+
`object` and `features` is specified internally, and `-` in the key will be replaced with `.`.
|
|
193
|
+
- npcs (type=int): The number of PCs to compute.
|
|
194
|
+
For each sample, `npcs` will be no larger than the number of columns - 1.
|
|
195
|
+
- <more>: See <https://satijalab.org/seurat/reference/runpca>
|
|
196
|
+
|
|
197
|
+
SCTransform (ns): Arguments for [`SCTransform()`](https://satijalab.org/seurat/reference/sctransform).
|
|
198
|
+
`object` is specified internally, and `-` in the key will be replaced with `.`.
|
|
199
|
+
- return-only-var-genes: Whether to return only variable genes.
|
|
200
|
+
- min_cells: The minimum number of cells that a gene must be expressed in to be kept.
|
|
201
|
+
A hidden argument of `SCTransform` to filter genes.
|
|
202
|
+
If you try to keep all genes in the `RNA` assay, you can set `min_cells` to `0` and
|
|
203
|
+
`return-only-var-genes` to `False`.
|
|
204
|
+
See <https://github.com/satijalab/seurat/issues/3598#issuecomment-715505537>
|
|
205
|
+
- <more>: See <https://satijalab.org/seurat/reference/sctransform>
|
|
206
|
+
|
|
207
|
+
IntegrateLayers (ns): Arguments for [`IntegrateLayers()`](https://satijalab.org/seurat/reference/integratelayers).
|
|
208
|
+
`object` is specified internally, and `-` in the key will be replaced with `.`.
|
|
209
|
+
When `use_sct` is `True`, `normalization-method` defaults to `SCT`.
|
|
210
|
+
- method (choice): The method to use for integration.
|
|
211
|
+
- CCAIntegration: Use `Seurat::CCAIntegration`.
|
|
212
|
+
- CCA: Same as `CCAIntegration`.
|
|
213
|
+
- cca: Same as `CCAIntegration`.
|
|
214
|
+
- RPCAIntegration: Use `Seurat::RPCAIntegration`.
|
|
215
|
+
- RPCA: Same as `RPCAIntegration`.
|
|
216
|
+
- rpca: Same as `RPCAIntegration`.
|
|
217
|
+
- HarmonyIntegration: Use `Seurat::HarmonyIntegration`.
|
|
218
|
+
- Harmony: Same as `HarmonyIntegration`.
|
|
219
|
+
- harmony: Same as `HarmonyIntegration`.
|
|
220
|
+
- FastMNNIntegration: Use `Seurat::FastMNNIntegration`.
|
|
221
|
+
- FastMNN: Same as `FastMNNIntegration`.
|
|
222
|
+
- fastmnn: Same as `FastMNNIntegration`.
|
|
223
|
+
- scVIIntegration: Use `Seurat::scVIIntegration`.
|
|
224
|
+
- scVI: Same as `scVIIntegration`.
|
|
225
|
+
- scvi: Same as `scVIIntegration`.
|
|
226
|
+
- <more>: See <https://satijalab.org/seurat/reference/integratelayers>
|
|
227
|
+
|
|
228
|
+
doublet_detector (choice): The doublet detector to use.
|
|
229
|
+
- none: Do not use any doublet detector.
|
|
230
|
+
- DoubletFinder: Use `DoubletFinder` to detect doublets.
|
|
231
|
+
- doubletfinder: Same as `DoubletFinder`.
|
|
232
|
+
- scDblFinder: Use `scDblFinder` to detect doublets.
|
|
233
|
+
- scdblfinder: Same as `scDblFinder`.
|
|
234
|
+
|
|
235
|
+
DoubletFinder (ns): Arguments to run [`DoubletFinder`](https://github.com/chris-mcginnis-ucsf/DoubletFinder).
|
|
236
|
+
See also <https://demultiplexing-doublet-detecting-docs.readthedocs.io/en/latest/DoubletFinder.html>.
|
|
237
|
+
- PCs (type=int): Number of PCs to use for 'doubletFinder' function.
|
|
238
|
+
- doublets (type=float): Number of expected doublets as a proportion of the pool size.
|
|
239
|
+
- pN (type=float): Number of doublets to simulate as a proportion of the pool size.
|
|
240
|
+
- ncores (type=int): Number of cores to use for `DoubletFinder::paramSweep`.
|
|
241
|
+
Set to `None` to use `envs.ncores`.
|
|
242
|
+
Since parallelization of the function usually exhausts memory, if big `envs.ncores` does not work
|
|
243
|
+
for `DoubletFinder`, set this to a smaller number.
|
|
244
|
+
|
|
245
|
+
scDblFinder (ns): Arguments to run [`scDblFinder`](https://rdrr.io/bioc/scDblFinder/man/scDblFinder.html).
|
|
246
|
+
- dbr (type=float): The expected doublet rate.
|
|
247
|
+
- ncores (type=int): Number of cores to use for `scDblFinder`.
|
|
248
|
+
Set to `None` to use `envs.ncores`.
|
|
249
|
+
- <more>: See <https://rdrr.io/bioc/scDblFinder/man/scDblFinder.html>.
|
|
250
|
+
|
|
251
|
+
cache (type=auto): Whether to cache the information at different steps.
|
|
252
|
+
If `True`, the seurat object will be cached in the job output directory, which will be not cleaned up when job is rerunning.
|
|
253
|
+
The cached seurat object will be saved as `<signature>.<kind>.RDS` file, where `<signature>` is the signature determined by
|
|
254
|
+
the input and envs of the process.
|
|
255
|
+
See <https://github.com/satijalab/seurat/issues/7849>, <https://github.com/satijalab/seurat/issues/5358> and
|
|
256
|
+
<https://github.com/satijalab/seurat/issues/6748> for more details also about reproducibility issues.
|
|
257
|
+
To not use the cached seurat object, you can either set `cache` to `False` or delete the cached file at
|
|
258
|
+
`<signature>.RDS` in the cache directory.
|
|
259
|
+
|
|
122
260
|
Requires:
|
|
123
261
|
r-seurat:
|
|
124
262
|
- check: {{proc.lang}} <(echo "library(Seurat)")
|
|
@@ -127,17 +265,60 @@ class SeuratPreparing(Proc):
|
|
|
127
265
|
r-bracer:
|
|
128
266
|
- check: {{proc.lang}} <(echo "library(bracer)")
|
|
129
267
|
""" # noqa: E501
|
|
268
|
+
|
|
130
269
|
input = "metafile:file"
|
|
131
|
-
output = "
|
|
270
|
+
output = "outfile:file:{{in.metafile | stem}}.seurat.qs"
|
|
132
271
|
lang = config.lang.rscript
|
|
272
|
+
envs_depth = 4
|
|
133
273
|
envs = {
|
|
134
274
|
"ncores": config.misc.ncores,
|
|
275
|
+
"mutaters": {},
|
|
276
|
+
"min_cells": 0,
|
|
277
|
+
"min_features": 0,
|
|
135
278
|
"cell_qc": None, # "nFeature_RNA > 200 & percent.mt < 5",
|
|
136
|
-
"gene_qc": {"min_cells":
|
|
279
|
+
"gene_qc": {"min_cells": 0, "excludes": []},
|
|
280
|
+
"qc_plots": {
|
|
281
|
+
"Violin Plots": {
|
|
282
|
+
"kind": "cell",
|
|
283
|
+
"plot_type": "violin",
|
|
284
|
+
"devpars": {"res": 100, "height": 600, "width": 1200},
|
|
285
|
+
},
|
|
286
|
+
"Scatter Plots": {
|
|
287
|
+
"kind": "cell",
|
|
288
|
+
"plot_type": "scatter",
|
|
289
|
+
"devpars": {"res": 100, "height": 800, "width": 1200},
|
|
290
|
+
},
|
|
291
|
+
"Ridge Plots": {
|
|
292
|
+
"kind": "cell",
|
|
293
|
+
"plot_type": "ridge",
|
|
294
|
+
"devpars": {"res": 100, "height": 800, "width": 1200},
|
|
295
|
+
},
|
|
296
|
+
"Distribution of number of cells a gene is expressed in": {
|
|
297
|
+
"kind": "gene",
|
|
298
|
+
"plot_type": "histogram",
|
|
299
|
+
"devpars": {"res": 100, "height": 1200, "width": 1200},
|
|
300
|
+
},
|
|
301
|
+
},
|
|
302
|
+
"use_sct": False,
|
|
303
|
+
"no_integration": False,
|
|
304
|
+
"NormalizeData": {},
|
|
305
|
+
"FindVariableFeatures": {},
|
|
306
|
+
"ScaleData": {},
|
|
307
|
+
"RunPCA": {},
|
|
308
|
+
"SCTransform": {
|
|
309
|
+
"return-only-var-genes": True,
|
|
310
|
+
"min_cells": 5,
|
|
311
|
+
"verbose": True,
|
|
312
|
+
},
|
|
313
|
+
"IntegrateLayers": {"method": "harmony"},
|
|
314
|
+
"doublet_detector": "none",
|
|
315
|
+
"DoubletFinder": {"PCs": 10, "pN": 0.25, "doublets": 0.075, "ncores": 1},
|
|
316
|
+
"scDblFinder": {"dbr": 0.075, "ncores": 1},
|
|
317
|
+
"cache": config.path.tmpdir,
|
|
137
318
|
}
|
|
138
319
|
script = "file://../scripts/scrna/SeuratPreparing.R"
|
|
139
320
|
plugin_opts = {
|
|
140
|
-
"report": "file://../reports/
|
|
321
|
+
"report": "file://../reports/common.svelte",
|
|
141
322
|
}
|
|
142
323
|
|
|
143
324
|
|
|
@@ -145,118 +326,45 @@ class SeuratClustering(Proc):
|
|
|
145
326
|
"""Determine the clusters of cells without reference using Seurat FindClusters
|
|
146
327
|
procedure.
|
|
147
328
|
|
|
148
|
-
To perform the clustering, you have two routes to choose from:
|
|
149
|
-
|
|
150
|
-
1. Performing integration on datasets normalized with `SCTransform`
|
|
151
|
-
- See: [https://satijalab.org/seurat/articles/integration_rpca.html#performing-integration-on-datasets-normalized-with-sctransform-1](https://satijalab.org/seurat/articles/integration_rpca.html#performing-integration-on-datasets-normalized-with-sctransform-1)
|
|
152
|
-
2. Fast integration using reciprocal PCA (`RPCA`)
|
|
153
|
-
- See: [https://satijalab.org/seurat/articles/integration_rpca.html](https://satijalab.org/seurat/articles/integration_rpca.html)
|
|
154
|
-
|
|
155
329
|
Input:
|
|
156
330
|
srtobj: The seurat object loaded by SeuratPreparing
|
|
157
331
|
|
|
158
332
|
Output:
|
|
159
|
-
|
|
333
|
+
outfile: The seurat object with cluster information at `seurat_clusters` or
|
|
334
|
+
the name specified by `envs.ident`
|
|
160
335
|
|
|
161
336
|
Envs:
|
|
162
337
|
ncores (type=int;order=-100): Number of cores to use.
|
|
163
338
|
Used in `future::plan(strategy = "multicore", workers = <ncores>)`
|
|
164
339
|
to parallelize some Seurat procedures.
|
|
165
340
|
See also: <https://satijalab.org/seurat/articles/future_vignette.html>
|
|
166
|
-
|
|
167
|
-
|
|
168
|
-
* [`SplitObject`](https://satijalab.org/seurat/reference/splitobject).
|
|
169
|
-
* [`SCTransform*`](https://satijalab.org/seurat/reference/sctransform).
|
|
170
|
-
* [`SelectIntegrationFeatures`](https://satijalab.org/seurat/reference/selectintegrationfeatures).
|
|
171
|
-
* [`PrepSCTIntegration`](https://satijalab.org/seurat/reference/prepsctintegration).
|
|
172
|
-
* [`RunPCA*`](https://satijalab.org/seurat/reference/runpca).
|
|
173
|
-
* [`FindIntegrationAnchors`](https://satijalab.org/seurat/reference/findintegrationanchors).
|
|
174
|
-
* [`IntegrateData`](https://satijalab.org/seurat/reference/integratedata).
|
|
175
|
-
* [`RunPCA`](https://satijalab.org/seurat/reference/runpca).
|
|
176
|
-
* [`RunUMAP`](https://satijalab.org/seurat/reference/runumap).
|
|
177
|
-
* [`FindNeighbors`](https://satijalab.org/seurat/reference/findneighbors).
|
|
178
|
-
* [`FindClusters`](https://satijalab.org/seurat/reference/findclusters).
|
|
179
|
-
* `*`: On each sample
|
|
180
|
-
See <https://satijalab.org/seurat/articles/integration_rpca.html#performing-integration-on-datasets-normalized-with-sctransform-1>.
|
|
181
|
-
If `False`, fast integration will be performed, using reciprocal PCA (RPCA) and
|
|
182
|
-
following procedures will be performed in the order:
|
|
183
|
-
* [`SplitObject`](https://satijalab.org/seurat/reference/splitobject).
|
|
184
|
-
* [`NormalizeData*`](https://satijalab.org/seurat/reference/normalizedata).
|
|
185
|
-
* [`FindVariableFeatures*`](https://satijalab.org/seurat/reference/findvariablefeatures).
|
|
186
|
-
* [`SelectIntegrationFeatures`](https://satijalab.org/seurat/reference/selectintegrationfeatures).
|
|
187
|
-
* [`ScaleData*`](https://satijalab.org/seurat/reference/scaledata).
|
|
188
|
-
* [`RunPCA*`](https://satijalab.org/seurat/reference/runpca).
|
|
189
|
-
* [`FindIntegrationAnchors`](https://satijalab.org/seurat/reference/findintegrationanchors).
|
|
190
|
-
* [`IntegrateData`](https://satijalab.org/seurat/reference/integratedata).
|
|
191
|
-
* [`ScaleData`](https://satijalab.org/seurat/reference/scaledata).
|
|
192
|
-
* [`RunPCA`](https://satijalab.org/seurat/reference/runpca).
|
|
193
|
-
* [`RunUMAP`](https://satijalab.org/seurat/reference/runumap).
|
|
194
|
-
* [`FindNeighbors`](https://satijalab.org/seurat/reference/findneighbors).
|
|
195
|
-
* [`FindClusters`](https://satijalab.org/seurat/reference/findclusters).
|
|
196
|
-
* `*`: On each sample.
|
|
197
|
-
See <https://satijalab.org/seurat/articles/integration_rpca.html>.
|
|
198
|
-
SCTransform (ns): Arguments for [`SCTransform()`](https://satijalab.org/seurat/reference/sctransform).
|
|
199
|
-
`object` is specified internally, and `-` in the key will be replaced with `.`.
|
|
200
|
-
- <more>: See <https://satijalab.org/seurat/reference/sctransform>.
|
|
201
|
-
SelectIntegrationFeatures (ns): Arguments for [`SelectIntegrationFeatures()`](https://satijalab.org/seurat/reference/selectintegrationfeatures).
|
|
202
|
-
`object.list` is specified internally, and `-` in the key will be replaced with `.`.
|
|
203
|
-
- nfeatures (type=int): The number of features to select
|
|
204
|
-
- <more>: See <https://satijalab.org/seurat/reference/selectintegrationfeatures>
|
|
205
|
-
PrepSCTIntegration (ns): Arguments for [`PrepSCTIntegration()`](https://satijalab.org/seurat/reference/prepsctintegration).
|
|
206
|
-
`object.list` and `anchor.features` is specified internally, and `-` in the key will be replaced with `.`.
|
|
207
|
-
- <more>: See <https://satijalab.org/seurat/reference/prepsctintegration>
|
|
208
|
-
NormalizeData (ns): Arguments for [`NormalizeData()`](https://satijalab.org/seurat/reference/normalizedata).
|
|
209
|
-
`object` is specified internally, and `-` in the key will be replaced with `.`.
|
|
210
|
-
- <more>: See <https://satijalab.org/seurat/reference/normalizedata>
|
|
211
|
-
FindVariableFeatures (ns): Arguments for [`FindVariableFeatures()`](https://satijalab.org/seurat/reference/findvariablefeatures).
|
|
212
|
-
`object` is specified internally, and `-` in the key will be replaced with `.`.
|
|
213
|
-
- <more>: See <https://satijalab.org/seurat/reference/findvariablefeatures>
|
|
214
|
-
FindIntegrationAnchors (ns): Arguments for [`FindIntegrationAnchors()`](https://satijalab.org/seurat/reference/findintegrationanchors).
|
|
215
|
-
`object.list` and `anchor.features` is specified internally, and `-` in the key will be replaced with `.`.
|
|
216
|
-
`dims=N` will be expanded to `dims=1:N`; The maximal value of `N` will be the minimum of `N` and the number of columns for each sample.
|
|
217
|
-
Sample names can also be specified in `reference` instead of indices only.
|
|
218
|
-
`reduction` defaults to `rpca`.
|
|
219
|
-
`normalization.method` defaults to `SCT` if `use_sct` is `True`.
|
|
220
|
-
**If you want to use reference-based integration, you can also set `reference` to a list of sample names, instead of a list of indices.**
|
|
221
|
-
- <more>: See <https://satijalab.org/seurat/reference/findintegrationanchors>
|
|
222
|
-
IntegrateData (ns): Arguments for [`IntegrateData()`](https://satijalab.org/seurat/reference/integratedata).
|
|
223
|
-
`anchorset` is specified internally, and `-` in the key will be replaced with `.`.
|
|
224
|
-
`dims=N` will be expanded to `dims=1:N`; The maximal value of `N` will be the minimum of `N` and the number of columns for each sample.
|
|
225
|
-
`normalization.method` defaults to `SCT` if `use_sct` is `True`.
|
|
226
|
-
- <more>: See <https://satijalab.org/seurat/reference/integratedata>
|
|
227
|
-
ScaleData (ns): Arguments for [`ScaleData()`](https://satijalab.org/seurat/reference/scaledata).
|
|
228
|
-
`object` and `features` is specified internally, and `-` in the key will be replaced with `.`.
|
|
229
|
-
- verbose (flag): Whether to print the progress
|
|
230
|
-
- <more>: See <https://satijalab.org/seurat/reference/scaledata>
|
|
231
|
-
ScaleData1 (ns): Arguments for [`ScaleData()`](https://satijalab.org/seurat/reference/scaledata) that runs on each sample.
|
|
232
|
-
`object` and `features` is specified internally, and `-` in the key will be replaced with `.`.
|
|
233
|
-
- verbose (flag): Whether to print the progress
|
|
234
|
-
- <more>: See <https://satijalab.org/seurat/reference/scaledata>
|
|
235
|
-
RunPCA (ns): Arguments for [`RunPCA()`](https://satijalab.org/seurat/reference/runpca).
|
|
236
|
-
`object` and `features` is specified internally, and `-` in the key will be replaced with `.`.
|
|
237
|
-
- npcs (type=int): The number of PCs to compute.
|
|
238
|
-
For each sample, `npcs` will be no larger than the number of columns - 1.
|
|
239
|
-
- verbose (flag): Whether to print the progress
|
|
240
|
-
- <more>: See <https://satijalab.org/seurat/reference/runpca>
|
|
241
|
-
RunPCA1 (ns): Arguments for [`RunPCA()`](https://satijalab.org/seurat/reference/runpca) on each sample.
|
|
242
|
-
`object` and `features` is specified internally, and `-` in the key will be replaced with `.`.
|
|
243
|
-
- npcs (type=int): The number of PCs to compute.
|
|
244
|
-
For each sample, `npcs` will be no larger than the number of columns - 1.
|
|
245
|
-
- verbose (flag): Whether to print the progress
|
|
246
|
-
- <more>: See <https://satijalab.org/seurat/reference/runpca>
|
|
341
|
+
ident: The name in the metadata to save the cluster labels.
|
|
342
|
+
A shortcut for `envs["FindClusters"]["cluster.name"]`.
|
|
247
343
|
RunUMAP (ns): Arguments for [`RunUMAP()`](https://satijalab.org/seurat/reference/runumap).
|
|
248
344
|
`object` is specified internally, and `-` in the key will be replaced with `.`.
|
|
249
345
|
`dims=N` will be expanded to `dims=1:N`; The maximal value of `N` will be the minimum of `N` and the number of columns - 1 for each sample.
|
|
250
346
|
- dims (type=int): The number of PCs to use
|
|
251
|
-
- reduction: The reduction to use for UMAP
|
|
347
|
+
- reduction: The reduction to use for UMAP.
|
|
348
|
+
If not provided, `sobj@misc$integrated_new_reduction` will be used.
|
|
252
349
|
- <more>: See <https://satijalab.org/seurat/reference/runumap>
|
|
350
|
+
RunPCA (ns): Arguments for [`RunPCA()`](https://satijalab.org/seurat/reference/runpca).
|
|
253
351
|
FindNeighbors (ns): Arguments for [`FindNeighbors()`](https://satijalab.org/seurat/reference/findneighbors).
|
|
254
352
|
`object` is specified internally, and `-` in the key will be replaced with `.`.
|
|
353
|
+
- reduction: The reduction to use.
|
|
354
|
+
If not provided, `sobj@misc$integrated_new_reduction` will be used.
|
|
255
355
|
- <more>: See <https://satijalab.org/seurat/reference/findneighbors>
|
|
256
356
|
FindClusters (ns): Arguments for [`FindClusters()`](https://satijalab.org/seurat/reference/findclusters).
|
|
257
357
|
`object` is specified internally, and `-` in the key will be replaced with `.`.
|
|
258
|
-
|
|
358
|
+
The cluster labels will be saved in cluster names and prefixed with "c".
|
|
359
|
+
The first cluster will be "c1", instead of "c0".
|
|
360
|
+
- resolution (type=auto): The resolution of the clustering. You can have multiple resolutions as a list or as a string separated by comma.
|
|
361
|
+
Ranges are also supported, for example: `0.1:0.5:0.1` will generate `0.1, 0.2, 0.3, 0.4, 0.5`. The step can be omitted, defaulting to 0.1.
|
|
362
|
+
The results will be saved in `<ident>_<resolution>`.
|
|
363
|
+
The final resolution will be used to define the clusters at `<ident>`.
|
|
259
364
|
- <more>: See <https://satijalab.org/seurat/reference/findclusters>
|
|
365
|
+
cache (type=auto): Where to cache the information at different steps.
|
|
366
|
+
If `True`, the seurat object will be cached in the job output directory, which will be not cleaned up when job is rerunning.
|
|
367
|
+
Set to `False` to not cache the results.
|
|
260
368
|
|
|
261
369
|
Requires:
|
|
262
370
|
r-seurat:
|
|
@@ -266,30 +374,103 @@ class SeuratClustering(Proc):
|
|
|
266
374
|
r-dplyr:
|
|
267
375
|
- check: {{proc.lang}} <(echo "library(dplyr)")
|
|
268
376
|
""" # noqa: E501
|
|
377
|
+
|
|
269
378
|
input = "srtobj:file"
|
|
270
|
-
output = "
|
|
379
|
+
output = "outfile:file:{{in.srtobj | stem}}.qs"
|
|
271
380
|
lang = config.lang.rscript
|
|
272
381
|
envs = {
|
|
273
382
|
"ncores": config.misc.ncores,
|
|
274
|
-
"
|
|
275
|
-
"
|
|
276
|
-
"
|
|
277
|
-
"PrepSCTIntegration": {},
|
|
278
|
-
"NormalizeData": {},
|
|
279
|
-
"FindVariableFeatures": {},
|
|
280
|
-
"FindIntegrationAnchors": {},
|
|
281
|
-
"IntegrateData": {},
|
|
282
|
-
"ScaleData": {"verbose": False},
|
|
283
|
-
"ScaleData1": {"verbose": False},
|
|
284
|
-
"RunPCA": {"verbose": False},
|
|
285
|
-
"RunPCA1": {"verbose": False},
|
|
286
|
-
"RunUMAP": {"reduction": "pca", "dims": 30},
|
|
383
|
+
"ident": "seurat_clusters",
|
|
384
|
+
"RunPCA": {},
|
|
385
|
+
"RunUMAP": {},
|
|
287
386
|
"FindNeighbors": {},
|
|
288
387
|
"FindClusters": {"resolution": 0.8},
|
|
388
|
+
"cache": config.path.tmpdir,
|
|
289
389
|
}
|
|
290
390
|
script = "file://../scripts/scrna/SeuratClustering.R"
|
|
291
391
|
|
|
292
392
|
|
|
393
|
+
class SeuratSubClustering(Proc):
|
|
394
|
+
"""Find clusters of a subset of cells.
|
|
395
|
+
|
|
396
|
+
It's unlike [`Seurat::FindSubCluster`], which only finds subclusters of a single
|
|
397
|
+
cluster. Instead, it will perform the whole clustering procedure on the subset of
|
|
398
|
+
cells. One can use metadata to specify the subset of cells to perform clustering on.
|
|
399
|
+
|
|
400
|
+
For the subset of cells, the reductions will be re-performed on the subset of cells,
|
|
401
|
+
and then the clustering will be performed on the subset of cells. The reduction
|
|
402
|
+
will be saved in `object@reduction$<casename>.<reduction>` of the original object and the
|
|
403
|
+
clustering will be saved in the metadata of the original object using the casename
|
|
404
|
+
as the column name.
|
|
405
|
+
|
|
406
|
+
Input:
|
|
407
|
+
srtobj: The seurat object in RDS or qs/qs2 format.
|
|
408
|
+
|
|
409
|
+
Output:
|
|
410
|
+
outfile: The seurat object with the subclustering information in qs/qs2 format.
|
|
411
|
+
|
|
412
|
+
Envs:
|
|
413
|
+
ncores (type=int;order=-100): Number of cores to use.
|
|
414
|
+
Used in `future::plan(strategy = "multicore", workers = <ncores>)`
|
|
415
|
+
to parallelize some Seurat procedures.
|
|
416
|
+
mutaters (type=json): The mutaters to mutate the metadata to subset the cells.
|
|
417
|
+
The mutaters will be applied in the order specified.
|
|
418
|
+
subset: An expression to subset the cells, will be passed to
|
|
419
|
+
[`tidyseurat::filter()`](https://stemangiola.github.io/tidyseurat/reference/filter.html).
|
|
420
|
+
RunPCA (ns): Arguments for [`RunPCA()`](https://satijalab.org/seurat/reference/runpca).
|
|
421
|
+
`object` is specified internally as the subset object, and `-` in the key will be replaced with `.`.
|
|
422
|
+
- <more>: See <https://satijalab.org/seurat/reference/runpca>
|
|
423
|
+
RunUMAP (ns): Arguments for [`RunUMAP()`](https://satijalab.org/seurat/reference/runumap).
|
|
424
|
+
`object` is specified internally as the subset object, and `-` in the key will be replaced with `.`.
|
|
425
|
+
`dims=N` will be expanded to `dims=1:N`; The maximal value of `N` will be the minimum of `N` and the number of columns - 1 for each sample.
|
|
426
|
+
- dims (type=int): The number of PCs to use
|
|
427
|
+
- reduction: The reduction to use for UMAP.
|
|
428
|
+
If not provided, `sobj@misc$integrated_new_reduction` will be used.
|
|
429
|
+
- <more>: See <https://satijalab.org/seurat/reference/runumap>
|
|
430
|
+
FindNeighbors (ns): Arguments for [`FindNeighbors()`](https://satijalab.org/seurat/reference/findneighbors).
|
|
431
|
+
`object` is specified internally, and `-` in the key will be replaced with `.`.
|
|
432
|
+
- reduction: The reduction to use.
|
|
433
|
+
If not provided, `object@misc$integrated_new_reduction` will be used.
|
|
434
|
+
- <more>: See <https://satijalab.org/seurat/reference/findneighbors>
|
|
435
|
+
FindClusters (ns): Arguments for [`FindClusters()`](https://satijalab.org/seurat/reference/findclusters).
|
|
436
|
+
`object` is specified internally, and `-` in the key will be replaced with `.`.
|
|
437
|
+
The cluster labels will be prefixed with "s". The first cluster will be "s1", instead of "s0".
|
|
438
|
+
- resolution (type=auto): The resolution of the clustering. You can have multiple resolutions as a list or as a string separated by comma.
|
|
439
|
+
Ranges are also supported, for example: `0.1:0.5:0.1` will generate `0.1, 0.2, 0.3, 0.4, 0.5`. The step can be omitted, defaulting to 0.1.
|
|
440
|
+
The results will be saved in `<casename>_<resolution>`.
|
|
441
|
+
The final resolution will be used to define the clusters at `<casename>`.
|
|
442
|
+
- <more>: See <https://satijalab.org/seurat/reference/findclusters>
|
|
443
|
+
cache (type=auto): Whether to cache the results.
|
|
444
|
+
If `True`, the seurat object will be cached in the job output directory, which will be not cleaned up when job is rerunning.
|
|
445
|
+
Set to `False` to not cache the results.
|
|
446
|
+
cases (type=json): The cases to perform subclustering.
|
|
447
|
+
Keys are the names of the cases and values are the dicts inherited from `envs` except `mutaters` and `cache`.
|
|
448
|
+
If empty, a case with name `subcluster` will be created with default parameters.
|
|
449
|
+
The case name will be passed to `biopipen.utils::SeuratSubCluster()` as `name`.
|
|
450
|
+
It will be used as the prefix for the reduction name, keys and cluster names.
|
|
451
|
+
For reduction keys, it will be `toupper(<name>)` + "PC_" and `toupper(<name>)` + "UMAP_".
|
|
452
|
+
For cluster names, it will be `<name>` + "." + resolution.
|
|
453
|
+
And the final cluster name will be `<name>`.
|
|
454
|
+
Note that the `name` should be alphanumeric and anything other than alphanumeric will be removed.
|
|
455
|
+
""" # noqa: E501
|
|
456
|
+
input = "srtobj:file"
|
|
457
|
+
output = "outfile:file:{{in.srtobj | stem}}.qs"
|
|
458
|
+
lang = config.lang.rscript
|
|
459
|
+
envs_depth = 1
|
|
460
|
+
envs = {
|
|
461
|
+
"ncores": config.misc.ncores,
|
|
462
|
+
"mutaters": {},
|
|
463
|
+
"subset": None,
|
|
464
|
+
"RunPCA": {},
|
|
465
|
+
"RunUMAP": {},
|
|
466
|
+
"FindNeighbors": {},
|
|
467
|
+
"FindClusters": {"resolution": 0.8},
|
|
468
|
+
"cache": config.path.tmpdir,
|
|
469
|
+
"cases": {},
|
|
470
|
+
}
|
|
471
|
+
script = "file://../scripts/scrna/SeuratSubClustering.R"
|
|
472
|
+
|
|
473
|
+
|
|
293
474
|
class SeuratClusterStats(Proc):
|
|
294
475
|
"""Statistics of the clustering.
|
|
295
476
|
|
|
@@ -298,126 +479,345 @@ class SeuratClusterStats(Proc):
|
|
|
298
479
|
TCR clones/clusters or other metadata for each T-cell cluster.
|
|
299
480
|
|
|
300
481
|
Examples:
|
|
301
|
-
###
|
|
482
|
+
### Clustree Plot
|
|
483
|
+
|
|
484
|
+
```toml
|
|
485
|
+
[SeuratClusterStats.envs.clustrees."Clustree Plot"]
|
|
486
|
+
prefix = "seurat_clusters"
|
|
487
|
+
devpars = {height = 500}
|
|
488
|
+
```
|
|
489
|
+
|
|
490
|
+
{: width="80%" }
|
|
491
|
+
|
|
492
|
+
### Number of cells in each cluster (Bar Chart)
|
|
493
|
+
|
|
494
|
+
```toml
|
|
495
|
+
[SeuratClusterStats.envs.stats."Number of cells in each cluster (Bar Chart)"]
|
|
496
|
+
plot_type = "bar"
|
|
497
|
+
x_text_angle = 90
|
|
498
|
+
```
|
|
499
|
+
|
|
500
|
+
{: width="80%" }
|
|
501
|
+
|
|
502
|
+
### Number of cells in each cluster by Sample (Bar Chart)
|
|
503
|
+
|
|
504
|
+
```toml
|
|
505
|
+
[SeuratClusterStats.envs.stats."Number of cells in each cluster by Sample (Bar Chart)"]
|
|
506
|
+
plot_type = "bar"
|
|
507
|
+
group_by = "Sample"
|
|
508
|
+
x_text_angle = 90
|
|
509
|
+
```
|
|
510
|
+
|
|
511
|
+
{: width="80%" }
|
|
512
|
+
|
|
513
|
+
### Number of cells in each cluster by Diagnosis
|
|
514
|
+
|
|
515
|
+
```toml
|
|
516
|
+
[SeuratClusterStats.envs.stats."Number of cells in each cluster by Diagnosis"]
|
|
517
|
+
plot_type = "bar"
|
|
518
|
+
group_by = "Diagnosis"
|
|
519
|
+
frac = "group"
|
|
520
|
+
x_text_angle = 90
|
|
521
|
+
swap = true
|
|
522
|
+
position = "stack"
|
|
523
|
+
```
|
|
524
|
+
|
|
525
|
+
{: width="80%" }
|
|
526
|
+
|
|
527
|
+
### Number of cells in each cluster by Diagnosis (Circos Plot)
|
|
528
|
+
|
|
529
|
+
```toml
|
|
530
|
+
[SeuratClusterStats.envs.stats."Number of cells in each cluster by Diagnosis (Circos Plot)"]
|
|
531
|
+
plot_type = "circos"
|
|
532
|
+
group_by = "Diagnosis"
|
|
533
|
+
```
|
|
534
|
+
|
|
535
|
+
{: width="80%" }
|
|
536
|
+
|
|
537
|
+
### Number of cells in each cluster by Diagnosis (Sankey Plot)
|
|
538
|
+
|
|
539
|
+
```toml
|
|
540
|
+
[SeuratClusterStats.envs.stats."Number of cells in each cluster by Diagnosis (Sankey Plot)"]
|
|
541
|
+
plot_type = "sankey"
|
|
542
|
+
group_by = ["seurat_clusters", "Diagnosis"]
|
|
543
|
+
links_alpha = 0.6
|
|
544
|
+
devpars = {width = 800}
|
|
545
|
+
```
|
|
546
|
+
|
|
547
|
+
{: width="80%" }
|
|
548
|
+
|
|
549
|
+
### Number of cells in each cluster by Sample (Spider Plot)
|
|
550
|
+
|
|
551
|
+
```toml
|
|
552
|
+
[SeuratClusterStats.envs.stats."Number of cells in each cluster by Sample (Spider Plot)"]
|
|
553
|
+
plot_type = "spider"
|
|
554
|
+
group_by = "Diagnosis"
|
|
555
|
+
palette = "Set1"
|
|
556
|
+
```
|
|
557
|
+
|
|
558
|
+
{: width="80%" }
|
|
559
|
+
|
|
560
|
+
### Number of genes detected in each cluster
|
|
561
|
+
|
|
562
|
+
```toml
|
|
563
|
+
[SeuratClusterStats.envs.ngenes."Number of genes detected in each cluster"]
|
|
564
|
+
plot_type = "violin"
|
|
565
|
+
add_box = true
|
|
566
|
+
add_point = true
|
|
567
|
+
```
|
|
568
|
+
|
|
569
|
+
{: width="80%" }
|
|
570
|
+
|
|
571
|
+
### Feature Expression in Clusters (Violin Plots)
|
|
572
|
+
|
|
573
|
+
```toml
|
|
574
|
+
[SeuratClusterStats.envs.features_defaults]
|
|
575
|
+
features = ["CD3D", "CD4", "CD8A", "MS4A1", "CD14", "LYZ", "FCGR3A", "NCAM1", "KLRD1"]
|
|
576
|
+
|
|
577
|
+
[SeuratClusterStats.envs.features."Feature Expression in Clusters (Violin Plots)"]
|
|
578
|
+
plot_type = "violin"
|
|
579
|
+
ident = "seurat_clusters"
|
|
580
|
+
```
|
|
581
|
+
|
|
582
|
+
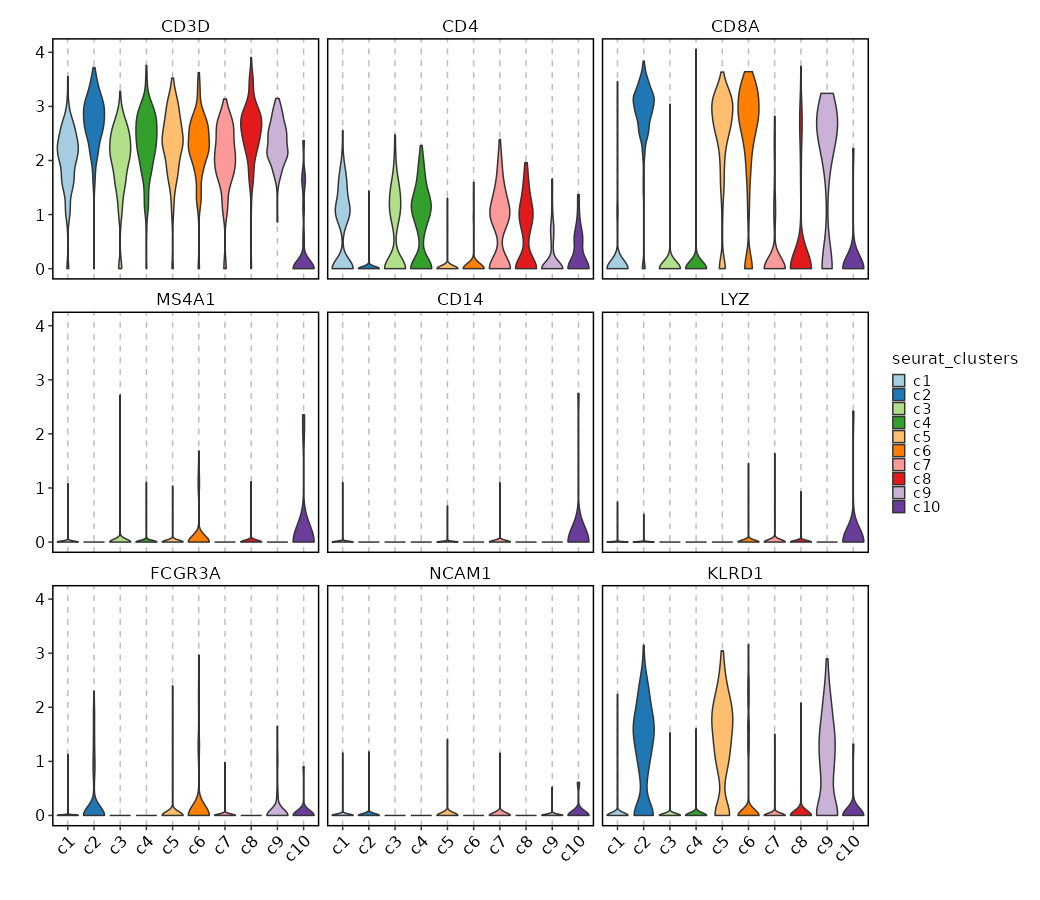{: width="80%" }
|
|
583
|
+
|
|
584
|
+
### Feature Expression in Clusters (Ridge Plots)
|
|
585
|
+
|
|
586
|
+
```toml
|
|
587
|
+
# Using the same features as above
|
|
588
|
+
[SeuratClusterStats.envs.features."Feature Expression in Clusters (Ridge Plots)"]
|
|
589
|
+
plot_type = "ridge"
|
|
590
|
+
ident = "seurat_clusters"
|
|
591
|
+
flip = true
|
|
592
|
+
```
|
|
593
|
+
|
|
594
|
+
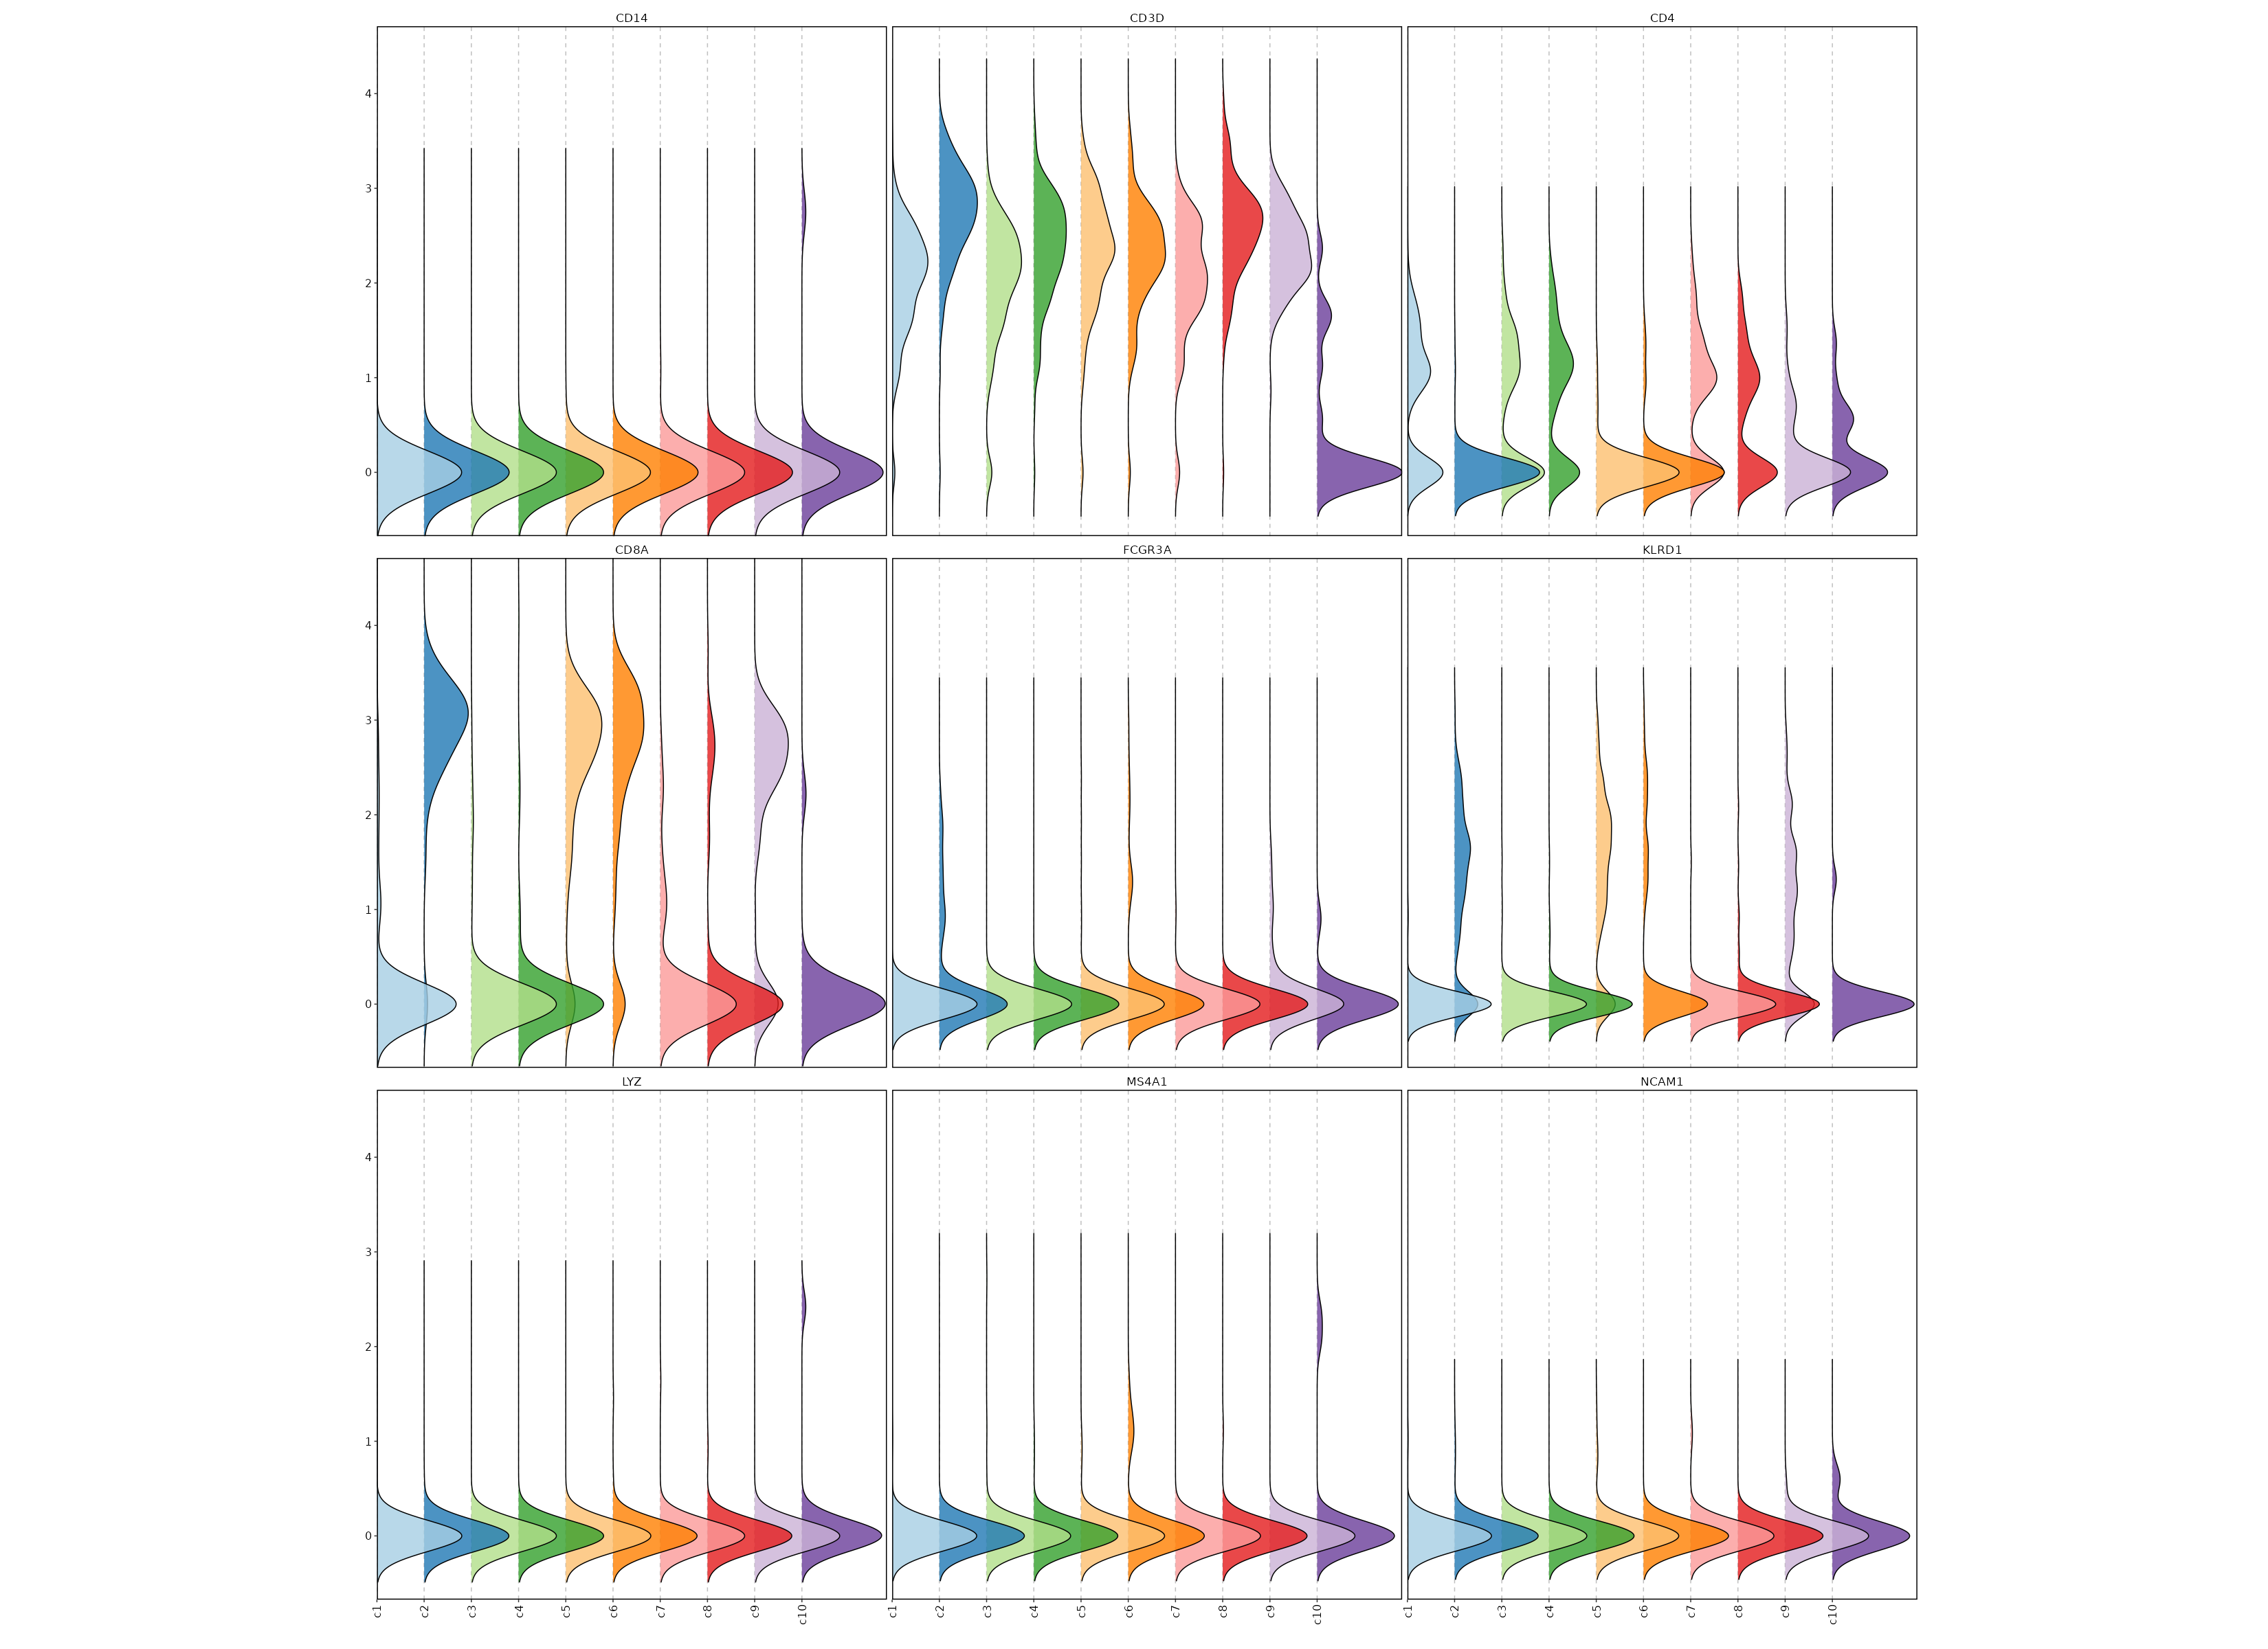{: width="80%" }
|
|
595
|
+
|
|
596
|
+
### Feature Expression in Clusters by Diagnosis
|
|
597
|
+
|
|
598
|
+
```toml
|
|
599
|
+
# Using the same features as above
|
|
600
|
+
[SeuratClusterStats.envs.features."Feature Expression in Clusters by Diagnosis"]
|
|
601
|
+
plot_type = "violin"
|
|
602
|
+
group_by = "Diagnosis"
|
|
603
|
+
ident = "seurat_clusters"
|
|
604
|
+
comparisons = true
|
|
605
|
+
sig_label = "p.signif"
|
|
606
|
+
```
|
|
607
|
+
|
|
608
|
+
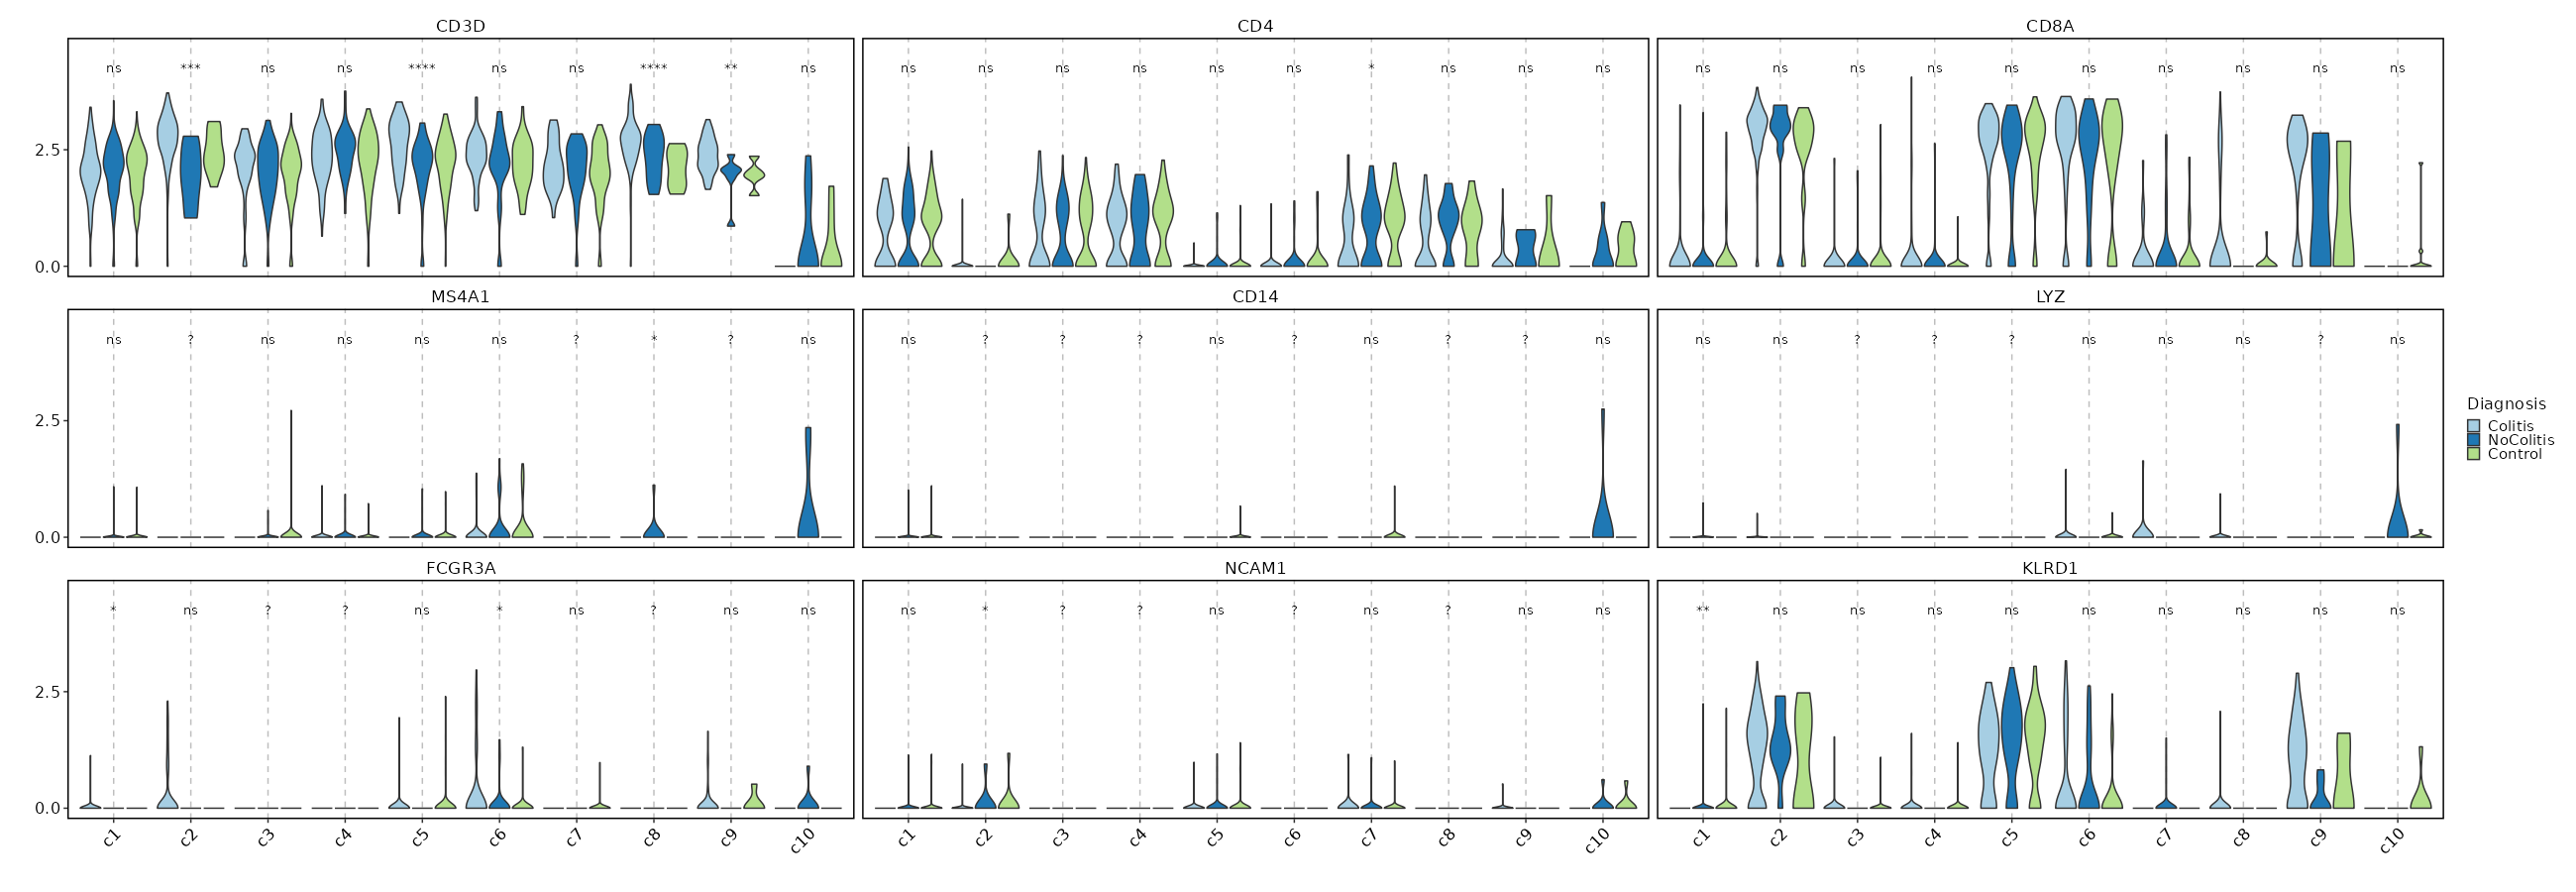{: width="80%" }
|
|
609
|
+
|
|
610
|
+
### Feature Expression in Clusters (stacked)
|
|
611
|
+
|
|
612
|
+
```toml
|
|
613
|
+
# Using the same features as above
|
|
614
|
+
[SeuratClusterStats.envs.features."Feature Expression in Clusters (stacked)"]
|
|
615
|
+
plot_type = "violin"
|
|
616
|
+
ident = "seurat_clusters"
|
|
617
|
+
add_bg = true
|
|
618
|
+
stack = true
|
|
619
|
+
add_box = true
|
|
620
|
+
```
|
|
621
|
+
|
|
622
|
+
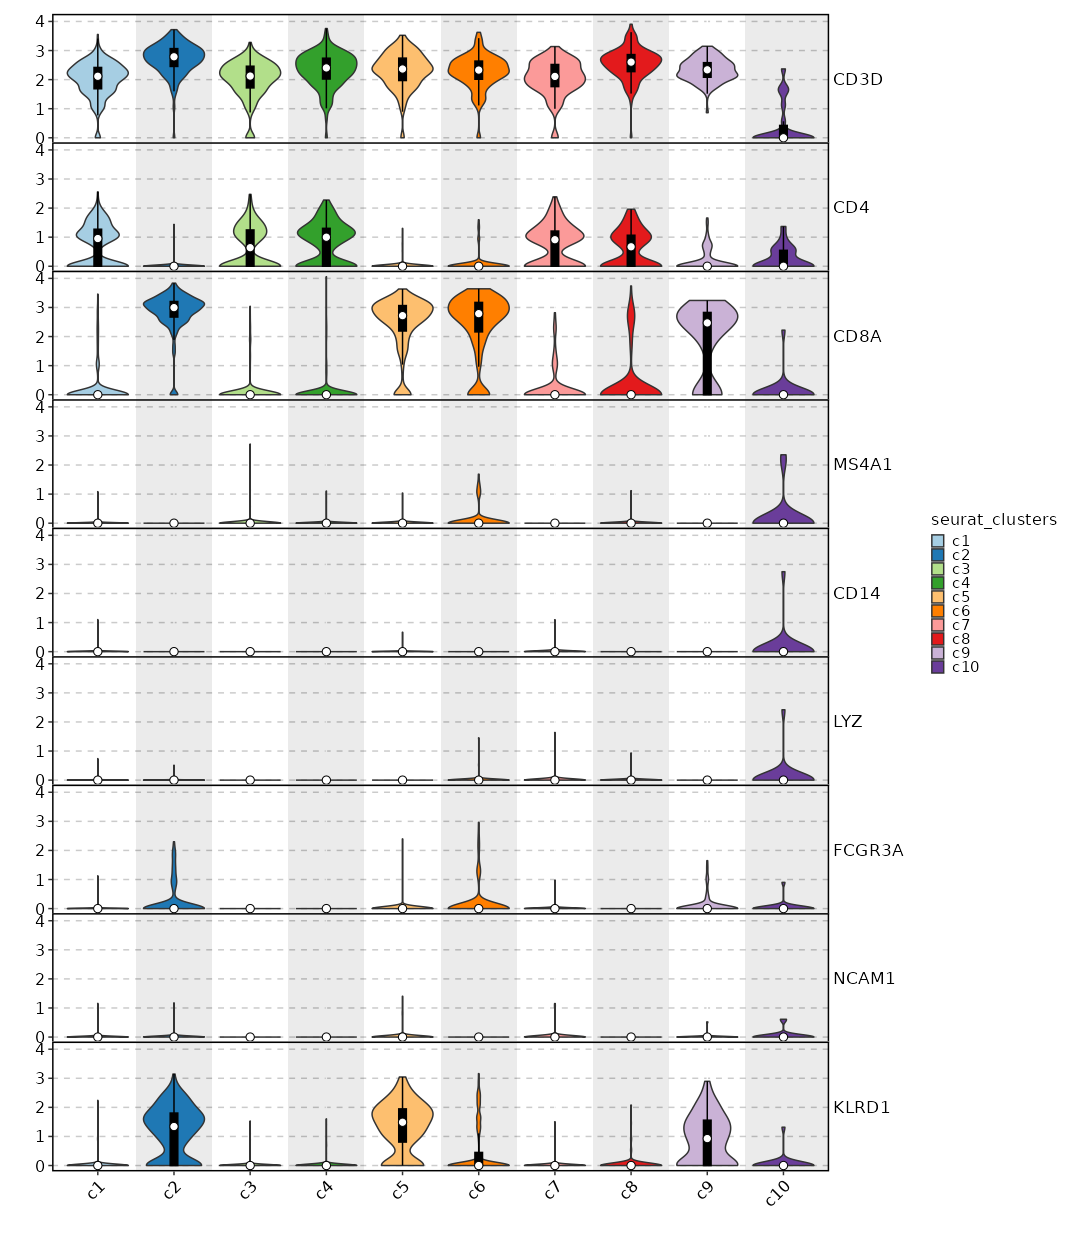{: width="80%" }
|
|
623
|
+
|
|
624
|
+
### CD4 Expression on UMAP
|
|
302
625
|
|
|
303
626
|
```toml
|
|
304
|
-
[SeuratClusterStats.envs.
|
|
305
|
-
|
|
306
|
-
|
|
307
|
-
|
|
627
|
+
[SeuratClusterStats.envs.features."CD4 Expression on UMAP"]
|
|
628
|
+
plot_type = "dim"
|
|
629
|
+
feature = "CD4"
|
|
630
|
+
highlight = "seurat_clusters == 'c1'"
|
|
308
631
|
```
|
|
309
632
|
|
|
310
|
-
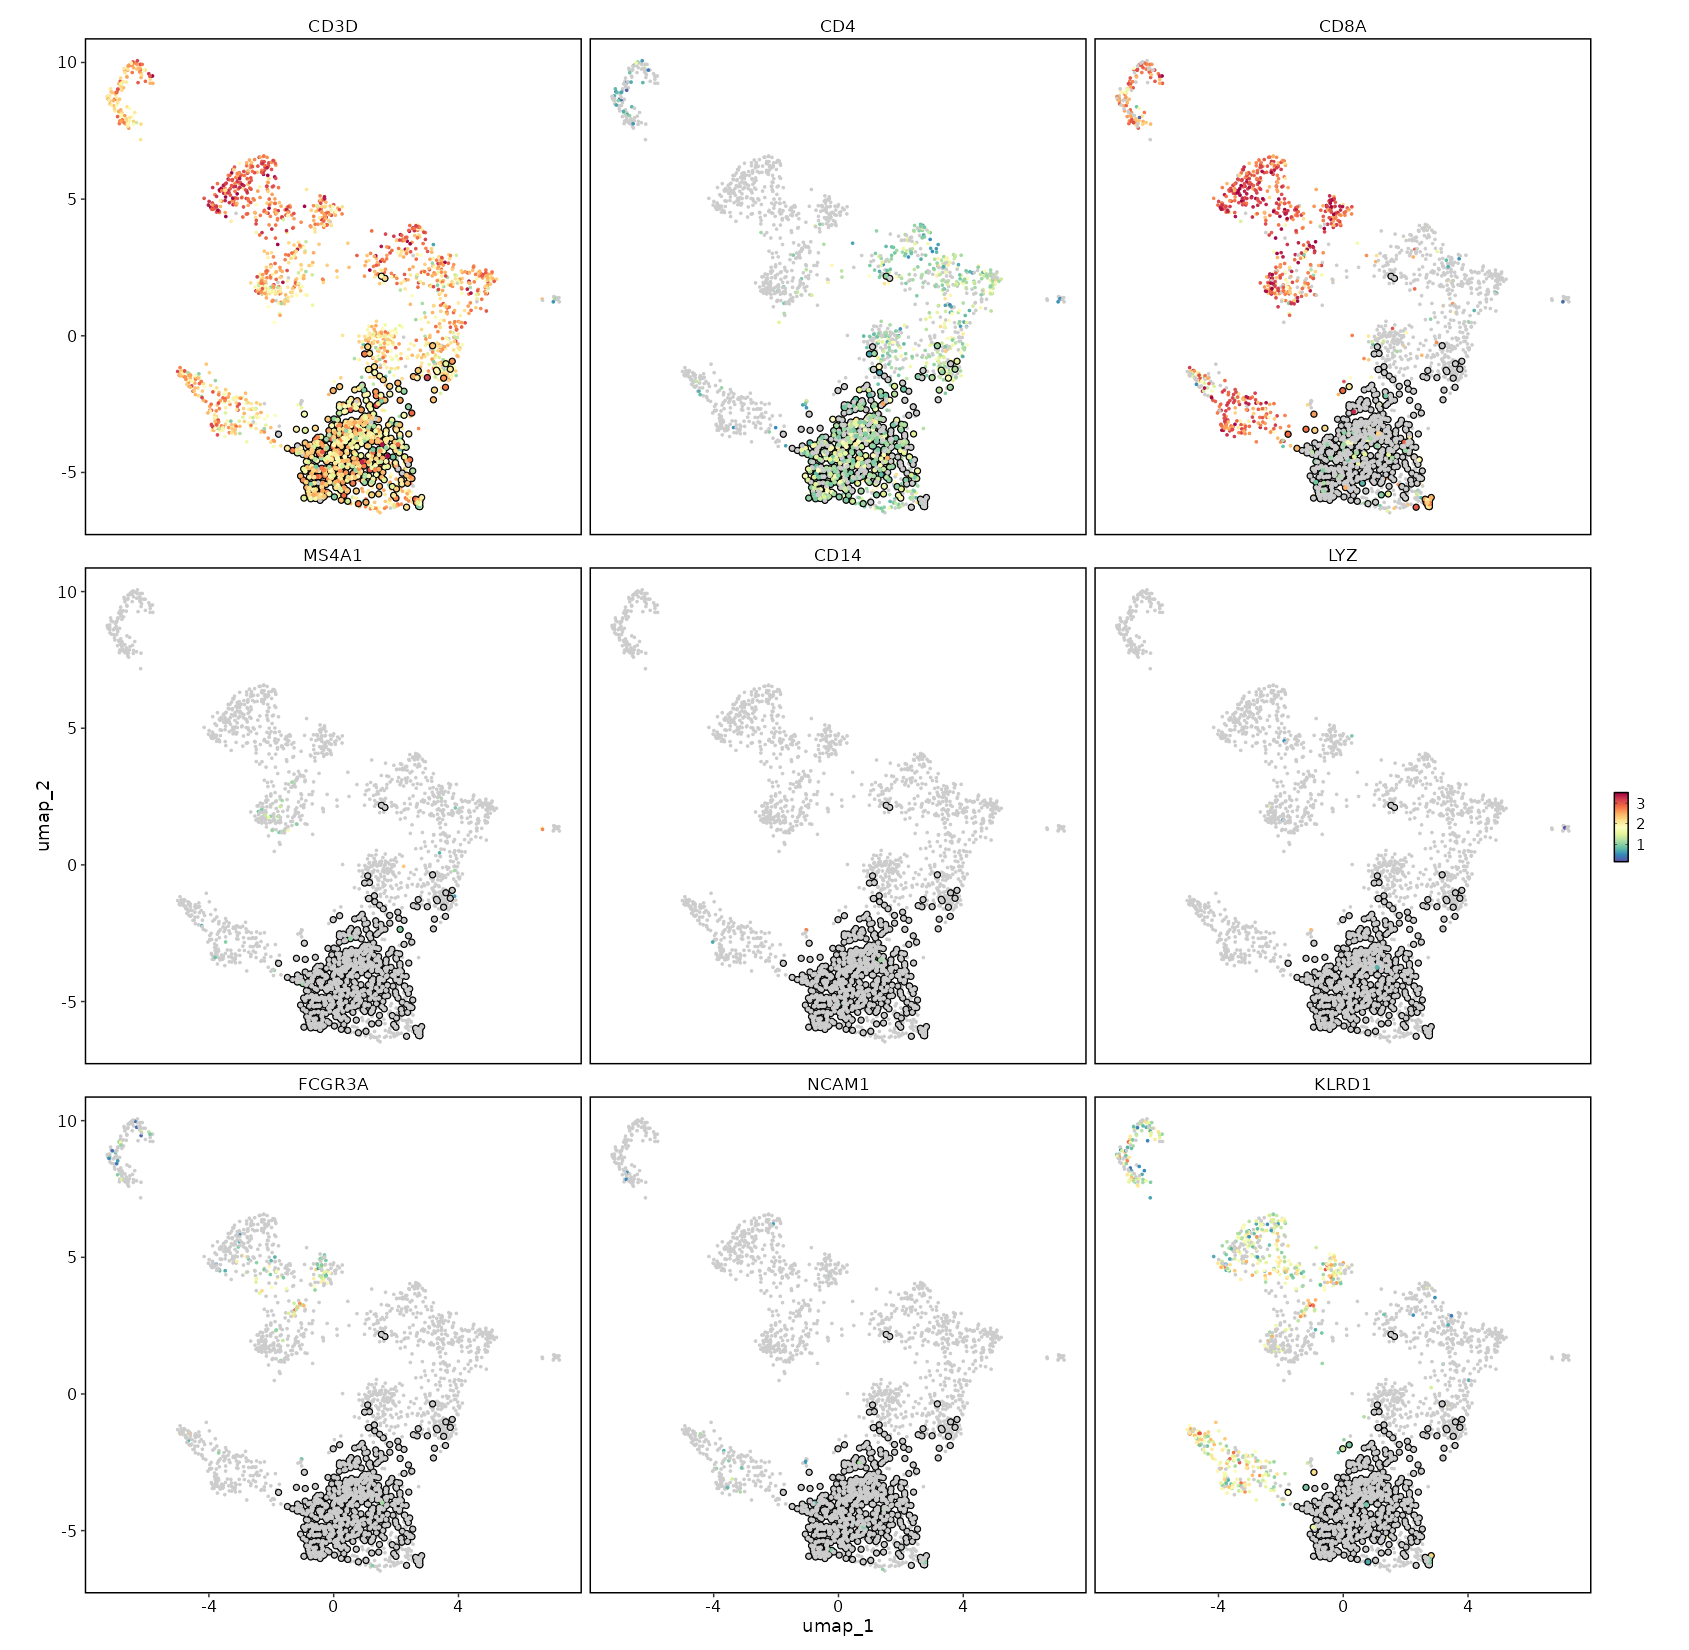{: width="80%" }
|
|
311
634
|
|
|
312
|
-
###
|
|
635
|
+
### Feature Expression in Clusters by Diagnosis (Heatmap)
|
|
313
636
|
|
|
314
637
|
```toml
|
|
315
|
-
[SeuratClusterStats.envs.
|
|
316
|
-
|
|
638
|
+
[SeuratClusterStats.envs.features."Feature Expression in Clusters by Diagnosis (Heatmap)"]
|
|
639
|
+
# Grouped features
|
|
640
|
+
features = {"T cell markers" = ["CD3D", "CD4", "CD8A"], "B cell markers" = ["MS4A1"], "Monocyte markers" = ["CD14", "LYZ", "FCGR3A"], "NK cell markers" = ["NCAM1", "KLRD1"]}
|
|
641
|
+
plot_type = "heatmap"
|
|
642
|
+
ident = "Diagnosis"
|
|
643
|
+
columns_split_by = "seurat_clusters"
|
|
644
|
+
name = "Expression"
|
|
645
|
+
devpars = {height = 560}
|
|
317
646
|
```
|
|
318
647
|
|
|
319
|
-
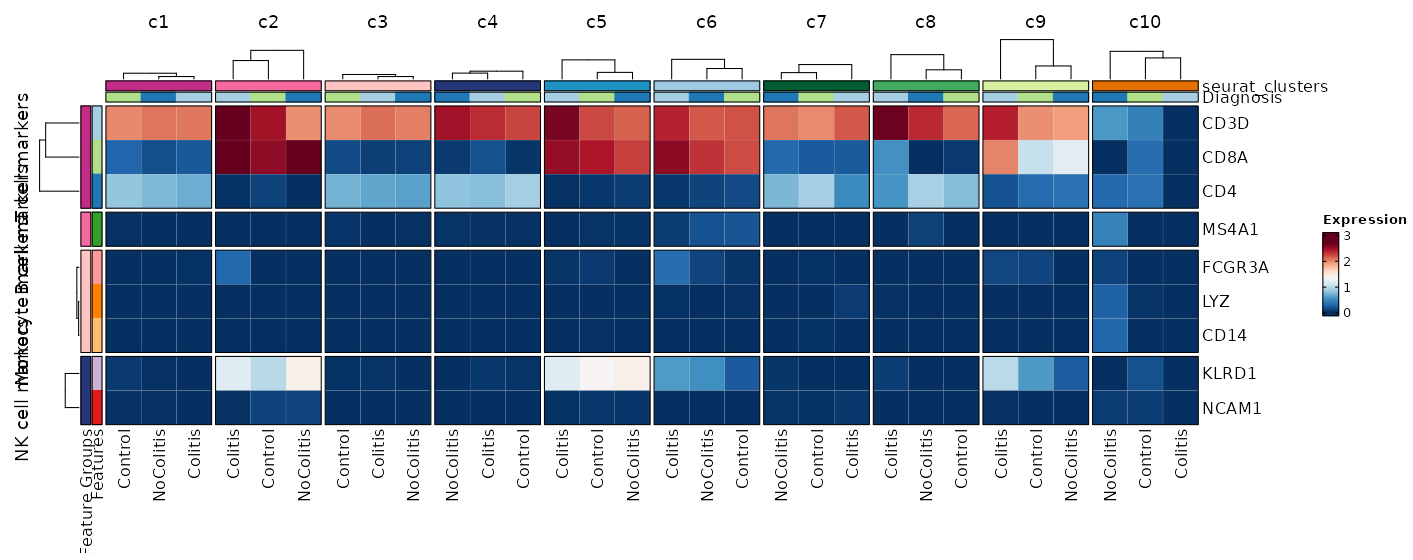{: width="80%" }
|
|
320
649
|
|
|
321
|
-
###
|
|
650
|
+
### Feature Expression in Clusters by Diagnosis (Heatmap with annotations)
|
|
322
651
|
|
|
323
652
|
```toml
|
|
324
|
-
|
|
325
|
-
features
|
|
326
|
-
|
|
327
|
-
|
|
328
|
-
|
|
329
|
-
|
|
653
|
+
# Using the default features
|
|
654
|
+
[SeuratClusterStats.envs.features."Feature Expression in Clusters by Diagnosis (Heatmap with annotations)"]
|
|
655
|
+
ident = "seurat_clusters"
|
|
656
|
+
cell_type = "dot"
|
|
657
|
+
plot_type = "heatmap"
|
|
658
|
+
name = "Expression Level"
|
|
659
|
+
dot_size = "nanmean"
|
|
660
|
+
dot_size_name = "Percent Expressed"
|
|
661
|
+
add_bg = true
|
|
662
|
+
rows_split_by = "Diagnosis"
|
|
663
|
+
cluster_rows = false
|
|
664
|
+
flip = true
|
|
665
|
+
palette = "YlOrRd"
|
|
666
|
+
column_annotation = ["percent.mt", "VDJ_Presence"]
|
|
667
|
+
column_annotation_type = {"percent.mt" = "violin", VDJ_Presence = "pie"}
|
|
668
|
+
column_annotation_params = {"percent.mt" = {show_legend = false}}
|
|
669
|
+
devpars = {width = 1400, height = 900}
|
|
330
670
|
```
|
|
331
671
|
|
|
332
|
-
{: width="80%" }
|
|
672
|
+
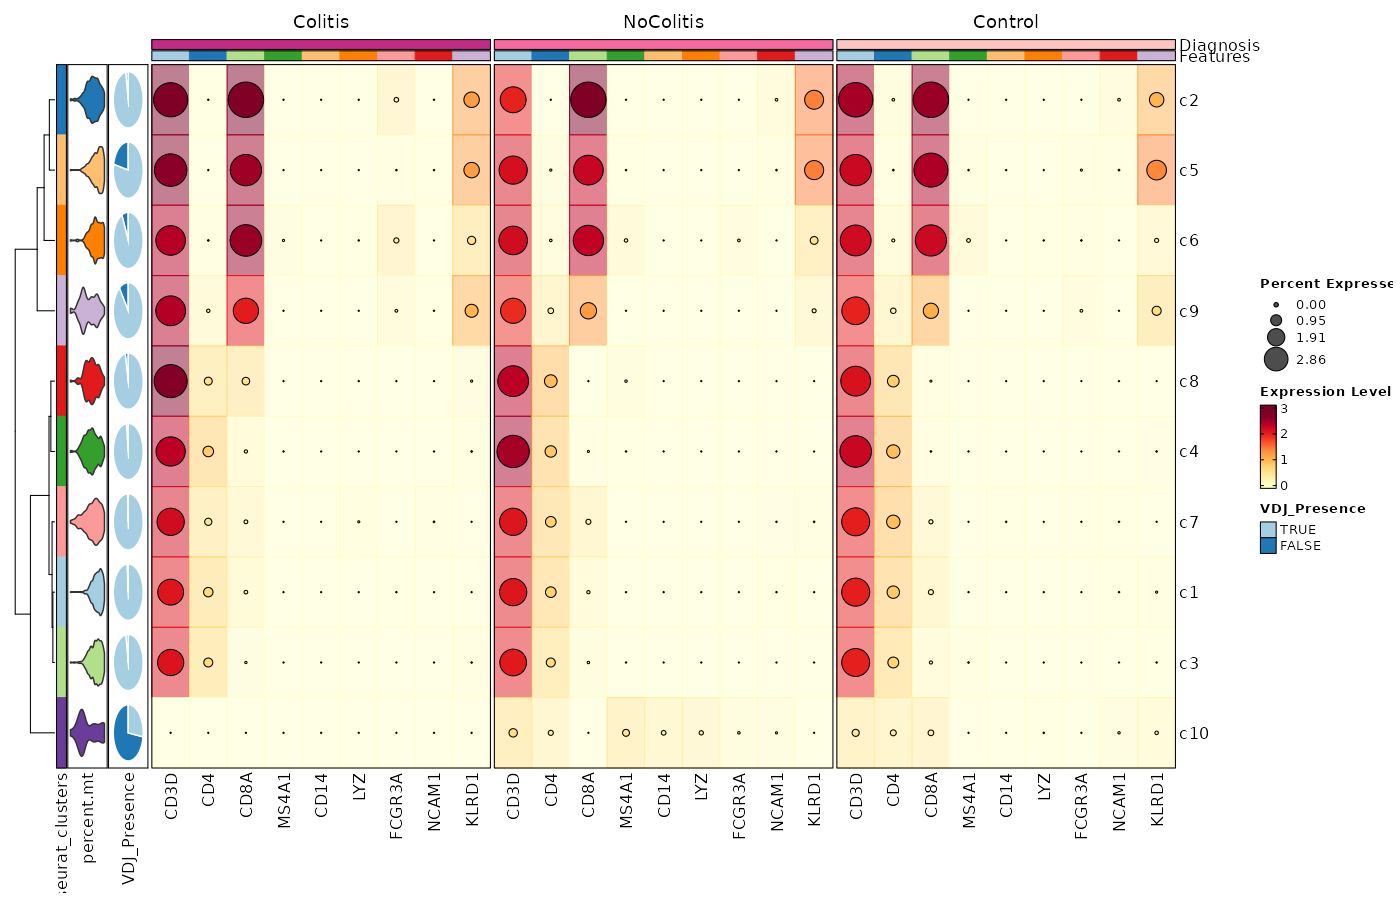{: width="80%" }
|
|
334
673
|
|
|
335
|
-
###
|
|
674
|
+
### Dimensional reduction plot
|
|
336
675
|
|
|
337
676
|
```toml
|
|
338
|
-
[SeuratClusterStats.envs.
|
|
677
|
+
[SeuratClusterStats.envs.features."Dimensional reduction plot"]
|
|
339
678
|
label = true
|
|
340
|
-
label-box = true
|
|
341
|
-
repel = true
|
|
342
679
|
```
|
|
343
680
|
|
|
344
|
-
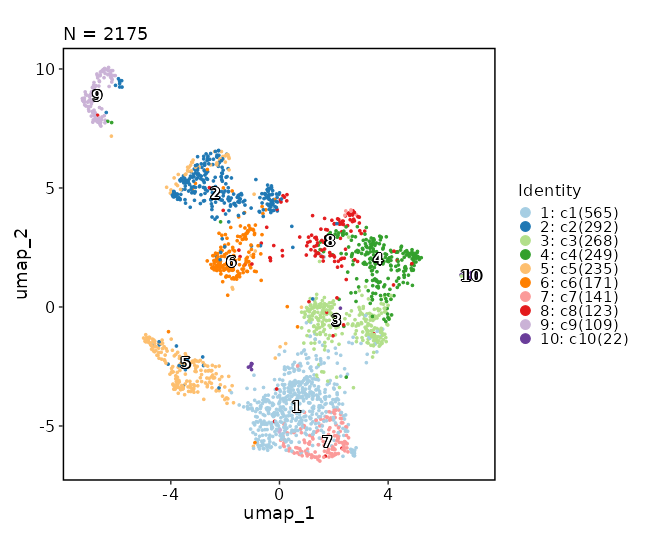{: width="80%" }
|
|
682
|
+
|
|
683
|
+
### Dimensional reduction plot (with marks)
|
|
684
|
+
|
|
685
|
+
```toml
|
|
686
|
+
[SeuratClusterStats.envs.dimplots."Dimensional reduction plot (with marks)"]
|
|
687
|
+
add_mark = true
|
|
688
|
+
mark_linetype = 2
|
|
689
|
+
```
|
|
690
|
+
|
|
691
|
+
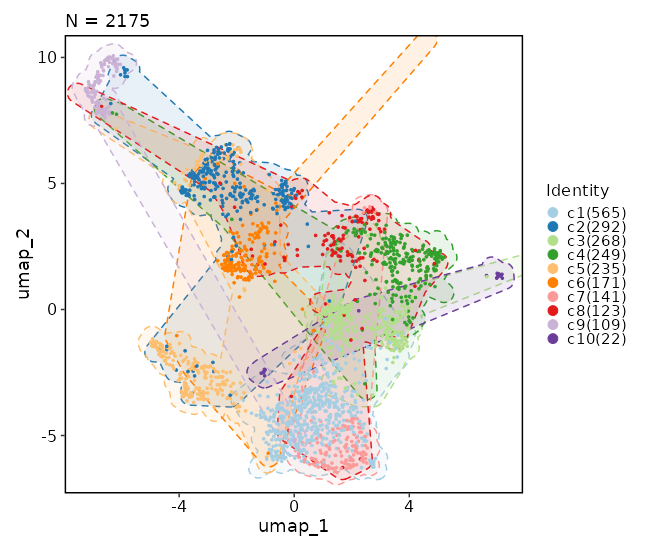{: width="80%" }
|
|
692
|
+
|
|
693
|
+
### Dimensional reduction plot (with hex bins)
|
|
694
|
+
|
|
695
|
+
```toml
|
|
696
|
+
[SeuratClusterStats.envs.dimplots."Dimensional reduction plot (with hex bins)"]
|
|
697
|
+
hex = true
|
|
698
|
+
hex_bins = 50
|
|
699
|
+
```
|
|
700
|
+
|
|
701
|
+
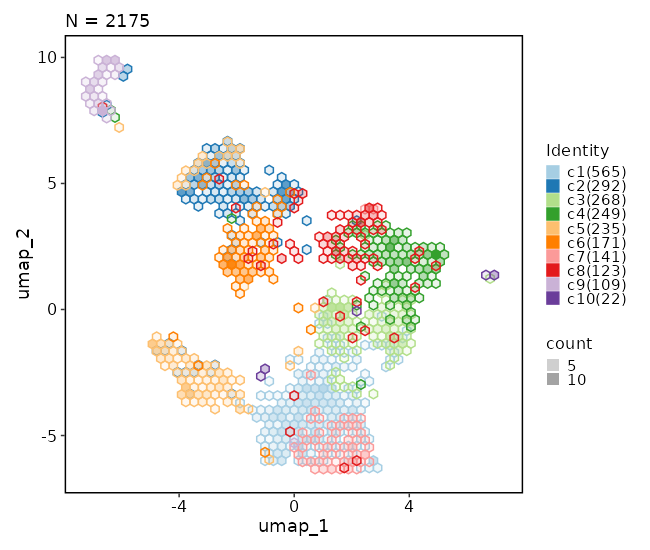{: width="80%" }
|
|
702
|
+
|
|
703
|
+
### Dimensional reduction plot (with Diagnosis stats)
|
|
704
|
+
|
|
705
|
+
```toml
|
|
706
|
+
[SeuratClusterStats.envs.dimplots."Dimensional reduction plot (with Diagnosis stats)"]
|
|
707
|
+
stat_by = "Diagnosis"
|
|
708
|
+
stat_plot_type = "ring"
|
|
709
|
+
stat_plot_size = 0.15
|
|
710
|
+
```
|
|
711
|
+
|
|
712
|
+
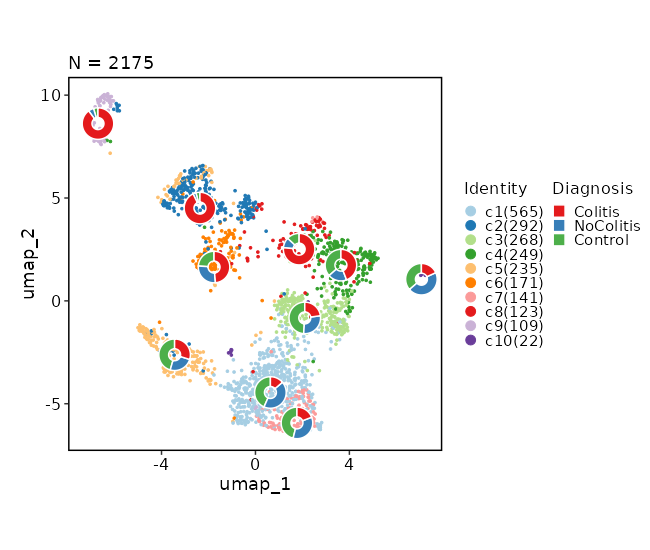{: width="80%" }
|
|
713
|
+
|
|
714
|
+
### Dimensional reduction plot by Diagnosis
|
|
715
|
+
|
|
716
|
+
```toml
|
|
717
|
+
[SeuratClusterStats.envs.dimplots."Dimensional reduction plot by Diagnosis"]
|
|
718
|
+
facet_by = "Diagnosis"
|
|
719
|
+
highlight = true
|
|
720
|
+
theme = "theme_blank"
|
|
721
|
+
```
|
|
722
|
+
|
|
723
|
+
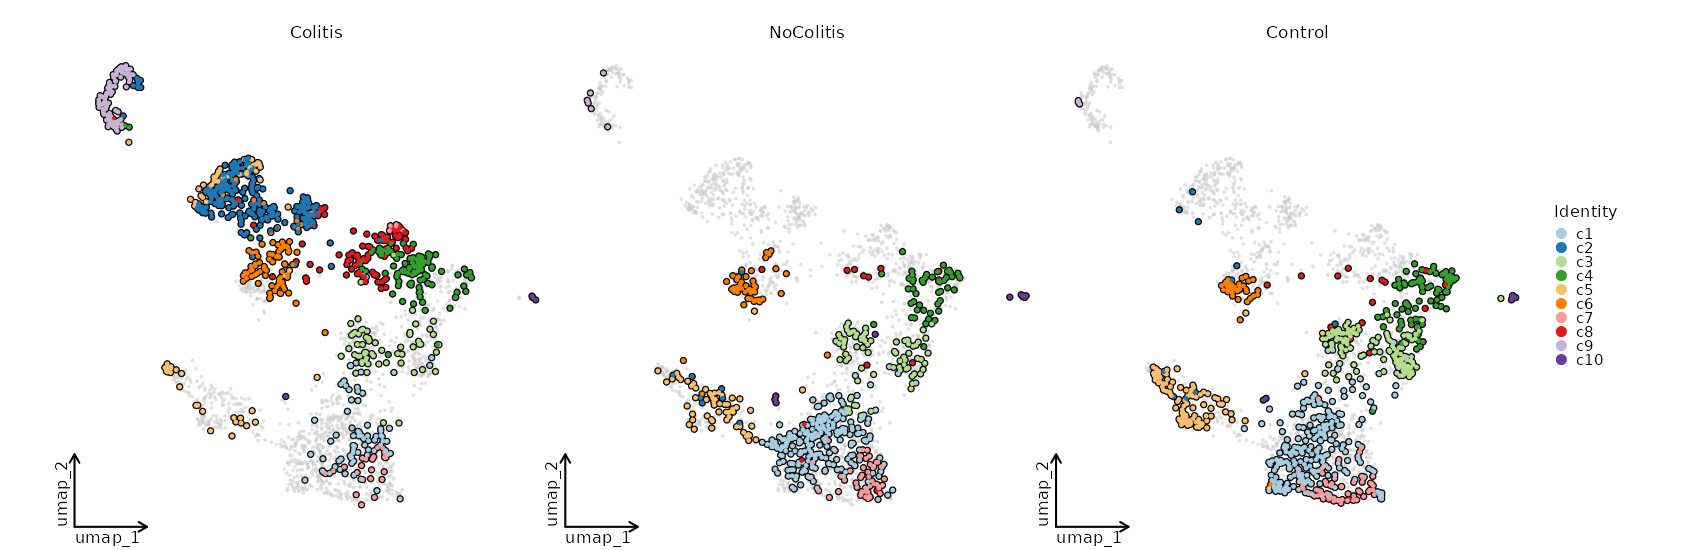{: width="80%" }
|
|
345
724
|
|
|
346
725
|
Input:
|
|
347
726
|
srtobj: The seurat object loaded by `SeuratClustering`
|
|
348
727
|
|
|
349
728
|
Output:
|
|
350
|
-
outdir: The output directory
|
|
729
|
+
outdir: The output directory.
|
|
730
|
+
Different types of plots will be saved in different subdirectories.
|
|
731
|
+
For example, `clustree` plots will be saved in `clustrees` subdirectory.
|
|
732
|
+
For each case in `envs.clustrees`, both the png and pdf files will be saved.
|
|
351
733
|
|
|
352
734
|
Envs:
|
|
735
|
+
mutaters (type=json): The mutaters to mutate the metadata to subset the cells.
|
|
736
|
+
The mutaters will be applied in the order specified.
|
|
737
|
+
You can also use the clone selectors to select the TCR clones/clusters.
|
|
738
|
+
See <https://pwwang.github.io/scplotter/reference/clone_selectors.html>.
|
|
739
|
+
cache (type=auto): Whether to cache the plots.
|
|
740
|
+
Currently only plots for features are supported, since creating the those
|
|
741
|
+
plots can be time consuming.
|
|
742
|
+
If `True`, the plots will be cached in the job output directory, which will
|
|
743
|
+
be not cleaned up when job is rerunning.
|
|
744
|
+
clustrees_defaults (ns): The parameters for the clustree plots.
|
|
745
|
+
- devpars (ns): The device parameters for the clustree plot.
|
|
746
|
+
- res (type=int): The resolution of the plots.
|
|
747
|
+
- height (type=int): The height of the plots.
|
|
748
|
+
- width (type=int): The width of the plots.
|
|
749
|
+
- more_formats (type=list): The formats to save the plots other than `png`.
|
|
750
|
+
- save_code (flag): Whether to save the code to reproduce the plot.
|
|
751
|
+
- prefix (type=auto): string indicating columns containing clustering information.
|
|
752
|
+
The trailing dot is not necessary and will be added automatically.
|
|
753
|
+
When `TRUE`, clustrees will be plotted when there is `FindClusters` or
|
|
754
|
+
`FindClusters.*` in the `obj@commands`.
|
|
755
|
+
The latter is generated by `SeuratSubClustering`.
|
|
756
|
+
This will be ignored when `envs.clustrees` is specified
|
|
757
|
+
(the prefix of each case must be specified separately).
|
|
758
|
+
- <more>: Other arguments passed to `scplotter::ClustreePlot`.
|
|
759
|
+
See <https://pwwang.github.io/scplotter/reference/ClustreePlot.html>
|
|
760
|
+
clustrees (type=json): The cases for clustree plots.
|
|
761
|
+
Keys are the names of the plots and values are the dicts inherited from `env.clustrees_defaults` except `prefix`.
|
|
762
|
+
There is no default case for `clustrees`.
|
|
353
763
|
stats_defaults (ns): The default parameters for `stats`.
|
|
764
|
+
This is to do some basic statistics on the clusters/cells. For more comprehensive analysis,
|
|
765
|
+
see <https://pwwang.github.io/scplotter/reference/CellStatPlot.html>.
|
|
354
766
|
The parameters from the cases can overwrite the default parameters.
|
|
355
|
-
-
|
|
356
|
-
-
|
|
357
|
-
- table (flag): Whether to output a table (in tab-delimited format) and in the report.
|
|
358
|
-
- ident: The column name in metadata to use as the identity.
|
|
359
|
-
- group-by: The column name in metadata to group the cells.
|
|
360
|
-
Does NOT support for pie charts.
|
|
361
|
-
- split-by: The column name in metadata to split the cells into
|
|
362
|
-
different plots.
|
|
363
|
-
- subset: An expression to subset the cells, will be passed to
|
|
364
|
-
`dplyr::filter()` on metadata.
|
|
365
|
-
- devpars (ns): The device parameters for the plots.
|
|
767
|
+
- subset: An expression to subset the cells, will be passed to `tidyrseurat::filter()`.
|
|
768
|
+
- devpars (ns): The device parameters for the clustree plot.
|
|
366
769
|
- res (type=int): The resolution of the plots.
|
|
367
770
|
- height (type=int): The height of the plots.
|
|
368
771
|
- width (type=int): The width of the plots.
|
|
772
|
+
- descr: The description of the plot, showing in the report.
|
|
773
|
+
- more_formats (type=list): The formats to save the plots other than `png`.
|
|
774
|
+
- save_code (flag): Whether to save the code to reproduce the plot.
|
|
775
|
+
- save_data (flag): Whether to save the data used to generate the plot.
|
|
776
|
+
- <more>: Other arguments passed to `scplotter::CellStatPlot`.
|
|
777
|
+
See <https://pwwang.github.io/scplotter/reference/CellStatPlot.html>.
|
|
369
778
|
stats (type=json): The number/fraction of cells to plot.
|
|
370
779
|
Keys are the names of the plots and values are the dicts inherited from `env.stats_defaults`.
|
|
371
|
-
|
|
372
|
-
|
|
373
|
-
|
|
374
|
-
|
|
375
|
-
|
|
376
|
-
|
|
780
|
+
ngenes_defaults (ns): The default parameters for `ngenes`.
|
|
781
|
+
The default parameters to plot the number of genes expressed in each cell.
|
|
782
|
+
- more_formats (type=list): The formats to save the plots other than `png`.
|
|
783
|
+
- subset: An expression to subset the cells, will be passed to `tidyrseurat::filter()`.
|
|
784
|
+
- devpars (ns): The device parameters for the plots.
|
|
785
|
+
- res (type=int): The resolution of the plots.
|
|
786
|
+
- height (type=int): The height of the plots.
|
|
787
|
+
- width (type=int): The width of the plots.
|
|
788
|
+
ngenes (type=json): The number of genes expressed in each cell.
|
|
789
|
+
Keys are the names of the plots and values are the dicts inherited from `env.ngenes_defaults`.
|
|
377
790
|
features_defaults (ns): The default parameters for `features`.
|
|
378
|
-
- features: The features to plot.
|
|
791
|
+
- features (type=auto): The features to plot.
|
|
379
792
|
It can be either a string with comma separated features, a list of features, a file path with `file://` prefix with features
|
|
380
793
|
(one per line), or an integer to use the top N features from `VariantFeatures(srtobj)`.
|
|
381
|
-
|
|
794
|
+
It can also be a dict with the keys as the feature group names and the values as the features, which
|
|
795
|
+
is used for heatmap to group the features.
|
|
796
|
+
- order_by (type=auto): The order of the clusters to show on the plot.
|
|
797
|
+
An expression passed to `dplyr::arrange()` on the grouped meta data frame (by `ident`).
|
|
798
|
+
For example, you can order the clusters by the activation score of
|
|
799
|
+
the cluster: `desc(mean(ActivationScore, na.rm = TRUE))`, suppose you have a column
|
|
800
|
+
`ActivationScore` in the metadata.
|
|
801
|
+
You may also specify the literal order of the clusters by a list of strings (at least two).
|
|
382
802
|
- subset: An expression to subset the cells, will be passed to `tidyrseurat::filter()`.
|
|
383
|
-
- devpars (ns): The device parameters for the plots.
|
|
803
|
+
- devpars (ns): The device parameters for the plots.
|
|
384
804
|
- res (type=int): The resolution of the plots.
|
|
385
805
|
- height (type=int): The height of the plots.
|
|
386
806
|
- width (type=int): The width of the plots.
|
|
387
|
-
-
|
|
388
|
-
-
|
|
389
|
-
|
|
390
|
-
-
|
|
391
|
-
|
|
392
|
-
|
|
393
|
-
- slot: The slot to use.
|
|
394
|
-
- section: The section to put the plot in the report.
|
|
395
|
-
If not specified, the case title will be used.
|
|
396
|
-
- ncol (type=int): The number of columns for the plots.
|
|
397
|
-
- kind (choice): The kind of the plot or table.
|
|
398
|
-
- ridge: Use `Seurat::RidgePlot`.
|
|
399
|
-
- ridgeplot: Same as `ridge`.
|
|
400
|
-
- vln: Use `Seurat::VlnPlot`.
|
|
401
|
-
- vlnplot: Same as `vln`.
|
|
402
|
-
- violin: Same as `vln`.
|
|
403
|
-
- violinplot: Same as `vln`.
|
|
404
|
-
- feature: Use `Seurat::FeaturePlot`.
|
|
405
|
-
- featureplot: Same as `feature`.
|
|
406
|
-
- dot: Use `Seurat::DotPlot`.
|
|
407
|
-
- dotplot: Same as `dot`.
|
|
408
|
-
- heatmap: Use `Seurat::DoHeatmap`.
|
|
409
|
-
You can specify `average=True` to plot on the average of the expressions.
|
|
410
|
-
- table: The table for the features, only gene expressions are supported.
|
|
411
|
-
(supported keys: ident, subset, and features).
|
|
807
|
+
- descr: The description of the plot, showing in the report.
|
|
808
|
+
- more_formats (type=list): The formats to save the plots other than `png`.
|
|
809
|
+
- save_code (flag): Whether to save the code to reproduce the plot.
|
|
810
|
+
- save_data (flag): Whether to save the data used to generate the plot.
|
|
811
|
+
- <more>: Other arguments passed to `scplotter::FeatureStatPlot`.
|
|
812
|
+
See <https://pwwang.github.io/scplotter/reference/FeatureStatPlot.html>
|
|
412
813
|
features (type=json): The plots for features, include gene expressions, and columns from metadata.
|
|
413
|
-
Keys are the titles of the cases and values are the dicts inherited from `env.features_defaults`.
|
|
414
|
-
each Seurat function used by `kind`. Note that for argument name with `.`, you should use `-` instead.
|
|
814
|
+
Keys are the titles of the cases and values are the dicts inherited from `env.features_defaults`.
|
|
415
815
|
dimplots_defaults (ns): The default parameters for `dimplots`.
|
|
416
|
-
-
|
|
417
|
-
|
|
418
|
-
|
|
419
|
-
-
|
|
420
|
-
-
|
|
816
|
+
- group_by: The identity to use.
|
|
817
|
+
If it is from subclustering (reduction `sub_umap_<ident>` exists), this reduction will be used if `reduction`
|
|
818
|
+
is set to `dim` or `auto`.
|
|
819
|
+
- split_by: The column name in metadata to split the cells into different plots.
|
|
820
|
+
- subset: An expression to subset the cells, will be passed to `tidyrseurat::filter()`.
|
|
421
821
|
- devpars (ns): The device parameters for the plots.
|
|
422
822
|
- res (type=int): The resolution of the plots.
|
|
423
823
|
- height (type=int): The height of the plots.
|
|
@@ -425,77 +825,89 @@ class SeuratClusterStats(Proc):
|
|
|
425
825
|
- reduction (choice): Which dimensionality reduction to use.
|
|
426
826
|
- dim: Use `Seurat::DimPlot`.
|
|
427
827
|
First searches for `umap`, then `tsne`, then `pca`.
|
|
828
|
+
If `ident` is from subclustering, `sub_umap_<ident>` will be used.
|
|
428
829
|
- auto: Same as `dim`
|
|
429
830
|
- umap: Use `Seurat::UMAPPlot`.
|
|
430
831
|
- tsne: Use `Seurat::TSNEPlot`.
|
|
431
832
|
- pca: Use `Seurat::PCAPlot`.
|
|
432
|
-
- <more>: See <https://
|
|
833
|
+
- <more>: See <https://pwwang.github.io/scplotter/reference/CellDimPlot.html>
|
|
433
834
|
dimplots (type=json): The dimensional reduction plots.
|
|
434
835
|
Keys are the titles of the plots and values are the dicts inherited from `env.dimplots_defaults`. It can also have other parameters from
|
|
435
|
-
[`
|
|
836
|
+
[`scplotter::CellDimPlot`](https://pwwang.github.io/scplotter/reference/CellDimPlot.html).
|
|
436
837
|
|
|
437
838
|
Requires:
|
|
438
839
|
r-seurat:
|
|
439
840
|
- check: {{proc.lang}} -e "library(Seurat)"
|
|
440
841
|
""" # noqa: E501
|
|
842
|
+
|
|
441
843
|
input = "srtobj:file"
|
|
442
844
|
output = "outdir:dir:{{in.srtobj | stem}}.cluster_stats"
|
|
443
845
|
lang = config.lang.rscript
|
|
444
846
|
envs = {
|
|
847
|
+
"mutaters": {},
|
|
848
|
+
"cache": config.path.tmpdir,
|
|
849
|
+
"clustrees_defaults": {
|
|
850
|
+
"devpars": {"res": 100},
|
|
851
|
+
"more_formats": [],
|
|
852
|
+
"save_code": False,
|
|
853
|
+
"prefix": True,
|
|
854
|
+
},
|
|
855
|
+
"clustrees": {},
|
|
445
856
|
"stats_defaults": {
|
|
446
|
-
"frac": False,
|
|
447
|
-
"pie": False,
|
|
448
|
-
"table": False,
|
|
449
|
-
"ident": "seurat_clusters",
|
|
450
|
-
"group-by": None,
|
|
451
|
-
"split-by": None,
|
|
452
857
|
"subset": None,
|
|
453
|
-
"
|
|
858
|
+
"descr": None,
|
|
859
|
+
"devpars": {"res": 100},
|
|
860
|
+
"more_formats": [],
|
|
861
|
+
"save_code": False,
|
|
862
|
+
"save_data": False,
|
|
454
863
|
},
|
|
455
864
|
"stats": {
|
|
456
|
-
"Number of cells in each cluster": {
|
|
457
|
-
"
|
|
865
|
+
"Number of cells in each cluster (Bar Chart)": {
|
|
866
|
+
"plot_type": "bar",
|
|
867
|
+
"x_text_angle": 90,
|
|
458
868
|
},
|
|
459
|
-
"Number of cells in each cluster by Sample": {
|
|
460
|
-
"
|
|
461
|
-
"
|
|
462
|
-
"
|
|
869
|
+
"Number of cells in each cluster by Sample (Bar Chart)": {
|
|
870
|
+
"plot_type": "bar",
|
|
871
|
+
"group_by": "Sample",
|
|
872
|
+
"x_text_angle": 90,
|
|
463
873
|
},
|
|
464
874
|
},
|
|
875
|
+
"ngenes_defaults": {
|
|
876
|
+
"subset": None,
|
|
877
|
+
"more_formats": [],
|
|
878
|
+
"devpars": {"res": 100, "height": 800, "width": 1000},
|
|
879
|
+
},
|
|
880
|
+
"ngenes": {
|
|
881
|
+
"Number of genes expressed in each cluster": {},
|
|
882
|
+
},
|
|
465
883
|
"features_defaults": {
|
|
466
884
|
"features": None,
|
|
467
|
-
"
|
|
885
|
+
"order_by": None,
|
|
468
886
|
"subset": None,
|
|
469
887
|
"devpars": {"res": 100},
|
|
470
|
-
"
|
|
471
|
-
"
|
|
472
|
-
"
|
|
473
|
-
"
|
|
474
|
-
"section": None,
|
|
475
|
-
"slot": None,
|
|
476
|
-
"kind": None,
|
|
477
|
-
"ncol": 2,
|
|
888
|
+
"descr": None,
|
|
889
|
+
"more_formats": [],
|
|
890
|
+
"save_code": False,
|
|
891
|
+
"save_data": False,
|
|
478
892
|
},
|
|
479
893
|
"features": {},
|
|
480
894
|
"dimplots_defaults": {
|
|
481
|
-
"
|
|
482
|
-
"
|
|
483
|
-
"
|
|
484
|
-
"shape-by": None,
|
|
895
|
+
"group_by": None, # use default ident
|
|
896
|
+
"split_by": None,
|
|
897
|
+
"subset": None,
|
|
485
898
|
"reduction": "dim",
|
|
486
|
-
"devpars": {"res": 100
|
|
899
|
+
"devpars": {"res": 100},
|
|
487
900
|
},
|
|
488
901
|
"dimplots": {
|
|
489
902
|
"Dimensional reduction plot": {
|
|
490
903
|
"label": True,
|
|
491
|
-
"label-box": True,
|
|
492
|
-
"repel": True,
|
|
493
904
|
},
|
|
494
905
|
},
|
|
495
906
|
}
|
|
496
907
|
script = "file://../scripts/scrna/SeuratClusterStats.R"
|
|
497
908
|
plugin_opts = {
|
|
498
|
-
"report": "file://../reports/
|
|
909
|
+
"report": "file://../reports/common.svelte",
|
|
910
|
+
"report_paging": 8,
|
|
499
911
|
}
|
|
500
912
|
|
|
501
913
|
|
|
@@ -516,7 +928,7 @@ class ModuleScoreCalculator(Proc):
|
|
|
516
928
|
srtobj: The seurat object loaded by `SeuratClustering`
|
|
517
929
|
|
|
518
930
|
Output:
|
|
519
|
-
rdsfile: The seurat object with module scores
|
|
931
|
+
rdsfile: The seurat object with module scores added to the metadata.
|
|
520
932
|
|
|
521
933
|
Envs:
|
|
522
934
|
defaults (ns): The default parameters for `modules`.
|
|
@@ -557,9 +969,30 @@ class ModuleScoreCalculator(Proc):
|
|
|
557
969
|
>>> "Activation": {"features": "IFNG"},
|
|
558
970
|
>>> "Proliferation": {"features": "STMN1,TUBB"}
|
|
559
971
|
>>> }
|
|
972
|
+
|
|
973
|
+
For `CellCycle`, the columns `S.Score`, `G2M.Score` and `Phase` will
|
|
974
|
+
be added to the metadata. `S.Score` and `G2M.Score` are the cell cycle
|
|
975
|
+
scores for each cell, and `Phase` is the cell cycle phase for each cell.
|
|
976
|
+
|
|
977
|
+
You can also add Diffusion Components (DC) to the modules
|
|
978
|
+
>>> {"DC": {"features": 2, "kind": "diffmap"}}
|
|
979
|
+
will perform diffusion map as a reduction and add the first 2
|
|
980
|
+
components as `DC_1` and `DC_2` to the metadata. `diffmap` is a shortcut
|
|
981
|
+
for `diffusion_map`. Other key-value pairs will pass to
|
|
982
|
+
[`destiny::DiffusionMap()`](https://www.rdocumentation.org/packages/destiny/versions/2.0.4/topics/DiffusionMap class).
|
|
983
|
+
You can later plot the diffusion map by using
|
|
984
|
+
`reduction = "DC"` in `env.dimplots` in `SeuratClusterStats`.
|
|
985
|
+
This requires [`SingleCellExperiment`](https://bioconductor.org/packages/release/bioc/html/SingleCellExperiment.html)
|
|
986
|
+
and [`destiny`](https://bioconductor.org/packages/release/bioc/html/destiny.html) R packages.
|
|
987
|
+
post_mutaters (type=json): The mutaters to mutate the metadata after
|
|
988
|
+
calculating the module scores.
|
|
989
|
+
The mutaters will be applied in the order specified.
|
|
990
|
+
This is useful when you want to create new scores based on the
|
|
991
|
+
calculated module scores.
|
|
560
992
|
""" # noqa: E501
|
|
993
|
+
|
|
561
994
|
input = "srtobj:file"
|
|
562
|
-
output = "rdsfile:file:{{in.srtobj | stem}}.
|
|
995
|
+
output = "rdsfile:file:{{in.srtobj | stem}}.qs"
|
|
563
996
|
lang = config.lang.rscript
|
|
564
997
|
envs = {
|
|
565
998
|
"defaults": {
|
|
@@ -567,7 +1000,7 @@ class ModuleScoreCalculator(Proc):
|
|
|
567
1000
|
"nbin": 24,
|
|
568
1001
|
"ctrl": 100,
|
|
569
1002
|
"k": False,
|
|
570
|
-
"assay":
|
|
1003
|
+
"assay": None,
|
|
571
1004
|
"seed": 8525,
|
|
572
1005
|
"search": False,
|
|
573
1006
|
"keep": False,
|
|
@@ -579,11 +1012,17 @@ class ModuleScoreCalculator(Proc):
|
|
|
579
1012
|
# "Activation": {"features": "IFNG"},
|
|
580
1013
|
# "Proliferation": {"features": "STMN1,TUBB"},
|
|
581
1014
|
},
|
|
1015
|
+
"post_mutaters": {},
|
|
582
1016
|
}
|
|
583
1017
|
script = "file://../scripts/scrna/ModuleScoreCalculator.R"
|
|
584
1018
|
|
|
585
1019
|
|
|
586
|
-
@
|
|
1020
|
+
@mark(
|
|
1021
|
+
deprecated=(
|
|
1022
|
+
"[{proc.name}] is deprecated, "
|
|
1023
|
+
"use [SeuratClusterStats] or [ClonalStats] instead."
|
|
1024
|
+
)
|
|
1025
|
+
)
|
|
587
1026
|
class CellsDistribution(Proc):
|
|
588
1027
|
"""Distribution of cells (i.e. in a TCR clone) from different groups
|
|
589
1028
|
for each cluster
|
|
@@ -608,19 +1047,26 @@ class CellsDistribution(Proc):
|
|
|
608
1047
|
group_order = [ "Tumor", "Normal" ]
|
|
609
1048
|
```
|
|
610
1049
|
|
|
611
|
-

|
|
1050
|
+
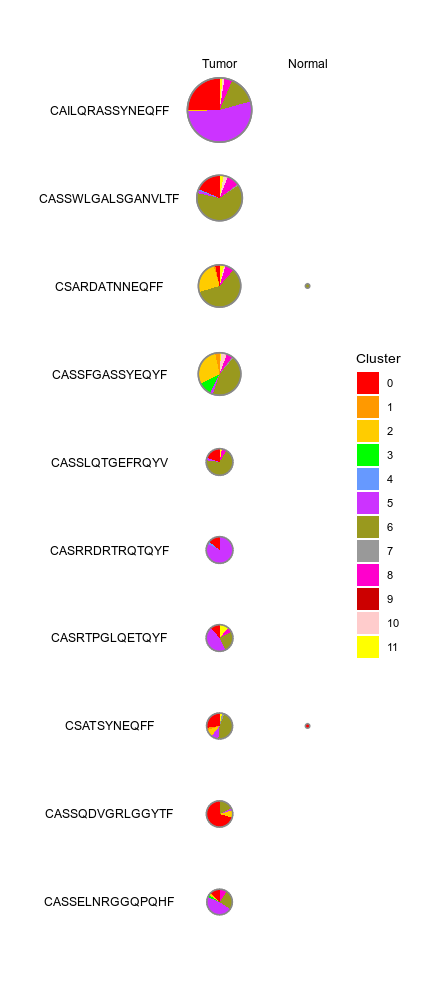
|
|
612
1051
|
|
|
613
1052
|
Input:
|
|
614
1053
|
srtobj: The seurat object in RDS format
|
|
615
1054
|
|
|
616
1055
|
Output:
|
|
617
|
-
outdir: The output directory
|
|
1056
|
+
outdir: The output directory.
|
|
1057
|
+
The results for each case will be saved in a subdirectory.
|
|
618
1058
|
|
|
619
1059
|
Envs:
|
|
620
1060
|
mutaters (type=json): The mutaters to mutate the metadata
|
|
621
1061
|
Keys are the names of the mutaters and values are the R expressions
|
|
622
1062
|
passed by `dplyr::mutate()` to mutate the metadata.
|
|
623
|
-
|
|
1063
|
+
|
|
1064
|
+
cluster_orderby: The order of the clusters to show on the plot.
|
|
1065
|
+
An expression passed to `dplyr::summarise()` on the grouped data frame (by `seurat_clusters`).
|
|
1066
|
+
The summary stat will be passed to `dplyr::arrange()` to order the clusters. It's applied on the whole meta.data before grouping and subsetting.
|
|
1067
|
+
For example, you can order the clusters by the activation score of
|
|
1068
|
+
the cluster: `desc(mean(ActivationScore, na.rm = TRUE))`, suppose you have a column
|
|
1069
|
+
`ActivationScore` in the metadata.
|
|
624
1070
|
group_by: The column name in metadata to group the cells for the columns of the plot.
|
|
625
1071
|
group_order (list): The order of the groups (columns) to show on the plot
|
|
626
1072
|
cells_by: The column name in metadata to group the cells for the rows of the plot.
|
|
@@ -642,15 +1088,23 @@ class CellsDistribution(Proc):
|
|
|
642
1088
|
Ignored if `cells_order` is specified.
|
|
643
1089
|
subset: An expression to subset the cells, will be passed to `dplyr::filter()` on metadata.
|
|
644
1090
|
This will be applied prior to `each`.
|
|
645
|
-
|
|
1091
|
+
descr: The description of the case, will be shown in the report.
|
|
1092
|
+
hm_devpars (ns): The device parameters for the heatmaps.
|
|
1093
|
+
- res (type=int): The resolution of the heatmaps.
|
|
1094
|
+
- height (type=int): The height of the heatmaps.
|
|
1095
|
+
- width (type=int): The width of the heatmaps.
|
|
1096
|
+
devpars (ns): The device parameters for the plots of pie charts.
|
|
646
1097
|
- res (type=int): The resolution of the plots
|
|
647
1098
|
- height (type=int): The height of the plots
|
|
648
1099
|
- width (type=int): The width of the plots
|
|
649
1100
|
each: The column name in metadata to separate the cells into different plots.
|
|
1101
|
+
prefix_each (flag): Whether to prefix the `each` column name to the
|
|
1102
|
+
value as the case/section name.
|
|
650
1103
|
section: The section to show in the report. This allows different cases to be put in the same section in report.
|
|
651
1104
|
Only works when `each` is not specified.
|
|
652
|
-
overlap (list): Plot the overlap of
|
|
653
|
-
|
|
1105
|
+
overlap (list): Plot the overlap of cell groups (values of `cells_by`) in different cases
|
|
1106
|
+
under the same section.
|
|
1107
|
+
The section must have at least 2 cases, each case should have a single `cells_by` column.
|
|
654
1108
|
cases (type=json;order=99): If you have multiple cases, you can specify them here.
|
|
655
1109
|
Keys are the names of the cases and values are the options above except `mutaters`.
|
|
656
1110
|
If some options are not specified, the options in `envs` will be used.
|
|
@@ -664,11 +1118,13 @@ class CellsDistribution(Proc):
|
|
|
664
1118
|
r-tidyr:
|
|
665
1119
|
- check: {{proc.lang}} -e "library(tidyr)"
|
|
666
1120
|
""" # noqa: E501
|
|
1121
|
+
|
|
667
1122
|
input = "srtobj:file"
|
|
668
1123
|
output = "outdir:dir:{{in.srtobj | stem}}.cells_distribution"
|
|
669
1124
|
lang = config.lang.rscript
|
|
670
1125
|
envs = {
|
|
671
1126
|
"mutaters": {},
|
|
1127
|
+
"cluster_orderby": None,
|
|
672
1128
|
"group_by": None,
|
|
673
1129
|
"group_order": [],
|
|
674
1130
|
"cells_by": None,
|
|
@@ -676,8 +1132,11 @@ class CellsDistribution(Proc):
|
|
|
676
1132
|
"cells_orderby": None,
|
|
677
1133
|
"cells_n": 10,
|
|
678
1134
|
"subset": None,
|
|
1135
|
+
"descr": None,
|
|
679
1136
|
"devpars": {},
|
|
1137
|
+
"hm_devpars": {},
|
|
680
1138
|
"each": None,
|
|
1139
|
+
"prefix_each": True,
|
|
681
1140
|
"section": "DEFAULT",
|
|
682
1141
|
"overlap": [],
|
|
683
1142
|
"cases": {},
|
|
@@ -689,7 +1148,6 @@ class CellsDistribution(Proc):
|
|
|
689
1148
|
}
|
|
690
1149
|
|
|
691
1150
|
|
|
692
|
-
@format_placeholder(mutate_helpers_clonesize=MUTATE_HELPERS_CLONESIZE_INDENTED)
|
|
693
1151
|
class SeuratMetadataMutater(Proc):
|
|
694
1152
|
"""Mutate the metadata of the seurat object
|
|
695
1153
|
|
|
@@ -700,12 +1158,11 @@ class SeuratMetadataMutater(Proc):
|
|
|
700
1158
|
cells.
|
|
701
1159
|
|
|
702
1160
|
Output:
|
|
703
|
-
|
|
1161
|
+
outfile: The seurat object with the additional metadata
|
|
704
1162
|
|
|
705
1163
|
Envs:
|
|
706
1164
|
mutaters (type=json): The mutaters to mutate the metadata.
|
|
707
1165
|
The key-value pairs will be passed the `dplyr::mutate()` to mutate the metadata.
|
|
708
|
-
%(mutate_helpers_clonesize)s
|
|
709
1166
|
|
|
710
1167
|
Requires:
|
|
711
1168
|
r-seurat:
|
|
@@ -715,67 +1172,15 @@ class SeuratMetadataMutater(Proc):
|
|
|
715
1172
|
r-dplyr:
|
|
716
1173
|
- check: {{proc.lang}} <(echo "library(dplyr)")
|
|
717
1174
|
""" # noqa: E501
|
|
1175
|
+
|
|
718
1176
|
input = "srtobj:file, metafile:file"
|
|
719
|
-
output = "
|
|
1177
|
+
output = "outfile:file:{{in.srtobj | stem}}.qs"
|
|
720
1178
|
lang = config.lang.rscript
|
|
721
1179
|
envs = {"mutaters": {}}
|
|
722
1180
|
script = "file://../scripts/scrna/SeuratMetadataMutater.R"
|
|
723
1181
|
|
|
724
1182
|
|
|
725
|
-
|
|
726
|
-
"""Investigation of expressions of genes of interest
|
|
727
|
-
|
|
728
|
-
Input:
|
|
729
|
-
srtobj: The seurat object loaded by `SeuratPreparing`
|
|
730
|
-
genefile: The genes to show their expressions in the plots
|
|
731
|
-
Either one column or two columns.
|
|
732
|
-
If one column, the column name will be used as both the gene names
|
|
733
|
-
to match the expressions and the names to show in the plots
|
|
734
|
-
If two columns, the first column will be used as the gene names
|
|
735
|
-
to match the expressions and the second column will be used to
|
|
736
|
-
show in the plots.
|
|
737
|
-
configfile: The configuration file (toml). See `envs.config`
|
|
738
|
-
If not provided, use `envs.config`
|
|
739
|
-
|
|
740
|
-
Output:
|
|
741
|
-
outdir: The output directory with the plots
|
|
742
|
-
|
|
743
|
-
Envs:
|
|
744
|
-
gopts: Options for `read.table()` to read `in.genefile`
|
|
745
|
-
config: The configurations to do the plots
|
|
746
|
-
name: The name of the job, mostly used in report
|
|
747
|
-
mutaters: The mutater to mutate the metadata
|
|
748
|
-
groupby: Which meta columns to group the data
|
|
749
|
-
subset: Select a subset of cells, will be passed to
|
|
750
|
-
`subset(obj, subset=<subset>)`
|
|
751
|
-
plots: Plots to generate
|
|
752
|
-
Currently supported
|
|
753
|
-
`boxplot`:
|
|
754
|
-
- `ncol`: Split the plot to how many columns?
|
|
755
|
-
- `res`, `height` and `width` the parameters for `png()`
|
|
756
|
-
`heatmap`:
|
|
757
|
-
- `res`, `height` and `width` the parameters for `png()`
|
|
758
|
-
- other arguments for `ComplexHeatmap::Heatmap()`
|
|
759
|
-
"""
|
|
760
|
-
input = "srtobj:file, genefile:file, configfile:file"
|
|
761
|
-
output = "outdir:dir:{{in.configfile | stem0}}.gei"
|
|
762
|
-
lang = config.lang.rscript
|
|
763
|
-
order = 4
|
|
764
|
-
envs = {
|
|
765
|
-
"config": {},
|
|
766
|
-
"gopts": {
|
|
767
|
-
"header": False,
|
|
768
|
-
"row.names": None,
|
|
769
|
-
"sep": "\t",
|
|
770
|
-
"check.names": False,
|
|
771
|
-
},
|
|
772
|
-
}
|
|
773
|
-
script = "file://../scripts/scrna/GeneExpressionInvistigation.R"
|
|
774
|
-
plugin_opts = {
|
|
775
|
-
"report": "file://../reports/scrna/GeneExpressionInvistigation.svelte"
|
|
776
|
-
}
|
|
777
|
-
|
|
778
|
-
|
|
1183
|
+
@mark(deprecated="[{proc.name}] is deprecated, use [SeuratClusterStats] instead.")
|
|
779
1184
|
class DimPlots(Proc):
|
|
780
1185
|
"""Seurat - Dimensional reduction plots
|
|
781
1186
|
|
|
@@ -793,6 +1198,7 @@ class DimPlots(Proc):
|
|
|
793
1198
|
Keys are the names and values are the arguments to
|
|
794
1199
|
`Seurat::Dimplots`
|
|
795
1200
|
"""
|
|
1201
|
+
|
|
796
1202
|
input = "srtobj:file, configfile:file, name:var"
|
|
797
1203
|
output = "outdir:dir:{{in.srtobj | stem}}.dimplots"
|
|
798
1204
|
lang = config.lang.rscript
|
|
@@ -804,112 +1210,226 @@ class DimPlots(Proc):
|
|
|
804
1210
|
}
|
|
805
1211
|
|
|
806
1212
|
|
|
807
|
-
@format_placeholder(mutate_helpers_clonesize=MUTATE_HELPERS_CLONESIZE_INDENTED)
|
|
808
1213
|
class MarkersFinder(Proc):
|
|
809
1214
|
"""Find markers between different groups of cells
|
|
810
1215
|
|
|
811
|
-
When only `
|
|
1216
|
+
When only `group_by` is specified as identity column in
|
|
812
1217
|
`envs.cases`, the markers will be found for all the clusters.
|
|
813
1218
|
|
|
814
1219
|
You can also find the differentially expressed genes between
|
|
815
|
-
any two groups of cells by setting `
|
|
1220
|
+
any two groups of cells by setting `group_by` to a different
|
|
816
1221
|
column name in metadata. Follow `envs.cases` for more details.
|
|
817
1222
|
|
|
818
1223
|
Input:
|
|
819
1224
|
srtobj: The seurat object loaded by `SeuratPreparing`
|
|
1225
|
+
If you have your `Seurat` object prepared by yourself, you can also
|
|
1226
|
+
use it here, but you should make sure that the object has been processed
|
|
1227
|
+
by `PrepSCTFindMarkers` if data is not normalized using `SCTransform`.
|
|
820
1228
|
|
|
821
1229
|
Output:
|
|
822
|
-
outdir: The output directory for the markers
|
|
1230
|
+
outdir: The output directory for the markers and plots
|
|
823
1231
|
|
|
824
1232
|
Envs:
|
|
825
1233
|
ncores (type=int): Number of cores to use for parallel computing for some `Seurat` procedures.
|
|
826
1234
|
* Used in `future::plan(strategy = "multicore", workers = <ncores>)` to parallelize some Seurat procedures.
|
|
827
1235
|
* See also: <https://satijalab.org/seurat/articles/future_vignette.html>
|
|
828
|
-
mutaters (type=json): The mutaters to mutate the metadata
|
|
829
|
-
|
|
830
|
-
|
|
831
|
-
|
|
832
|
-
If
|
|
833
|
-
group-by: The column name in metadata to group the cells.
|
|
834
|
-
If only `group-by` is specified, and `ident-1` and `ident-2` are
|
|
1236
|
+
mutaters (type=json): The mutaters to mutate the metadata.
|
|
1237
|
+
You can also use the clone selectors to select the TCR clones/clusters.
|
|
1238
|
+
See <https://pwwang.github.io/scplotter/reference/clone_selectors.html>.
|
|
1239
|
+
group_by: The column name in metadata to group the cells.
|
|
1240
|
+
If only `group_by` is specified, and `ident_1` and `ident_2` are
|
|
835
1241
|
not specified, markers will be found for all groups in this column
|
|
836
1242
|
in the manner of "group vs rest" comparison.
|
|
837
1243
|
`NA` group will be ignored.
|
|
1244
|
+
If `None`, `Seurat::Idents(srtobj)` will be used, which is usually
|
|
1245
|
+
`"seurat_clusters"` after unsupervised clustering.
|
|
1246
|
+
ident_1: The first group of cells to compare
|
|
1247
|
+
When this is empty, the comparisons will be expanded to each group v.s. the rest of the cells in `group_by`.
|
|
1248
|
+
ident_2: The second group of cells to compare
|
|
1249
|
+
If not provided, the rest of the cells are used for `ident_2`.
|
|
838
1250
|
each: The column name in metadata to separate the cells into different
|
|
839
1251
|
cases.
|
|
840
|
-
|
|
841
|
-
|
|
842
|
-
|
|
843
|
-
|
|
844
|
-
|
|
1252
|
+
When this is specified, the case will be expanded for each value of
|
|
1253
|
+
the column in metadata. For example, when you have `envs.cases."Cluster Markers".each = "Sample"`,
|
|
1254
|
+
then the case will be expanded as `envs.cases."Cluster Markers - Sample1"`, `envs.cases."Cluster Markers - Sample2"`, etc.
|
|
1255
|
+
You can specify `allmarker_plots` and `overlaps` to plot the markers for all cases in the same plot and plot the overlaps of the markers
|
|
1256
|
+
between different cases by values in this column.
|
|
1257
|
+
dbs (list): The dbs to do enrichment analysis for significant markers.
|
|
1258
|
+
You can use built-in dbs in `enrichit`, or provide your own gmt files.
|
|
1259
|
+
See also <https://pwwang.github.io/enrichit/reference/FetchGMT.html>.
|
|
1260
|
+
The built-in dbs include:
|
|
1261
|
+
* "BioCarta" or "BioCarta_2016"
|
|
1262
|
+
* "GO_Biological_Process" or "GO_Biological_Process_2025"
|
|
1263
|
+
* "GO_Cellular_Component" or "GO_Cellular_Component_2025"
|
|
1264
|
+
* "GO_Molecular_Function" or "GO_Molecular_Function_2025"
|
|
1265
|
+
* "KEGG", "KEGG_Human", "KEGG_2021", or "KEGG_2021_Human"
|
|
1266
|
+
* "Hallmark", "MSigDB_Hallmark", or "MSigDB_Hallmark_2020"
|
|
1267
|
+
* "Reactome", "Reactome_Pathways", or "Reactome_Pathways_2024"
|
|
1268
|
+
* "WikiPathways", "WikiPathways_2024", "WikiPathways_Human", or "WikiPathways_2024_Human"
|
|
1269
|
+
You can also fetch more dbs from <https://maayanlab.cloud/Enrichr/#libraries>.
|
|
845
1270
|
sigmarkers: An expression passed to `dplyr::filter()` to filter the
|
|
846
1271
|
significant markers for enrichment analysis.
|
|
847
1272
|
Available variables are `p_val`, `avg_log2FC`, `pct.1`, `pct.2` and
|
|
848
1273
|
`p_val_adj`. For example, `"p_val_adj < 0.05 & abs(avg_log2FC) > 1"`
|
|
849
1274
|
to select markers with adjusted p-value < 0.05 and absolute log2
|
|
850
1275
|
fold change > 1.
|
|
1276
|
+
enrich_style (choice): The style of the enrichment analysis.
|
|
1277
|
+
The enrichment analysis will be done by `EnrichIt()` from [`enrichit`](https://pwwang.github.io/enrichit/).
|
|
1278
|
+
Two styles are available:
|
|
1279
|
+
- enrichr: `enrichr` style enrichment analysis (fisher's exact test will be used).
|
|
1280
|
+
- clusterprofiler: `clusterProfiler` style enrichment analysis (hypergeometric test will be used).
|
|
1281
|
+
- clusterProfiler: alias for `clusterprofiler`
|
|
851
1282
|
assay: The assay to use.
|
|
852
|
-
|
|
853
|
-
|
|
854
|
-
If `True`, all significant markers will be labeled. If `False`, no
|
|
855
|
-
genes will be labeled. Otherwise, specify the genes to label.
|
|
856
|
-
It could be either a string with comma separated genes, or a list
|
|
857
|
-
of genes.
|
|
858
|
-
section: The section name for the report. It must not contain colon (`:`).
|
|
859
|
-
Ignored when `each` is not specified and `ident-1` is specified.
|
|
860
|
-
When neither `each` nor `ident-1` is specified, case name will be used
|
|
861
|
-
as section name.
|
|
862
|
-
If `each` is specified, the section name will be constructed from
|
|
863
|
-
`each` and case name.
|
|
1283
|
+
error (flag): Error out if no/not enough markers are found or no pathways are enriched.
|
|
1284
|
+
If `False`, empty results will be returned.
|
|
864
1285
|
subset: An expression to subset the cells for each case.
|
|
1286
|
+
cache (type=auto): Where to cache the results.
|
|
1287
|
+
If `True`, cache to `outdir` of the job. If `False`, don't cache.
|
|
1288
|
+
Otherwise, specify the directory to cache to.
|
|
865
1289
|
rest (ns): Rest arguments for `Seurat::FindMarkers()`.
|
|
866
1290
|
Use `-` to replace `.` in the argument name. For example,
|
|
867
1291
|
use `min-pct` instead of `min.pct`.
|
|
868
1292
|
- <more>: See <https://satijalab.org/seurat/reference/findmarkers>
|
|
869
|
-
|
|
870
|
-
|
|
871
|
-
|
|
872
|
-
|
|
873
|
-
|
|
1293
|
+
allmarker_plots_defaults (ns): Default options for the plots for all markers when `ident_1` is not specified.
|
|
1294
|
+
- plot_type: The type of the plot.
|
|
1295
|
+
See <https://pwwang.github.io/biopipen.utils.R/reference/VizDEGs.html>.
|
|
1296
|
+
Available types are `violin`, `box`, `bar`, `ridge`, `dim`, `heatmap` and `dot`.
|
|
1297
|
+
- more_formats (type=list): The extra formats to save the plot in.
|
|
1298
|
+
- save_code (flag): Whether to save the code to generate the plot.
|
|
874
1299
|
- devpars (ns): The device parameters for the plots.
|
|
875
1300
|
- res (type=int): The resolution of the plots.
|
|
876
1301
|
- height (type=int): The height of the plots.
|
|
877
1302
|
- width (type=int): The width of the plots.
|
|
878
|
-
- <more>:
|
|
879
|
-
|
|
880
|
-
|
|
881
|
-
|
|
882
|
-
|
|
883
|
-
|
|
884
|
-
|
|
885
|
-
|
|
1303
|
+
- <more>: Other arguments passed to [`biopipen.utils::VizDEGs()`](https://pwwang.github.io/biopipen.utils.R/reference/VizDEGs.html).
|
|
1304
|
+
allmarker_plots (type=json): All marker plot cases.
|
|
1305
|
+
The keys are the names of the cases and the values are the dicts inherited from `allmarker_plots_defaults`.
|
|
1306
|
+
allenrich_plots_defaults (ns): Default options for the plots to generate for the enrichment analysis.
|
|
1307
|
+
- plot_type: The type of the plot.
|
|
1308
|
+
- devpars (ns): The device parameters for the plots.
|
|
1309
|
+
- res (type=int): The resolution of the plots.
|
|
1310
|
+
- height (type=int): The height of the plots.
|
|
1311
|
+
- width (type=int): The width of the plots.
|
|
1312
|
+
- <more>: See <https://pwwang.github.io/scplotter/reference/EnrichmentPlot.html>.
|
|
1313
|
+
allenrich_plots (type=json): Cases of the plots to generate for the enrichment analysis.
|
|
1314
|
+
The keys are the names of the cases and the values are the dicts inherited from `allenrich_plots_defaults`.
|
|
1315
|
+
The cases under `envs.cases` can inherit this options.
|
|
1316
|
+
marker_plots_defaults (ns): Default options for the plots to generate for the markers.
|
|
1317
|
+
- plot_type: The type of the plot.
|
|
1318
|
+
See <https://pwwang.github.io/biopipen.utils.R/reference/VizDEGs.html>.
|
|
1319
|
+
Available types are `violin`, `box`, `bar`, `ridge`, `dim`, `heatmap` and `dot`.
|
|
1320
|
+
There are two additional types available - `volcano_pct` and `volcano_log2fc`.
|
|
1321
|
+
- more_formats (type=list): The extra formats to save the plot in.
|
|
1322
|
+
- save_code (flag): Whether to save the code to generate the plot.
|
|
1323
|
+
- devpars (ns): The device parameters for the plots.
|
|
1324
|
+
- res (type=int): The resolution of the plots.
|
|
1325
|
+
- height (type=int): The height of the plots.
|
|
1326
|
+
- width (type=int): The width of the plots.
|
|
1327
|
+
- <more>: Other arguments passed to [`biopipen.utils::VizDEGs()`](https://pwwang.github.io/biopipen.utils.R/reference/VizDEGs.html).
|
|
1328
|
+
If `plot_type` is `volcano_pct` or `volcano_log2fc`, they will be passed to
|
|
1329
|
+
[`scplotter::VolcanoPlot()`](https://pwwang.github.io/plotthis/reference/VolcanoPlot.html).
|
|
1330
|
+
marker_plots (type=json): Cases of the plots to generate for the markers.
|
|
1331
|
+
Plot cases. The keys are the names of the cases and the values are the dicts inherited from `marker_plots_defaults`.
|
|
1332
|
+
The cases under `envs.cases` can inherit this options.
|
|
1333
|
+
enrich_plots_defaults (ns): Default options for the plots to generate for the enrichment analysis.
|
|
1334
|
+
- plot_type: The type of the plot.
|
|
1335
|
+
See <https://pwwang.github.io/scplotter/reference/EnrichmentPlot.html>.
|
|
1336
|
+
Available types are `bar`, `dot`, `lollipop`, `network`, `enrichmap` and `wordcloud`.
|
|
1337
|
+
- more_formats (type=list): The extra formats to save the plot in.
|
|
1338
|
+
- save_code (flag): Whether to save the code to generate the plot.
|
|
1339
|
+
- devpars (ns): The device parameters for the plots.
|
|
1340
|
+
- res (type=int): The resolution of the plots.
|
|
1341
|
+
- height (type=int): The height of the plots.
|
|
1342
|
+
- width (type=int): The width of the plots.
|
|
1343
|
+
- <more>: See <https://pwwang.github.io/scplotter/reference/EnrichmentPlot.html>.
|
|
1344
|
+
enrich_plots (type=json): Cases of the plots to generate for the enrichment analysis.
|
|
1345
|
+
The keys are the names of the cases and the values are the dicts inherited from `enrich_plots_defaults`.
|
|
1346
|
+
The cases under `envs.cases` can inherit this options.
|
|
1347
|
+
overlaps_defaults (ns): Default options for investigating the overlapping of significant markers between different cases or comparisons.
|
|
1348
|
+
This means either `ident_1` should be empty, so that they can be expanded to multiple comparisons.
|
|
1349
|
+
- sigmarkers: The expression to filter the significant markers for each case.
|
|
1350
|
+
If not provided, `envs.sigmarkers` will be used.
|
|
1351
|
+
- plot_type (choice): The type of the plot to generate for the overlaps.
|
|
1352
|
+
- venn: Use `plotthis::VennDiagram()`.
|
|
1353
|
+
- upset: Use `plotthis::UpsetPlot()`.
|
|
1354
|
+
- more_formats (type=list): The extra formats to save the plot in.
|
|
1355
|
+
- save_code (flag): Whether to save the code to generate the plot.
|
|
1356
|
+
- devpars (ns): The device parameters for the plots.
|
|
1357
|
+
- res (type=int): The resolution of the plots.
|
|
1358
|
+
- height (type=int): The height of the plots.
|
|
1359
|
+
- width (type=int): The width of the plots.
|
|
1360
|
+
- <more>: More arguments pased to `plotthis::VennDiagram()`
|
|
1361
|
+
(<https://pwwang.github.io/plotthis/reference/venndiagram1.html>)
|
|
1362
|
+
or `plotthis::UpsetPlot()`
|
|
1363
|
+
(<https://pwwang.github.io/plotthis/reference/upsetplot1.html>)
|
|
1364
|
+
overlaps (type=json): Cases for investigating the overlapping of significant markers between different cases or comparisons.
|
|
1365
|
+
The keys are the names of the cases and the values are the dicts inherited from `overlaps_defaults`.
|
|
1366
|
+
There are two situations that we can perform overlaps:
|
|
1367
|
+
1. If `ident_1` is not specified, the overlaps can be performed between different comparisons.
|
|
1368
|
+
2. If `each` is specified, the overlaps can be performed between different cases, where in each case, `ident_1` must be specified.
|
|
1369
|
+
cases (type=json): If you have multiple cases for marker discovery, you can specify them
|
|
1370
|
+
here. The keys are the names of the cases and the values are the above options. If some options are
|
|
1371
|
+
not specified, the default values specified above (under `envs`) will be used.
|
|
1372
|
+
If no cases are specified, the default case will be added with the default values under `envs` with the name `Marker Discovery`.
|
|
886
1373
|
""" # noqa: E501
|
|
1374
|
+
|
|
887
1375
|
input = "srtobj:file"
|
|
888
1376
|
output = "outdir:dir:{{in.srtobj | stem0}}.markers"
|
|
889
1377
|
lang = config.lang.rscript
|
|
890
1378
|
envs = {
|
|
891
1379
|
"ncores": config.misc.ncores,
|
|
892
1380
|
"mutaters": {},
|
|
893
|
-
"
|
|
894
|
-
"
|
|
895
|
-
"
|
|
1381
|
+
"group_by": None,
|
|
1382
|
+
"ident_1": None,
|
|
1383
|
+
"ident_2": None,
|
|
896
1384
|
"each": None,
|
|
897
|
-
"
|
|
898
|
-
"
|
|
1385
|
+
"dbs": ["KEGG_2021_Human", "MSigDB_Hallmark_2020"],
|
|
1386
|
+
"sigmarkers": "p_val_adj < 0.05",
|
|
1387
|
+
"enrich_style": "enrichr",
|
|
899
1388
|
"assay": None,
|
|
1389
|
+
"error": False,
|
|
900
1390
|
"subset": None,
|
|
1391
|
+
"cache": config.path.tmpdir,
|
|
901
1392
|
"rest": {},
|
|
902
|
-
"
|
|
903
|
-
"
|
|
904
|
-
"
|
|
905
|
-
"
|
|
906
|
-
"
|
|
907
|
-
|
|
908
|
-
"
|
|
909
|
-
"
|
|
910
|
-
|
|
1393
|
+
"allmarker_plots_defaults": {
|
|
1394
|
+
"plot_type": None,
|
|
1395
|
+
"more_formats": [],
|
|
1396
|
+
"save_code": False,
|
|
1397
|
+
"devpars": {"res": 100},
|
|
1398
|
+
},
|
|
1399
|
+
"allmarker_plots": {},
|
|
1400
|
+
"allenrich_plots_defaults": {
|
|
1401
|
+
"plot_type": "heatmap",
|
|
1402
|
+
"devpars": {"res": 100},
|
|
1403
|
+
},
|
|
1404
|
+
"allenrich_plots": {},
|
|
1405
|
+
"marker_plots_defaults": {
|
|
1406
|
+
"plot_type": None,
|
|
1407
|
+
"more_formats": [],
|
|
1408
|
+
"save_code": False,
|
|
1409
|
+
"devpars": {"res": 100},
|
|
1410
|
+
},
|
|
1411
|
+
"marker_plots": {
|
|
1412
|
+
"Volcano Plot (diff_pct)": {"plot_type": "volcano_pct"},
|
|
1413
|
+
"Volcano Plot (log2FC)": {"plot_type": "volcano_log2fc"},
|
|
1414
|
+
"Dot Plot": {"plot_type": "dot"},
|
|
1415
|
+
},
|
|
1416
|
+
"enrich_plots_defaults": {
|
|
1417
|
+
"more_formats": [],
|
|
1418
|
+
"save_code": False,
|
|
1419
|
+
"devpars": {"res": 100},
|
|
1420
|
+
},
|
|
1421
|
+
"enrich_plots": {
|
|
1422
|
+
"Bar Plot": {"plot_type": "bar", "ncol": 1, "top_term": 10},
|
|
1423
|
+
},
|
|
1424
|
+
"overlaps_defaults": {
|
|
1425
|
+
"sigmarkers": None,
|
|
1426
|
+
"plot_type": "venn",
|
|
1427
|
+
"more_formats": [],
|
|
1428
|
+
"save_code": False,
|
|
1429
|
+
"devpars": {"res": 100},
|
|
1430
|
+
},
|
|
1431
|
+
"overlaps": {},
|
|
911
1432
|
"cases": {},
|
|
912
|
-
"overlap": [],
|
|
913
1433
|
}
|
|
914
1434
|
order = 5
|
|
915
1435
|
script = "file://../scripts/scrna/MarkersFinder.R"
|
|
@@ -923,40 +1443,66 @@ class TopExpressingGenes(Proc):
|
|
|
923
1443
|
"""Find the top expressing genes in each cluster
|
|
924
1444
|
|
|
925
1445
|
Input:
|
|
926
|
-
srtobj: The seurat object in RDS format
|
|
1446
|
+
srtobj: The seurat object in RDS or qs/qs2 format
|
|
927
1447
|
|
|
928
1448
|
Output:
|
|
929
1449
|
outdir: The output directory for the tables and plots
|
|
930
1450
|
|
|
931
1451
|
Envs:
|
|
932
|
-
mutaters (type=json): The mutaters to mutate the metadata
|
|
1452
|
+
mutaters (type=json): The mutaters to mutate the metadata.
|
|
1453
|
+
You can also use the clone selectors to select the TCR clones/clusters.
|
|
1454
|
+
See <https://pwwang.github.io/scplotter/reference/clone_selectors.html>.
|
|
933
1455
|
ident: The group of cells to find the top expressing genes.
|
|
934
|
-
The cells will be selected by the `
|
|
1456
|
+
The cells will be selected by the `group_by` column with this
|
|
935
1457
|
`ident` value in metadata.
|
|
936
1458
|
If not provided, the top expressing genes will be found for all
|
|
937
|
-
groups of cells in the `
|
|
938
|
-
|
|
1459
|
+
groups of cells in the `group_by` column.
|
|
1460
|
+
group_by: The column name in metadata to group the cells.
|
|
939
1461
|
each: The column name in metadata to separate the cells into different
|
|
940
1462
|
cases.
|
|
941
|
-
|
|
942
|
-
|
|
943
|
-
|
|
944
|
-
|
|
945
|
-
|
|
946
|
-
|
|
947
|
-
|
|
948
|
-
|
|
949
|
-
|
|
950
|
-
|
|
951
|
-
|
|
1463
|
+
dbs (list): The dbs to do enrichment analysis for significant markers.
|
|
1464
|
+
You can use built-in dbs in `enrichit`, or provide your own gmt files.
|
|
1465
|
+
See also <https://pwwang.github.io/enrichit/reference/FetchGMT.html>.
|
|
1466
|
+
The built-in dbs include:
|
|
1467
|
+
* "BioCarta" or "BioCarta_2016"
|
|
1468
|
+
* "GO_Biological_Process" or "GO_Biological_Process_2025"
|
|
1469
|
+
* "GO_Cellular_Component" or "GO_Cellular_Component_2025"
|
|
1470
|
+
* "GO_Molecular_Function" or "GO_Molecular_Function_2025"
|
|
1471
|
+
* "KEGG", "KEGG_Human", "KEGG_2021", or "KEGG_2021_Human"
|
|
1472
|
+
* "Hallmark", "MSigDB_Hallmark", or "MSigDB_Hallmark_2020"
|
|
1473
|
+
* "Reactome", "Reactome_Pathways", or "Reactome_Pathways_2024"
|
|
1474
|
+
* "WikiPathways", "WikiPathways_2024", "WikiPathways_Human", or "WikiPathways_2024_Human"
|
|
1475
|
+
You can also fetch more dbs from <https://maayanlab.cloud/Enrichr/#libraries>.
|
|
952
1476
|
n (type=int): The number of top expressing genes to find.
|
|
1477
|
+
enrich_style (choice): The style of the enrichment analysis.
|
|
1478
|
+
The enrichment analysis will be done by `EnrichIt()` from [`enrichit`](https://pwwang.github.io/enrichit/).
|
|
1479
|
+
Two styles are available:
|
|
1480
|
+
- enrichr: `enrichr` style enrichment analysis (fisher's exact test will be used).
|
|
1481
|
+
- clusterprofiler: `clusterProfiler` style enrichment analysis (hypergeometric test will be used).
|
|
1482
|
+
- clusterProfiler: alias for `clusterprofiler`
|
|
1483
|
+
enrich_plots_defaults (ns): Default options for the plots to generate for the enrichment analysis.
|
|
1484
|
+
- plot_type: The type of the plot.
|
|
1485
|
+
See <https://pwwang.github.io/scplotter/reference/EnrichmentPlot.html>.
|
|
1486
|
+
Available types are `bar`, `dot`, `lollipop`, `network`, `enrichmap` and `wordcloud`.
|
|
1487
|
+
- more_formats (type=list): The extra formats to save the plot in.
|
|
1488
|
+
- save_code (flag): Whether to save the code to generate the plot.
|
|
1489
|
+
- devpars (ns): The device parameters for the plots.
|
|
1490
|
+
- res (type=int): The resolution of the plots.
|
|
1491
|
+
- height (type=int): The height of the plots.
|
|
1492
|
+
- width (type=int): The width of the plots.
|
|
1493
|
+
- <more>: See <https://pwwang.github.io/scplotter/reference/EnrichmentPlot.htmll>.
|
|
1494
|
+
enrich_plots (type=json): Cases of the plots to generate for the enrichment analysis.
|
|
1495
|
+
The keys are the names of the cases and the values are the dicts inherited from `enrich_plots_defaults`.
|
|
1496
|
+
The cases under `envs.cases` can inherit this options.
|
|
1497
|
+
subset: An expression to subset the cells for each case.
|
|
953
1498
|
cases (type=json): If you have multiple cases, you can specify them
|
|
954
1499
|
here. The keys are the names of the cases and the values are the
|
|
955
1500
|
above options except `mutaters`. If some options are
|
|
956
1501
|
not specified, the default values specified above will be used.
|
|
957
1502
|
If no cases are specified, the default case will be added with
|
|
958
|
-
the default values under `envs` with the name `
|
|
959
|
-
"""
|
|
1503
|
+
the default values under `envs` with the name `Top Expressing Genes`.
|
|
1504
|
+
""" # noqa: E501
|
|
1505
|
+
|
|
960
1506
|
input = "srtobj:file"
|
|
961
1507
|
output = "outdir:dir:{{in.srtobj | stem}}.top_expressing_genes"
|
|
962
1508
|
lang = config.lang.rscript
|
|
@@ -964,26 +1510,29 @@ class TopExpressingGenes(Proc):
|
|
|
964
1510
|
envs = {
|
|
965
1511
|
"mutaters": {},
|
|
966
1512
|
"ident": None,
|
|
967
|
-
"
|
|
1513
|
+
"group_by": None,
|
|
968
1514
|
"each": None,
|
|
969
|
-
"
|
|
970
|
-
"section": "DEFAULT",
|
|
971
|
-
"dbs": [
|
|
972
|
-
"GO_Biological_Process_2021",
|
|
973
|
-
"GO_Cellular_Component_2021",
|
|
974
|
-
"GO_Molecular_Function_2021",
|
|
975
|
-
"KEGG_2021_Human",
|
|
976
|
-
],
|
|
1515
|
+
"dbs": ["KEGG_2021_Human", "MSigDB_Hallmark_2020"],
|
|
977
1516
|
"n": 250,
|
|
1517
|
+
"subset": None,
|
|
1518
|
+
"enrich_style": "enrichr",
|
|
1519
|
+
"enrich_plots_defaults": {
|
|
1520
|
+
"more_formats": [],
|
|
1521
|
+
"save_code": False,
|
|
1522
|
+
"devpars": {"res": 100},
|
|
1523
|
+
},
|
|
1524
|
+
"enrich_plots": {
|
|
1525
|
+
"Bar Plot": {"plot_type": "bar", "ncol": 1, "top_term": 10},
|
|
1526
|
+
},
|
|
978
1527
|
"cases": {},
|
|
979
1528
|
}
|
|
980
1529
|
plugin_opts = {
|
|
981
|
-
"report": "file://../reports/
|
|
1530
|
+
"report": "file://../reports/common.svelte",
|
|
982
1531
|
"report_paging": 8,
|
|
983
1532
|
}
|
|
984
1533
|
|
|
985
1534
|
|
|
986
|
-
class
|
|
1535
|
+
class ExprImputation(Proc):
|
|
987
1536
|
"""This process imputes the dropout values in scRNA-seq data.
|
|
988
1537
|
|
|
989
1538
|
It takes the Seurat object as input and outputs the Seurat object with
|
|
@@ -995,13 +1544,13 @@ class ExprImpution(Proc):
|
|
|
995
1544
|
- [Dijk, David van, et al. "MAGIC: A diffusion-based imputation method reveals gene-gene interactions in single-cell RNA-sequencing data." BioRxiv (2017): 111591.](https://www.cell.com/cell/abstract/S0092-8674(18)30724-4)
|
|
996
1545
|
|
|
997
1546
|
Input:
|
|
998
|
-
infile: The input file in RDS format of Seurat object
|
|
1547
|
+
infile: The input file in RDS/qs format of Seurat object
|
|
999
1548
|
|
|
1000
1549
|
Output:
|
|
1001
1550
|
outfile: The output file in RDS format of Seurat object
|
|
1002
|
-
Note that with rmagic and alra, the original
|
|
1003
|
-
renamed to `
|
|
1004
|
-
renamed to `RNA`
|
|
1551
|
+
Note that with rmagic and alra, the original default assay will be
|
|
1552
|
+
renamed to `RAW` and the imputed RNA assay will be
|
|
1553
|
+
renamed to `RNA` and set as default assay.
|
|
1005
1554
|
|
|
1006
1555
|
Envs:
|
|
1007
1556
|
tool (choice): Either alra, scimpute or rmagic
|
|
@@ -1015,6 +1564,9 @@ class ExprImpution(Proc):
|
|
|
1015
1564
|
- refgene: The reference gene file
|
|
1016
1565
|
rmagic_args (ns): The arguments for rmagic
|
|
1017
1566
|
- python: The python path where magic-impute is installed.
|
|
1567
|
+
- threshold (type=float): The threshold for magic imputation.
|
|
1568
|
+
Only the genes with dropout rates greater than this threshold (No. of
|
|
1569
|
+
cells with non-zero expression / total number of cells) will be imputed.
|
|
1018
1570
|
alra_args (type=json): The arguments for `RunALRA()`
|
|
1019
1571
|
|
|
1020
1572
|
Requires:
|
|
@@ -1045,12 +1597,13 @@ class ExprImpution(Proc):
|
|
|
1045
1597
|
- if: {{proc.envs.tool == "alra"}}
|
|
1046
1598
|
- check: {{proc.lang}} <(echo "library(SeuratWrappers)")
|
|
1047
1599
|
""" # noqa: E501
|
|
1600
|
+
|
|
1048
1601
|
input = "infile:file"
|
|
1049
|
-
output = "outfile:file:{{in.infile | stem}}.imputed.
|
|
1602
|
+
output = "outfile:file:{{in.infile | stem}}.imputed.qs"
|
|
1050
1603
|
lang = config.lang.rscript
|
|
1051
1604
|
envs = {
|
|
1052
1605
|
"tool": "alra",
|
|
1053
|
-
"rmagic_args": {"python": config.exe.magic_python},
|
|
1606
|
+
"rmagic_args": {"python": config.exe.magic_python, "threshold": 0.5},
|
|
1054
1607
|
"scimpute_args": {
|
|
1055
1608
|
"drop_thre": 0.5,
|
|
1056
1609
|
"kcluster": None,
|
|
@@ -1059,13 +1612,13 @@ class ExprImpution(Proc):
|
|
|
1059
1612
|
},
|
|
1060
1613
|
"alra_args": {},
|
|
1061
1614
|
}
|
|
1062
|
-
script = "file://../scripts/scrna/
|
|
1615
|
+
script = "file://../scripts/scrna/ExprImputation.R"
|
|
1063
1616
|
|
|
1064
1617
|
|
|
1065
1618
|
class SCImpute(Proc):
|
|
1066
1619
|
"""Impute the dropout values in scRNA-seq data.
|
|
1067
1620
|
|
|
1068
|
-
Deprecated. Use `
|
|
1621
|
+
Deprecated. Use `ExprImputation` instead.
|
|
1069
1622
|
|
|
1070
1623
|
Input:
|
|
1071
1624
|
infile: The input file for imputation
|
|
@@ -1080,10 +1633,10 @@ class SCImpute(Proc):
|
|
|
1080
1633
|
infmt: The input format.
|
|
1081
1634
|
Either `seurat` or `matrix`
|
|
1082
1635
|
"""
|
|
1636
|
+
|
|
1083
1637
|
input = "infile:file, groupfile:file"
|
|
1084
1638
|
output = [
|
|
1085
|
-
"outfile:file:{{in.infile | stem | replace: '.seurat', ''}}."
|
|
1086
|
-
"{{envs.outfmt}}"
|
|
1639
|
+
"outfile:file:{{in.infile | stem | replace: '.seurat', ''}}." "{{envs.outfmt}}"
|
|
1087
1640
|
]
|
|
1088
1641
|
lang = config.lang.rscript
|
|
1089
1642
|
envs = {
|
|
@@ -1121,6 +1674,7 @@ class SeuratFilter(Proc):
|
|
|
1121
1674
|
r-dplyr:
|
|
1122
1675
|
- check: {{proc.lang}} <(echo "library('dplyr')")
|
|
1123
1676
|
"""
|
|
1677
|
+
|
|
1124
1678
|
input = "srtobj:file, filters:var"
|
|
1125
1679
|
output = "outfile:file:{{in.srtobj | stem}}.filtered.RDS"
|
|
1126
1680
|
lang = config.lang.rscript
|
|
@@ -1155,6 +1709,7 @@ class SeuratSubset(Proc):
|
|
|
1155
1709
|
r-dplyr:
|
|
1156
1710
|
- check: {{proc.lang}} <(echo "library('dplyr')")
|
|
1157
1711
|
"""
|
|
1712
|
+
|
|
1158
1713
|
input = "srtobj:file, subsets:var"
|
|
1159
1714
|
output = "outdir:dir:{{in.srtobj | stem}}.subsets"
|
|
1160
1715
|
envs = {"ignore_nas": True}
|
|
@@ -1178,6 +1733,7 @@ class SeuratSplit(Proc):
|
|
|
1178
1733
|
recell: Rename the cell ids using the `by` column
|
|
1179
1734
|
A string of R function taking the original cell ids and `by`
|
|
1180
1735
|
"""
|
|
1736
|
+
|
|
1181
1737
|
input = "srtobj:file, by:var"
|
|
1182
1738
|
output = "outdir:dir:{{in.srtobj | stem}}.subsets"
|
|
1183
1739
|
envs = {
|
|
@@ -1208,6 +1764,7 @@ class Subset10X(Proc):
|
|
|
1208
1764
|
feats_to_keep: The features/genes to keep.
|
|
1209
1765
|
The final features list will be `feats_to_keep` + `nfeats`
|
|
1210
1766
|
"""
|
|
1767
|
+
|
|
1211
1768
|
input = "indir:dir"
|
|
1212
1769
|
output = "outdir:dir:{{in.indir | stem}}"
|
|
1213
1770
|
envs = {
|
|
@@ -1220,7 +1777,7 @@ class Subset10X(Proc):
|
|
|
1220
1777
|
script = "file://../scripts/scrna/Subset10X.R"
|
|
1221
1778
|
|
|
1222
1779
|
|
|
1223
|
-
class
|
|
1780
|
+
class SeuratTo10X(Proc):
|
|
1224
1781
|
"""Write a Seurat object to 10X format
|
|
1225
1782
|
|
|
1226
1783
|
using `write10xCounts` from `DropletUtils`
|
|
@@ -1229,19 +1786,22 @@ class Write10X(Proc):
|
|
|
1229
1786
|
srtobj: The seurat object in RDS
|
|
1230
1787
|
|
|
1231
1788
|
Output:
|
|
1232
|
-
outdir: The output directory
|
|
1789
|
+
outdir: The output directory.
|
|
1790
|
+
When `envs.split_by` is specified, the subdirectories will be
|
|
1791
|
+
created for each distinct value of the column.
|
|
1792
|
+
Otherwise, the matrices will be written to the output directory.
|
|
1233
1793
|
|
|
1234
1794
|
Envs:
|
|
1235
1795
|
version: The version of 10X format
|
|
1236
1796
|
"""
|
|
1797
|
+
|
|
1237
1798
|
input = "srtobj:file"
|
|
1238
1799
|
output = "outdir:dir:{{in.srtobj | stem}}"
|
|
1239
|
-
envs = {"version": "3"}
|
|
1800
|
+
envs = {"version": "3", "split_by": None}
|
|
1240
1801
|
lang = config.lang.rscript
|
|
1241
|
-
script = "file://../scripts/scrna/
|
|
1802
|
+
script = "file://../scripts/scrna/SeuratTo10X.R"
|
|
1242
1803
|
|
|
1243
1804
|
|
|
1244
|
-
@format_placeholder(mutate_helpers_clonesize=MUTATE_HELPERS_CLONESIZE_INDENTED)
|
|
1245
1805
|
class ScFGSEA(Proc):
|
|
1246
1806
|
"""Gene set enrichment analysis for cells in different groups using `fgsea`
|
|
1247
1807
|
|
|
@@ -1259,25 +1819,65 @@ class ScFGSEA(Proc):
|
|
|
1259
1819
|
For each case, the process will generate a table with the enrichment scores for
|
|
1260
1820
|
each gene set, and GSEA plots for the top gene sets.
|
|
1261
1821
|
|
|
1822
|
+
Examples:
|
|
1823
|
+
### The summary and GSEA plots
|
|
1824
|
+
|
|
1825
|
+
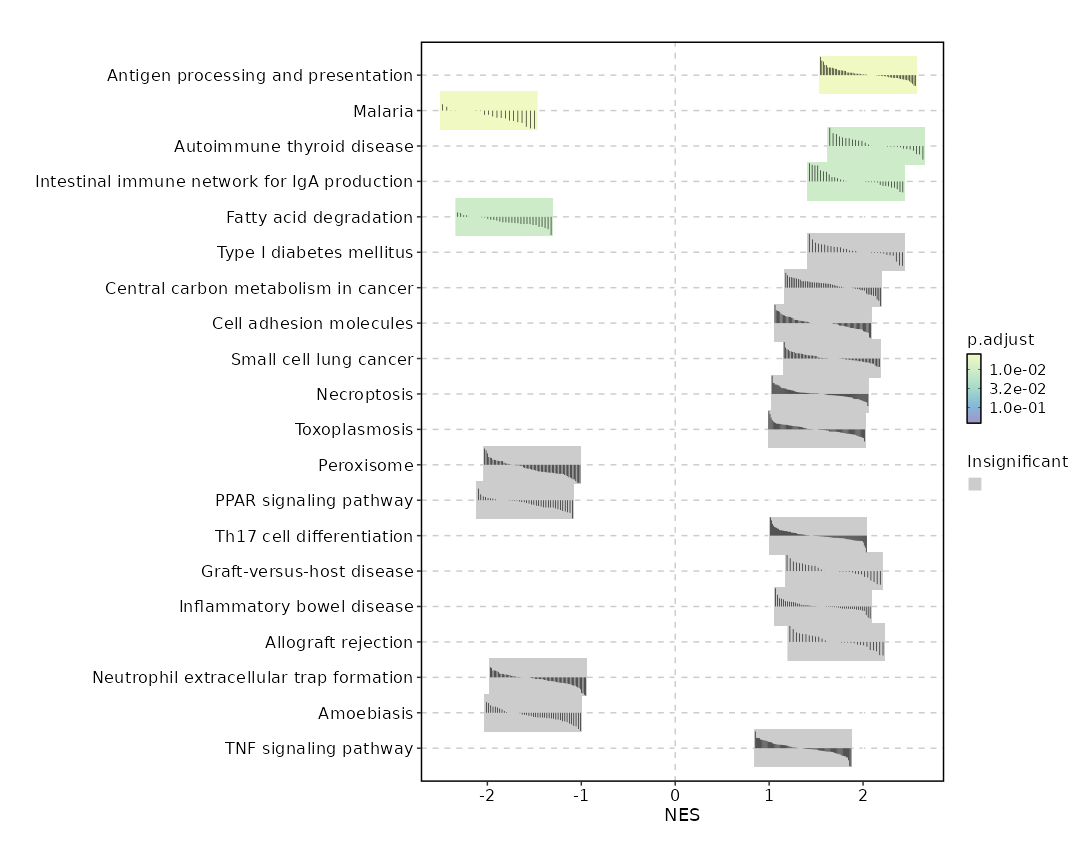{: width="80%"}
|
|
1826
|
+
|
|
1827
|
+
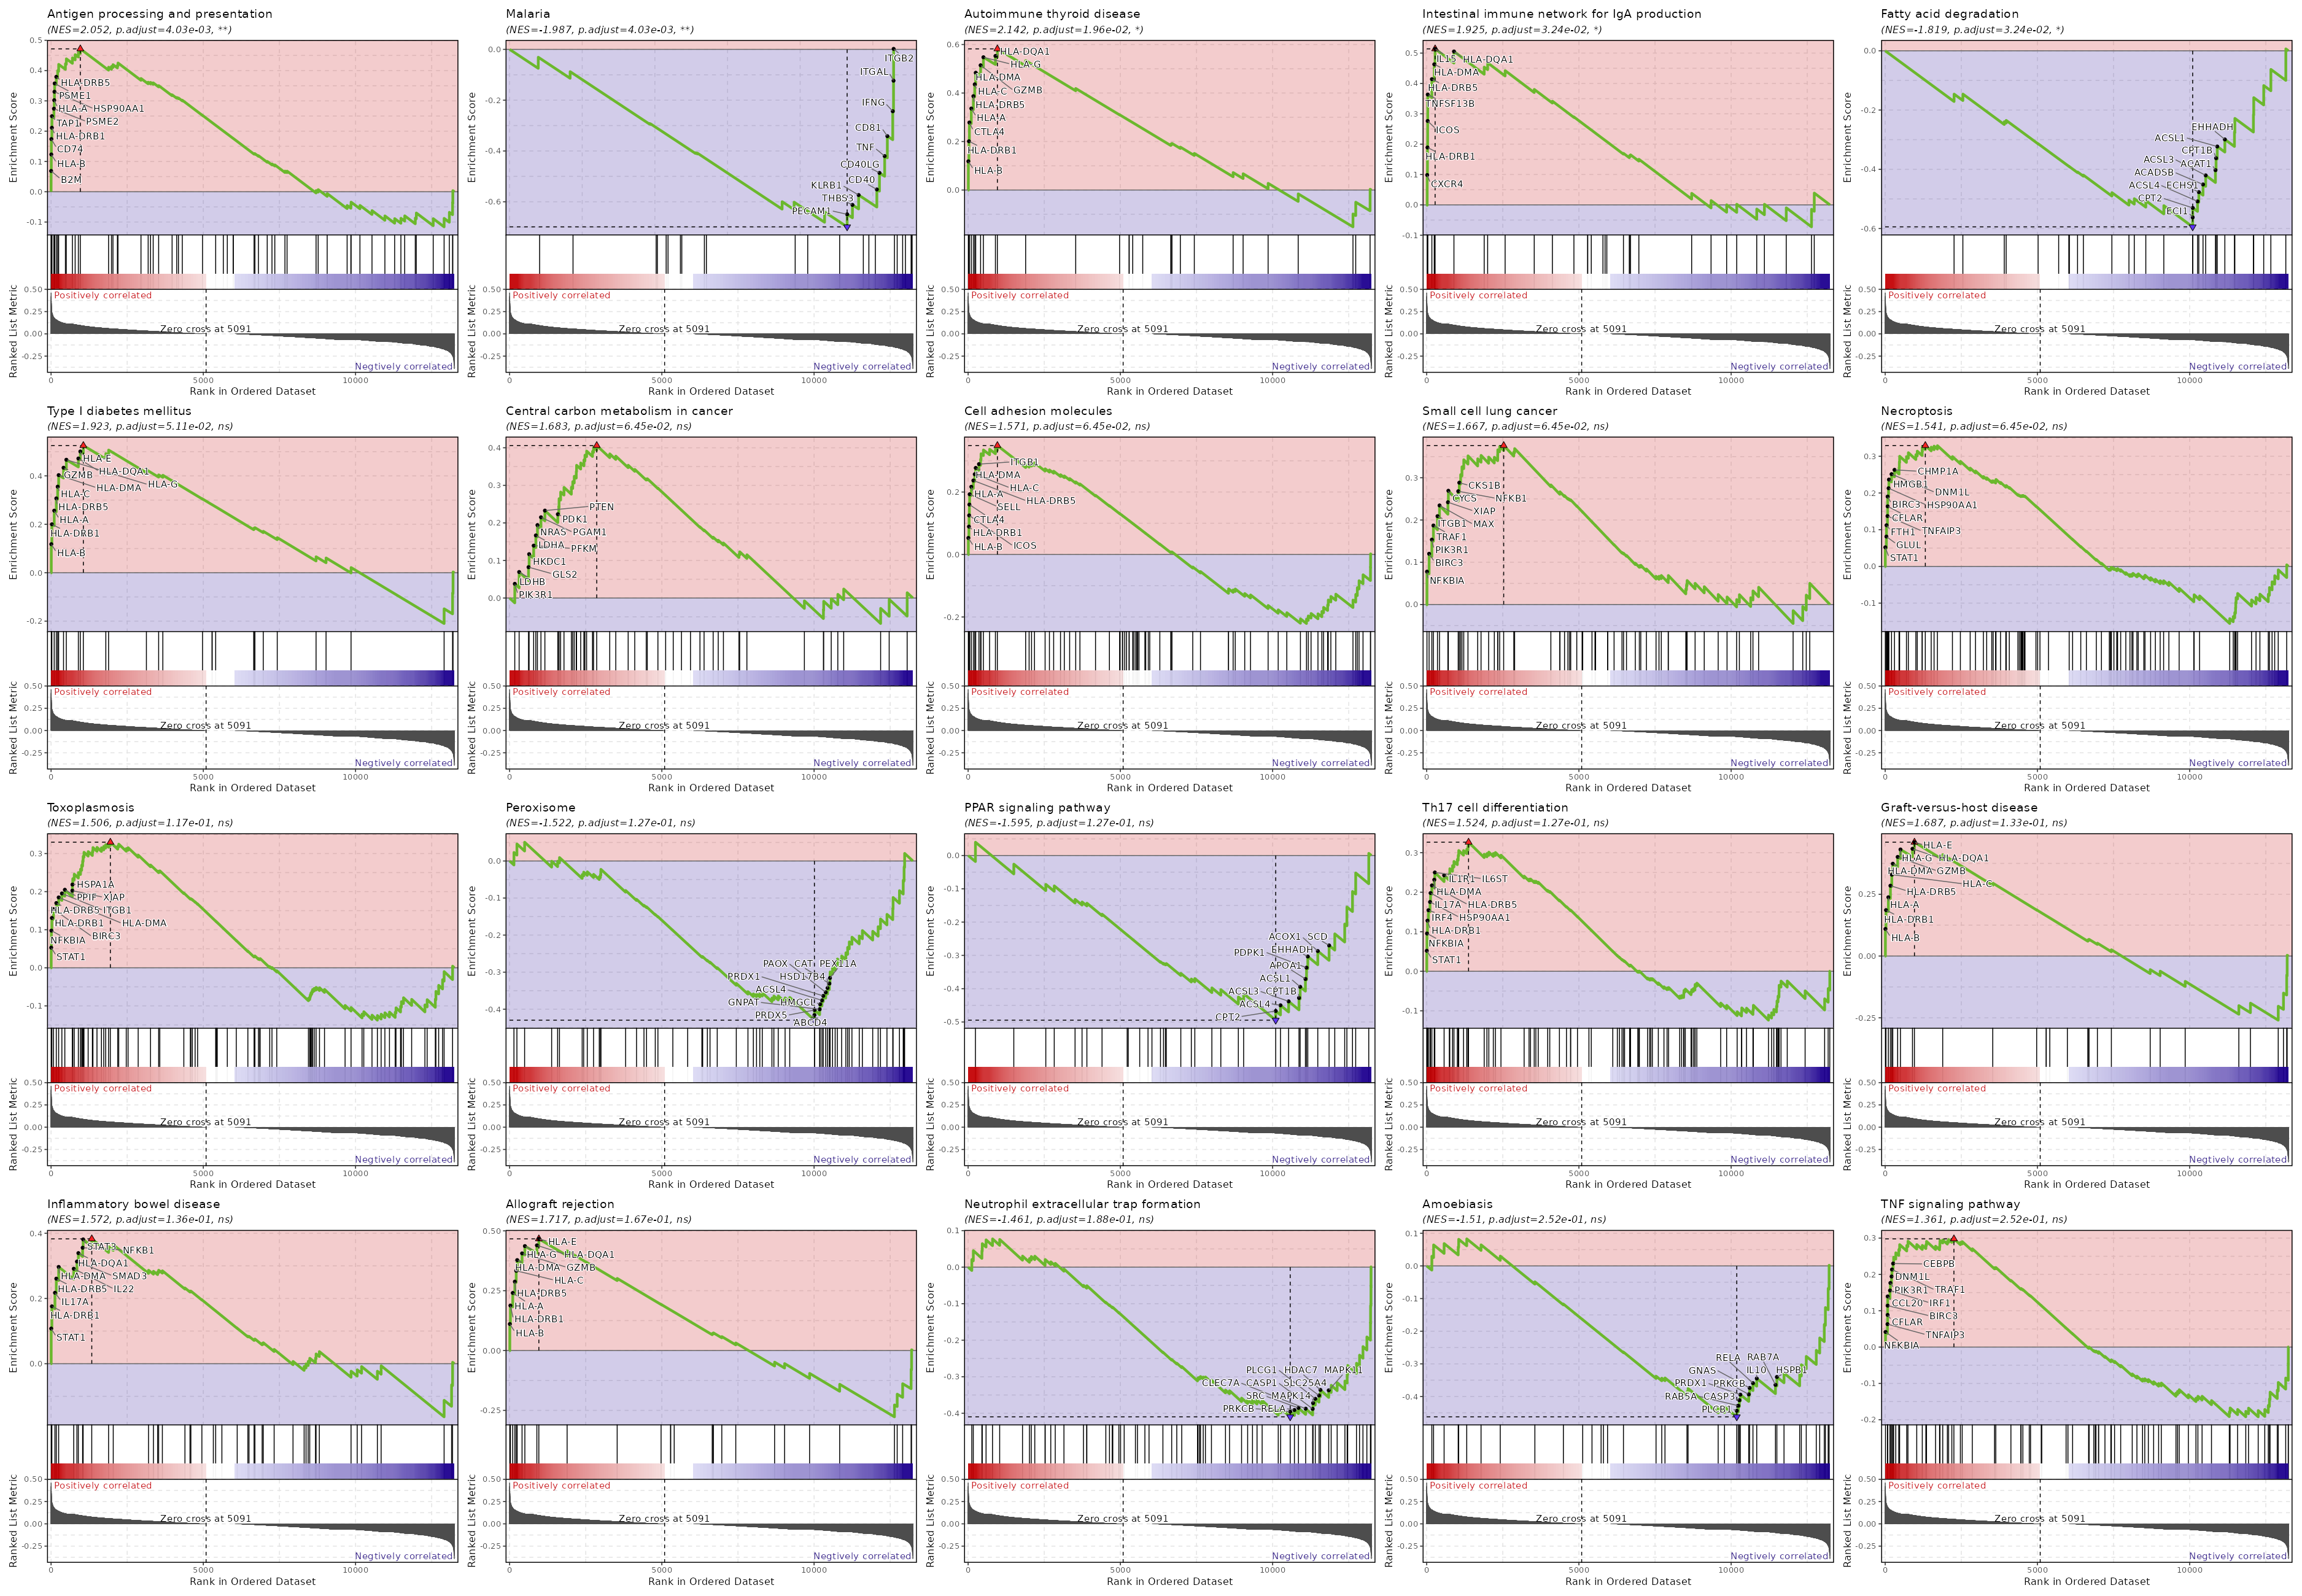{: width="80%"}
|
|
1828
|
+
|
|
1829
|
+
### Summary plot for all subsets or idents
|
|
1830
|
+
|
|
1831
|
+
If you use `each` to separate the cells into different subsets, this is useful to
|
|
1832
|
+
make a summary plot for all subsets. Or if you don't specify `ident_1`, the summary plot for all idents in `group_by` will be generated.
|
|
1833
|
+
|
|
1834
|
+
```toml
|
|
1835
|
+
[ScFGSEA.envs]
|
|
1836
|
+
group_by = "Diagnosis"
|
|
1837
|
+
ident_1 = "Colitis"
|
|
1838
|
+
ident_2 = "Control"
|
|
1839
|
+
each = "seurat_clusters"
|
|
1840
|
+
|
|
1841
|
+
[ScFGSEA.envs.alleach_plots.Heatmap]
|
|
1842
|
+
plot_type = "heatmap"
|
|
1843
|
+
group_by = "Diagnosis"
|
|
1844
|
+
```
|
|
1845
|
+
|
|
1846
|
+
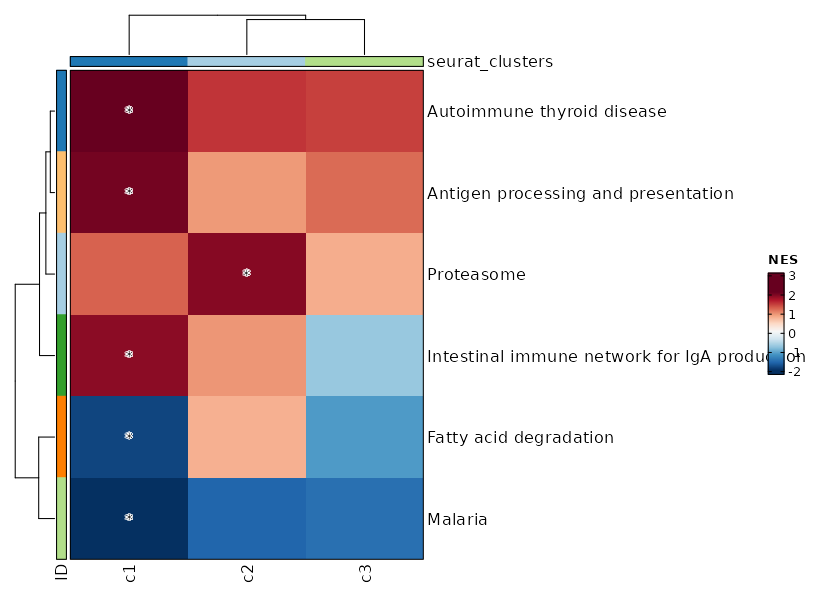{: width="80%"}
|
|
1847
|
+
|
|
1262
1848
|
Input:
|
|
1263
1849
|
srtobj: The seurat object in RDS format
|
|
1264
1850
|
|
|
1265
1851
|
Output:
|
|
1266
|
-
outdir: The output directory for the results
|
|
1852
|
+
outdir: The output directory for the results and plots
|
|
1267
1853
|
|
|
1268
1854
|
Envs:
|
|
1269
1855
|
ncores (type=int): Number of cores for parallelization
|
|
1270
1856
|
Passed to `nproc` of `fgseaMultilevel()`.
|
|
1271
1857
|
mutaters (type=json): The mutaters to mutate the metadata.
|
|
1272
1858
|
The key-value pairs will be passed the `dplyr::mutate()` to mutate the metadata.
|
|
1273
|
-
|
|
1274
|
-
|
|
1275
|
-
|
|
1276
|
-
|
|
1859
|
+
You can also use the clone selectors to select the TCR clones/clusters.
|
|
1860
|
+
See <https://pwwang.github.io/scplotter/reference/clone_selectors.html>.
|
|
1861
|
+
|
|
1862
|
+
group_by: The column name in metadata to group the cells.
|
|
1863
|
+
ident_1: The first group of cells to compare
|
|
1864
|
+
ident_2: The second group of cells to compare, if not provided, the rest of the cells that are not `NA`s in `group_by` column are used for `ident_2`.
|
|
1865
|
+
assay: The assay to use. If not provided, the default assay will be used.
|
|
1277
1866
|
each: The column name in metadata to separate the cells into different subsets to do the analysis.
|
|
1278
|
-
|
|
1279
|
-
|
|
1280
|
-
|
|
1867
|
+
subset: An expression to subset the cells.
|
|
1868
|
+
gmtfile: The pathways in GMT format, with the gene names/ids in the same format as the seurat object.
|
|
1869
|
+
You can use built-in dbs in `enrichit`, or provide your own gmt files.
|
|
1870
|
+
See also <https://pwwang.github.io/enrichit/reference/FetchGMT.html>.
|
|
1871
|
+
The built-in dbs include:
|
|
1872
|
+
* "BioCarta" or "BioCarta_2016"
|
|
1873
|
+
* "GO_Biological_Process" or "GO_Biological_Process_2025"
|
|
1874
|
+
* "GO_Cellular_Component" or "GO_Cellular_Component_2025"
|
|
1875
|
+
* "GO_Molecular_Function" or "GO_Molecular_Function_2025"
|
|
1876
|
+
* "KEGG", "KEGG_Human", "KEGG_2021", or "KEGG_2021_Human"
|
|
1877
|
+
* "Hallmark", "MSigDB_Hallmark", or "MSigDB_Hallmark_2020"
|
|
1878
|
+
* "Reactome", "Reactome_Pathways", or "Reactome_Pathways_2024"
|
|
1879
|
+
* "WikiPathways", "WikiPathways_2024", "WikiPathways_Human", or "WikiPathways_2024_Human"
|
|
1880
|
+
You can also fetch more dbs from <https://maayanlab.cloud/Enrichr/#libraries>.
|
|
1281
1881
|
method (choice): The method to do the preranking.
|
|
1282
1882
|
- signal_to_noise: Signal to noise.
|
|
1283
1883
|
The larger the differences of the means (scaled by the standard deviations);
|
|
@@ -1299,6 +1899,15 @@ class ScFGSEA(Proc):
|
|
|
1299
1899
|
If it is < 1, will apply it to `padj`, selecting pathways with `padj` < `top`.
|
|
1300
1900
|
eps (type=float): This parameter sets the boundary for calculating the p value.
|
|
1301
1901
|
See <https://rdrr.io/bioc/fgsea/man/fgseaMultilevel.html>
|
|
1902
|
+
alleach_plots_defaults (ns): Default options for the plots to generate for all pathways.
|
|
1903
|
+
- plot_type: The type of the plot, currently either dot or heatmap (default)
|
|
1904
|
+
- devpars (ns): The device parameters for the plots.
|
|
1905
|
+
- res (type=int): The resolution of the plots.
|
|
1906
|
+
- height (type=int): The height of the plots.
|
|
1907
|
+
- width (type=int): The width of the plots.
|
|
1908
|
+
- <more>: See <https://pwwang.github.io/biopipen.utils.R/reference/VizGSEA.html>.
|
|
1909
|
+
alleach_plots (type=json): Cases of the plots to generate for all pathways.
|
|
1910
|
+
The keys are the names of the cases and the values are the dicts inherited from `alleach_plots_defaults`.
|
|
1302
1911
|
minsize (type=int): Minimal size of a gene set to test. All pathways below the threshold are excluded.
|
|
1303
1912
|
maxsize (type=int): Maximal size of a gene set to test. All pathways above the threshold are excluded.
|
|
1304
1913
|
rest (type=json;order=98): Rest arguments for [`fgsea()`](https://rdrr.io/bioc/fgsea/man/fgsea.html)
|
|
@@ -1306,7 +1915,7 @@ class ScFGSEA(Proc):
|
|
|
1306
1915
|
cases (type=json;order=99): If you have multiple cases, you can specify them here.
|
|
1307
1916
|
The keys are the names of the cases and the values are the above options except `mutaters`.
|
|
1308
1917
|
If some options are not specified, the default values specified above will be used.
|
|
1309
|
-
If no cases are specified, the default case will be added with the name `
|
|
1918
|
+
If no cases are specified, the default case will be added with the name `GSEA`.
|
|
1310
1919
|
|
|
1311
1920
|
Requires:
|
|
1312
1921
|
bioconductor-fgsea:
|
|
@@ -1314,29 +1923,36 @@ class ScFGSEA(Proc):
|
|
|
1314
1923
|
r-seurat:
|
|
1315
1924
|
- check: {{proc.lang}} -e "library(seurat)"
|
|
1316
1925
|
""" # noqa: E501
|
|
1926
|
+
|
|
1317
1927
|
input = "srtobj:file"
|
|
1318
1928
|
output = "outdir:dir:{{(in.casefile or in.srtobj) | stem0}}.fgsea"
|
|
1319
1929
|
lang = config.lang.rscript
|
|
1320
1930
|
envs = {
|
|
1321
1931
|
"mutaters": {},
|
|
1322
1932
|
"ncores": config.misc.ncores,
|
|
1323
|
-
"
|
|
1324
|
-
"
|
|
1325
|
-
"
|
|
1933
|
+
"assay": None,
|
|
1934
|
+
"group_by": None,
|
|
1935
|
+
"ident_1": None,
|
|
1936
|
+
"ident_2": None,
|
|
1326
1937
|
"each": None,
|
|
1327
|
-
"
|
|
1328
|
-
"gmtfile": "",
|
|
1938
|
+
"subset": None,
|
|
1939
|
+
"gmtfile": "KEGG_2021_Human",
|
|
1329
1940
|
"method": "s2n",
|
|
1330
1941
|
"top": 20,
|
|
1331
1942
|
"minsize": 10,
|
|
1332
1943
|
"maxsize": 100,
|
|
1333
1944
|
"eps": 0,
|
|
1945
|
+
"alleach_plots_defaults": {
|
|
1946
|
+
"plot_type": "heatmap",
|
|
1947
|
+
"devpars": {"res": 100},
|
|
1948
|
+
},
|
|
1949
|
+
"alleach_plots": {},
|
|
1334
1950
|
"rest": {},
|
|
1335
1951
|
"cases": {},
|
|
1336
1952
|
}
|
|
1337
1953
|
script = "file://../scripts/scrna/ScFGSEA.R"
|
|
1338
1954
|
plugin_opts = {
|
|
1339
|
-
"report": "file://../reports/
|
|
1955
|
+
"report": "file://../reports/common.svelte",
|
|
1340
1956
|
"report_paging": 8,
|
|
1341
1957
|
}
|
|
1342
1958
|
|
|
@@ -1349,13 +1965,18 @@ class CellTypeAnnotation(Proc):
|
|
|
1349
1965
|
3. Use [`scCATCH`](https://github.com/ZJUFanLab/scCATCH)
|
|
1350
1966
|
4. Use [`hitype`](https://github.com/pwwang/hitype)
|
|
1351
1967
|
|
|
1352
|
-
The annotated cell types will replace the original
|
|
1968
|
+
The annotated cell types will replace the original identity column in the metadata,
|
|
1353
1969
|
so that the downstream processes will use the annotated cell types.
|
|
1354
1970
|
|
|
1355
|
-
|
|
1971
|
+
/// Note
|
|
1972
|
+
|
|
1973
|
+
When cell types are annotated, the original identity column (e.g. `seurat_clusters`) will be renamed
|
|
1974
|
+
to `envs.backup_col` (e.g. `seurat_clusters_id`), and the new identity column will be added.
|
|
1975
|
+
|
|
1976
|
+
///
|
|
1356
1977
|
|
|
1357
1978
|
If you are using `ScType`, `scCATCH`, or `hitype`, a text file containing the mapping from
|
|
1358
|
-
the
|
|
1979
|
+
the original identity to the new cell types will be generated and saved to
|
|
1359
1980
|
`cluster2celltype.tsv` under `<workdir>/<pipline_name>/CellTypeAnnotation/0/output/`.
|
|
1360
1981
|
|
|
1361
1982
|
Examples:
|
|
@@ -1375,10 +1996,14 @@ class CellTypeAnnotation(Proc):
|
|
|
1375
1996
|
```
|
|
1376
1997
|
|
|
1377
1998
|
Input:
|
|
1378
|
-
sobjfile: The
|
|
1999
|
+
sobjfile: The single-cell object in RDS/qs/qs2/h5ad format.
|
|
1379
2000
|
|
|
1380
2001
|
Output:
|
|
1381
|
-
outfile: The rds file of seurat object with cell type annotated
|
|
2002
|
+
outfile: The rds/qs/qs2/h5ad file of seurat object with cell type annotated.
|
|
2003
|
+
A text file containing the mapping from the old identity to the new cell types
|
|
2004
|
+
will be generated and saved to `cluster2celltype.tsv` under the job output directory.
|
|
2005
|
+
Note that if `envs.ident` is specified, the output Seurat object will have
|
|
2006
|
+
the identity set to the specified column in metadata.
|
|
1382
2007
|
|
|
1383
2008
|
Envs:
|
|
1384
2009
|
tool (choice): The tool to use for cell type annotation.
|
|
@@ -1388,12 +2013,21 @@ class CellTypeAnnotation(Proc):
|
|
|
1388
2013
|
See <https://github.com/pwwang/hitype>
|
|
1389
2014
|
- sccatch: Use `scCATCH` to annotate cell types.
|
|
1390
2015
|
See <https://github.com/ZJUFanLab/scCATCH>
|
|
2016
|
+
- celltypist: Use `celltypist` to annotate cell types.
|
|
2017
|
+
See <https://github.com/Teichlab/celltypist>
|
|
1391
2018
|
- direct: Directly assign cell types
|
|
1392
2019
|
sctype_tissue: The tissue to use for `sctype`.
|
|
1393
2020
|
Avaiable tissues should be the first column (`tissueType`) of `sctype_db`.
|
|
1394
2021
|
If not specified, all rows in `sctype_db` will be used.
|
|
1395
2022
|
sctype_db: The database to use for sctype.
|
|
1396
2023
|
Check examples at <https://github.com/IanevskiAleksandr/sc-type/blob/master/ScTypeDB_full.xlsx>
|
|
2024
|
+
ident: The column name in metadata to use as the clusters.
|
|
2025
|
+
If not specified, the identity column will be used when input is rds/qs/qs2 (supposing we have a Seurat object).
|
|
2026
|
+
If input data is h5ad, this is required to run cluster-based annotation tools.
|
|
2027
|
+
For `celltypist`, this is a shortcut to set `over_clustering` in `celltypist_args`.
|
|
2028
|
+
backup_col: The backup column name to store the original identities.
|
|
2029
|
+
If not specified, the original identity column will not be stored.
|
|
2030
|
+
If `envs.newcol` is specified, this will be ignored.
|
|
1397
2031
|
hitype_tissue: The tissue to use for `hitype`.
|
|
1398
2032
|
Avaiable tissues should be the first column (`tissueType`) of `hitype_db`.
|
|
1399
2033
|
If not specified, all rows in `hitype_db` will be used.
|
|
@@ -1403,28 +2037,56 @@ class CellTypeAnnotation(Proc):
|
|
|
1403
2037
|
You can also use built-in databases, including `hitypedb_short`, `hitypedb_full`, and `hitypedb_pbmc3k`.
|
|
1404
2038
|
cell_types (list): The cell types to use for direct annotation.
|
|
1405
2039
|
You can use `"-"` or `""` as the placeholder for the clusters that
|
|
1406
|
-
you want to keep the original cell types
|
|
2040
|
+
you want to keep the original cell types.
|
|
1407
2041
|
If the length of `cell_types` is shorter than the number of
|
|
1408
2042
|
clusters, the remaining clusters will be kept as the original cell
|
|
1409
2043
|
types.
|
|
2044
|
+
You can also use `NA` to remove the clusters from downstream analysis. This
|
|
2045
|
+
only works when `envs.newcol` is not specified.
|
|
1410
2046
|
|
|
1411
2047
|
/// Note
|
|
1412
2048
|
If `tool` is `direct` and `cell_types` is not specified or an empty list,
|
|
1413
2049
|
the original cell types will be kept and nothing will be changed.
|
|
1414
2050
|
///
|
|
1415
2051
|
|
|
2052
|
+
more_cell_types (type=json): The additional cell type annotations to add to the metadata.
|
|
2053
|
+
The keys are the new column names and the values are the cell types lists.
|
|
2054
|
+
The cell type lists work the same as `cell_types` above.
|
|
2055
|
+
This is useful when you want to keep multiple annotations of cell types.
|
|
2056
|
+
|
|
1416
2057
|
sccatch_args (ns): The arguments for `scCATCH::findmarkergene()` if `tool` is `sccatch`.
|
|
1417
|
-
- species
|
|
1418
|
-
- Human: Human cells.
|
|
1419
|
-
- Mouse: Mouse cells.
|
|
2058
|
+
- species: The specie of cells.
|
|
1420
2059
|
- cancer: If the sample is from cancer tissue, then the cancer type may be defined.
|
|
1421
2060
|
- tissue: Tissue origin of cells must be defined.
|
|
2061
|
+
- marker: The marker genes for cell type identification.
|
|
2062
|
+
- if_use_custom_marker (flag): Whether to use custom marker genes. If `True`, no `species`, `cancer`, and `tissue` are needed.
|
|
1422
2063
|
- <more>: Other arguments for [`scCATCH::findmarkergene()`](https://rdrr.io/cran/scCATCH/man/findmarkergene.html).
|
|
1423
2064
|
You can pass an RDS file to `sccatch_args.marker` to work as custom marker. If so,
|
|
1424
2065
|
`if_use_custom_marker` will be set to `TRUE` automatically.
|
|
2066
|
+
celltypist_args (ns): The arguments for `celltypist::celltypist()` if `tool` is `celltypist`.
|
|
2067
|
+
- model: The path to model file.
|
|
2068
|
+
- python: The python path where celltypist is installed.
|
|
2069
|
+
- majority_voting: When true, it refines cell identities within local subclusters after an over-clustering approach
|
|
2070
|
+
at the cost of increased runtime.
|
|
2071
|
+
- over_clustering (type=auto): The column name in metadata to use as clusters for majority voting.
|
|
2072
|
+
Set to `False` to disable over-clustering.
|
|
2073
|
+
When `in.sobjfile` is rds/qs/qs2 (supposing we have a Seurat object), the default ident is used by default.
|
|
2074
|
+
Otherwise, it is False by default.
|
|
2075
|
+
- assay: When converting a Seurat object to AnnData, the assay to use.
|
|
2076
|
+
If input is h5seurat, this defaults to RNA.
|
|
2077
|
+
If input is Seurat object in RDS, this defaults to the default assay.
|
|
2078
|
+
merge (flag): Whether to merge the clusters with the same cell types.
|
|
2079
|
+
Otherwise, a suffix will be added to the cell types (ie. `.1`, `.2`, etc).
|
|
1425
2080
|
newcol: The new column name to store the cell types.
|
|
1426
|
-
If not specified, the
|
|
1427
|
-
If specified, the original
|
|
2081
|
+
If not specified, the identity column will be overwritten.
|
|
2082
|
+
If specified, the original identity column will be kept and `Idents` will be kept as the original identity.
|
|
2083
|
+
outtype (choice): The output file type. Currently only works for `celltypist`.
|
|
2084
|
+
An RDS file will be generated for other tools.
|
|
2085
|
+
- input: Use the same file type as the input.
|
|
2086
|
+
- rds: Use RDS file.
|
|
2087
|
+
- qs: Use qs2 file.
|
|
2088
|
+
- qs2: Use qs2 file.
|
|
2089
|
+
- h5ad: Use AnnData file.
|
|
1428
2090
|
|
|
1429
2091
|
Requires:
|
|
1430
2092
|
r-HGNChelper:
|
|
@@ -1440,18 +2102,41 @@ class CellTypeAnnotation(Proc):
|
|
|
1440
2102
|
- if: {{proc.envs.tool == 'sctype'}}
|
|
1441
2103
|
- check: {{proc.lang}} -e "library(openxlsx)"
|
|
1442
2104
|
""" # noqa: E501
|
|
2105
|
+
|
|
1443
2106
|
input = "sobjfile:file"
|
|
1444
|
-
output =
|
|
2107
|
+
output = (
|
|
2108
|
+
"outfile:file:"
|
|
2109
|
+
"{{in.sobjfile | stem}}.annotated."
|
|
2110
|
+
"{{- ext0(in.sobjfile) if envs.outtype == 'input' else envs.outtype -}}"
|
|
2111
|
+
)
|
|
1445
2112
|
lang = config.lang.rscript
|
|
1446
2113
|
envs = {
|
|
1447
2114
|
"tool": "hitype",
|
|
1448
2115
|
"sctype_tissue": None,
|
|
1449
2116
|
"sctype_db": config.ref.sctype_db,
|
|
2117
|
+
"ident": None,
|
|
2118
|
+
"backup_col": "seurat_clusters_id",
|
|
1450
2119
|
"cell_types": [],
|
|
1451
|
-
"
|
|
2120
|
+
"more_cell_types": None,
|
|
2121
|
+
"sccatch_args": {
|
|
2122
|
+
"species": None,
|
|
2123
|
+
"cancer": "Normal",
|
|
2124
|
+
"tissue": None,
|
|
2125
|
+
"marker": None,
|
|
2126
|
+
"if_use_custom_marker": False,
|
|
2127
|
+
},
|
|
1452
2128
|
"hitype_tissue": None,
|
|
1453
2129
|
"hitype_db": None,
|
|
2130
|
+
"celltypist_args": {
|
|
2131
|
+
"model": None,
|
|
2132
|
+
"python": config.lang.python,
|
|
2133
|
+
"majority_voting": True,
|
|
2134
|
+
"over_clustering": None,
|
|
2135
|
+
"assay": None,
|
|
2136
|
+
},
|
|
2137
|
+
"merge": False,
|
|
1454
2138
|
"newcol": None,
|
|
2139
|
+
"outtype": "input",
|
|
1455
2140
|
}
|
|
1456
2141
|
script = "file://../scripts/scrna/CellTypeAnnotation.R"
|
|
1457
2142
|
|
|
@@ -1466,78 +2151,135 @@ class SeuratMap2Ref(Proc):
|
|
|
1466
2151
|
sobjfile: The seurat object
|
|
1467
2152
|
|
|
1468
2153
|
Output:
|
|
1469
|
-
outfile: The rds file of seurat object with cell type annotated
|
|
2154
|
+
outfile: The rds file of seurat object with cell type annotated.
|
|
2155
|
+
Note that the reduction name will be `ref.umap` for the mapping.
|
|
2156
|
+
To visualize the mapping, you should use `ref.umap` as the reduction name.
|
|
1470
2157
|
|
|
1471
2158
|
Envs:
|
|
1472
|
-
|
|
1473
|
-
|
|
1474
|
-
|
|
1475
|
-
|
|
1476
|
-
|
|
1477
|
-
|
|
1478
|
-
is
|
|
2159
|
+
ncores (type=int;order=-100): Number of cores to use.
|
|
2160
|
+
When `split_by` is used, this will be the number of cores for each object to map to the reference.
|
|
2161
|
+
When `split_by` is not used, this is used in `future::plan(strategy = "multicore", workers = <ncores>)`
|
|
2162
|
+
to parallelize some Seurat procedures.
|
|
2163
|
+
See also: <https://satijalab.org/seurat/archive/v3.0/future_vignette.html>
|
|
2164
|
+
mutaters (type=json): The mutaters to mutate the metadata.
|
|
2165
|
+
This is helpful when we want to create new columns for `split_by`.
|
|
2166
|
+
use: A column name of metadata from the reference
|
|
2167
|
+
(e.g. `celltype.l1`, `celltype.l2`) to transfer to the query as the
|
|
2168
|
+
cell types (ident) for downstream analysis. This field is required.
|
|
2169
|
+
If you want to transfer multiple columns, you can use
|
|
2170
|
+
`envs.MapQuery.refdata`.
|
|
2171
|
+
ident: The name of the ident for query transferred from `envs.use` of the reference.
|
|
1479
2172
|
ref: The reference seurat object file.
|
|
1480
2173
|
Either an RDS file or a h5seurat file that can be loaded by
|
|
1481
2174
|
`Seurat::LoadH5Seurat()`.
|
|
1482
2175
|
The file type is determined by the extension. `.rds` or `.RDS` for
|
|
1483
2176
|
RDS file, `.h5seurat` or `.h5` for h5seurat file.
|
|
2177
|
+
refnorm (choice): Normalization method the reference used. The same method will be used for the query.
|
|
2178
|
+
- LogNormalize: Using [`NormalizeData`](https://satijalab.org/seurat/reference/normalizedata).
|
|
2179
|
+
- SCTransform: Using [`SCTransform`](https://satijalab.org/seurat/reference/sctransform).
|
|
2180
|
+
- SCT: Alias of SCTransform.
|
|
2181
|
+
- auto: Automatically detect the normalization method.
|
|
2182
|
+
If the default assay of reference is `SCT`, then `SCTransform` will be used.
|
|
2183
|
+
split_by: The column name in metadata to split the query into multiple objects.
|
|
2184
|
+
This helps when the original query is too large to process.
|
|
2185
|
+
skip_if_normalized: Skip normalization if the query is already normalized.
|
|
2186
|
+
Since the object is supposed to be generated by `SeuratPreparing`, it is already normalized.
|
|
2187
|
+
However, a different normalization method may be used.
|
|
2188
|
+
If the reference is normalized by the same method as the query, the normalization can be skipped.
|
|
2189
|
+
Otherwise, the normalization cannot be skipped.
|
|
2190
|
+
The normalization method used for the query set is determined by the default assay.
|
|
2191
|
+
If `SCT`, then `SCTransform` is used; otherwise, `NormalizeData` is used.
|
|
2192
|
+
You can set this to `False` to force re-normalization (with or without the arguments previously used).
|
|
1484
2193
|
SCTransform (ns): Arguments for [`SCTransform()`](https://satijalab.org/seurat/reference/sctransform)
|
|
1485
|
-
- do-correct-umi (flag): Place corrected UMI matrix in assay counts
|
|
2194
|
+
- do-correct-umi (flag): Place corrected UMI matrix in assay counts layer?
|
|
1486
2195
|
- do-scale (flag): Whether to scale residuals to have unit variance?
|
|
1487
2196
|
- do-center (flag): Whether to center residuals to have mean zero?
|
|
1488
2197
|
- <more>: See <https://satijalab.org/seurat/reference/sctransform>.
|
|
1489
2198
|
Note that the hyphen (`-`) will be transformed into `.` for the keys.
|
|
2199
|
+
NormalizeData (ns): Arguments for [`NormalizeData()`](https://satijalab.org/seurat/reference/normalizedata)
|
|
2200
|
+
- normalization-method: Normalization method.
|
|
2201
|
+
- <more>: See <https://satijalab.org/seurat/reference/normalizedata>.
|
|
2202
|
+
Note that the hyphen (`-`) will be transformed into `.` for the keys.
|
|
1490
2203
|
FindTransferAnchors (ns): Arguments for [`FindTransferAnchors()`](https://satijalab.org/seurat/reference/findtransferanchors)
|
|
1491
2204
|
- normalization-method (choice): Name of normalization method used.
|
|
1492
2205
|
- LogNormalize: Log-normalize the data matrix
|
|
1493
2206
|
- SCT: Scale data using the SCTransform method
|
|
2207
|
+
- auto: Automatically detect the normalization method.
|
|
2208
|
+
See `envs.refnorm`.
|
|
1494
2209
|
- reference-reduction: Name of dimensional reduction to use from the reference if running the pcaproject workflow.
|
|
1495
2210
|
Optionally enables reuse of precomputed reference dimensional reduction.
|
|
1496
2211
|
- <more>: See <https://satijalab.org/seurat/reference/findtransferanchors>.
|
|
1497
2212
|
Note that the hyphen (`-`) will be transformed into `.` for the keys.
|
|
1498
2213
|
MapQuery (ns): Arguments for [`MapQuery()`](https://satijalab.org/seurat/reference/mapquery)
|
|
1499
2214
|
- reference-reduction: Name of reduction to use from the reference for neighbor finding
|
|
1500
|
-
- reduction-model: `DimReduc` object that contains the umap model
|
|
1501
|
-
- refdata (type=json):
|
|
2215
|
+
- reduction-model: `DimReduc` object that contains the umap model.
|
|
2216
|
+
- refdata (type=json): Extra data to transfer from the reference to the query.
|
|
1502
2217
|
- <more>: See <https://satijalab.org/seurat/reference/mapquery>.
|
|
1503
2218
|
Note that the hyphen (`-`) will be transformed into `.` for the keys.
|
|
1504
|
-
|
|
1505
|
-
|
|
1506
|
-
|
|
2219
|
+
cache (type=auto): Whether to cache the information at different steps.
|
|
2220
|
+
If `True`, the seurat object will be cached in the job output directory, which will be not cleaned up when job is rerunning.
|
|
2221
|
+
The cached seurat object will be saved as `<signature>.<kind>.RDS` file, where `<signature>` is the signature determined by
|
|
2222
|
+
the input and envs of the process.
|
|
2223
|
+
See <https://github.com/satijalab/seurat/issues/7849>, <https://github.com/satijalab/seurat/issues/5358> and
|
|
2224
|
+
<https://github.com/satijalab/seurat/issues/6748> for more details also about reproducibility issues.
|
|
2225
|
+
To not use the cached seurat object, you can either set `cache` to `False` or delete the cached file at
|
|
2226
|
+
`<signature>.RDS` in the cache directory.
|
|
2227
|
+
plots (type=json): The plots to generate.
|
|
2228
|
+
The keys are the names of the plots and the values are the arguments for the plot.
|
|
2229
|
+
The arguments will be passed to `biopipen.utils::VizSeuratMap2Ref()` to generate the plots.
|
|
2230
|
+
The plots will be saved to the output directory.
|
|
2231
|
+
See <https://pwwang.github.io/biopipen.utils.R/reference/VizSeuratMap2Ref.html>.
|
|
1507
2232
|
|
|
1508
2233
|
Requires:
|
|
1509
2234
|
r-seurat:
|
|
1510
2235
|
- check: {{proc.lang}} -e "library(Seurat)"
|
|
1511
2236
|
""" # noqa: E501
|
|
2237
|
+
|
|
1512
2238
|
input = "sobjfile:file"
|
|
1513
|
-
output = "outfile:file:{{in.sobjfile | stem}}.
|
|
2239
|
+
output = "outfile:file:{{in.sobjfile | stem}}.qs"
|
|
1514
2240
|
lang = config.lang.rscript
|
|
2241
|
+
envs_depth = 3
|
|
1515
2242
|
envs = {
|
|
1516
|
-
"
|
|
1517
|
-
"
|
|
2243
|
+
"ncores": config.misc.ncores,
|
|
2244
|
+
"use": None,
|
|
2245
|
+
"ident": "seurat_clusters",
|
|
2246
|
+
"mutaters": {},
|
|
1518
2247
|
"ref": None,
|
|
2248
|
+
"refnorm": "auto",
|
|
2249
|
+
"split_by": None,
|
|
2250
|
+
"skip_if_normalized": True,
|
|
1519
2251
|
"SCTransform": {
|
|
1520
2252
|
"do-correct-umi": False,
|
|
1521
2253
|
"do-scale": False,
|
|
1522
2254
|
"do-center": True,
|
|
1523
2255
|
},
|
|
2256
|
+
"NormalizeData": {
|
|
2257
|
+
"normalization-method": "LogNormalize",
|
|
2258
|
+
},
|
|
1524
2259
|
"FindTransferAnchors": {
|
|
1525
|
-
"
|
|
1526
|
-
"reference-reduction": "spca",
|
|
2260
|
+
# "reference-reduction": "spca",
|
|
1527
2261
|
},
|
|
1528
2262
|
"MapQuery": {
|
|
1529
|
-
"reference-reduction": "spca",
|
|
1530
|
-
"reduction-model": "wnn.umap",
|
|
2263
|
+
# "reference-reduction": "spca",
|
|
2264
|
+
# "reduction-model": "wnn.umap",
|
|
1531
2265
|
"refdata": {
|
|
1532
|
-
"celltype-l1": "celltype.l1",
|
|
1533
|
-
"celltype-l2": "celltype.l2",
|
|
1534
|
-
"predicted_ADT": "ADT",
|
|
1535
|
-
}
|
|
2266
|
+
# "celltype-l1": "celltype.l1",
|
|
2267
|
+
# "celltype-l2": "celltype.l2",
|
|
2268
|
+
# "predicted_ADT": "ADT",
|
|
2269
|
+
},
|
|
2270
|
+
},
|
|
2271
|
+
"cache": config.path.tmpdir,
|
|
2272
|
+
"plots": {
|
|
2273
|
+
"Mapped Identity": {
|
|
2274
|
+
"features": "{ident}:{use}",
|
|
2275
|
+
},
|
|
2276
|
+
"Mapping Score": {
|
|
2277
|
+
"features": "{ident}.score",
|
|
2278
|
+
},
|
|
1536
2279
|
},
|
|
1537
|
-
"MappingScore": {},
|
|
1538
2280
|
}
|
|
1539
2281
|
script = "file://../scripts/scrna/SeuratMap2Ref.R"
|
|
1540
|
-
plugin_opts = {"report": "file://../reports/
|
|
2282
|
+
plugin_opts = {"report": "file://../reports/common.svelte"}
|
|
1541
2283
|
|
|
1542
2284
|
|
|
1543
2285
|
class RadarPlots(Proc):
|
|
@@ -1570,7 +2312,7 @@ class RadarPlots(Proc):
|
|
|
1570
2312
|
|
|
1571
2313
|
Then we will have a radar plots like this:
|
|
1572
2314
|
|
|
1573
|
-

|
|
2315
|
+
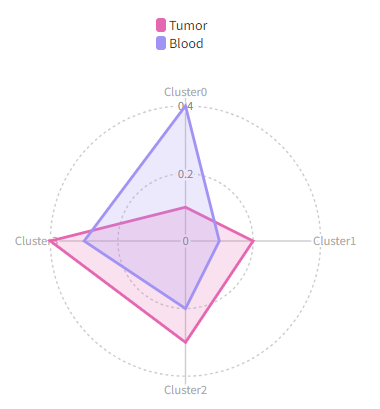
|
|
1574
2316
|
|
|
1575
2317
|
We can use `each` to separate the cells into different cases:
|
|
1576
2318
|
|
|
@@ -1582,7 +2324,7 @@ class RadarPlots(Proc):
|
|
|
1582
2324
|
|
|
1583
2325
|
Then we will have two radar plots, one for `Pre` and one for `Post`:
|
|
1584
2326
|
|
|
1585
|
-

|
|
2327
|
+
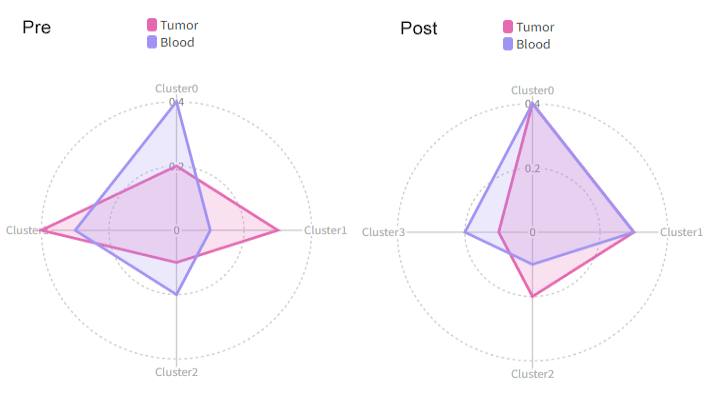
|
|
1586
2328
|
|
|
1587
2329
|
Using `cluster_order` to change the order of the clusters and show only the first 3 clusters:
|
|
1588
2330
|
|
|
@@ -1593,7 +2335,7 @@ class RadarPlots(Proc):
|
|
|
1593
2335
|
breaks = [0, 50, 100] # also change the breaks
|
|
1594
2336
|
```
|
|
1595
2337
|
|
|
1596
|
-

|
|
2338
|
+
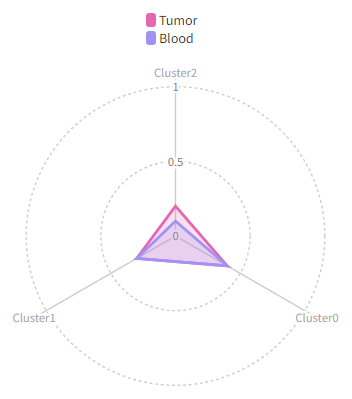
|
|
1597
2339
|
|
|
1598
2340
|
|
|
1599
2341
|
/// Attention
|
|
@@ -1601,7 +2343,7 @@ class RadarPlots(Proc):
|
|
|
1601
2343
|
///
|
|
1602
2344
|
|
|
1603
2345
|
Input:
|
|
1604
|
-
srtobj: The seurat object in RDS format
|
|
2346
|
+
srtobj: The seurat object in RDS or qs/qs2 format
|
|
1605
2347
|
|
|
1606
2348
|
Output:
|
|
1607
2349
|
outdir: The output directory for the plots
|
|
@@ -1622,13 +2364,32 @@ class RadarPlots(Proc):
|
|
|
1622
2364
|
each value in the column.
|
|
1623
2365
|
If specified, `section` will be ignored, and the case name will
|
|
1624
2366
|
be used as the section name.
|
|
2367
|
+
prefix_each (flag): Whether to prefix the `each` column name to the values as the
|
|
2368
|
+
case/section name.
|
|
2369
|
+
breakdown: An additional column with groups to break down the cells
|
|
2370
|
+
distribution in each cluster. For example, if you want to see the
|
|
2371
|
+
distribution of the cells in each cluster in different samples. In
|
|
2372
|
+
this case, you should have multiple values in each `by`. These values
|
|
2373
|
+
won't be plotted in the radar plot, but a barplot will be generated
|
|
2374
|
+
with the mean value of each group and the error bar.
|
|
2375
|
+
test (choice): The test to use to calculate the p values.
|
|
2376
|
+
If there are more than 2 groups in `by`, the p values will be calculated
|
|
2377
|
+
pairwise group by group. Only works when `breakdown` is specified and
|
|
2378
|
+
`by` has 2 groups or more.
|
|
2379
|
+
- wilcox: Wilcoxon rank sum test
|
|
2380
|
+
- t: T test
|
|
2381
|
+
- none: No test will be performed
|
|
1625
2382
|
order (list): The order of the values in `by`. You can also limit
|
|
1626
2383
|
(filter) the values we have in `by`. For example, if column `Source`
|
|
1627
2384
|
has values `Tumor`, `Blood`, `Spleen`, and you only want to plot
|
|
1628
2385
|
`Tumor` and `Blood`, you can set `order` to `["Tumor", "Blood"]`.
|
|
1629
2386
|
This will also have `Tumor` as the first item in the legend and `Blood`
|
|
1630
2387
|
as the second item.
|
|
1631
|
-
|
|
2388
|
+
colors: The colors for the groups in `by`. If not specified,
|
|
2389
|
+
the default colors will be used.
|
|
2390
|
+
Multiple colors can be separated by comma (`,`).
|
|
2391
|
+
You can specify `biopipen` to use the `biopipen` palette.
|
|
2392
|
+
ident: The column name of the cluster information.
|
|
1632
2393
|
cluster_order (list): The order of the clusters.
|
|
1633
2394
|
You may also use it to filter the clusters. If not given,
|
|
1634
2395
|
all clusters will be used.
|
|
@@ -1644,6 +2405,11 @@ class RadarPlots(Proc):
|
|
|
1644
2405
|
section: If you want to put multiple cases into a same section
|
|
1645
2406
|
in the report, you can set this option to the name of the section.
|
|
1646
2407
|
Only used in the report.
|
|
2408
|
+
subset: The subset of the cells to do the analysis.
|
|
2409
|
+
bar_devpars (ns): The parameters for `png()` for the barplot
|
|
2410
|
+
- res (type=int): The resolution of the plot
|
|
2411
|
+
- height (type=int): The height of the plot
|
|
2412
|
+
- width (type=int): The width of the plot
|
|
1647
2413
|
devpars (ns): The parameters for `png()`
|
|
1648
2414
|
- res (type=int): The resolution of the plot
|
|
1649
2415
|
- height (type=int): The height of the plot
|
|
@@ -1651,11 +2417,12 @@ class RadarPlots(Proc):
|
|
|
1651
2417
|
cases (type=json): The cases for the multiple radar plots.
|
|
1652
2418
|
Keys are the names of the cases and values are the arguments for
|
|
1653
2419
|
the plots (`each`, `by`, `order`, `breaks`, `direction`,
|
|
1654
|
-
`
|
|
2420
|
+
`ident`, `cluster_order` and `devpars`).
|
|
1655
2421
|
If not cases are given, a default case will be used, with the
|
|
1656
2422
|
key `DEFAULT`.
|
|
1657
2423
|
The keys must be valid string as part of the file name.
|
|
1658
2424
|
""" # noqa: E501
|
|
2425
|
+
|
|
1659
2426
|
input = "srtobj:file"
|
|
1660
2427
|
output = "outdir:dir:{{in.srtobj | stem}}.radar_plots"
|
|
1661
2428
|
lang = config.lang.rscript
|
|
@@ -1664,12 +2431,22 @@ class RadarPlots(Proc):
|
|
|
1664
2431
|
"mutaters": {},
|
|
1665
2432
|
"by": None,
|
|
1666
2433
|
"each": None,
|
|
2434
|
+
"prefix_each": True,
|
|
1667
2435
|
"order": None,
|
|
1668
|
-
"
|
|
2436
|
+
"colors": "biopipen",
|
|
2437
|
+
"ident": "seurat_clusters",
|
|
1669
2438
|
"cluster_order": [],
|
|
2439
|
+
"breakdown": None,
|
|
2440
|
+
"test": "wilcox",
|
|
1670
2441
|
"breaks": [],
|
|
1671
2442
|
"direction": "intra-cluster",
|
|
1672
|
-
"section":
|
|
2443
|
+
"section": "DEFAULT",
|
|
2444
|
+
"subset": None,
|
|
2445
|
+
"bar_devpars": {
|
|
2446
|
+
"res": 100,
|
|
2447
|
+
"width": 1200,
|
|
2448
|
+
"height": 800,
|
|
2449
|
+
},
|
|
1673
2450
|
"devpars": {
|
|
1674
2451
|
"res": 100,
|
|
1675
2452
|
"width": 1200,
|
|
@@ -1682,7 +2459,7 @@ class RadarPlots(Proc):
|
|
|
1682
2459
|
}
|
|
1683
2460
|
|
|
1684
2461
|
|
|
1685
|
-
@
|
|
2462
|
+
@mark(deprecated=True)
|
|
1686
2463
|
class MetaMarkers(Proc):
|
|
1687
2464
|
"""Find markers between three or more groups of cells, using one-way ANOVA
|
|
1688
2465
|
or Kruskal-Wallis test.
|
|
@@ -1708,7 +2485,7 @@ class MetaMarkers(Proc):
|
|
|
1708
2485
|
ncores (type=int): Number of cores to use to parallelize for genes
|
|
1709
2486
|
mutaters (type=json): The mutaters to mutate the metadata
|
|
1710
2487
|
The key-value pairs will be passed the `dplyr::mutate()` to mutate the metadata.
|
|
1711
|
-
|
|
2488
|
+
|
|
1712
2489
|
group-by: The column name in metadata to group the cells.
|
|
1713
2490
|
If only `group-by` is specified, and `idents` are
|
|
1714
2491
|
not specified, markers will be found for all groups in this column.
|
|
@@ -1716,9 +2493,21 @@ class MetaMarkers(Proc):
|
|
|
1716
2493
|
idents: The groups of cells to compare, values should be in the `group-by` column.
|
|
1717
2494
|
each: The column name in metadata to separate the cells into different cases.
|
|
1718
2495
|
prefix_each (flag): Whether to add the `each` value as prefix to the case name.
|
|
1719
|
-
dbs (list): The dbs to do enrichment analysis for significant
|
|
1720
|
-
|
|
1721
|
-
<https://
|
|
2496
|
+
dbs (list): The dbs to do enrichment analysis for significant markers.
|
|
2497
|
+
You can use built-in dbs in `enrichit`, or provide your own gmt files.
|
|
2498
|
+
See also <https://pwwang.github.io/enrichit/reference/FetchGMT.html>.
|
|
2499
|
+
The built-in dbs include:
|
|
2500
|
+
* "BioCarta" or "BioCarta_2016"
|
|
2501
|
+
* "GO_Biological_Process" or "GO_Biological_Process_2025"
|
|
2502
|
+
* "GO_Cellular_Component" or "GO_Cellular_Component_2025"
|
|
2503
|
+
* "GO_Molecular_Function" or "GO_Molecular_Function_2025"
|
|
2504
|
+
* "KEGG", "KEGG_Human", "KEGG_2021", or "KEGG_2021_Human"
|
|
2505
|
+
* "Hallmark", "MSigDB_Hallmark", or "MSigDB_Hallmark_2020"
|
|
2506
|
+
* "Reactome", "Reactome_Pathways", or "Reactome_Pathways_2024"
|
|
2507
|
+
* "WikiPathways", "WikiPathways_2024", "WikiPathways_Human", or "WikiPathways_2024_Human"
|
|
2508
|
+
You can also fetch more dbs from <https://maayanlab.cloud/Enrichr/#libraries>.
|
|
2509
|
+
subset: The subset of the cells to do the analysis.
|
|
2510
|
+
An expression passed to `dplyr::filter()`.
|
|
1722
2511
|
p_adjust (choice): The method to adjust the p values, which can be used to filter the significant markers.
|
|
1723
2512
|
See also <https://rdrr.io/r/stats/p.adjust.html>
|
|
1724
2513
|
- holm: Holm-Bonferroni method
|
|
@@ -1749,6 +2538,7 @@ class MetaMarkers(Proc):
|
|
|
1749
2538
|
If no cases are specified, the default case will be added with
|
|
1750
2539
|
the default values under `envs` with the name `DEFAULT`.
|
|
1751
2540
|
""" # noqa: E501
|
|
2541
|
+
|
|
1752
2542
|
input = "srtobj:file"
|
|
1753
2543
|
output = "outdir:dir:{{in.srtobj | stem}}.meta_markers"
|
|
1754
2544
|
lang = config.lang.rscript
|
|
@@ -1759,14 +2549,10 @@ class MetaMarkers(Proc):
|
|
|
1759
2549
|
"group-by": None,
|
|
1760
2550
|
"idents": None,
|
|
1761
2551
|
"each": None,
|
|
2552
|
+
"subset": None,
|
|
1762
2553
|
"prefix_each": True,
|
|
1763
2554
|
"p_adjust": "BH",
|
|
1764
|
-
"dbs": [
|
|
1765
|
-
"GO_Biological_Process_2021",
|
|
1766
|
-
"GO_Cellular_Component_2021",
|
|
1767
|
-
"GO_Molecular_Function_2021",
|
|
1768
|
-
"KEGG_2021_Human",
|
|
1769
|
-
],
|
|
2555
|
+
"dbs": ["KEGG_2021_Human", "MSigDB_Hallmark_2020"],
|
|
1770
2556
|
"sigmarkers": "p_adjust < 0.05",
|
|
1771
2557
|
"section": "DEFAULT",
|
|
1772
2558
|
"method": "anova",
|
|
@@ -1776,3 +2562,797 @@ class MetaMarkers(Proc):
|
|
|
1776
2562
|
"report": "file://../reports/scrna/MetaMarkers.svelte",
|
|
1777
2563
|
"report_paging": 8,
|
|
1778
2564
|
}
|
|
2565
|
+
|
|
2566
|
+
|
|
2567
|
+
class Seurat2AnnData(Proc):
|
|
2568
|
+
"""Convert seurat object to AnnData
|
|
2569
|
+
|
|
2570
|
+
Input:
|
|
2571
|
+
sobjfile: The seurat object file, in RDS or qs/qs2 format
|
|
2572
|
+
|
|
2573
|
+
Output:
|
|
2574
|
+
outfile: The AnnData file
|
|
2575
|
+
|
|
2576
|
+
Envs:
|
|
2577
|
+
assay: The assay to use for AnnData.
|
|
2578
|
+
If not specified, the default assay will be used.
|
|
2579
|
+
"""
|
|
2580
|
+
|
|
2581
|
+
input = "sobjfile:file"
|
|
2582
|
+
output = "outfile:file:{{in.sobjfile | stem}}.h5ad"
|
|
2583
|
+
lang = config.lang.rscript
|
|
2584
|
+
script = "file://../scripts/scrna/Seurat2AnnData.R"
|
|
2585
|
+
envs = {"assay": None}
|
|
2586
|
+
|
|
2587
|
+
|
|
2588
|
+
class AnnData2Seurat(Proc):
|
|
2589
|
+
"""Convert AnnData to seurat object
|
|
2590
|
+
|
|
2591
|
+
Input:
|
|
2592
|
+
adfile: The AnnData .h5ad file
|
|
2593
|
+
|
|
2594
|
+
Output:
|
|
2595
|
+
outfile: The seurat object file in RDS or qs/qs2 format
|
|
2596
|
+
|
|
2597
|
+
Envs:
|
|
2598
|
+
assay: The assay to use to convert to seurat object.
|
|
2599
|
+
ident: The column name in `adfile.obs` to use as the identity
|
|
2600
|
+
for the seurat object.
|
|
2601
|
+
If not specified, no identity will be set.
|
|
2602
|
+
dotplot_check (type=auto): Whether to do a check with a dot plot.
|
|
2603
|
+
(`scplotter::FeatureStatPlot(plot_type = "dot", ..)` will be used)
|
|
2604
|
+
to see if the conversion is successful.
|
|
2605
|
+
Set to `False` to disable the check.
|
|
2606
|
+
If `True`, top 10 variable genes will be used for the check.
|
|
2607
|
+
You can give a list of genes or a string of genes with comma (`,`) separated
|
|
2608
|
+
to use for the check.
|
|
2609
|
+
"""
|
|
2610
|
+
|
|
2611
|
+
input = "adfile:file"
|
|
2612
|
+
output = "outfile:file:{{in.adfile | stem}}.qs"
|
|
2613
|
+
lang = config.lang.rscript
|
|
2614
|
+
envs = {"assay": "RNA", "ident": None, "dotplot_check": True}
|
|
2615
|
+
script = "file://../scripts/scrna/AnnData2Seurat.R"
|
|
2616
|
+
|
|
2617
|
+
|
|
2618
|
+
class ScSimulation(Proc):
|
|
2619
|
+
"""Simulate single-cell data using splatter.
|
|
2620
|
+
|
|
2621
|
+
See <https://www.bioconductor.org/packages/devel/bioc/vignettes/splatter/inst/doc/splatter.html#2_Quickstart>
|
|
2622
|
+
|
|
2623
|
+
Input:
|
|
2624
|
+
seed: The seed for the simulation
|
|
2625
|
+
You could also use string as the seed, and the seed will be
|
|
2626
|
+
generated by `digest::digest2int()`.
|
|
2627
|
+
So this could also work as a unique identifier for the simulation (ie. Sample ID).
|
|
2628
|
+
|
|
2629
|
+
Output:
|
|
2630
|
+
outfile: The output Seurat object/SingleCellExperiment in qs/qs2 format
|
|
2631
|
+
|
|
2632
|
+
Envs:
|
|
2633
|
+
ngenes (type=int): The number of genes to simulate
|
|
2634
|
+
ncells (type=int): The number of cells to simulate
|
|
2635
|
+
nspikes (type=int): The number of spike-ins to simulate
|
|
2636
|
+
When `ngenes`, `ncells`, and `nspikes` are not specified, the default
|
|
2637
|
+
params from `mockSCE()` will be used. By default, `ngenes = 2000`,
|
|
2638
|
+
`ncells = 200`, and `nspikes = 100`.
|
|
2639
|
+
outtype (choice): The output file type.
|
|
2640
|
+
- seurat: Seurat object
|
|
2641
|
+
- singlecellexperiment: SingleCellExperiment object
|
|
2642
|
+
- sce: alias for `singlecellexperiment`
|
|
2643
|
+
method (choice): which simulation method to use. Options are:
|
|
2644
|
+
- single: produces a single population
|
|
2645
|
+
- groups: produces distinct groups (eg. cell types), or
|
|
2646
|
+
- paths: selects cells from continuous trajectories (eg. differentiation processes)
|
|
2647
|
+
params (ns): Other parameters for simulation.
|
|
2648
|
+
The parameters are initialized `splitEstimate(mockSCE())` and then
|
|
2649
|
+
updated with the given parameters.
|
|
2650
|
+
See <https://rdrr.io/bioc/splatter/man/SplatParams.html>.
|
|
2651
|
+
Hyphens (`-`) will be transformed into dots (`.`) for the keys.
|
|
2652
|
+
""" # noqa: E501
|
|
2653
|
+
|
|
2654
|
+
input = "seed:var"
|
|
2655
|
+
output = "outfile:file:simulatied_{{in.seed}}.RDS"
|
|
2656
|
+
lang = config.lang.rscript
|
|
2657
|
+
envs = {
|
|
2658
|
+
"ngenes": None,
|
|
2659
|
+
"ncells": None,
|
|
2660
|
+
"nspikes": None,
|
|
2661
|
+
"outtype": "seurat",
|
|
2662
|
+
"method": "single",
|
|
2663
|
+
"params": {},
|
|
2664
|
+
}
|
|
2665
|
+
script = "file://../scripts/scrna/ScSimulation.R"
|
|
2666
|
+
|
|
2667
|
+
|
|
2668
|
+
class CellCellCommunication(Proc):
|
|
2669
|
+
"""Cell-cell communication inference
|
|
2670
|
+
|
|
2671
|
+
This is implemented based on [LIANA](https://liana-py.readthedocs.io/en/latest/index.html),
|
|
2672
|
+
which is a Python package for cell-cell communication inference and provides a list of existing
|
|
2673
|
+
methods including [CellPhoneDB](https://github.com/ventolab/CellphoneDB),
|
|
2674
|
+
[Connectome](https://github.com/msraredon/Connectome/), log2FC,
|
|
2675
|
+
[NATMI](https://github.com/forrest-lab/NATMI),
|
|
2676
|
+
[SingleCellSignalR](https://github.com/SCA-IRCM/SingleCellSignalR), Rank_Aggregate, Geometric Mean,
|
|
2677
|
+
[scSeqComm](https://gitlab.com/sysbiobig/scseqcomm), and [CellChat](https://github.com/jinworks/CellChat).
|
|
2678
|
+
|
|
2679
|
+
You can also try `python -c 'import liana; liana.mt.show_methods()'` to see the methods available.
|
|
2680
|
+
|
|
2681
|
+
Note that this process does not do any visualization. You can use `CellCellCommunicationPlots`
|
|
2682
|
+
to visualize the results.
|
|
2683
|
+
|
|
2684
|
+
Reference:
|
|
2685
|
+
- [Review](https://www.ncbi.nlm.nih.gov/pmc/articles/PMC9184522/).
|
|
2686
|
+
- [LIANA](https://www.biorxiv.org/content/10.1101/2023.08.19.553863v1).
|
|
2687
|
+
|
|
2688
|
+
Input:
|
|
2689
|
+
sobjfile: The seurat object file in RDS or h5seurat format or AnnData file.
|
|
2690
|
+
|
|
2691
|
+
Output:
|
|
2692
|
+
outfile: The output file with the 'liana_res' data frame.
|
|
2693
|
+
Stats are provided for both ligand and receptor entities, more specifically: ligand and receptor are
|
|
2694
|
+
the two entities that potentially interact. As a reminder, CCC events are not limited to secreted signalling,
|
|
2695
|
+
but we refer to them as ligand and receptor for simplicity.
|
|
2696
|
+
Also, in the case of heteromeric complexes, the ligand and receptor columns represent the subunit with minimum
|
|
2697
|
+
expression, while *_complex corresponds to the actual complex, with subunits being separated by _.
|
|
2698
|
+
source and target columns represent the source/sender and target/receiver cell identity for each interaction, respectively
|
|
2699
|
+
* `*_props`: represents the proportion of cells that express the entity.
|
|
2700
|
+
By default, any interactions in which either entity is not expressed in above 10%% of cells per cell type
|
|
2701
|
+
is considered as a false positive, under the assumption that since CCC occurs between cell types, a sufficient
|
|
2702
|
+
proportion of cells within should express the genes.
|
|
2703
|
+
* `*_means`: entity expression mean per cell type.
|
|
2704
|
+
* `lr_means`: mean ligand-receptor expression, as a measure of ligand-receptor interaction magnitude.
|
|
2705
|
+
* `cellphone_pvals`: permutation-based p-values, as a measure of interaction specificity.
|
|
2706
|
+
|
|
2707
|
+
A typical output will look like this:
|
|
2708
|
+
|
|
2709
|
+
| ligand | ligand_complex | ligand_props | ligand_trimean | mat_max | receptor | receptor_complex | receptor_props | receptor_trimean | source | target | lr_probs | cellchat_pvals | mag_score | spec_score |
|
|
2710
|
+
|--------|---------------|--------------|----------------|---------|----------|------------------|----------------|------------------|--------|--------|----------|----------------|-----------|------------|
|
|
2711
|
+
| VIM | VIM | 1.00 | 0.36 | 8.73 | CD44 | CD44 | 0.77 | 0.16 | c7 | c3 | 0.10 | 0.00 | 0.10 | 0.00 |
|
|
2712
|
+
| MIF | MIF | 0.97 | 0.22 | 8.73 | CXCR4 | CD74_CXCR4 | 0.87 | 0.26 | c5 | c6 | 0.10 | 0.00 | 0.10 | 0.00 |
|
|
2713
|
+
| HLA-B | HLA-B | 1.00 | 0.44 | 8.73 | KLRD1 | KLRD1 | 0.73 | 0.13 | c9 | c2 | 0.10 | 0.00 | 0.10 | 0.00 |
|
|
2714
|
+
| HMGB1 | HMGB1 | 0.99 | 0.26 | 8.73 | CXCR4 | CXCR4 | 0.81 | 0.21 | c2 | c7 | 0.10 | 0.00 | 0.10 | 0.00 |
|
|
2715
|
+
| CD48 | CD48 | 0.94 | 0.20 | 8.73 | CD2 | CD2 | 0.99 | 0.28 | c7 | c8 | 0.10 | 0.00 | 0.10 | 0.00 |
|
|
2716
|
+
| HLA-C | HLA-C | 1.00 | 0.38 | 8.73 | CD8B | CD8B | 0.73 | 0.15 | c1 | c9 | 0.10 | 0.00 | 0.10 | 0.00 |
|
|
2717
|
+
| LGALS1 | LGALS1 | 0.95 | 0.17 | 8.73 | CD69 | CD69 | 0.99 | 0.34 | c10 | c5 | 0.10 | 0.00 | 0.10 | 0.00 |
|
|
2718
|
+
|
|
2719
|
+
Envs:
|
|
2720
|
+
method (choice): The method to use for cell-cell communication inference.
|
|
2721
|
+
- CellPhoneDB: Use CellPhoneDB method.
|
|
2722
|
+
Magnitude Score: lr_means; Specificity Score: cellphone_pvals.
|
|
2723
|
+
- Connectome: Use Connectome method.
|
|
2724
|
+
- log2FC: Use log2FC method.
|
|
2725
|
+
- NATMI: Use NATMI method.
|
|
2726
|
+
- SingleCellSignalR: Use SingleCellSignalR method.
|
|
2727
|
+
- Rank_Aggregate: Use Rank_Aggregate method.
|
|
2728
|
+
- Geometric_Mean: Use Geometric Mean method.
|
|
2729
|
+
- scSeqComm: Use scSeqComm method.
|
|
2730
|
+
- CellChat: Use CellChat method.
|
|
2731
|
+
- cellphonedb: alias for `CellPhoneDB`
|
|
2732
|
+
- connectome: alias for `Connectome`
|
|
2733
|
+
- log2fc: alias for `log2FC`
|
|
2734
|
+
- natmi: alias for `NATMI`
|
|
2735
|
+
- singlesignaler: alias for `SingleCellSignalR`
|
|
2736
|
+
- rank_aggregate: alias for `Rank_Aggregate`
|
|
2737
|
+
- geometric_mean: alias for `Geometric_Mean`
|
|
2738
|
+
- scseqcomm: alias for `scSeqComm`
|
|
2739
|
+
- cellchat: alias for `CellChat`
|
|
2740
|
+
subset: An expression in string to subset the cells.
|
|
2741
|
+
When a `.rds` or `.h5seurat` file is provided for `in.sobjfile`, you can provide an expression in `R`,
|
|
2742
|
+
which will be passed to `base::subset()` in `R` to subset the cells.
|
|
2743
|
+
But you can always pass an expression in `python` to subset the cells.
|
|
2744
|
+
See <https://anndata.readthedocs.io/en/latest/tutorials/notebooks/getting-started.html#subsetting-using-metadata>.
|
|
2745
|
+
You should use `adata` to refer to the AnnData object. For example, `adata.obs.groups == "g1"` will subset the cells
|
|
2746
|
+
with `groups` equal to `g1`.
|
|
2747
|
+
subset_using: The method to subset the cells.
|
|
2748
|
+
- auto: Automatically detect the method to use.
|
|
2749
|
+
Note that this is not always accurate. We simply check if `[` is in the expression.
|
|
2750
|
+
If so, we use `python` to subset the cells; otherwise, we use `R`.
|
|
2751
|
+
- python: Use python to subset the cells.
|
|
2752
|
+
- r: Use R to subset the cells.
|
|
2753
|
+
split_by: The column name in metadata to split the cells to run the method separately.
|
|
2754
|
+
The results will be combined together with this column in the final output.
|
|
2755
|
+
assay: The assay to use for the analysis.
|
|
2756
|
+
Only works for Seurat object.
|
|
2757
|
+
seed (type=int): The seed for the random number generator.
|
|
2758
|
+
ncores (type=int): The number of cores to use.
|
|
2759
|
+
groupby: The column name in metadata to group the cells.
|
|
2760
|
+
Typically, this column should be the cluster id.
|
|
2761
|
+
If provided input is a Seurat object, the default identity will be used by default.
|
|
2762
|
+
Otherwise, it is recommended to provide this parameter.
|
|
2763
|
+
"seurat_clusters" will be used with a warning if the input is in AnnData format and
|
|
2764
|
+
this parameter is not provided.
|
|
2765
|
+
group_by: alias for `groupby`
|
|
2766
|
+
species (choice): The species of the cells.
|
|
2767
|
+
- human: Human cells, the 'consensus' resource will be used.
|
|
2768
|
+
- mouse: Mouse cells, the 'mouseconsensus' resource will be used.
|
|
2769
|
+
expr_prop (type=float): Minimum expression proportion for the ligands and
|
|
2770
|
+
receptors (+ their subunits) in the corresponding cell identities. Set to 0
|
|
2771
|
+
to return unfiltered results.
|
|
2772
|
+
min_cells (type=int): Minimum cells (per cell identity if grouped by `groupby`)
|
|
2773
|
+
to be considered for downstream analysis.
|
|
2774
|
+
n_perms (type=int): Number of permutations for the permutation test.
|
|
2775
|
+
Relevant only for permutation-based methods (e.g., `CellPhoneDB`).
|
|
2776
|
+
If `0` is passed, no permutation testing is performed.
|
|
2777
|
+
rscript: The path to the Rscript executable used to convert RDS file to AnnData.
|
|
2778
|
+
if `in.sobjfile` is an RDS file, it will be converted to AnnData file (h5ad).
|
|
2779
|
+
You need `Seurat`, `SeuratDisk` and `digest` installed.
|
|
2780
|
+
<more>: Other arguments for the method.
|
|
2781
|
+
The arguments are passed to the method directly.
|
|
2782
|
+
See the method documentation for more details and also
|
|
2783
|
+
`help(liana.mt.<method>.__call__)` in Python.
|
|
2784
|
+
""" # noqa: E501
|
|
2785
|
+
|
|
2786
|
+
input = "sobjfile:file"
|
|
2787
|
+
output = "outfile:file:{{in.sobjfile | stem}}-ccc.txt"
|
|
2788
|
+
lang = config.lang.python
|
|
2789
|
+
envs = {
|
|
2790
|
+
"method": "cellchat",
|
|
2791
|
+
"assay": None,
|
|
2792
|
+
"seed": 1337,
|
|
2793
|
+
"subset": None,
|
|
2794
|
+
"subset_using": "auto",
|
|
2795
|
+
"split_by": None,
|
|
2796
|
+
"ncores": config.misc.ncores,
|
|
2797
|
+
"groupby": None,
|
|
2798
|
+
"group_by": None,
|
|
2799
|
+
"species": "human",
|
|
2800
|
+
"expr_prop": 0.1,
|
|
2801
|
+
"min_cells": 5,
|
|
2802
|
+
"n_perms": 1000,
|
|
2803
|
+
"rscript": config.lang.rscript,
|
|
2804
|
+
}
|
|
2805
|
+
script = "file://../scripts/scrna/CellCellCommunication.py"
|
|
2806
|
+
|
|
2807
|
+
|
|
2808
|
+
class CellCellCommunicationPlots(Proc):
|
|
2809
|
+
"""Visualization for cell-cell communication inference.
|
|
2810
|
+
|
|
2811
|
+
Examples:
|
|
2812
|
+
### Network Plot
|
|
2813
|
+
|
|
2814
|
+
```toml
|
|
2815
|
+
[CellCellCommunicationPlots.envs.cases."Cell-Cell Communication Network"]
|
|
2816
|
+
plot_type = "network"
|
|
2817
|
+
legend-position = "none"
|
|
2818
|
+
theme = "theme_blank"
|
|
2819
|
+
theme_args = {add_coord = false}
|
|
2820
|
+
```
|
|
2821
|
+
|
|
2822
|
+
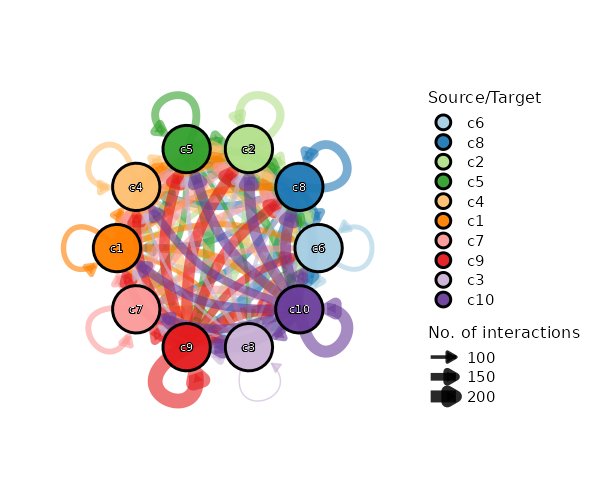{: width="80%"}
|
|
2823
|
+
|
|
2824
|
+
### Circos Plot
|
|
2825
|
+
|
|
2826
|
+
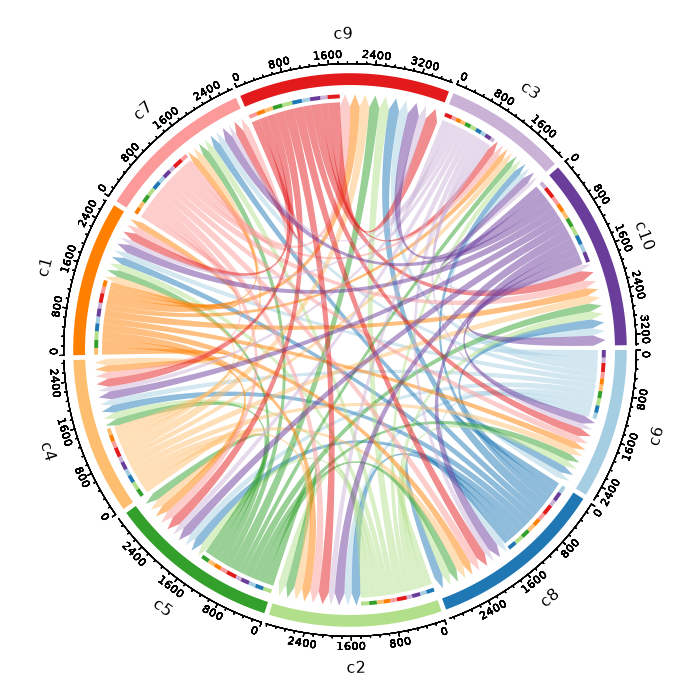{: width="80%"}
|
|
2827
|
+
|
|
2828
|
+
### Heatmap Plot
|
|
2829
|
+
|
|
2830
|
+
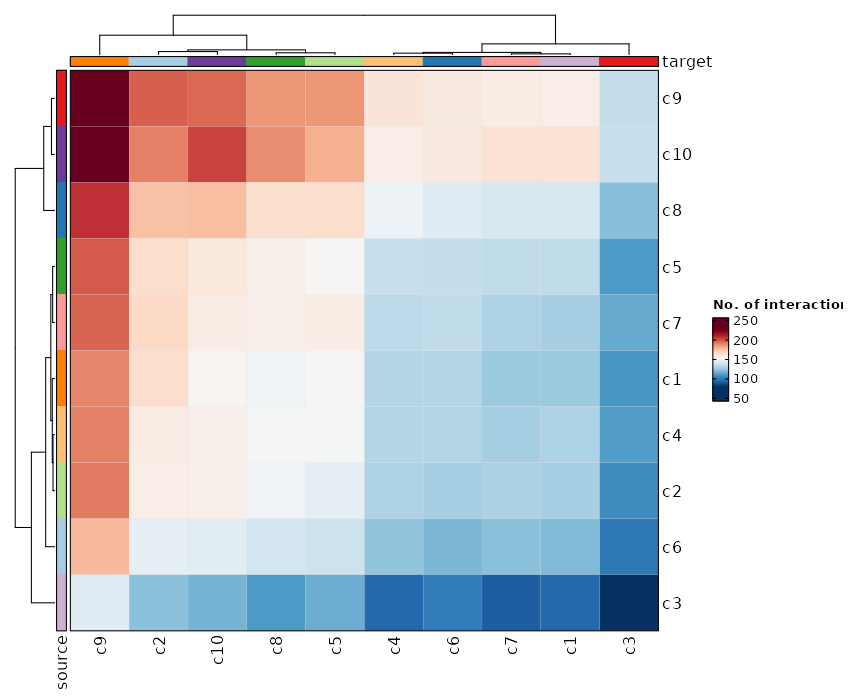{: width="80%"}
|
|
2831
|
+
|
|
2832
|
+
### Cell-Cell Communication Interaction (Box Plot)
|
|
2833
|
+
|
|
2834
|
+
```toml
|
|
2835
|
+
[CellCellCommunicationPlots.envs.cases."Cell-Cell Communication Interaction (Box Plot)"]
|
|
2836
|
+
plot_type = "box"
|
|
2837
|
+
x_text_angle = 90
|
|
2838
|
+
method = "interaction"
|
|
2839
|
+
```
|
|
2840
|
+
|
|
2841
|
+
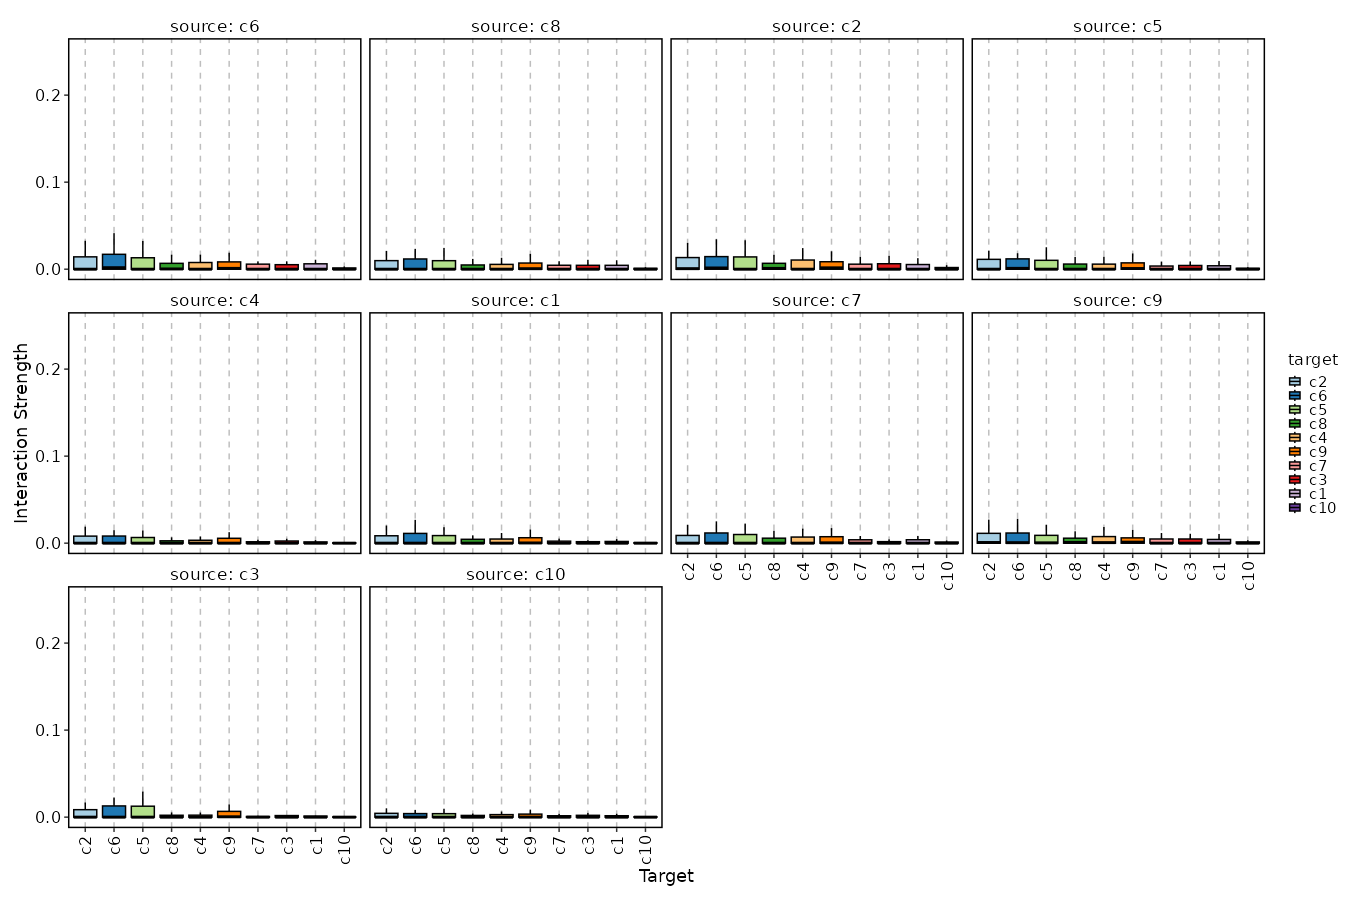{: width="80%"}
|
|
2842
|
+
|
|
2843
|
+
Input:
|
|
2844
|
+
cccfile: The output file from `CellCellCommunication`
|
|
2845
|
+
|
|
2846
|
+
Output:
|
|
2847
|
+
outdir: The output directory for the plots.
|
|
2848
|
+
|
|
2849
|
+
Envs:
|
|
2850
|
+
subset: An expression to pass to `dplyr::filter()` to subset the ccc data.
|
|
2851
|
+
magnitude: The column name in the data to use as the magnitude of the
|
|
2852
|
+
communication. By default, the second last column will be used.
|
|
2853
|
+
See `li.mt.show_methods()` for the available methods in LIANA. or
|
|
2854
|
+
<https://liana-py.readthedocs.io/en/latest/notebooks/basic_usage.html#Tileplot>
|
|
2855
|
+
specificity: The column name in the data to use as the specificity of the communication.
|
|
2856
|
+
By default, the last column will be used. If the method doesn't have a specificity, set it to None.
|
|
2857
|
+
devpars (ns): The parameters for the plot.
|
|
2858
|
+
- res (type=int): The resolution of the plot
|
|
2859
|
+
- height (type=int): The height of the plot
|
|
2860
|
+
- width (type=int): The width of the plot
|
|
2861
|
+
more_formats (type=list): The additional formats to save the plots.
|
|
2862
|
+
descr: The description of the plot.
|
|
2863
|
+
cases (type=json): The cases for the plots.
|
|
2864
|
+
The keys are the names of the cases and the values are the arguments for
|
|
2865
|
+
the plots. The arguments include the ones inherited from `envs`.
|
|
2866
|
+
You can have a special `plot_type` `"table"` to generate a table for the
|
|
2867
|
+
ccc data to save as a text file and show in the report.
|
|
2868
|
+
If no cases are given, a default case will be used, with the
|
|
2869
|
+
key `Cell-Cell Communication`.
|
|
2870
|
+
<more>: Other arguments passed to
|
|
2871
|
+
[scplotter::CCCPlot](https://pwwang.github.io/scplotter/reference/CCCPlot.html)
|
|
2872
|
+
""" # noqa: E501
|
|
2873
|
+
|
|
2874
|
+
input = "cccfile:file"
|
|
2875
|
+
output = "outdir:dir:{{in.cccfile | stem}}_plots"
|
|
2876
|
+
lang = config.lang.rscript
|
|
2877
|
+
envs = {
|
|
2878
|
+
"subset": None,
|
|
2879
|
+
"magnitude": None,
|
|
2880
|
+
"specificity": None,
|
|
2881
|
+
"devpars": {"res": 100},
|
|
2882
|
+
"more_formats": [],
|
|
2883
|
+
"descr": "Cell-cell communication plot",
|
|
2884
|
+
"cases": {},
|
|
2885
|
+
}
|
|
2886
|
+
script = "file://../scripts/scrna/CellCellCommunicationPlots.R"
|
|
2887
|
+
plugin_opts = {
|
|
2888
|
+
"report": "file://../reports/common.svelte",
|
|
2889
|
+
}
|
|
2890
|
+
|
|
2891
|
+
|
|
2892
|
+
class ScVelo(Proc):
|
|
2893
|
+
"""Velocity analysis for single-cell RNA-seq data
|
|
2894
|
+
|
|
2895
|
+
This process is implemented based on the Python package `scvelo` (v0.3.3).
|
|
2896
|
+
Note that it doesn't work with `numpy>=2`.
|
|
2897
|
+
|
|
2898
|
+
Input:
|
|
2899
|
+
sobjfile: The seurat object file in RDS or h5seurat format or AnnData file.
|
|
2900
|
+
|
|
2901
|
+
Output:
|
|
2902
|
+
outfile: The output object with the velocity embeddings and information.
|
|
2903
|
+
In either RDS, h5seurat or h5ad format, depending on the `envs.outtype`.
|
|
2904
|
+
There will be also plots generated in the output directory
|
|
2905
|
+
(parent directory of `outfile`).
|
|
2906
|
+
Note that these plots will not be used in the report, but can be used as
|
|
2907
|
+
supplementary information for the velocity analysis.
|
|
2908
|
+
To visualize the velocity embeddings, you can use the `SeuratClusterStats`
|
|
2909
|
+
process with `v_reduction` provided to one of the `envs.dimplots`.
|
|
2910
|
+
|
|
2911
|
+
Envs:
|
|
2912
|
+
ncores (type=int): Number of cores to use.
|
|
2913
|
+
group_by: The column name in metadata to group the cells.
|
|
2914
|
+
Typically, this column should be the cluster id.
|
|
2915
|
+
If provided input is a Seurat object, the default identity will be used by
|
|
2916
|
+
default. Otherwise, it is recommended to provide this parameter.
|
|
2917
|
+
"seurat_clusters" will be used with a warning if the input is in AnnData
|
|
2918
|
+
format and this parameter is not provided.
|
|
2919
|
+
mode (type=list): The mode to use for the velocity analysis.
|
|
2920
|
+
It should be a subset of `['deterministic', 'stochastic', 'dynamical']`,
|
|
2921
|
+
meaning that we can perform the velocity analysis in multiple modes.
|
|
2922
|
+
fitting_by (choice): The mode to use for fitting the velocities.
|
|
2923
|
+
- stochastic: Stochastic mode
|
|
2924
|
+
- deterministic: Deterministic mode
|
|
2925
|
+
min_shared_counts (type=int): Minimum number of counts
|
|
2926
|
+
(both unspliced and spliced) required for a gene.
|
|
2927
|
+
n_neighbors (type=int): The number of neighbors to use for the velocity graph.
|
|
2928
|
+
n_pcs (type=int): The number of PCs to use for the velocity graph.
|
|
2929
|
+
denoise (flag): Whether to denoise the data.
|
|
2930
|
+
denoise_topn (type=int): Number of genes with highest likelihood selected to
|
|
2931
|
+
infer velocity directions.
|
|
2932
|
+
kinetics (flag): Whether to compute the RNA velocity kinetics.
|
|
2933
|
+
kinetics_topn (type=int): Number of genes with highest likelihood selected to
|
|
2934
|
+
infer velocity directions.
|
|
2935
|
+
calculate_velocity_genes (flag): Whether to calculate the velocity genes.
|
|
2936
|
+
top_n (type=int): The number of top features to plot.
|
|
2937
|
+
rscript: The path to the Rscript executable used to convert RDS file to AnnData.
|
|
2938
|
+
if `in.sobjfile` is an RDS file, it will be converted to AnnData file
|
|
2939
|
+
(h5ad). You need `Seurat`, `SeuratDisk` and `digest` installed.
|
|
2940
|
+
outtype (choice): The output file type.
|
|
2941
|
+
- <input>: The same as the input file type.
|
|
2942
|
+
- h5seurat: h5seurat file
|
|
2943
|
+
- h5ad: h5ad file
|
|
2944
|
+
- qs: qs/qs2 file
|
|
2945
|
+
- qs2: qs2 file
|
|
2946
|
+
- rds: RDS file
|
|
2947
|
+
"""
|
|
2948
|
+
|
|
2949
|
+
input = "sobjfile:file"
|
|
2950
|
+
output = (
|
|
2951
|
+
"outfile:file:{{in.sobjfile | stem}}-scvelo."
|
|
2952
|
+
"{{ext0(in.sobjfile) if envs.outtype == '<input>' else envs.outtype}}"
|
|
2953
|
+
)
|
|
2954
|
+
lang = config.lang.python
|
|
2955
|
+
envs = {
|
|
2956
|
+
"ncores": config.misc.ncores,
|
|
2957
|
+
"group_by": None,
|
|
2958
|
+
"mode": ["deterministic", "stochastic", "dynamical"],
|
|
2959
|
+
"fitting_by": "stochastic",
|
|
2960
|
+
"min_shared_counts": 30,
|
|
2961
|
+
"n_neighbors": 30,
|
|
2962
|
+
"n_pcs": 30,
|
|
2963
|
+
"denoise": False,
|
|
2964
|
+
"denoise_topn": 3,
|
|
2965
|
+
"kinetics": False,
|
|
2966
|
+
"kinetics_topn": 100,
|
|
2967
|
+
"calculate_velocity_genes": False,
|
|
2968
|
+
"top_n": 6,
|
|
2969
|
+
"rscript": config.lang.rscript,
|
|
2970
|
+
"outtype": "<input>",
|
|
2971
|
+
}
|
|
2972
|
+
script = "file://../scripts/scrna/ScVelo.py"
|
|
2973
|
+
|
|
2974
|
+
|
|
2975
|
+
class Slingshot(Proc):
|
|
2976
|
+
"""Trajectory inference using Slingshot
|
|
2977
|
+
|
|
2978
|
+
This process is implemented based on the R package `slingshot`.
|
|
2979
|
+
|
|
2980
|
+
Input:
|
|
2981
|
+
sobjfile: The seurat object file in RDS or qs format.
|
|
2982
|
+
|
|
2983
|
+
Output:
|
|
2984
|
+
outfile: The output object with the trajectory information.
|
|
2985
|
+
The lineages are stored in the metadata of the seurat object at
|
|
2986
|
+
columns `LineageX`, where X is the lineage number. The `BranchID`
|
|
2987
|
+
column contains the branch id for each cell.
|
|
2988
|
+
One can use
|
|
2989
|
+
`scplotter::CellDimPlot(object, lineages = c("Lineage1", "Lineage2", ...))`
|
|
2990
|
+
to visualize the trajectories.
|
|
2991
|
+
|
|
2992
|
+
Envs:
|
|
2993
|
+
group_by: The column name in metadata to group the cells.
|
|
2994
|
+
Typically, this column should be the cluster id.
|
|
2995
|
+
Default is the default identity of the seurat object.
|
|
2996
|
+
reduction: The nonlinear reduction to use for the trajectory analysis.
|
|
2997
|
+
dims (type=auto): The dimensions to use for the analysis.
|
|
2998
|
+
A list or a string with comma separated values.
|
|
2999
|
+
Consecutive numbers can be specified with a colon (`:`) or a dash (`-`).
|
|
3000
|
+
start: The starting group for the Slingshot analysis.
|
|
3001
|
+
end: The ending group for the Slingshot analysis.
|
|
3002
|
+
prefix: The prefix to add to the column names of the resulting pseudotime variable.
|
|
3003
|
+
reverse (flag): Logical value indicating whether to reverse the pseudotime variable.
|
|
3004
|
+
align_start (flag): Whether to align the starting pseudotime values at the maximum pseudotime.
|
|
3005
|
+
seed (type=int): The seed for the random number generator.
|
|
3006
|
+
""" # noqa: E501
|
|
3007
|
+
|
|
3008
|
+
input = "sobjfile:file"
|
|
3009
|
+
output = "outfile:file:{{in.sobjfile | stem}}.qs"
|
|
3010
|
+
lang = config.lang.rscript
|
|
3011
|
+
envs = {
|
|
3012
|
+
"group_by": None,
|
|
3013
|
+
"reduction": None,
|
|
3014
|
+
"dims": [1, 2],
|
|
3015
|
+
"start": None,
|
|
3016
|
+
"end": None,
|
|
3017
|
+
"prefix": None,
|
|
3018
|
+
"reverse": False,
|
|
3019
|
+
"align_start": False,
|
|
3020
|
+
"seed": 8525,
|
|
3021
|
+
}
|
|
3022
|
+
script = "file://../scripts/scrna/Slingshot.R"
|
|
3023
|
+
|
|
3024
|
+
|
|
3025
|
+
class LoomTo10X(Proc):
|
|
3026
|
+
"""Convert Loom file to 10X format
|
|
3027
|
+
|
|
3028
|
+
Input:
|
|
3029
|
+
loomfile: The Loom file
|
|
3030
|
+
|
|
3031
|
+
Output:
|
|
3032
|
+
outdir: The output directory for the 10X format files,
|
|
3033
|
+
including the `matrix.mtx.gz`, `barcodes.tsv.gz` and `features.tsv.gz`
|
|
3034
|
+
files.
|
|
3035
|
+
"""
|
|
3036
|
+
|
|
3037
|
+
input = "loomfile:file"
|
|
3038
|
+
output = "outdir:dir:{{in.loomfile | stem}}.10X"
|
|
3039
|
+
lang = config.lang.rscript
|
|
3040
|
+
script = "file://../scripts/scrna/LoomTo10X.R"
|
|
3041
|
+
|
|
3042
|
+
|
|
3043
|
+
class PseudoBulkDEG(Proc):
|
|
3044
|
+
"""Pseduo-bulk differential gene expression analysis
|
|
3045
|
+
|
|
3046
|
+
This process performs differential gene expression analysis, instead of
|
|
3047
|
+
on single-cell level, on the pseudo-bulk data, aggregated from the single-cell data.
|
|
3048
|
+
|
|
3049
|
+
Input:
|
|
3050
|
+
sobjfile: The seurat object file in RDS or qs/qs2 format.
|
|
3051
|
+
|
|
3052
|
+
Output:
|
|
3053
|
+
outdir: The output containing the results of the differential gene expression
|
|
3054
|
+
analysis.
|
|
3055
|
+
|
|
3056
|
+
Envs:
|
|
3057
|
+
ncores (type=int): Number of cores to use for parallelization.
|
|
3058
|
+
mutaters (type=json): Mutaters to mutate the metadata of the
|
|
3059
|
+
seurat object. Keys are the new column names and values are the
|
|
3060
|
+
expressions to mutate the columns. These new columns can be
|
|
3061
|
+
used to define your cases.
|
|
3062
|
+
You can also use the clone selectors to select the TCR clones/clusters.
|
|
3063
|
+
See <https://pwwang.github.io/scplotter/reference/clone_selectors.html>.
|
|
3064
|
+
each: The column name in metadata to separate the cells into different cases.
|
|
3065
|
+
When specified, the case will be expanded to multiple cases for
|
|
3066
|
+
each value in the column.
|
|
3067
|
+
cache (type=auto): Where to cache the results.
|
|
3068
|
+
If `True`, cache to `outdir` of the job. If `False`, don't cache.
|
|
3069
|
+
Otherwise, specify the directory to cache to.
|
|
3070
|
+
subset: An expression in string to subset the cells.
|
|
3071
|
+
aggregate_by: The column names in metadata to aggregate the cells.
|
|
3072
|
+
layer: The layer to pull and aggregate the data.
|
|
3073
|
+
assay: The assay to pull and aggregate the data.
|
|
3074
|
+
error (flag): Error out if no/not enough markers are found or no pathways are enriched.
|
|
3075
|
+
If `False`, empty results will be returned.
|
|
3076
|
+
group_by: The column name in metadata to group the cells.
|
|
3077
|
+
ident_1: The first identity to compare.
|
|
3078
|
+
ident_2: The second identity to compare.
|
|
3079
|
+
If not specified, the rest of the identities will be compared with `ident_1`.
|
|
3080
|
+
paired_by: The column name in metadata to mark the paired samples.
|
|
3081
|
+
For example, subject. If specified, the paired test will be performed.
|
|
3082
|
+
dbs (list): The databases to use for enrichment analysis.
|
|
3083
|
+
You can use built-in dbs in `enrichit`, or provide your own gmt files.
|
|
3084
|
+
See also <https://pwwang.github.io/enrichit/reference/FetchGMT.html>.
|
|
3085
|
+
The built-in dbs include:
|
|
3086
|
+
* "BioCarta" or "BioCarta_2016"
|
|
3087
|
+
* "GO_Biological_Process" or "GO_Biological_Process_2025"
|
|
3088
|
+
* "GO_Cellular_Component" or "GO_Cellular_Component_2025"
|
|
3089
|
+
* "GO_Molecular_Function" or "GO_Molecular_Function_2025"
|
|
3090
|
+
* "KEGG", "KEGG_Human", "KEGG_2021", or "KEGG_2021_Human"
|
|
3091
|
+
* "Hallmark", "MSigDB_Hallmark", or "MSigDB_Hallmark_2020"
|
|
3092
|
+
* "Reactome", "Reactome_Pathways", or "Reactome_Pathways_2024"
|
|
3093
|
+
* "WikiPathways", "WikiPathways_2024", "WikiPathways_Human", or "WikiPathways_2024_Human"
|
|
3094
|
+
You can also fetch more dbs from <https://maayanlab.cloud/Enrichr/#libraries>.
|
|
3095
|
+
sigmarkers: An expression passed to `dplyr::filter()` to filter the
|
|
3096
|
+
significant markers for enrichment analysis.
|
|
3097
|
+
The default is `p_val_adj < 0.05`.
|
|
3098
|
+
If `tool = 'DESeq2'`, the variables that can be used for filtering
|
|
3099
|
+
are: `baseMean`, `log2FC`, `lfcSE`, `stat`, `p_val`, `p_val_adj`.
|
|
3100
|
+
If `tool = 'edgeR'`, the variables that can be used for filtering
|
|
3101
|
+
are: `logCPM`, `log2FC`, `LR`, `p_val`, `p_val_adj`.
|
|
3102
|
+
enrich_style (choice): The style of the enrichment analysis.
|
|
3103
|
+
- enrichr: Use `enrichr`-style for the enrichment analysis.
|
|
3104
|
+
- clusterProfiler: Use `clusterProfiler`-style for the enrichment analysis.
|
|
3105
|
+
allmarker_plots_defaults (ns): Default options for the plots for all markers when `ident_1` is not specified.
|
|
3106
|
+
- plot_type: The type of the plot.
|
|
3107
|
+
See <https://pwwang.github.io/scplotter/reference/FeatureStatPlot.html>.
|
|
3108
|
+
Available types are `violin`, `box`, `bar`, `ridge`, `dim`, `heatmap` and `dot`.
|
|
3109
|
+
- more_formats (type=list): The extra formats to save the plot in.
|
|
3110
|
+
- save_code (flag): Whether to save the code to generate the plot.
|
|
3111
|
+
- devpars (ns): The device parameters for the plots.
|
|
3112
|
+
- res (type=int): The resolution of the plots.
|
|
3113
|
+
- height (type=int): The height of the plots.
|
|
3114
|
+
- width (type=int): The width of the plots.
|
|
3115
|
+
- order_by: an expression to order the markers, passed by `dplyr::arrange()`.
|
|
3116
|
+
- genes: The number of top genes to show or an expression passed to `dplyr::filter()` to filter the genes.
|
|
3117
|
+
- <more>: Other arguments passed to [`scplotter::FeatureStatPlot()`](https://pwwang.github.io/scplotter/reference/FeatureStatPlot.html).
|
|
3118
|
+
allmarker_plots (type=json): All marker plot cases.
|
|
3119
|
+
The keys are the names of the cases and the values are the dicts inherited from `allmarker_plots_defaults`.
|
|
3120
|
+
allenrich_plots_defaults (ns): Default options for the plots to generate for the enrichment analysis.
|
|
3121
|
+
- plot_type: The type of the plot.
|
|
3122
|
+
- devpars (ns): The device parameters for the plots.
|
|
3123
|
+
- res (type=int): The resolution of the plots.
|
|
3124
|
+
- height (type=int): The height of the plots.
|
|
3125
|
+
- width (type=int): The width of the plots.
|
|
3126
|
+
- <more>: See <https://pwwang.github.io/scplotter/reference/EnrichmentPlot.html>.
|
|
3127
|
+
allenrich_plots (type=json): Cases of the plots to generate for the enrichment analysis.
|
|
3128
|
+
The keys are the names of the cases and the values are the dicts inherited from `allenrich_plots_defaults`.
|
|
3129
|
+
The cases under `envs.cases` can inherit this options.
|
|
3130
|
+
marker_plots_defaults (ns): Default options for the plots to generate for the markers.
|
|
3131
|
+
- plot_type: The type of the plot.
|
|
3132
|
+
See <https://pwwang.github.io/scplotter/reference/FeatureStatPlot.html>.
|
|
3133
|
+
Available types are `violin`, `box`, `bar`, `ridge`, `dim`, `heatmap` and `dot`.
|
|
3134
|
+
There are two additional types available - `volcano_pct` and `volcano_log2fc`.
|
|
3135
|
+
- more_formats (type=list): The extra formats to save the plot in.
|
|
3136
|
+
- save_code (flag): Whether to save the code to generate the plot.
|
|
3137
|
+
- devpars (ns): The device parameters for the plots.
|
|
3138
|
+
- res (type=int): The resolution of the plots.
|
|
3139
|
+
- height (type=int): The height of the plots.
|
|
3140
|
+
- width (type=int): The width of the plots.
|
|
3141
|
+
- order_by: an expression to order the markers, passed by `dplyr::arrange()`.
|
|
3142
|
+
- genes: The number of top genes to show or an expression passed to `dplyr::filter()` to filter the genes.
|
|
3143
|
+
- <more>: Other arguments passed to [`scplotter::FeatureStatPlot()`](https://pwwang.github.io/scplotter/reference/FeatureStatPlot.html).
|
|
3144
|
+
If `plot_type` is `volcano_pct` or `volcano_log2fc`, they will be passed to
|
|
3145
|
+
[`scplotter::VolcanoPlot()`](https://pwwang.github.io/plotthis/reference/VolcanoPlot.html).
|
|
3146
|
+
marker_plots (type=json): Cases of the plots to generate for the markers.
|
|
3147
|
+
Plot cases. The keys are the names of the cases and the values are the dicts inherited from `marker_plots_defaults`.
|
|
3148
|
+
The cases under `envs.cases` can inherit this options.
|
|
3149
|
+
enrich_plots_defaults (ns): Default options for the plots to generate for the enrichment analysis.
|
|
3150
|
+
- plot_type: The type of the plot.
|
|
3151
|
+
See <https://pwwang.github.io/scplotter/reference/EnrichmentPlot.html>.
|
|
3152
|
+
Available types are `bar`, `dot`, `lollipop`, `network`, `enrichmap` and `wordcloud`.
|
|
3153
|
+
- more_formats (type=list): The extra formats to save the plot in.
|
|
3154
|
+
- save_code (flag): Whether to save the code to generate the plot.
|
|
3155
|
+
- devpars (ns): The device parameters for the plots.
|
|
3156
|
+
- res (type=int): The resolution of the plots.
|
|
3157
|
+
- height (type=int): The height of the plots.
|
|
3158
|
+
- width (type=int): The width of the plots.
|
|
3159
|
+
- <more>: See <https://pwwang.github.io/scplotter/reference/EnrichmentPlot.htmll>.
|
|
3160
|
+
enrich_plots (type=json): Cases of the plots to generate for the enrichment analysis.
|
|
3161
|
+
The keys are the names of the cases and the values are the dicts inherited from `enrich_plots_defaults`.
|
|
3162
|
+
The cases under `envs.cases` can inherit this options.
|
|
3163
|
+
overlaps_defaults (ns): Default options for investigating the overlapping of significant markers between different cases or comparisons.
|
|
3164
|
+
This means either `ident_1` should be empty, so that they can be expanded to multiple comparisons.
|
|
3165
|
+
- sigmarkers: The expression to filter the significant markers for each case.
|
|
3166
|
+
If not provided, `envs.sigmarkers` will be used.
|
|
3167
|
+
- plot_type (choice): The type of the plot to generate for the overlaps.
|
|
3168
|
+
- venn: Use `plotthis::VennDiagram()`.
|
|
3169
|
+
- upset: Use `plotthis::UpsetPlot()`.
|
|
3170
|
+
- more_formats (type=list): The extra formats to save the plot in.
|
|
3171
|
+
- save_code (flag): Whether to save the code to generate the plot.
|
|
3172
|
+
- devpars (ns): The device parameters for the plots.
|
|
3173
|
+
- res (type=int): The resolution of the plots.
|
|
3174
|
+
- height (type=int): The height of the plots.
|
|
3175
|
+
- width (type=int): The width of the plots.
|
|
3176
|
+
- <more>: More arguments pased to `plotthis::VennDiagram()`
|
|
3177
|
+
(<https://pwwang.github.io/plotthis/reference/venndiagram1.html>)
|
|
3178
|
+
or `plotthis::UpsetPlot()`
|
|
3179
|
+
(<https://pwwang.github.io/plotthis/reference/upsetplot1.html>)
|
|
3180
|
+
overlaps (type=json): Cases for investigating the overlapping of significant markers between different cases or comparisons.
|
|
3181
|
+
The keys are the names of the cases and the values are the dicts inherited from `overlaps_defaults`.
|
|
3182
|
+
There are two situations that we can perform overlaps:
|
|
3183
|
+
1. If `ident_1` is not specified, the overlaps can be performed between different comparisons.
|
|
3184
|
+
2. If `each` is specified, the overlaps can be performed between different cases, where in each case, `ident_1` must be specified.
|
|
3185
|
+
tool (choice): The method to use for the differential expression analysis.
|
|
3186
|
+
- DESeq2: Use DESeq2 for the analysis.
|
|
3187
|
+
- edgeR: Use edgeR for the analysis.
|
|
3188
|
+
plots_defaults (ns): The default parameters for the plots.
|
|
3189
|
+
- <more>: Parameters passed to `biopipen.utils::VizBulkDEGs()`.
|
|
3190
|
+
See: <https://pwwang.github.io/biopipen.utils.R/reference/VizBulkDEGs.html>
|
|
3191
|
+
plots (type=json): The parameters for the plots.
|
|
3192
|
+
The keys are the names of the plots and the values are the parameters
|
|
3193
|
+
for the plots. The parameters will override the defaults in `plots_defaults`.
|
|
3194
|
+
If not specified, no plots will be generated.
|
|
3195
|
+
cases (type=json): The cases for the analysis.
|
|
3196
|
+
The keys are the names of the cases and the values are the arguments for
|
|
3197
|
+
the analysis. The arguments include the ones inherited from `envs`.
|
|
3198
|
+
If no cases are specified, a default case will be added with
|
|
3199
|
+
the name `DEG Analysis` and the default values specified above.
|
|
3200
|
+
""" # noqa: E501
|
|
3201
|
+
input = "sobjfile:file"
|
|
3202
|
+
output = "outdir:dir:{{in.sobjfile | stem}}.pseudobulk_deg"
|
|
3203
|
+
lang = config.lang.rscript
|
|
3204
|
+
script = "file://../scripts/scrna/PseudoBulkDEG.R"
|
|
3205
|
+
envs = {
|
|
3206
|
+
"ncores": config.misc.ncores,
|
|
3207
|
+
"mutaters": {},
|
|
3208
|
+
"cache": config.path.tmpdir,
|
|
3209
|
+
"each": None,
|
|
3210
|
+
"subset": None,
|
|
3211
|
+
"aggregate_by": None,
|
|
3212
|
+
"layer": "counts",
|
|
3213
|
+
"assay": None,
|
|
3214
|
+
"error": False,
|
|
3215
|
+
"group_by": None,
|
|
3216
|
+
"ident_1": None,
|
|
3217
|
+
"ident_2": None,
|
|
3218
|
+
"paired_by": None,
|
|
3219
|
+
"tool": "DESeq2",
|
|
3220
|
+
"dbs": ["KEGG_2021_Human", "MSigDB_Hallmark_2020"],
|
|
3221
|
+
"sigmarkers": "p_val_adj < 0.05",
|
|
3222
|
+
"enrich_style": "enrichr",
|
|
3223
|
+
"allmarker_plots_defaults": {
|
|
3224
|
+
"plot_type": None,
|
|
3225
|
+
"more_formats": [],
|
|
3226
|
+
"save_code": False,
|
|
3227
|
+
"devpars": {"res": 100},
|
|
3228
|
+
"order_by": "desc(abs(log2FC))",
|
|
3229
|
+
"genes": 10,
|
|
3230
|
+
},
|
|
3231
|
+
"allmarker_plots": {},
|
|
3232
|
+
"allenrich_plots_defaults": {
|
|
3233
|
+
"plot_type": "heatmap",
|
|
3234
|
+
"devpars": {"res": 100},
|
|
3235
|
+
},
|
|
3236
|
+
"allenrich_plots": {},
|
|
3237
|
+
"marker_plots_defaults": {
|
|
3238
|
+
"plot_type": None,
|
|
3239
|
+
"more_formats": [],
|
|
3240
|
+
"save_code": False,
|
|
3241
|
+
"devpars": {"res": 100},
|
|
3242
|
+
"order_by": "desc(abs(log2FC))",
|
|
3243
|
+
"genes": 10,
|
|
3244
|
+
},
|
|
3245
|
+
"marker_plots": {
|
|
3246
|
+
"Volcano Plot": {"plot_type": "volcano"},
|
|
3247
|
+
},
|
|
3248
|
+
"enrich_plots_defaults": {
|
|
3249
|
+
"more_formats": [],
|
|
3250
|
+
"save_code": False,
|
|
3251
|
+
"devpars": {"res": 100},
|
|
3252
|
+
},
|
|
3253
|
+
"enrich_plots": {
|
|
3254
|
+
"Bar Plot": {"plot_type": "bar", "ncol": 1, "top_term": 10},
|
|
3255
|
+
},
|
|
3256
|
+
"overlaps_defaults": {
|
|
3257
|
+
"sigmarkers": None,
|
|
3258
|
+
"plot_type": "venn",
|
|
3259
|
+
"more_formats": [],
|
|
3260
|
+
"save_code": False,
|
|
3261
|
+
"devpars": {"res": 100},
|
|
3262
|
+
},
|
|
3263
|
+
"overlaps": {},
|
|
3264
|
+
"cases": {},
|
|
3265
|
+
}
|
|
3266
|
+
plugin_opts = {
|
|
3267
|
+
"report": "file://../reports/common.svelte",
|
|
3268
|
+
"report_paging": 8,
|
|
3269
|
+
}
|
|
3270
|
+
|
|
3271
|
+
|
|
3272
|
+
class CellSNPLite(Proc):
|
|
3273
|
+
"""Genotyping bi-allelic SNPs on single cells using cellsnp-lite.
|
|
3274
|
+
|
|
3275
|
+
The output from cellsnp-lite can be directly used for downstream analysis such as -
|
|
3276
|
+
|
|
3277
|
+
* Donor deconvolution in multiplexed single-cell RNA-seq data (e.g., with vireo).
|
|
3278
|
+
* Allele-specific CNV analysis in single-cell or spatial transcriptomics data (e.g., with Numbat, XClone, or CalicoST).
|
|
3279
|
+
* Clonal substructure discovery using single cell mitochondrial variants (e.g., with MQuad).
|
|
3280
|
+
|
|
3281
|
+
Here we only support model `1a`/`2a` in cellsnp-lite, which is designed for a single bam file as input.
|
|
3282
|
+
For model `1b`/`2b`, which is designed for multiple bam files as input (e.g., one per cell), you can still
|
|
3283
|
+
run with this process, but only one bam file is allowed.
|
|
3284
|
+
|
|
3285
|
+
See <https://github.com/single-cell-genetics/cellsnp-lite> for more details about cellsnp-lite.
|
|
3286
|
+
|
|
3287
|
+
Input:
|
|
3288
|
+
crdir: The cellranger output directory or the directory containing
|
|
3289
|
+
the bam file and barcode file.
|
|
3290
|
+
It should contain the `outs/possorted_genome_bam.bam` file and
|
|
3291
|
+
the `outs/filtered_feature_bc_matrix/barcodes.tsv.gz` file.
|
|
3292
|
+
|
|
3293
|
+
Output:
|
|
3294
|
+
outdir: The output directory for cellsnp-lite results.
|
|
3295
|
+
|
|
3296
|
+
Envs:
|
|
3297
|
+
ncores (type=int): The number of cores to use.
|
|
3298
|
+
Will pass to `-p` option in cellsnp-lite.
|
|
3299
|
+
regionsVCF: A vcf file listing all candidate SNPs, for fetch each variants.
|
|
3300
|
+
genotype (flag): Whether to perform genotyping.
|
|
3301
|
+
If `False`, only the allele counts will be computed.
|
|
3302
|
+
gzip (flag): Whether to gzip the output files.
|
|
3303
|
+
<more>: Other arguments passed to cellsnp-lite.
|
|
3304
|
+
See <https://cellsnp-lite.readthedocs.io/en/latest/main/manual.html#full-parameters> for more details.
|
|
3305
|
+
""" # noqa: E501
|
|
3306
|
+
|
|
3307
|
+
input = "crdir:dir"
|
|
3308
|
+
output = """
|
|
3309
|
+
outdir:dir:
|
|
3310
|
+
{%- if basename(in.crdir) == 'outs' -%}
|
|
3311
|
+
{{in.crdir | dirname | basename}}
|
|
3312
|
+
{%- else -%}
|
|
3313
|
+
{{in.crdir | basename}}
|
|
3314
|
+
{%- endif -%}
|
|
3315
|
+
.cellsnp
|
|
3316
|
+
""" # noqa: E501
|
|
3317
|
+
lang = config.lang.python
|
|
3318
|
+
envs = {
|
|
3319
|
+
"cellsnp_lite": config.exe.cellsnp_lite,
|
|
3320
|
+
"ncores": config.misc.ncores,
|
|
3321
|
+
"regionsVCF": None,
|
|
3322
|
+
"genotype": False,
|
|
3323
|
+
"gzip": True,
|
|
3324
|
+
}
|
|
3325
|
+
script = "file://../scripts/scrna/CellSNPLite.py"
|
|
3326
|
+
|
|
3327
|
+
|
|
3328
|
+
class MQuad(Proc):
|
|
3329
|
+
"""Clonal substructure discovery using single cell mitochondrial variants with MQuad.
|
|
3330
|
+
|
|
3331
|
+
MQuad uses a Mixture Model for Mitochondrial Mutation detection in single-cell omics data.
|
|
3332
|
+
|
|
3333
|
+
MQuad is a tool that detects mitochondrial mutations that are informative for clonal substructure inference. It uses a binomial mixture model to assess the heteroplasmy of mtDNA variants among background noise.
|
|
3334
|
+
|
|
3335
|
+
Input:
|
|
3336
|
+
cellsnpout: The output directory from `CellSNPLite` process, which should contain
|
|
3337
|
+
AD and DP sparse matrices (.mtx) or the vcf file.
|
|
3338
|
+
|
|
3339
|
+
Output:
|
|
3340
|
+
outdir: The output directory for MQuad results.
|
|
3341
|
+
|
|
3342
|
+
Envs:
|
|
3343
|
+
ncores (type=int): The number of cores to use.
|
|
3344
|
+
It will be passed to `--nproc` option in MQuad.
|
|
3345
|
+
seed (type=int): The seed for the random number generator.
|
|
3346
|
+
It will be passed to `--randSeed` option in MQuad.
|
|
3347
|
+
<more>: Other arguments passed to MQuad.
|
|
3348
|
+
See <https://github.com/single-cell-genetics/MQuad/blob/main/mquad/mquad_CLI.py> for more details.
|
|
3349
|
+
""" # noqa: E501
|
|
3350
|
+
input = "cellsnpout:dir"
|
|
3351
|
+
output = "outdir:dir:{{in.cellsnpout | stem}}.mquad"
|
|
3352
|
+
lang = config.lang.python
|
|
3353
|
+
envs = {
|
|
3354
|
+
"mquad": config.exe.mquad,
|
|
3355
|
+
"ncores": config.misc.ncores,
|
|
3356
|
+
"seed": 8525,
|
|
3357
|
+
}
|
|
3358
|
+
script = "file://../scripts/scrna/MQuad.py"
|