@arcgis/core 5.0.0-next.126 → 5.0.0-next.128
This diff represents the content of publicly available package versions that have been released to one of the supported registries. The information contained in this diff is provided for informational purposes only and reflects changes between package versions as they appear in their respective public registries.
- package/Camera.d.ts +1 -1
- package/Ground.d.ts +7 -7
- package/PopupTemplate.d.ts +6 -6
- package/WebScene.d.ts +1 -1
- package/analysis/AreaMeasurementAnalysis.d.ts +1 -1
- package/analysis/DirectLineMeasurementAnalysis.d.ts +1 -1
- package/analysis/LengthDimension.d.ts +4 -4
- package/analysis/ShadowCastAnalysis.d.ts +3 -3
- package/analysis/SliceAnalysis.d.ts +1 -1
- package/analysis/SlicePlane.d.ts +1 -1
- package/assets/esri/core/workers/RemoteClient.js +1 -1
- package/assets/esri/core/workers/chunks/{0a4ebb5dca630a4ab0dd.js → 236f8137ae505c8f0764.js} +1 -1
- package/assets/esri/core/workers/chunks/84905581a3782e95ec34.js +1 -0
- package/assets/esri/core/workers/chunks/{f5f513997cde0ce0f2a2.js → 8eb535b43e1220cf0d75.js} +1 -1
- package/config.js +1 -1
- package/effects/FocusAreas.d.ts +1 -1
- package/form/elements/FieldElement.d.ts +1 -1
- package/form/elements/GroupElement.d.ts +1 -1
- package/form/elements/TextElement.d.ts +1 -1
- package/form/elements/inputs/ComboBoxInput.d.ts +1 -1
- package/form/elements/inputs/RadioButtonsInput.d.ts +1 -1
- package/form/elements/inputs/SwitchInput.d.ts +1 -1
- package/geometry/Mesh.d.ts +7 -7
- package/geometry/operators/alphaShapeOperator.d.ts +1 -1
- package/geometry/operators/areaOperator.d.ts +1 -1
- package/geometry/operators/bufferOperator.d.ts +1 -1
- package/geometry/operators/centroidOperator.d.ts +1 -1
- package/geometry/operators/clipOperator.d.ts +1 -1
- package/geometry/operators/containsOperator.d.ts +1 -1
- package/geometry/operators/convexHullOperator.d.ts +1 -1
- package/geometry/operators/crossesOperator.d.ts +1 -1
- package/geometry/operators/cutOperator.d.ts +1 -1
- package/geometry/operators/densifyOperator.d.ts +1 -1
- package/geometry/operators/differenceOperator.d.ts +1 -1
- package/geometry/operators/disjointOperator.d.ts +1 -1
- package/geometry/operators/distanceOperator.d.ts +1 -1
- package/geometry/operators/generalizeOperator.d.ts +1 -1
- package/geometry/operators/geodesicProximityOperator.d.ts +1 -1
- package/geometry/operators/geodeticDistanceOperator.d.ts +1 -1
- package/geometry/operators/geodeticUtilsOperator.d.ts +2 -2
- package/geometry/operators/graphicBufferOperator.d.ts +1 -1
- package/geometry/operators/intersectionOperator.d.ts +1 -1
- package/geometry/operators/intersectsOperator.d.ts +1 -1
- package/geometry/operators/isNearOperator.d.ts +1 -1
- package/geometry/operators/lengthOperator.d.ts +1 -1
- package/geometry/operators/locateBetweenOperator.d.ts +1 -1
- package/geometry/operators/multiPartToSinglePartOperator.d.ts +1 -1
- package/geometry/operators/offsetOperator.d.ts +5 -5
- package/geometry/operators/overlapsOperator.d.ts +1 -1
- package/geometry/operators/proximityOperator.d.ts +1 -1
- package/geometry/operators/simplifyOGCOperator.d.ts +1 -1
- package/geometry/operators/simplifyOperator.d.ts +1 -1
- package/geometry/operators/support/Transformation.d.ts +6 -6
- package/geometry/operators/symmetricDifferenceOperator.d.ts +1 -1
- package/geometry/operators/touchesOperator.d.ts +1 -1
- package/geometry/operators/unionOperator.d.ts +1 -1
- package/geometry/operators/withinOperator.d.ts +1 -1
- package/geometry/support/MeshMaterialMetallicRoughness.d.ts +1 -1
- package/kernel.js +1 -1
- package/layers/BuildingSceneLayer.d.ts +4 -4
- package/layers/CSVLayer.d.ts +2 -2
- package/layers/CatalogLayer.d.ts +2 -2
- package/layers/ElevationLayer.d.ts +1 -1
- package/layers/FeatureLayer.d.ts +2 -2
- package/layers/GeoJSONLayer.d.ts +2 -2
- package/layers/GeoRSSLayer.d.ts +1 -1
- package/layers/GraphicsLayer.d.ts +2 -2
- package/layers/ImageryLayer.d.ts +3 -3
- package/layers/ImageryTileLayer.d.ts +2 -2
- package/layers/IntegratedMesh3DTilesLayer.d.ts +6 -6
- package/layers/IntegratedMeshLayer.d.ts +7 -7
- package/layers/Layer.d.ts +1 -0
- package/layers/MapImageLayer.d.ts +1 -1
- package/layers/MediaLayer.d.ts +1 -1
- package/layers/OGCFeatureLayer.d.ts +2 -2
- package/layers/PointCloudLayer.d.ts +1 -1
- package/layers/SceneLayer.d.ts +5 -5
- package/layers/StreamLayer.d.ts +2 -2
- package/layers/VectorTileLayer.d.ts +2 -2
- package/layers/VideoLayer.d.ts +1 -1
- package/layers/VoxelLayer.d.ts +8 -8
- package/layers/WFSLayer.d.ts +6 -6
- package/layers/catalog/CatalogFootprintLayer.d.ts +1 -1
- package/layers/mixins/BlendLayer.d.ts +6 -6
- package/layers/pointCloudFilters/PointCloudReturnFilter.d.ts +1 -1
- package/layers/pointCloudFilters/PointCloudValueFilter.d.ts +1 -1
- package/layers/support/DimensionalDefinition.d.ts +2 -2
- package/layers/support/FeatureEffect.d.ts +4 -4
- package/layers/support/FeatureFilter.d.ts +17 -17
- package/layers/support/FeatureReductionBinning.d.ts +1 -1
- package/layers/support/FeatureReductionCluster.d.ts +9 -9
- package/layers/support/LabelClass.d.ts +2 -2
- package/layers/support/RasterFunction.d.ts +1 -1
- package/layers/support/SceneFilter.d.ts +2 -2
- package/layers/support/SceneModification.d.ts +3 -3
- package/package.json +1 -1
- package/popup/content/AttachmentsContent.d.ts +1 -1
- package/popup/content/BarChartMediaInfo.d.ts +1 -1
- package/popup/content/ColumnChartMediaInfo.d.ts +1 -1
- package/popup/content/FieldsContent.d.ts +1 -1
- package/popup/content/ImageMediaInfo.d.ts +1 -1
- package/popup/content/LineChartMediaInfo.d.ts +1 -1
- package/popup/content/MediaContent.d.ts +1 -1
- package/popup/content/PieChartMediaInfo.d.ts +1 -1
- package/popup/content/RelationshipContent.d.ts +1 -1
- package/popup/content/TextContent.d.ts +1 -1
- package/renderers/DotDensityRenderer.d.ts +3 -3
- package/renderers/FlowRenderer.d.ts +6 -6
- package/renderers/HeatmapRenderer.d.ts +3 -3
- package/renderers/PieChartRenderer.d.ts +1 -1
- package/renderers/RasterShadedReliefRenderer.d.ts +1 -1
- package/renderers/Renderer.d.ts +2 -2
- package/renderers/SimpleRenderer.d.ts +1 -1
- package/renderers/VectorFieldRenderer.d.ts +1 -1
- package/renderers/mixins/VisualVariablesMixin.d.ts +8 -8
- package/rest/query/operations/pbfFlatFeatureSet.js +1 -1
- package/rest/query/support/AttachmentInfo.d.ts +1 -1
- package/rest/support/AutoIntervalBinParameters.d.ts +1 -1
- package/rest/support/DateBinParameters.d.ts +1 -1
- package/rest/support/FixedBoundariesBinParameters.d.ts +1 -1
- package/rest/support/FixedIntervalBinParameters.d.ts +1 -1
- package/smartMapping/labels/clusters.d.ts +1 -1
- package/smartMapping/popup/clusters.d.ts +2 -2
- package/smartMapping/popup/templates.d.ts +1 -1
- package/smartMapping/raster/renderers/flow.d.ts +2 -2
- package/smartMapping/renderers/color.d.ts +12 -12
- package/smartMapping/renderers/predominance.d.ts +3 -3
- package/smartMapping/renderers/relationship.d.ts +15 -15
- package/smartMapping/renderers/univariateColorSize.d.ts +4 -4
- package/smartMapping/symbology/color.d.ts +4 -4
- package/smartMapping/symbology/flow.d.ts +2 -2
- package/smartMapping/symbology/types.d.ts +18 -18
- package/support/revision.js +1 -1
- package/symbols/CIMSymbol.d.ts +1 -1
- package/symbols/FillSymbol3DLayer.d.ts +3 -3
- package/symbols/IconSymbol3DLayer.d.ts +1 -1
- package/symbols/LabelSymbol3D.d.ts +2 -2
- package/symbols/LineStyleMarker3D.d.ts +7 -7
- package/symbols/LineSymbol3D.d.ts +2 -2
- package/symbols/LineSymbol3DLayer.d.ts +7 -7
- package/symbols/LineSymbolMarker.d.ts +6 -6
- package/symbols/MarkerSymbol.d.ts +1 -1
- package/symbols/MeshSymbol3D.d.ts +2 -2
- package/symbols/ObjectSymbol3DLayer.d.ts +1 -1
- package/symbols/PathSymbol3DLayer.d.ts +14 -14
- package/symbols/PictureFillSymbol.d.ts +1 -1
- package/symbols/PictureMarkerSymbol.d.ts +1 -1
- package/symbols/PointSymbol3D.d.ts +3 -3
- package/symbols/PolygonSymbol3D.d.ts +7 -7
- package/symbols/SimpleFillSymbol.d.ts +8 -8
- package/symbols/SimpleLineSymbol.d.ts +20 -20
- package/symbols/SimpleMarkerSymbol.d.ts +7 -7
- package/symbols/Symbol3DLayer.d.ts +16 -16
- package/symbols/TextSymbol.d.ts +1 -1
- package/symbols/TextSymbol3DLayer.d.ts +1 -1
- package/symbols/WaterSymbol3DLayer.d.ts +3 -3
- package/symbols/WebStyleSymbol.d.ts +1 -1
- package/symbols/callouts/Callout3D.d.ts +1 -1
- package/symbols/callouts/LineCallout3D.d.ts +3 -3
- package/symbols/cim/cimAnalyzer.js +1 -1
- package/symbols/cim/types.d.ts +23 -23
- package/symbols/edges/Edges3D.d.ts +1 -1
- package/symbols/edges/SolidEdges3D.d.ts +1 -1
- package/symbols/patterns/LineStylePattern3D.d.ts +11 -11
- package/symbols/patterns/StylePattern3D.d.ts +8 -8
- package/symbols/support/ElevationInfo.d.ts +2 -2
- package/symbols/support/IconSymbol3DLayerResource.d.ts +6 -6
- package/symbols/support/ObjectSymbol3DLayerResource.d.ts +7 -7
- package/symbols/support/Symbol3DEmissive.d.ts +23 -13
- package/symbols/support/Symbol3DVerticalOffset.d.ts +2 -2
- package/views/2d/engine/webgl/shaderGraph/techniques/GraphicInstanceStore.js +1 -1
- package/views/2d/engine/webgl/shaderGraph/techniques/animated/AAnimatedPolyShader.js +1 -1
- package/views/2d/engine/webgl/shaderGraph/techniques/animated/AnimatedFillShader.js +1 -1
- package/views/2d/engine/webgl/shaderGraph/techniques/animated/AnimatedPolyMeshWriters.js +1 -1
- package/views/2d/engine/webgl/shaderGraph/techniques/animated/attributes.js +1 -1
- package/views/2d/engine/webgl/shaders/sources/shaderRepository.js +1 -1
- package/views/2d/layers/BaseLayerViewGL2D.d.ts +1 -1
- package/views/2d/layers/features/schema/processor/symbols/ComplexSymbolSchema.js +1 -1
- package/views/2d/types.d.ts +3 -3
- package/views/3d/environment/CloudyWeather.d.ts +1 -1
- package/views/3d/environment/Environment.d.ts +4 -4
- package/views/3d/environment/FoggyWeather.d.ts +1 -1
- package/views/3d/environment/RainyWeather.d.ts +1 -1
- package/views/3d/environment/SnowyWeather.d.ts +1 -1
- package/views/3d/environment/SunLighting.d.ts +1 -1
- package/views/3d/environment/SunnyWeather.d.ts +1 -1
- package/views/3d/environment/VirtualLighting.d.ts +1 -1
- package/views/3d/webgl/RenderNode.d.ts +2 -2
- package/views/3d/webgl.d.ts +1 -1
- package/views/Magnifier.d.ts +3 -3
- package/views/MapView.d.ts +7 -7
- package/views/SceneView.d.ts +34 -37
- package/views/View.d.ts +2 -2
- package/views/interactive/sketch/SketchLabelOptions.d.ts +1 -1
- package/views/interactive/sketch/SketchTooltipOptions.d.ts +1 -1
- package/views/interactive/snapping/SnappingOptions.d.ts +7 -7
- package/views/support/HighlightOptions.d.ts +1 -1
- package/views/support/flow/dataUtils.js +1 -1
- package/views/ui/DefaultUI.d.ts +2 -2
- package/webscene/Environment.d.ts +10 -10
- package/webscene/Glow.d.ts +7 -5
- package/webscene/background/ColorBackground.d.ts +1 -1
- package/widgets/AreaMeasurement2D.d.ts +1 -1
- package/widgets/AreaMeasurement3D.d.ts +2 -2
- package/widgets/Attachments.d.ts +1 -1
- package/widgets/Attribution.d.ts +1 -1
- package/widgets/BasemapGallery.d.ts +1 -1
- package/widgets/BasemapLayerList.d.ts +3 -3
- package/widgets/BasemapToggle.d.ts +1 -1
- package/widgets/Bookmarks/BookmarksVisibleElements.d.ts +1 -1
- package/widgets/Bookmarks.d.ts +2 -2
- package/widgets/BuildingExplorer.d.ts +1 -1
- package/widgets/CatalogLayerList.d.ts +3 -3
- package/widgets/Compass.d.ts +2 -2
- package/widgets/CoordinateConversion.d.ts +1 -1
- package/widgets/Daylight.d.ts +5 -5
- package/widgets/DirectLineMeasurement3D.d.ts +2 -2
- package/widgets/Directions.d.ts +4 -4
- package/widgets/DistanceMeasurement2D.d.ts +1 -1
- package/widgets/Editor/CreateFeaturesWorkflow.d.ts +1 -1
- package/widgets/Editor.d.ts +2 -2
- package/widgets/ElevationProfile/ElevationProfileLineGround.d.ts +1 -1
- package/widgets/ElevationProfile/ElevationProfileLineInput.d.ts +1 -1
- package/widgets/ElevationProfile/ElevationProfileLineView.d.ts +1 -1
- package/widgets/ElevationProfile.d.ts +3 -3
- package/widgets/Expand.d.ts +1 -1
- package/widgets/FeatureForm.d.ts +1 -1
- package/widgets/FeatureTable/ActionColumn.d.ts +1 -1
- package/widgets/FeatureTable/AttachmentsColumn.d.ts +1 -1
- package/widgets/FeatureTable/FeatureTableViewModel.d.ts +3 -3
- package/widgets/FeatureTable/Grid/GroupColumn.d.ts +1 -1
- package/widgets/FeatureTable/RelationshipColumn.d.ts +1 -1
- package/widgets/FeatureTable/VisibleElements.d.ts +1 -1
- package/widgets/FeatureTable.d.ts +9 -9
- package/widgets/FeatureTemplates/FeatureTemplatesViewModel.d.ts +5 -5
- package/widgets/FeatureTemplates.d.ts +8 -8
- package/widgets/Features/FeaturesViewModel.d.ts +2 -2
- package/widgets/Features/FeaturesVisibleElements.d.ts +2 -2
- package/widgets/Features.d.ts +1 -1
- package/widgets/Histogram.d.ts +2 -2
- package/widgets/HistogramRangeSlider.d.ts +1 -1
- package/widgets/Home.d.ts +1 -1
- package/widgets/LayerList.d.ts +4 -4
- package/widgets/Legend.d.ts +8 -8
- package/widgets/LineOfSight.d.ts +1 -1
- package/widgets/Locate.d.ts +2 -2
- package/widgets/Measurement.d.ts +1 -1
- package/widgets/NavigationToggle/NavigationToggleViewModel.d.ts +1 -1
- package/widgets/NavigationToggle.d.ts +3 -3
- package/widgets/OrientedImageryViewer/OrientedImageryViewerViewModel.js +1 -1
- package/widgets/OrientedImageryViewer/adapters/sketch/MeasurementAdapter.js +1 -1
- package/widgets/OrientedImageryViewer/components/ImageLocationViewModel.js +1 -1
- package/widgets/OrientedImageryViewer/imageMeasurementUtils.js +1 -1
- package/widgets/OrientedImageryViewer/navigation/NavigationManager.js +1 -1
- package/widgets/OrientedImageryViewer/navigation/queries.js +1 -1
- package/widgets/OrientedImageryViewer/navigation/utils.js +1 -1
- package/widgets/Popup/PopupVisibleElements.d.ts +2 -2
- package/widgets/Popup.d.ts +5 -5
- package/widgets/Print/CustomTemplate.d.ts +1 -1
- package/widgets/Print/TemplateOptions.d.ts +4 -4
- package/widgets/ScaleRangeSlider.d.ts +1 -1
- package/widgets/Search/SearchViewModel.d.ts +4 -4
- package/widgets/Search.d.ts +5 -5
- package/widgets/ShadowCast.d.ts +3 -3
- package/widgets/Sketch/SketchViewModel.d.ts +39 -39
- package/widgets/Sketch.d.ts +43 -43
- package/widgets/Slice.d.ts +2 -2
- package/widgets/Slider/SliderViewModel.d.ts +2 -2
- package/widgets/Slider.d.ts +9 -9
- package/widgets/Swipe/SwipeViewModel.d.ts +1 -1
- package/widgets/Swipe.d.ts +2 -2
- package/widgets/TableList.d.ts +1 -1
- package/widgets/TimeSlider/TimeSliderViewModel.d.ts +8 -8
- package/widgets/TimeSlider/types.d.ts +1 -1
- package/widgets/TimeSlider.d.ts +11 -11
- package/widgets/Track.d.ts +2 -2
- package/widgets/UtilityNetworkAssociations.d.ts +3 -3
- package/widgets/UtilityNetworkTrace.d.ts +4 -4
- package/widgets/UtilityNetworkValidateTopology.d.ts +1 -1
- package/widgets/ValuePicker.d.ts +5 -5
- package/widgets/VideoPlayer.d.ts +1 -1
- package/widgets/smartMapping/ClassedColorSlider.d.ts +1 -1
- package/widgets/smartMapping/ClassedSizeSlider.d.ts +1 -1
- package/widgets/smartMapping/ColorSizeSlider.d.ts +2 -2
- package/widgets/smartMapping/ColorSlider.d.ts +1 -1
- package/widgets/smartMapping/HeatmapSlider.d.ts +1 -1
- package/widgets/smartMapping/OpacitySlider.d.ts +1 -1
- package/widgets/smartMapping/SizeSlider.d.ts +1 -1
- package/widgets/smartMapping/SmartMappingSliderBase.d.ts +4 -4
- package/widgets/smartMapping/SmartMappingSliderViewModel.d.ts +6 -6
- package/widgets/support/GridControls.d.ts +1 -1
- package/widgets/support/SnappingControls/VisibleElements.d.ts +1 -1
- package/widgets/support/SnappingControls.d.ts +6 -6
- package/assets/esri/core/workers/chunks/e0519f24430fecead87b.js +0 -1
|
@@ -120,7 +120,7 @@ export interface FlowRendererProperties extends VisualVariablesMixinProperties,
|
|
|
120
120
|
* To use this renderer, the [source type of your raster dataset](https://pro.arcgis.com/en/pro-app/latest/help/data/imagery/raster-dataset-properties.htm) must be `Vector-UV` or `Vector-MagDir`.
|
|
121
121
|
* The direction of the raster defines the direction of movement, and the magnitude defines the visible length of the streamline.
|
|
122
122
|
*
|
|
123
|
-
* [](https://developers.arcgis.com/javascript/latest/sample-code/layers-imagery-afrenderer/)
|
|
124
124
|
*
|
|
125
125
|
* <span id="streamline-animation"></span>
|
|
126
126
|
* ## Streamline animation
|
|
@@ -131,7 +131,7 @@ export interface FlowRendererProperties extends VisualVariablesMixinProperties,
|
|
|
131
131
|
* The FlowRenderer displays animated streamlines by moving a visible trail (in red) along a precomputed path, or streamline (in black).
|
|
132
132
|
* This path represents the full route of flow and is based on the direction of the underlying data.
|
|
133
133
|
*
|
|
134
|
-
* 
|
|
135
135
|
*
|
|
136
136
|
* The trail's length and speed are initially influenced by the magnitude of the source data. To give users more control, the following properties can be adjusted:
|
|
137
137
|
*
|
|
@@ -202,7 +202,7 @@ export default class FlowRenderer extends FlowRendererSuperclass {
|
|
|
202
202
|
*
|
|
203
203
|
* |`density = 0.1` | `density = 1` | `density = 1.5` |
|
|
204
204
|
* |----------------|-----------------|---------------|
|
|
205
|
-
* |  |  |  |
|
|
206
206
|
*
|
|
207
207
|
* @default 0.8
|
|
208
208
|
*/
|
|
@@ -212,8 +212,8 @@ export default class FlowRenderer extends FlowRendererSuperclass {
|
|
|
212
212
|
*
|
|
213
213
|
* Value | Description | Example
|
|
214
214
|
* ------|-------------|---------
|
|
215
|
-
* flow-from | Flow from angle. | 
|
|
216
|
+
* flow-to | Flow to angle. | 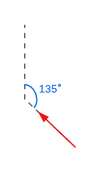
|
|
217
217
|
*
|
|
218
218
|
* @default "flow-from"
|
|
219
219
|
*/
|
|
@@ -280,7 +280,7 @@ export default class FlowRenderer extends FlowRendererSuperclass {
|
|
|
280
280
|
* The actual trail length is first based on the data, then further scaled by this property.
|
|
281
281
|
* |`trailLength = 20` | `trailLength = 100` | `trailLength = 250` |
|
|
282
282
|
* |----------------|-----------------|---------------|
|
|
283
|
-
* |  |  |  |
|
|
284
284
|
*
|
|
285
285
|
* @default 100
|
|
286
286
|
* @see [Streamline animation](https://developers.arcgis.com/javascript/latest/references/core/renderers/FlowRenderer/#streamline-animation)
|
|
@@ -241,9 +241,9 @@ export default class HeatmapRenderer extends Renderer {
|
|
|
241
241
|
*
|
|
242
242
|
* Zoom offset from reference scale | Static (reference scale) | Dynamic (no reference scale)
|
|
243
243
|
* ------------------------------|----------|--------------
|
|
244
|
-
* +1 LOD |  | 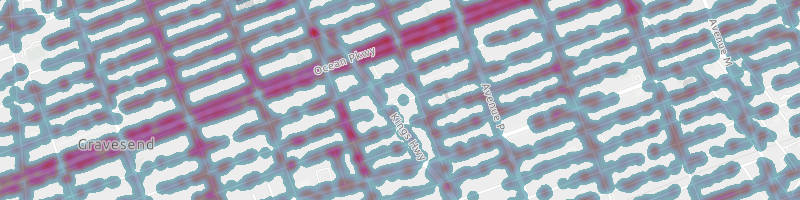
|
|
245
|
+
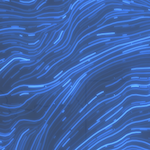
* reference scale | 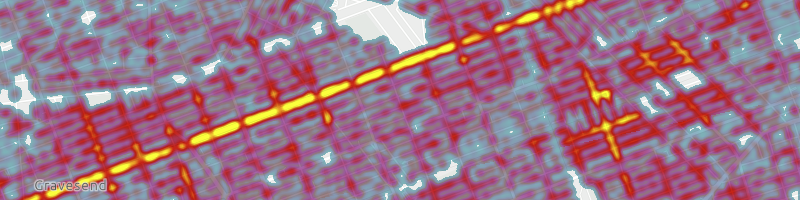 | 
|
|
246
|
+
* -1 LOD | 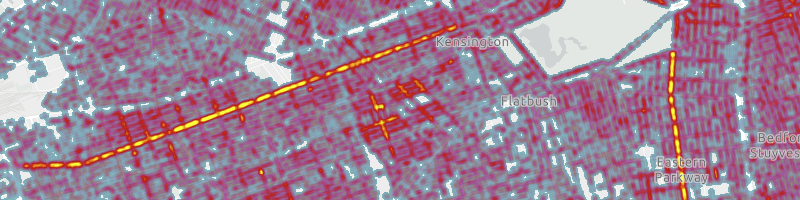 | 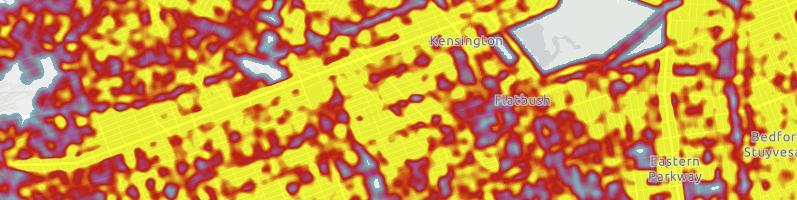
|
|
247
247
|
*
|
|
248
248
|
* @default 0
|
|
249
249
|
* @since 4.24
|
|
@@ -147,7 +147,7 @@ export interface PieChartRendererProperties extends RendererProperties, VisualVa
|
|
|
147
147
|
* property. You can vary the size of each pie based on data with any other field value or Arcade
|
|
148
148
|
* expression using [visualVariables](https://developers.arcgis.com/javascript/latest/references/core/renderers/PieChartRenderer/#visualVariables).
|
|
149
149
|
*
|
|
150
|
-
* [](https://developers.arcgis.com/javascript/latest/sample-code/visualization-pie-chart/)
|
|
151
151
|
*
|
|
152
152
|
* > [!WARNING]
|
|
153
153
|
* >
|
|
@@ -21,7 +21,7 @@ export interface RasterShadedReliefRendererProperties extends Partial<Pick<Raste
|
|
|
21
21
|
*
|
|
22
22
|
* Traditional | Multi-directional |
|
|
23
23
|
* ----------- | ----------------- |
|
|
24
|
-
* <img alt="Undo update" src="https://developers.arcgis.com/javascript/latest/assets/
|
|
24
|
+
* <img alt="Undo update" src="https://developers.arcgis.com/javascript/latest/assets/references/core/renderers/renderer-shadedRelief-traditional.png">|<img alt="Undo update" src="https://developers.arcgis.com/javascript/latest/assets/references/core/renderers/renderer-shadedRelief-multidirectional.png">|
|
|
25
25
|
*
|
|
26
26
|
* @since 4.16
|
|
27
27
|
* @see [Hillshade function](https://pro.arcgis.com/en/pro-app/latest/help/data/imagery/hillshade-function.htm)
|
package/renderers/Renderer.d.ts
CHANGED
|
@@ -68,7 +68,7 @@ export interface RendererProperties {
|
|
|
68
68
|
* to which the highway belongs. For example, green lines are highways in the "Tampa District" whereas
|
|
69
69
|
* red lines are highways in the "Central District".
|
|
70
70
|
*
|
|
71
|
-
* [](https://developers.arcgis.com/javascript/latest/sample-code/visualization-location-types/)
|
|
72
72
|
*
|
|
73
73
|
* Read more on the [UniqueValueRenderer](https://developers.arcgis.com/javascript/latest/references/core/renderers/UniqueValueRenderer/) page.
|
|
74
74
|
*
|
|
@@ -98,7 +98,7 @@ export interface RendererProperties {
|
|
|
98
98
|
* visual variable to map predominant types and the strength of their predominance in relation
|
|
99
99
|
* to other variables.
|
|
100
100
|
*
|
|
101
|
-
* [](https://developers.arcgis.com/javascript/latest/sample-code/visualization-vv-color/)
|
|
102
102
|
*
|
|
103
103
|
* See [visual variables](https://developers.arcgis.com/javascript/latest/references/core/renderers/SimpleRenderer/#visualVariables) for more information.
|
|
104
104
|
*
|
|
@@ -65,7 +65,7 @@ export interface SimpleRendererProperties extends RendererProperties, VisualVari
|
|
|
65
65
|
* [SceneView](https://developers.arcgis.com/javascript/latest/references/core/views/SceneView/) to thematically visualize a hurricane's windspeed in
|
|
66
66
|
* various locations along its path.
|
|
67
67
|
*
|
|
68
|
-
* [](https://developers.arcgis.com/javascript/latest/sample-code/visualization-multivariate-3d/)
|
|
69
69
|
*
|
|
70
70
|
* To read more about visual variables, see the [visualVariables](https://developers.arcgis.com/javascript/latest/references/core/renderers/SimpleRenderer/#visualVariables) property.
|
|
71
71
|
*
|
|
@@ -54,7 +54,7 @@ export interface VectorFieldRendererProperties extends VisualVariablesMixinPrope
|
|
|
54
54
|
* It can also be used to symbolize a single raster layer where the symbols are scalar.
|
|
55
55
|
* The direction of the raster defines the angles, while the magnitude of the raster defines the size of the symbol.
|
|
56
56
|
*
|
|
57
|
-
* [](https://developers.arcgis.com/javascript/latest/sample-code/layers-imagery-vfrenderer/)
|
|
58
58
|
*
|
|
59
59
|
* > [!WARNING]
|
|
60
60
|
* >
|
|
@@ -17,9 +17,9 @@ export interface VisualVariablesMixinProperties {
|
|
|
17
17
|
*
|
|
18
18
|
* Type | Object Specification | Legend Example
|
|
19
19
|
* -----|----------------------|---------------
|
|
20
|
-
* color | [ColorVisualVariable](https://developers.arcgis.com/javascript/latest/references/core/renderers/visualVariables/ColorVariable/) |  |  |  | 
|
|
21
|
+
* size | [SizeVisualVariable](https://developers.arcgis.com/javascript/latest/references/core/renderers/visualVariables/SizeVariable/) | 
|
|
22
|
+
* opacity | [OpacityVisualVariable](https://developers.arcgis.com/javascript/latest/references/core/renderers/visualVariables/OpacityVariable/) | 
|
|
23
23
|
* rotation | [RotationVisualVariable](https://developers.arcgis.com/javascript/latest/references/core/renderers/visualVariables/RotationVariable/) | -
|
|
24
24
|
*
|
|
25
25
|
* Visual variables are primarily be used in two ways.
|
|
@@ -52,7 +52,7 @@ export interface VisualVariablesMixinProperties {
|
|
|
52
52
|
* The sample below uses
|
|
53
53
|
* three visual variables (size, color, and opacity).
|
|
54
54
|
*
|
|
55
|
-
* [](https://developers.arcgis.com/javascript/latest/sample-code/visualization-multivariate-2d/)
|
|
56
56
|
*
|
|
57
57
|
* #### 2. Mapping real-world sizes
|
|
58
58
|
*
|
|
@@ -98,9 +98,9 @@ export abstract class VisualVariablesMixin {
|
|
|
98
98
|
*
|
|
99
99
|
* Type | Object Specification | Legend Example
|
|
100
100
|
* -----|----------------------|---------------
|
|
101
|
-
* color | [ColorVisualVariable](https://developers.arcgis.com/javascript/latest/references/core/renderers/visualVariables/ColorVariable/) |  |  |  | 
|
|
102
|
+
* size | [SizeVisualVariable](https://developers.arcgis.com/javascript/latest/references/core/renderers/visualVariables/SizeVariable/) | 
|
|
103
|
+
* opacity | [OpacityVisualVariable](https://developers.arcgis.com/javascript/latest/references/core/renderers/visualVariables/OpacityVariable/) | 
|
|
104
104
|
* rotation | [RotationVisualVariable](https://developers.arcgis.com/javascript/latest/references/core/renderers/visualVariables/RotationVariable/) | -
|
|
105
105
|
*
|
|
106
106
|
* Visual variables are primarily be used in two ways.
|
|
@@ -133,7 +133,7 @@ export abstract class VisualVariablesMixin {
|
|
|
133
133
|
* The sample below uses
|
|
134
134
|
* three visual variables (size, color, and opacity).
|
|
135
135
|
*
|
|
136
|
-
* [](https://developers.arcgis.com/javascript/latest/sample-code/visualization-multivariate-2d/)
|
|
137
137
|
*
|
|
138
138
|
* #### 2. Mapping real-world sizes
|
|
139
139
|
*
|
|
@@ -1,2 +1,2 @@
|
|
|
1
1
|
/* COPYRIGHT Esri - https://js.arcgis.com/5.0/LICENSE.txt */
|
|
2
|
-
import{allocateFlatGeometry as t,writeBezierCurveSegment as e,writeCircularArcSegment as s,writeEllipticArc7Segment as r}from"../../../geometry/FlatGeometry.js";import{featureGeometryTypeKebabDictionary as i}from"../../../geometry/support/typeUtils.js";import{zScale as h}from"../../../geometry/support/zscale.js";import{FlatFeature as o}from"../../../layers/graphics/FlatFeature.js";import{FlatFeatureSet as a}from"../../../layers/graphics/FlatFeatureSet.js";import _ from"../../../layers/graphics/OptimizedGeometry.js";import{createFeatureId as n}from"../../../layers/graphics/data/createFeatureId.js";import{makeAttributesClass as f,makeVertexTransformer as m}from"./pbfFeatureSetUtils.js";class u{constructor(t){this._options=t,this.featureSet=new a,this.parseOnly=null,this._idInfo=null,this._transformInPlace=null,this._transformInPlaceXY=null,this._push=u._pushXY,this._attributesClass=null,this._previousX=0,this._previousY=0,this._vertex=[],this._i=0,this._geometry=null,this._iVertex=0,this._iPart=0,this._isPolygon=!1,this._ringEndsAt=-1}queryGeometryType(){return this.featureSet.queryGeometryType}queryGeometry(){return this.featureSet.queryGeometry}idField(t){"string"==typeof t?this._idInfo??={type:"object-id",fieldName:t}:this._idInfo={type:"unique-id-simple",fieldName:t.name}}finish(){if(this._idInfo)for(const s of this.featureSet.features)s.objectId=n(s,this._idInfo);const{spatialReference:t,features:e}=this.featureSet;if(t)for(const{geometry:s}of e)s&&(s.spatialReference=t);this.featureSet.transform=null}feature(){this._attributesClass??=f(this.featureSet.fields?.map(t=>t.name)??[]),this.featureSet.features.push(new o(null,new this._attributesClass,null,0)),this._setVertexTransformer()}centroid(t){const{hasZ:e,hasM:s}=this.featureSet;this.featureSet.features.at(-1).centroid=new _([],t,e,s)}geometry(e,s,r){this._previousX=this._previousY=0,this._i=this._iVertex=this._iPart=0;let{hasZ:h,hasM:o}=this.featureSet;h??=!1,o??=!1,this._vertex=[0,0],h&&this._vertex.push(0),o&&this._vertex.push(0);const a=i.fromJSON(s);this._isPolygon="polygon"===a;const _=Number(this._isPolygon),n="point"===a?1:r.reduce((t,e)=>t+e-_,0),f=r.length;if(this._geometry=t(a,n,f,h,o,!1),this._push=h?o?u._pushXYZM:u._pushXYZ:o?u._pushXYM:u._pushXY,this._geometry.isMultipart()){this._geometry.partOffsets[0]=0;for(let t=0;t<f;++t)this._geometry.partOffsets[t+1]=this._geometry.partOffsets[t]+r[t]-_}this._ringEndsAt=_?this._geometry.partOffsets.at(1)??0:-1,1===e?(this.featureSet.queryGeometry=this._geometry,this.featureSet.queryGeometryType=s):this.featureSet.features.at(-1).geometry=this._geometry}coord(t){const e=this._vertex;e[this._i++]=t,this._i<e.length||(this._i=0,e[0]+=this._previousX,e[1]+=this._previousY,[this._previousX,this._previousY]=e,this._iVertex===this._ringEndsAt&&(++this._iPart,this._ringEndsAt=this._geometry.partOffsets[this._iPart+1]),this._transformInPlace?.(e),this._push(this))}curvedGeometry(e,s,r,h){let{hasZ:o,hasM:a}=this.featureSet;o??=!1,a??=!1,this._i=this._iVertex=this._iPart=0;const _=i.fromJSON(e);this._isPolygon="polygon"===_;const n=Number(!this._isPolygon),f=s.length;let m=0,u=0,
|
|
2
|
+
import{allocateFlatGeometry as t,writeBezierCurveSegment as e,writeCircularArcSegment as s,writeEllipticArc7Segment as r}from"../../../geometry/FlatGeometry.js";import{featureGeometryTypeKebabDictionary as i}from"../../../geometry/support/typeUtils.js";import{zScale as h}from"../../../geometry/support/zscale.js";import{FlatFeature as o}from"../../../layers/graphics/FlatFeature.js";import{FlatFeatureSet as a}from"../../../layers/graphics/FlatFeatureSet.js";import _ from"../../../layers/graphics/OptimizedGeometry.js";import{createFeatureId as n}from"../../../layers/graphics/data/createFeatureId.js";import{makeAttributesClass as f,makeVertexTransformer as m}from"./pbfFeatureSetUtils.js";class u{constructor(t){this._options=t,this.featureSet=new a,this.parseOnly=null,this._idInfo=null,this._transformInPlace=null,this._transformInPlaceXY=null,this._push=u._pushXY,this._attributesClass=null,this._previousX=0,this._previousY=0,this._vertex=[],this._i=0,this._geometry=null,this._iVertex=0,this._iPart=0,this._isPolygon=!1,this._ringEndsAt=-1}queryGeometryType(){return this.featureSet.queryGeometryType}queryGeometry(){return this.featureSet.queryGeometry}idField(t){"string"==typeof t?this._idInfo??={type:"object-id",fieldName:t}:this._idInfo={type:"unique-id-simple",fieldName:t.name}}finish(){if(this._idInfo)for(const s of this.featureSet.features)s.objectId=n(s,this._idInfo);const{spatialReference:t,features:e}=this.featureSet;if(t)for(const{geometry:s}of e)s&&(s.spatialReference=t);this.featureSet.transform=null}feature(){this._attributesClass??=f(this.featureSet.fields?.map(t=>t.name)??[]),this.featureSet.features.push(new o(null,new this._attributesClass,null,0)),this._setVertexTransformer()}centroid(t){const{hasZ:e,hasM:s}=this.featureSet;this.featureSet.features.at(-1).centroid=new _([],t,e,s)}geometry(e,s,r){this._previousX=this._previousY=0,this._i=this._iVertex=this._iPart=0;let{hasZ:h,hasM:o}=this.featureSet;h??=!1,o??=!1,this._vertex=[0,0],h&&this._vertex.push(0),o&&this._vertex.push(0);const a=i.fromJSON(s);this._isPolygon="polygon"===a;const _=Number(this._isPolygon),n="point"===a?1:r.reduce((t,e)=>t+e-_,0),f=r.length;if(this._geometry=t(a,n,f,h,o,!1),this._push=h?o?u._pushXYZM:u._pushXYZ:o?u._pushXYM:u._pushXY,this._geometry.isMultipart()){this._geometry.partOffsets[0]=0;for(let t=0;t<f;++t)this._geometry.partOffsets[t+1]=this._geometry.partOffsets[t]+r[t]-_}this._ringEndsAt=_?this._geometry.partOffsets.at(1)??0:-1,1===e?(this.featureSet.queryGeometry=this._geometry,this.featureSet.queryGeometryType=s):this.featureSet.features.at(-1).geometry=this._geometry}coord(t){const e=this._vertex;e[this._i++]=t,this._i<e.length||(this._i=0,e[0]+=this._previousX,e[1]+=this._previousY,[this._previousX,this._previousY]=e,this._iVertex===this._ringEndsAt&&(++this._iPart,this._ringEndsAt=this._geometry.partOffsets[this._iPart+1],this._previousX=this._previousY=0),this._transformInPlace?.(e),this._push(this))}curvedGeometry(e,s,r,h){let{hasZ:o,hasM:a}=this.featureSet;o??=!1,a??=!1,this._i=this._iVertex=this._iPart=0;const _=i.fromJSON(e);this._isPolygon="polygon"===_;const n=Number(!this._isPolygon),f=s.length;let m=0,u=0,p=n*f;for(let t=0;t<r.length;++t)switch(p+=h[t],r[t]){case 1:case 3:m+=h[t];continue;case 2:u+=h[t]}this._geometry=t(_,p,f,o,a,!0,m,u);const{partOffsets:l}=this._geometry;l[0]=0;for(let t=0,i=0;t<f;++t){l[t+1]=l[t]+n;for(let e=0;e<s[t];++e)l[t+1]+=h[i++]}switch(e){case"esriGeometryPoint":case"esriGeometryMultipoint":throw new Error(`Curved ${e} does not make sense`)}this.featureSet.features.at(-1).geometry=this._geometry}startCurvedPart(t){}finishCurvedPart(t){this._isPolygon||(this._transform(t,this._vertex),this._push(this)),++this._iPart}lineSegment(t,e){this._transform(t,this._vertex),this._push(this)}bezierSegment(t,s,r,i){this._transform(t,this._vertex),this._push(this),this._transformXY(s,c.b[0]),this._transformXY(r,c.b[1]),this._transformXY(i,c.b[2]),this._i=e(this._vertex,c,this._geometry,this._iVertex-1,this._i)}circularArcSegment(t,e,r){this._transform(t,this._vertex),this._push(this),this._transformXY(e,p.c[0]),this._transformXY(r,p.c[1]),this._i=s(this._vertex,p,this._geometry,this._iVertex-1,this._i)}ellipticArcSegment(t,e,s,i,h,o,a,_){this._transform(t,this._vertex),this._push(this),this._transformXY(e,l.a[0]),this._transformXY(s,l.a[1]),l.a[2]=i,l.a[3]=h,l.a[4]=o,l.a[5]=a,l.a[6]=_,this._i=r(this._vertex,l,this._geometry,this._iVertex-1,this._i)}static _pushXY(t){const e=t._iVertex++,{vertexXY:s}=t._geometry;[s[2*e],s[2*e+1]]=t._vertex}static _pushXYZ(t){const e=t._iVertex++,{vertexXY:s,vertexZ:r}=t._geometry;[s[2*e],s[2*e+1],r[e]]=t._vertex}static _pushXYM(t){const e=t._iVertex++,{vertexXY:s,vertexM:r}=t._geometry;[s[2*e],s[2*e+1],r[e]]=t._vertex}static _pushXYZM(t){const e=t._iVertex++,{vertexXY:s,vertexM:r,vertexZ:i}=t._geometry;[s[2*e],s[2*e+1],i[e],r[e]]=t._vertex}_setVertexTransformer(){const{sourceSpatialReference:t}=this._options,{spatialReference:e,hasZ:s,transform:r}=this.featureSet,i=s?h(t,e):1;this._transformInPlace??=m(this.featureSet,i),this._transformInPlaceXY??=m({transform:r})}_transform(t,e){for(let s=0;s<t.length;++s)e[s]=t[s];this._transformInPlace?.(e)}_transformXY(t,e){e[0]=t[0],e[1]=t[1],this._transformInPlaceXY?.(e)}}const p={c:[[0,0],[0,0]]},l={a:[[0,0],[0,0],0,0,0,0,0]},c={b:[[0,0],[0,0],[0,0]]};export{u as FlatFeatureSetParserContext};
|
|
@@ -25,7 +25,7 @@ export interface OrientationInfo {
|
|
|
25
25
|
* Attachments are available if the [FeatureLayer.capabilities.data.supportsAttachment](https://developers.arcgis.com/javascript/latest/references/core/layers/FeatureLayer/#capabilities)
|
|
26
26
|
* is `true`.
|
|
27
27
|
*
|
|
28
|
-
* 
|
|
29
29
|
*
|
|
30
30
|
* @since 4.19
|
|
31
31
|
* @see [PopupTemplate](https://developers.arcgis.com/javascript/latest/references/core/PopupTemplate/)
|
|
@@ -27,7 +27,7 @@ export interface AutoIntervalBinParametersProperties extends BinParametersBasePr
|
|
|
27
27
|
* ```
|
|
28
28
|
*
|
|
29
29
|
* <figure>
|
|
30
|
-
* <img src="https://developers.arcgis.com/javascript/latest/assets/
|
|
30
|
+
* <img src="https://developers.arcgis.com/javascript/latest/assets/references/core/rest/binQuery/auto-bin.png" alt="color-blend" style="width:400px;"/>
|
|
31
31
|
* <figcaption>Total accidents in the USA by hour for the year 2021. Each bin represents the number of accidents that occurred during each hour of the day. The chart is based on the results obtained from the bin query shown above.</figcaption>
|
|
32
32
|
* </figure>
|
|
33
33
|
*
|
|
@@ -47,7 +47,7 @@ export interface DateBinParametersProperties extends BinParametersBaseProperties
|
|
|
47
47
|
* ```
|
|
48
48
|
*
|
|
49
49
|
* <figure>
|
|
50
|
-
* <img src="https://developers.arcgis.com/javascript/latest/assets/
|
|
50
|
+
* <img src="https://developers.arcgis.com/javascript/latest/assets/references/core/rest/binQuery/date-bin.png" alt="color-blend" style="width:400px;"/>
|
|
51
51
|
* <figcaption>Total accidents in the USA by month for the year 2021. Each bin represents the number of accidents that occurred during each month. The results are presented in Pacific time zone. The chart is based on the results of the binQuery shown above.</figcaption>
|
|
52
52
|
* </figure>
|
|
53
53
|
*
|
|
@@ -24,7 +24,7 @@ export interface FixedBoundariesBinParametersProperties extends BinParametersBas
|
|
|
24
24
|
* ```
|
|
25
25
|
*
|
|
26
26
|
* <figure>
|
|
27
|
-
* <img src="https://developers.arcgis.com/javascript/latest/assets/
|
|
27
|
+
* <img src="https://developers.arcgis.com/javascript/latest/assets/references/core/rest/binQuery/fixed-boundaries-bin.png" alt="color-blend" style="width:400px;"/>
|
|
28
28
|
* <figcaption>2022 median household income distribution with each bin representing an income group defined by the fixed boundaries bin as shown above.</figcaption>
|
|
29
29
|
* </figure>
|
|
30
30
|
*
|
|
@@ -26,7 +26,7 @@ export interface FixedIntervalBinParametersProperties extends BinParametersBaseP
|
|
|
26
26
|
* ```
|
|
27
27
|
*
|
|
28
28
|
* <figure>
|
|
29
|
-
* <img src="https://developers.arcgis.com/javascript/latest/assets/
|
|
29
|
+
* <img src="https://developers.arcgis.com/javascript/latest/assets/references/core/rest/binQuery/fixed-interval-bin.png" alt="fixed-interval" style="width:400px;"/>
|
|
30
30
|
* <figcaption>Temperature ranges at sea level for each Ecological Marine Units (EMU) in 2018 are depicted, with each bin representing a 5-degree Celsius interval. The chart is based on the results of the binQuery illustrated above.</figcaption>
|
|
31
31
|
* </figure>
|
|
32
32
|
*
|
|
@@ -6,7 +6,7 @@
|
|
|
6
6
|
* cluster label will display `2.4k`). In some cases, such as renderers with a [SizeVariable](https://developers.arcgis.com/javascript/latest/references/core/renderers/visualVariables/SizeVariable/),
|
|
7
7
|
* the default label will display the average value of the attribute represented by the size variable.
|
|
8
8
|
*
|
|
9
|
-
* [](https://developers.arcgis.com/javascript/latest/sample-code/featurereduction-cluster-filter/)
|
|
10
10
|
*
|
|
11
11
|
* This includes secondary labeling schemes you can experiment with in your clusters. This module only applies to layers with a point geometry type.
|
|
12
12
|
*
|
|
@@ -5,13 +5,13 @@
|
|
|
5
5
|
* layer's renderer. For example, in a layer visualizing population, the cluster popup template will include
|
|
6
6
|
* the number of features in the cluster and the average population of features in the cluster.
|
|
7
7
|
*
|
|
8
|
-
* 
|
|
9
9
|
*
|
|
10
10
|
* For layers with
|
|
11
11
|
* a [UniqueValueRenderer](https://developers.arcgis.com/javascript/latest/references/core/renderers/UniqueValueRenderer/), the popup will include the predominant unique value info
|
|
12
12
|
* of features in the cluster.
|
|
13
13
|
*
|
|
14
|
-
* [](https://developers.arcgis.com/javascript/latest/sample-code/featurereduction-cluster-filter/)
|
|
15
15
|
*
|
|
16
16
|
* This module only applies to layers with a point geometry type.
|
|
17
17
|
*
|
|
@@ -10,7 +10,7 @@
|
|
|
10
10
|
*
|
|
11
11
|
* Suggested default template based on renderer | Traditional default
|
|
12
12
|
* -----|----------
|
|
13
|
-
* [](https://developers.arcgis.com/javascript/latest/sample-code/visualization-sm-predominance/) | 
|
|
14
14
|
*
|
|
15
15
|
* @since 4.16
|
|
16
16
|
* @see [Sample - Generate a predominance visualization](https://developers.arcgis.com/javascript/latest/sample-code/visualization-sm-predominance/)
|
|
@@ -60,8 +60,8 @@ export interface FlowRendererParameters extends RasterRendererParameters {
|
|
|
60
60
|
* Possible values are listed below.
|
|
61
61
|
* | Value | Description | Example |
|
|
62
62
|
* | ----- | ----------- | ------- |
|
|
63
|
-
* | flow-line | Renders the uv and magnitude data as animated flow lines. This is ideal for representing wind and other atmospheric data. |  |
|
|
64
|
+
* | wave-front | Renders UV and magnitude data in a wave-like animation. This theme works well for ocean data. |  |
|
|
65
65
|
*
|
|
66
66
|
* > [!WARNING]
|
|
67
67
|
* >
|
|
@@ -394,12 +394,12 @@ export interface VisualVariableParametersBase extends AbortOptions {
|
|
|
394
394
|
* Possible values are listed below.
|
|
395
395
|
* | Value | Description | Example |
|
|
396
396
|
* | ----- | ----------- | ------- |
|
|
397
|
-
* | high-to-low | High values are emphasized with strong colors. The data values above one standard deviation from the mean are assigned the strongest color. Data values below one standard deviation from the mean are assigned the weakest color. All other values are interpolated. |  are visualized with weak colors while other values are emphasized with strong colors. All other values are interpolated. |  are emphasized with strong colors while other values are visualized with weak colors. All other values are interpolated. |  |
|
|
398
|
+
* | above | High values are emphasized with strong colors. The max data value is assigned the strongest color. The middle or average data value is assigned the weakest color. All other values are interpolated. |  |
|
|
399
|
+
* | below | Low values are emphasized with strong colors. The min data value is assigned the strongest color. The middle or average data value is assigned the weakest color. All other values are interpolated. |  |
|
|
400
|
+
* | above-and-below | Values centered on a meaningful data value (e.g. the average) are visualized with weak colors while other values are emphasized with strong colors. All other values are interpolated. |  |
|
|
401
|
+
* | centered-on | Values centered on a meaningful data value (e.g. the average) are emphasized with strong colors while other values are visualized with weak colors. All other values are interpolated. |  |
|
|
402
|
+
* | extremes | High and low values are emphasized with strong colors. All others are visualized with weak colors. All other values are interpolated. |  |
|
|
403
403
|
*
|
|
404
404
|
* @default high-to-low
|
|
405
405
|
*/
|
|
@@ -947,12 +947,12 @@ export interface AgeRendererParameters extends AbortOptions {
|
|
|
947
947
|
* Possible values are listed below.
|
|
948
948
|
* | Value | Description | Example |
|
|
949
949
|
* | ----- | ----------- | ------- |
|
|
950
|
-
* | high-to-low | High values are emphasized with strong colors. The data values above one standard deviation from the mean are assigned the strongest color. Data values below one standard deviation from the mean are assigned the weakest color. All other values are interpolated. |  are visualized with weak colors while other values are emphasized with strong colors. All other values are interpolated. |  are emphasized with strong colors while other values are visualized with weak colors. All other values are interpolated. |  |
|
|
951
|
+
* | above | High values are emphasized with strong colors. The max data value is assigned the strongest color. The middle or average data value is assigned the weakest color. All other values are interpolated. |  |
|
|
952
|
+
* | below | Low values are emphasized with strong colors. The min data value is assigned the strongest color. The middle or average data value is assigned the weakest color. All other values are interpolated. |  |
|
|
953
|
+
* | above-and-below | Values centered on a meaningful data value (e.g. the average) are visualized with weak colors while other values are emphasized with strong colors. All other values are interpolated. |  |
|
|
954
|
+
* | centered-on | Values centered on a meaningful data value (e.g. the average) are emphasized with strong colors while other values are visualized with weak colors. All other values are interpolated. |  |
|
|
955
|
+
* | extremes | High and low values are emphasized with strong colors. All others are visualized with weak colors. All other values are interpolated. |  |
|
|
956
956
|
*
|
|
957
957
|
* @default high-to-low
|
|
958
958
|
*/
|
|
@@ -10,7 +10,7 @@
|
|
|
10
10
|
*
|
|
11
11
|
* The example below depicts the predominant decade in which homes were constructed based on a city's block groups.
|
|
12
12
|
*
|
|
13
|
-
* [](https://developers.arcgis.com/javascript/latest/sample-code/visualization-sm-predominance/)
|
|
14
14
|
*
|
|
15
15
|
* > [!WARNING]
|
|
16
16
|
* >
|
|
@@ -158,7 +158,7 @@ export interface RendererParameters extends AbortOptions {
|
|
|
158
158
|
* where the predominant value beats all others by a large margin are given a high opacity. Features where the predominant value beats
|
|
159
159
|
* others by a small margin will be assigned a low opacity, indicating that while the feature has a winning value, it doesn't win by much.
|
|
160
160
|
*
|
|
161
|
-
* 
|
|
162
162
|
*/
|
|
163
163
|
includeOpacityVariable?: boolean | null;
|
|
164
164
|
/**
|
|
@@ -168,7 +168,7 @@ export interface RendererParameters extends AbortOptions {
|
|
|
168
168
|
* is good for visualizing how influential a particular feature is compared to the dataset as a whole. It removes bias introduced by
|
|
169
169
|
* features with large geographic areas, but relatively small data values.
|
|
170
170
|
*
|
|
171
|
-
* 
|
|
172
172
|
*/
|
|
173
173
|
includeSizeVariable?: boolean | null;
|
|
174
174
|
/**
|
|
@@ -8,7 +8,7 @@
|
|
|
8
8
|
* another.
|
|
9
9
|
*
|
|
10
10
|
* <figure>
|
|
11
|
-
* <a href="https://www.esri.com/arcgis-blog/products/arcgis-online/mapping/what-is-a-relationship-map" target="_blank"><img src="https://developers.arcgis.com/javascript/latest/assets/
|
|
11
|
+
* <a href="https://www.esri.com/arcgis-blog/products/arcgis-online/mapping/what-is-a-relationship-map" target="_blank"><img src="https://developers.arcgis.com/javascript/latest/assets/references/core/renderers/smartmapping/relationship-legend.png" alt="Relationship renderer legend"></a>
|
|
12
12
|
* <figcaption style="border-left: none;margin-top:0">
|
|
13
13
|
* The legend of a relationship renderer resembles a grid of two single-hue sequential color ramps overlaid on each other, forming a third
|
|
14
14
|
* hue along a diagonal line, which indicates where the two variables could potentially be related.
|
|
@@ -19,14 +19,14 @@
|
|
|
19
19
|
* vice versa. The image below shows what this style looks like on a map of U.S. counties where the percent of the population diagnosed
|
|
20
20
|
* with Diabetes is compared to the percent of the population that is obese.
|
|
21
21
|
*
|
|
22
|
-
* [](https://www.arcgis.com/home/webmap/viewer.html?webmap=c09aee5d3fee41c489fdffec21cb270a)
|
|
23
23
|
*
|
|
24
24
|
* While this visualization style was originally designed for 2D choropleth maps, it is particularly useful in 3D scenes where
|
|
25
25
|
* bivariate visualizations of color and size would not otherwise be possible since the size of features is reserved for real-world sizes of objects,
|
|
26
26
|
* such as buildings. Therefore, the relationship renderer becomes ideal for creating thematic bivariate visualizations of
|
|
27
27
|
* 3d object [SceneLayers](https://developers.arcgis.com/javascript/latest/references/core/layers/SceneLayer/).
|
|
28
28
|
*
|
|
29
|
-
* [](https://developers.arcgis.com/javascript/latest/sample-code/visualization-sm-relationship/)
|
|
30
30
|
*
|
|
31
31
|
* Keep in mind that even if you observe a positive relationship between the two variables of interest, it doesn't mean they
|
|
32
32
|
* are statistically correlated. It also doesn't imply the presence of one variable influences the other. Therefore, this
|
|
@@ -172,11 +172,11 @@ export interface RendererParameters extends AbortOptions {
|
|
|
172
172
|
*
|
|
173
173
|
* Value | Example | Description
|
|
174
174
|
* ------|-------------|--------
|
|
175
|
-
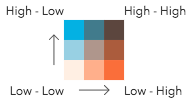
* null |  | The legend renders as a square. The top right corner of the legend indicates that values from both `field1` and `field2` are considered high. |
|
|
176
|
+
* HH | 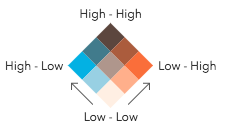 | The legend renders as a diamond with the focus on the top corner where values from both `field1` and `field2` are considered high. |
|
|
177
|
+
* HL | 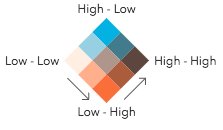 | The legend renders as a diamond with the focus on the top corner where values from `field1` are high and values from `field2` are low. |
|
|
178
|
+
* LH | 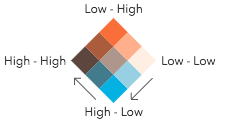 | The legend renders as a diamond with the focus on the top corner where values from `field1` are low and values from `field2` are high. |
|
|
179
|
+
* LL | 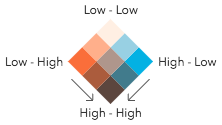 | The legend renders as a diamond with the focus on the top corner where values from both `field1` and `field2` are considered low. |
|
|
180
180
|
*
|
|
181
181
|
* @default null
|
|
182
182
|
*/
|
|
@@ -187,7 +187,7 @@ export interface RendererParameters extends AbortOptions {
|
|
|
187
187
|
*
|
|
188
188
|
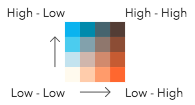
* 2 classes | 3 classes | 4 classes
|
|
189
189
|
* --|--|---
|
|
190
|
-
*  |  | 
|
|
191
191
|
*
|
|
192
192
|
* **Possible Values:** 2 | 3 | 4
|
|
193
193
|
*
|
|
@@ -352,7 +352,7 @@ export interface UpdateRendererParameters {
|
|
|
352
352
|
*
|
|
353
353
|
* 2 classes | 3 classes | 4 classes
|
|
354
354
|
* --|--|---
|
|
355
|
-
*  |  | 
|
|
356
356
|
*
|
|
357
357
|
* **Possible Values:** 2 | 3 | 4
|
|
358
358
|
*/
|
|
@@ -364,11 +364,11 @@ export interface UpdateRendererParameters {
|
|
|
364
364
|
*
|
|
365
365
|
* Value | Example | Description
|
|
366
366
|
* ------|-------------|--------
|
|
367
|
-
* null |  | The legend renders as a square. The top right corner of the legend indicates that values from both `field1` and `field2` are considered high. |
|
|
368
|
+
* HH |  | The legend renders as a diamond with the focus on the top corner where values from both `field1` and `field2` are considered high. |
|
|
369
|
+
* HL |  | The legend renders as a diamond with the focus on the top corner where values from `field1` are high and values from `field2` are low. |
|
|
370
|
+
* LH |  | The legend renders as a diamond with the focus on the top corner where values from `field1` are low and values from `field2` are high. |
|
|
371
|
+
* LL |  | The legend renders as a diamond with the focus on the top corner where values from both `field1` and `field2` are considered low. |
|
|
372
372
|
*
|
|
373
373
|
* @default null
|
|
374
374
|
*/
|
|
@@ -289,10 +289,10 @@ export interface VisualVariablesParamsBaseColorOptions {
|
|
|
289
289
|
* Possible values are listed below.
|
|
290
290
|
* | Value | Description | Example |
|
|
291
291
|
* | ----- | ----------- | ------- |
|
|
292
|
-
* | high-to-low | High values are emphasized with strong colors. |  are visualized with weak colors while other values are emphasized with strong colors. |  are emphasized with strong colors while other values are visualized with weak colors. |  |
|
|
293
|
+
* | above-and-below | Values centered around a given point (e.g. the average) are visualized with weak colors while other values are emphasized with strong colors. |  |
|
|
294
|
+
* | centered-on | Values centered around a given point (e.g. the average) are emphasized with strong colors while other values are visualized with weak colors. |  |
|
|
295
|
+
* | extremes | High and low values are emphasized with strong colors. All others are visualized with weak colors. |  |
|
|
296
296
|
*
|
|
297
297
|
* @default high-to-low
|
|
298
298
|
*/
|
|
@@ -146,10 +146,10 @@ export interface GetSchemesParameters {
|
|
|
146
146
|
* Possible values are listed below.
|
|
147
147
|
* | Value | Description | Example |
|
|
148
148
|
* | ----- | ----------- | ------- |
|
|
149
|
-
* | high-to-low | High values are emphasized with strong colors. |  are visualized with weak colors while other values are emphasized with strong colors. |  are emphasized with strong colors while other values are visualized with weak colors. |  |
|
|
150
|
+
* | above-and-below | Values centered around a given point (e.g. the average) are visualized with weak colors while other values are emphasized with strong colors. |  |
|
|
151
|
+
* | centered-on | Values centered around a given point (e.g. the average) are emphasized with strong colors while other values are visualized with weak colors. |  |
|
|
152
|
+
* | extremes | High and low values are emphasized with strong colors. All others are visualized with weak colors. |  |
|
|
153
153
|
*/
|
|
154
154
|
theme?: "high-to-low" | "above-and-below" | "centered-on" | "extremes";
|
|
155
155
|
/**
|
|
@@ -96,8 +96,8 @@ export interface GetSchemesParameters {
|
|
|
96
96
|
* Possible values are listed below.
|
|
97
97
|
* | Value | Description | Example |
|
|
98
98
|
* | ----- | ----------- | ------- |
|
|
99
|
-
* | flow-line | Renders the uv and magnitude data as animated flow lines. This is ideal for representing wind and other atmospheric data. |  |
|
|
100
|
+
* | wave-front | Renders UV and magnitude data in a wave-like animation. This theme works well for ocean data. |  |
|
|
101
101
|
*
|
|
102
102
|
* > [!WARNING]
|
|
103
103
|
* >
|