biopipen 0.34.6__py3-none-any.whl → 0.34.26__py3-none-any.whl
This diff represents the content of publicly available package versions that have been released to one of the supported registries. The information contained in this diff is provided for informational purposes only and reflects changes between package versions as they appear in their respective public registries.
- biopipen/__init__.py +1 -1
- biopipen/core/config.toml +4 -0
- biopipen/core/filters.py +1 -1
- biopipen/core/testing.py +2 -1
- biopipen/ns/cellranger.py +33 -3
- biopipen/ns/regulatory.py +4 -0
- biopipen/ns/scrna.py +548 -98
- biopipen/ns/scrna_metabolic_landscape.py +4 -0
- biopipen/ns/tcr.py +256 -16
- biopipen/ns/web.py +5 -0
- biopipen/reports/scrna_metabolic_landscape/MetabolicFeatures.svelte +9 -9
- biopipen/reports/scrna_metabolic_landscape/MetabolicPathwayActivity.svelte +9 -8
- biopipen/reports/scrna_metabolic_landscape/MetabolicPathwayHeterogeneity.svelte +9 -9
- biopipen/reports/tcr/ClonalStats.svelte +1 -0
- biopipen/scripts/cellranger/CellRangerCount.py +55 -11
- biopipen/scripts/cellranger/CellRangerVdj.py +54 -8
- biopipen/scripts/regulatory/MotifAffinityTest.R +21 -5
- biopipen/scripts/regulatory/MotifAffinityTest_AtSNP.R +9 -2
- biopipen/scripts/regulatory/MotifAffinityTest_MotifBreakR.R +15 -6
- biopipen/scripts/regulatory/VariantMotifPlot.R +1 -1
- biopipen/scripts/regulatory/motifs-common.R +3 -2
- biopipen/scripts/scrna/AnnData2Seurat.R +2 -1
- biopipen/scripts/scrna/CellCellCommunication.py +26 -14
- biopipen/scripts/scrna/CellCellCommunicationPlots.R +23 -4
- biopipen/scripts/scrna/CellSNPLite.py +30 -0
- biopipen/scripts/scrna/CellTypeAnnotation-celltypist.R +27 -36
- biopipen/scripts/scrna/CellTypeAnnotation-direct.R +42 -26
- biopipen/scripts/scrna/CellTypeAnnotation-hitype.R +11 -13
- biopipen/scripts/scrna/CellTypeAnnotation-sccatch.R +5 -8
- biopipen/scripts/scrna/CellTypeAnnotation-sctype.R +5 -8
- biopipen/scripts/scrna/CellTypeAnnotation.R +26 -3
- biopipen/scripts/scrna/MQuad.py +25 -0
- biopipen/scripts/scrna/MarkersFinder.R +128 -30
- biopipen/scripts/scrna/ModuleScoreCalculator.R +9 -1
- biopipen/scripts/scrna/PseudoBulkDEG.R +113 -27
- biopipen/scripts/scrna/ScFGSEA.R +23 -26
- biopipen/scripts/scrna/ScVelo.py +20 -8
- biopipen/scripts/scrna/SeuratClusterStats-clustree.R +1 -1
- biopipen/scripts/scrna/SeuratClusterStats-features.R +6 -1
- biopipen/scripts/scrna/SeuratClustering.R +5 -1
- biopipen/scripts/scrna/SeuratMap2Ref.R +1 -2
- biopipen/scripts/scrna/SeuratPreparing.R +19 -11
- biopipen/scripts/scrna/SeuratSubClustering.R +1 -1
- biopipen/scripts/scrna/Slingshot.R +2 -4
- biopipen/scripts/scrna/TopExpressingGenes.R +1 -4
- biopipen/scripts/scrna/celltypist-wrapper.py +140 -4
- biopipen/scripts/scrna/scvelo_paga.py +313 -0
- biopipen/scripts/scrna/seurat_anndata_conversion.py +18 -1
- biopipen/scripts/tcr/{TCRClustering.R → CDR3Clustering.R} +63 -23
- biopipen/scripts/tcr/ClonalStats.R +76 -35
- biopipen/utils/misc.py +104 -9
- {biopipen-0.34.6.dist-info → biopipen-0.34.26.dist-info}/METADATA +5 -2
- {biopipen-0.34.6.dist-info → biopipen-0.34.26.dist-info}/RECORD +55 -53
- {biopipen-0.34.6.dist-info → biopipen-0.34.26.dist-info}/WHEEL +1 -1
- biopipen/utils/common_docstrs.py +0 -103
- {biopipen-0.34.6.dist-info → biopipen-0.34.26.dist-info}/entry_points.txt +0 -0
biopipen/ns/scrna.py
CHANGED
|
@@ -3,15 +3,6 @@
|
|
|
3
3
|
from pipen.utils import mark
|
|
4
4
|
from ..core.proc import Proc
|
|
5
5
|
from ..core.config import config
|
|
6
|
-
# from ..utils.common_docstrs import (
|
|
7
|
-
# indent_docstr,
|
|
8
|
-
# format_placeholder,
|
|
9
|
-
# MUTATE_HELPERS_CLONESIZE,
|
|
10
|
-
# ENVS_SECTION_EACH,
|
|
11
|
-
# )
|
|
12
|
-
|
|
13
|
-
# MUTATE_HELPERS_CLONESIZE_INDENTED = indent_docstr(MUTATE_HELPERS_CLONESIZE, " " * 3)
|
|
14
|
-
# ENVS_SECTION_EACH_INDENTED = indent_docstr(ENVS_SECTION_EACH, " " * 3)
|
|
15
6
|
|
|
16
7
|
|
|
17
8
|
class SeuratLoading(Proc):
|
|
@@ -96,6 +87,8 @@ class SeuratPreparing(Proc):
|
|
|
96
87
|
`RNAData` to assign the path of the data to the samples
|
|
97
88
|
The path will be read by `Read10X()` from `Seurat`, or the path
|
|
98
89
|
to the h5 file that can be read by `Read10X_h5()` from `Seurat`.
|
|
90
|
+
It can also be an RDS or qs2 file containing a `Seurat` object.
|
|
91
|
+
Note that it must has a column named `Sample` in the meta.data to specify the sample names.
|
|
99
92
|
|
|
100
93
|
Output:
|
|
101
94
|
outfile: The qs2 file with the Seurat object with all samples integrated.
|
|
@@ -111,13 +104,17 @@ class SeuratPreparing(Proc):
|
|
|
111
104
|
min_cells (type=int): The minimum number of cells that a gene must be
|
|
112
105
|
expressed in to be kept. This is used in `Seurat::CreateSeuratObject()`.
|
|
113
106
|
Futher QC (`envs.cell_qc`, `envs.gene_qc`) will be performed after this.
|
|
114
|
-
It doesn't work when data is loaded from loom files.
|
|
107
|
+
It doesn't work when data is loaded from loom files or RDS/qs2 files.
|
|
115
108
|
min_features (type=int): The minimum number of features that a cell must
|
|
116
109
|
express to be kept. This is used in `Seurat::CreateSeuratObject()`.
|
|
117
110
|
Futher QC (`envs.cell_qc`, `envs.gene_qc`) will be performed after this.
|
|
118
|
-
It doesn't work when data is loaded from loom files.
|
|
111
|
+
It doesn't work when data is loaded from loom files or RDS/qs2 files.
|
|
119
112
|
cell_qc: Filter expression to filter cells, using
|
|
120
113
|
`tidyrseurat::filter()`.
|
|
114
|
+
It can also be a dictionary of expressions, where the names of the list are
|
|
115
|
+
sample names.
|
|
116
|
+
You can have a default expression in the list with the name "DEFAULT" for
|
|
117
|
+
the samples that are not listed.
|
|
121
118
|
Available QC keys include `nFeature_RNA`, `nCount_RNA`,
|
|
122
119
|
`percent.mt`, `percent.ribo`, `percent.hb`, and `percent.plat`.
|
|
123
120
|
|
|
@@ -128,6 +125,7 @@ class SeuratPreparing(Proc):
|
|
|
128
125
|
|
|
129
126
|
```toml
|
|
130
127
|
[SeuratPreparing.envs]
|
|
128
|
+
|
|
131
129
|
cell_qc = "nFeature_RNA > 200 & percent.mt < 5"
|
|
132
130
|
```
|
|
133
131
|
will keep cells with more than 200 genes and less than 5%% mitochondrial
|
|
@@ -144,6 +142,7 @@ class SeuratPreparing(Proc):
|
|
|
144
142
|
/// Tip | Example
|
|
145
143
|
```toml
|
|
146
144
|
[SeuratPreparing.envs]
|
|
145
|
+
|
|
147
146
|
gene_qc = { min_cells = 3 }
|
|
148
147
|
```
|
|
149
148
|
will keep genes that are expressed in at least 3 cells.
|
|
@@ -331,13 +330,16 @@ class SeuratClustering(Proc):
|
|
|
331
330
|
srtobj: The seurat object loaded by SeuratPreparing
|
|
332
331
|
|
|
333
332
|
Output:
|
|
334
|
-
outfile: The seurat object with cluster information at `seurat_clusters
|
|
333
|
+
outfile: The seurat object with cluster information at `seurat_clusters` or
|
|
334
|
+
the name specified by `envs.ident`
|
|
335
335
|
|
|
336
336
|
Envs:
|
|
337
337
|
ncores (type=int;order=-100): Number of cores to use.
|
|
338
338
|
Used in `future::plan(strategy = "multicore", workers = <ncores>)`
|
|
339
339
|
to parallelize some Seurat procedures.
|
|
340
340
|
See also: <https://satijalab.org/seurat/articles/future_vignette.html>
|
|
341
|
+
ident: The name in the metadata to save the cluster labels.
|
|
342
|
+
A shortcut for `envs["FindClusters"]["cluster.name"]`.
|
|
341
343
|
RunUMAP (ns): Arguments for [`RunUMAP()`](https://satijalab.org/seurat/reference/runumap).
|
|
342
344
|
`object` is specified internally, and `-` in the key will be replaced with `.`.
|
|
343
345
|
`dims=N` will be expanded to `dims=1:N`; The maximal value of `N` will be the minimum of `N` and the number of columns - 1 for each sample.
|
|
@@ -353,12 +355,12 @@ class SeuratClustering(Proc):
|
|
|
353
355
|
- <more>: See <https://satijalab.org/seurat/reference/findneighbors>
|
|
354
356
|
FindClusters (ns): Arguments for [`FindClusters()`](https://satijalab.org/seurat/reference/findclusters).
|
|
355
357
|
`object` is specified internally, and `-` in the key will be replaced with `.`.
|
|
356
|
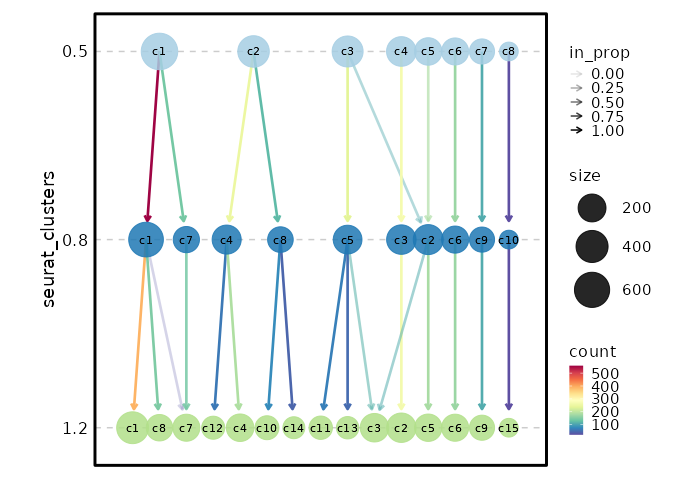
-
The cluster labels will be saved in
|
|
358
|
+
The cluster labels will be saved in cluster names and prefixed with "c".
|
|
357
359
|
The first cluster will be "c1", instead of "c0".
|
|
358
360
|
- resolution (type=auto): The resolution of the clustering. You can have multiple resolutions as a list or as a string separated by comma.
|
|
359
361
|
Ranges are also supported, for example: `0.1:0.5:0.1` will generate `0.1, 0.2, 0.3, 0.4, 0.5`. The step can be omitted, defaulting to 0.1.
|
|
360
|
-
The results will be saved in
|
|
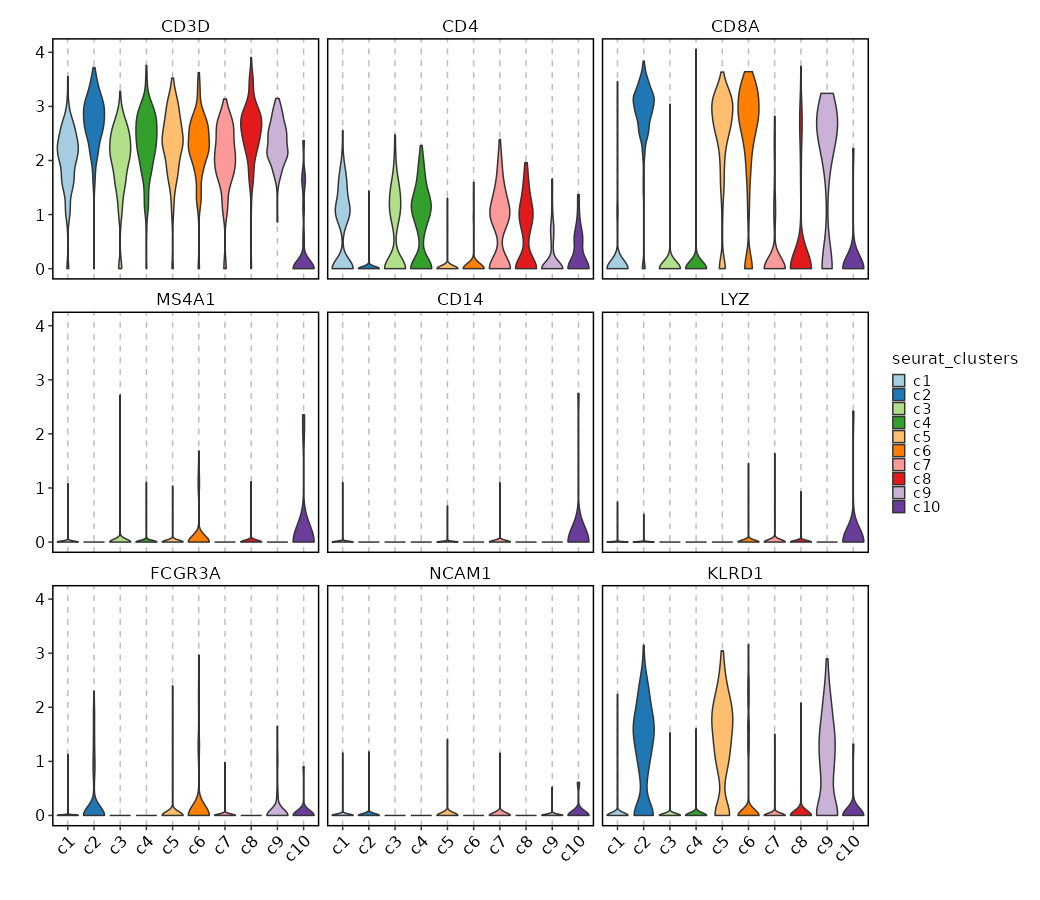
361
|
-
The final resolution will be used to define the clusters at
|
|
362
|
+
The results will be saved in `<ident>_<resolution>`.
|
|
363
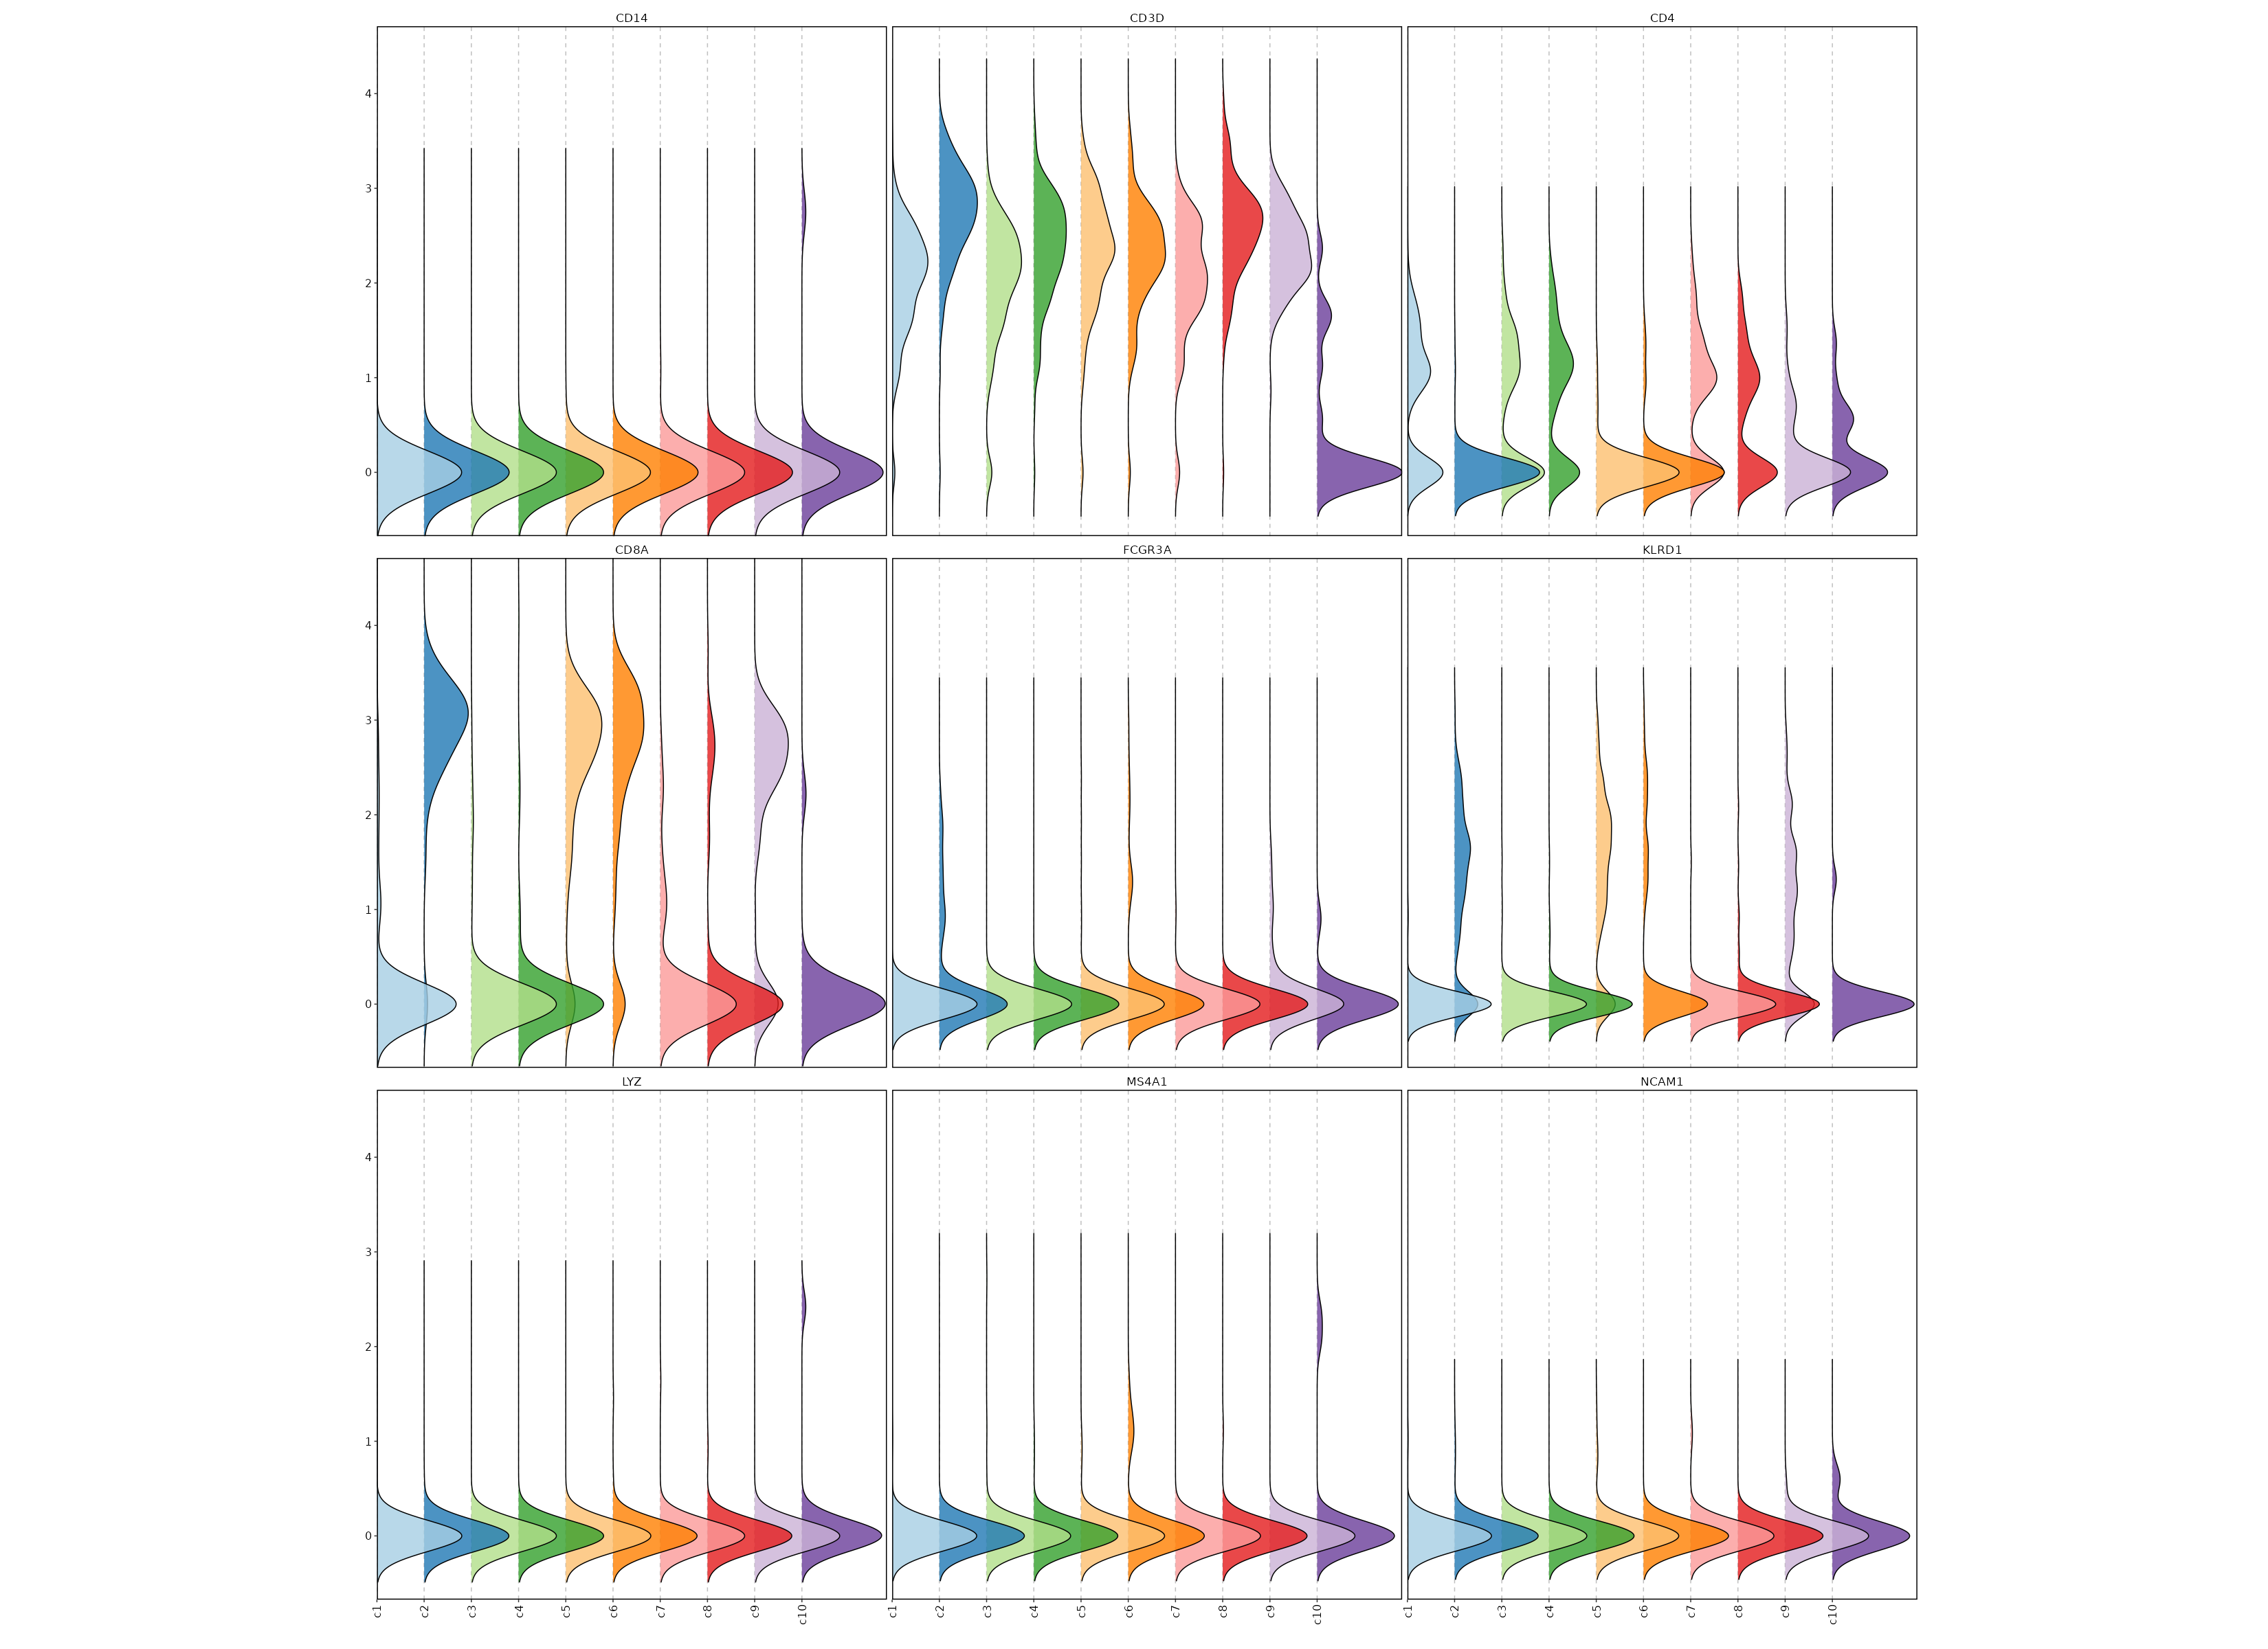
|
+
The final resolution will be used to define the clusters at `<ident>`.
|
|
362
364
|
- <more>: See <https://satijalab.org/seurat/reference/findclusters>
|
|
363
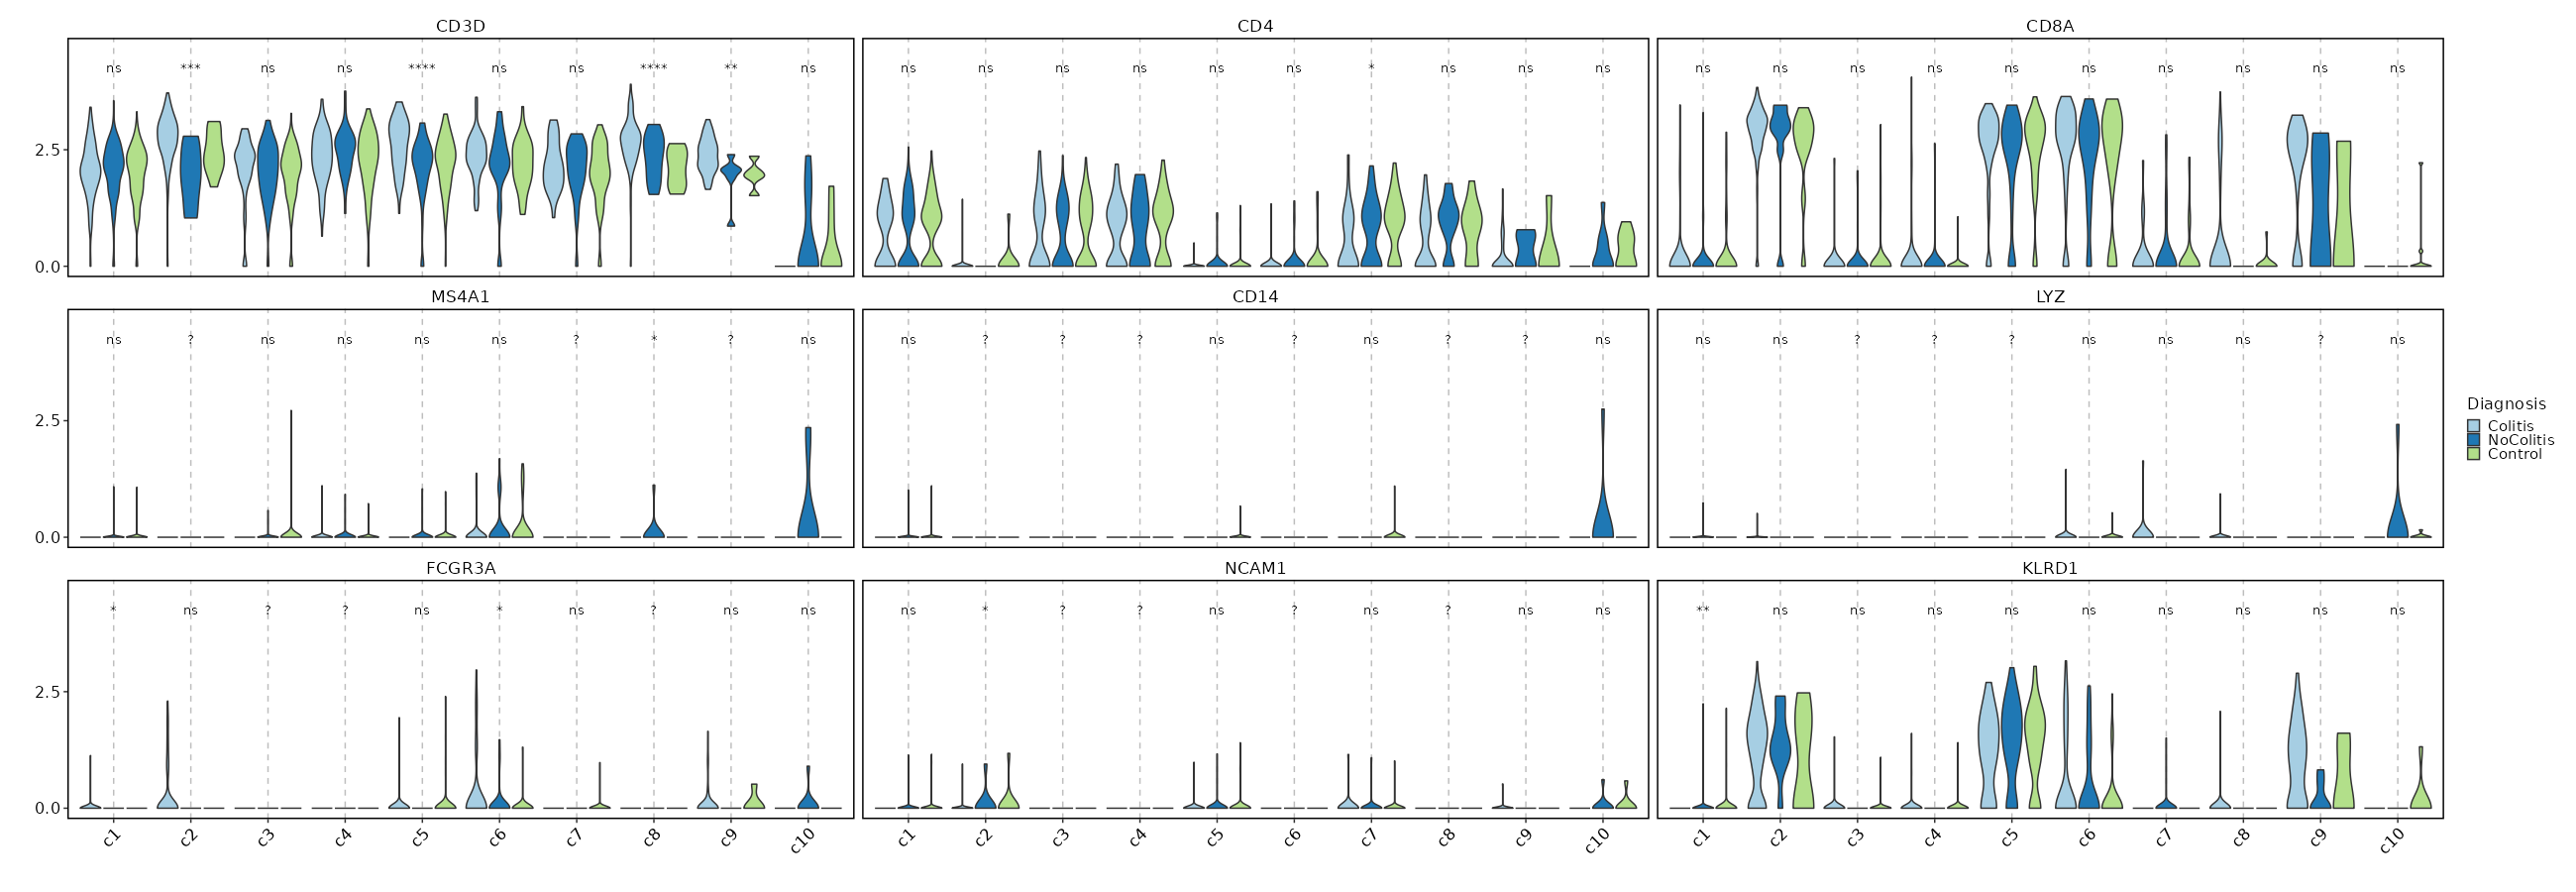
365
|
cache (type=auto): Where to cache the information at different steps.
|
|
364
366
|
If `True`, the seurat object will be cached in the job output directory, which will be not cleaned up when job is rerunning.
|
|
@@ -378,6 +380,7 @@ class SeuratClustering(Proc):
|
|
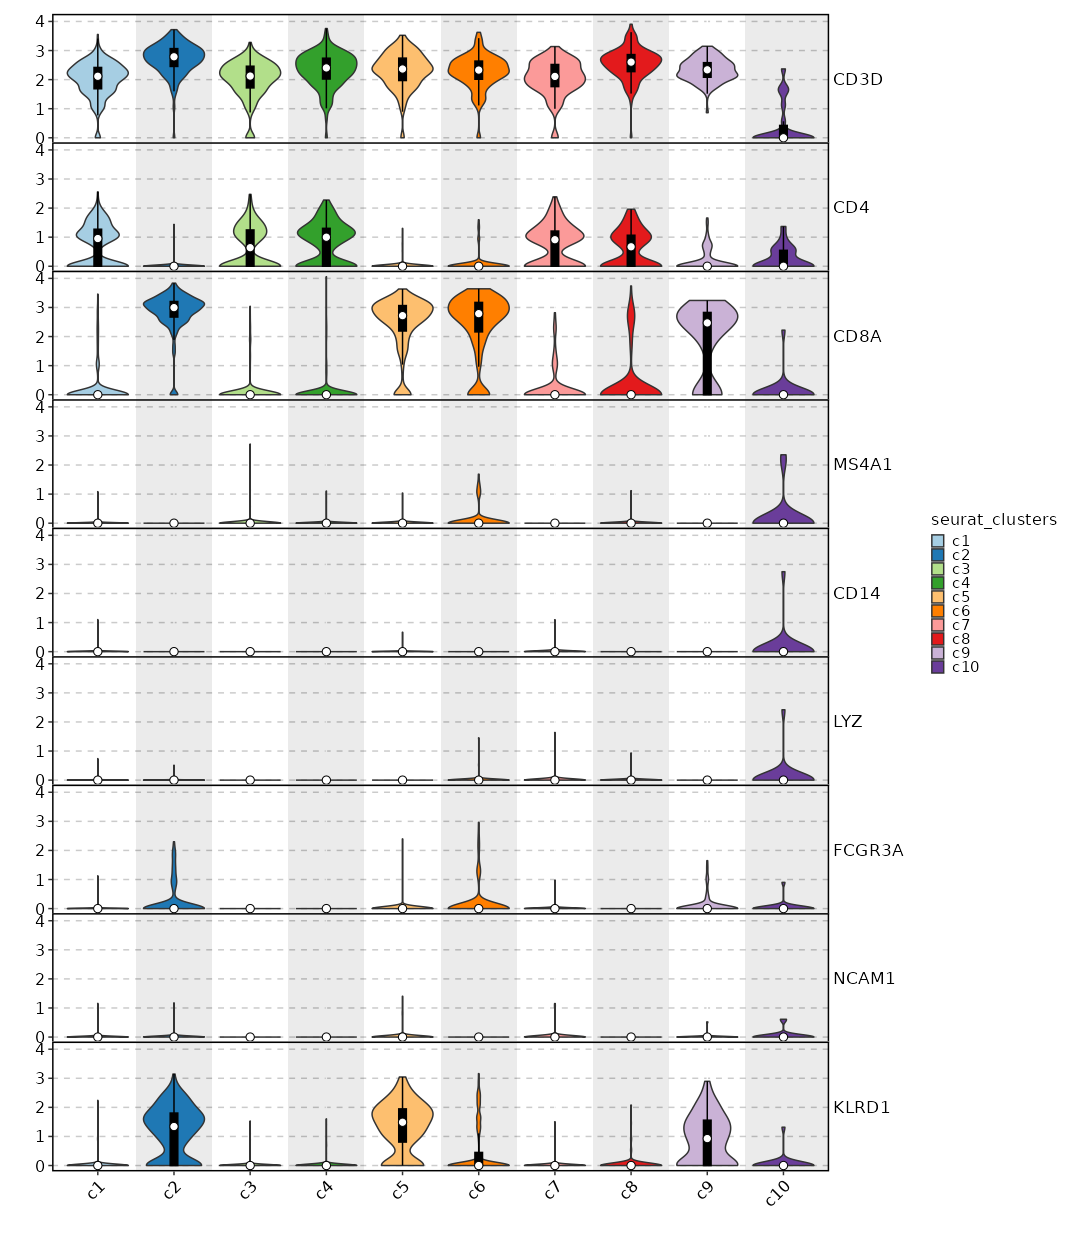
|
378
380
|
lang = config.lang.rscript
|
|
379
381
|
envs = {
|
|
380
382
|
"ncores": config.misc.ncores,
|
|
383
|
+
"ident": "seurat_clusters",
|
|
381
384
|
"RunPCA": {},
|
|
382
385
|
"RunUMAP": {},
|
|
383
386
|
"FindNeighbors": {},
|
|
@@ -476,48 +479,248 @@ class SeuratClusterStats(Proc):
|
|
|
476
479
|
TCR clones/clusters or other metadata for each T-cell cluster.
|
|
477
480
|
|
|
478
481
|
Examples:
|
|
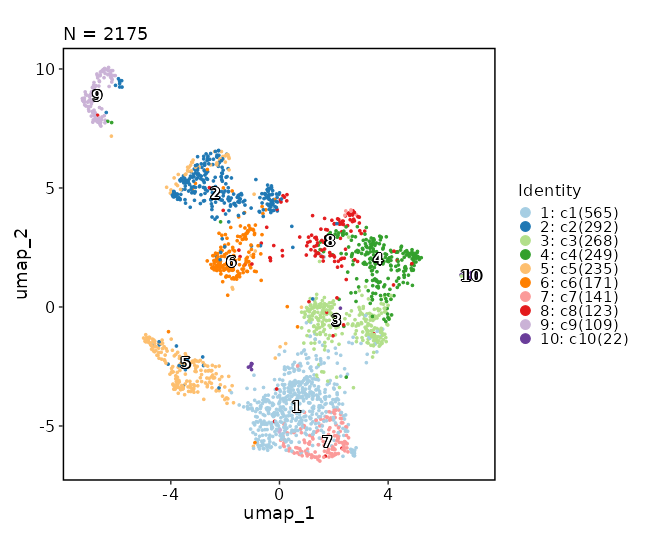
479
|
-
###
|
|
482
|
+
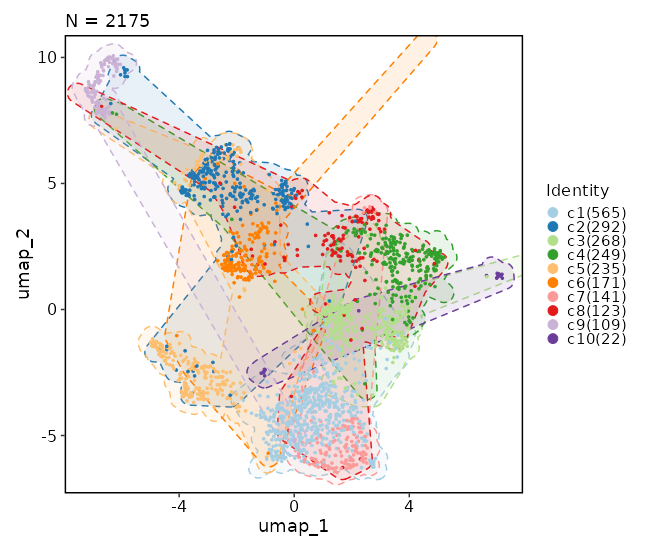
### Clustree Plot
|
|
483
|
+
|
|
484
|
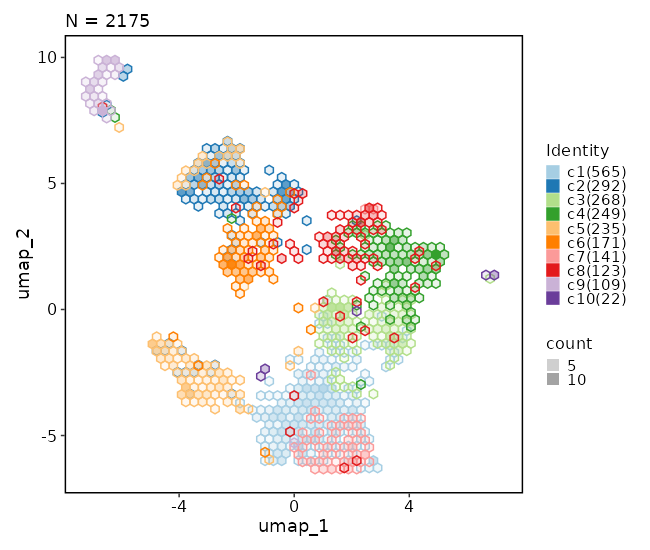
+
```toml
|
|
485
|
+
[SeuratClusterStats.envs.clustrees."Clustree Plot"]
|
|
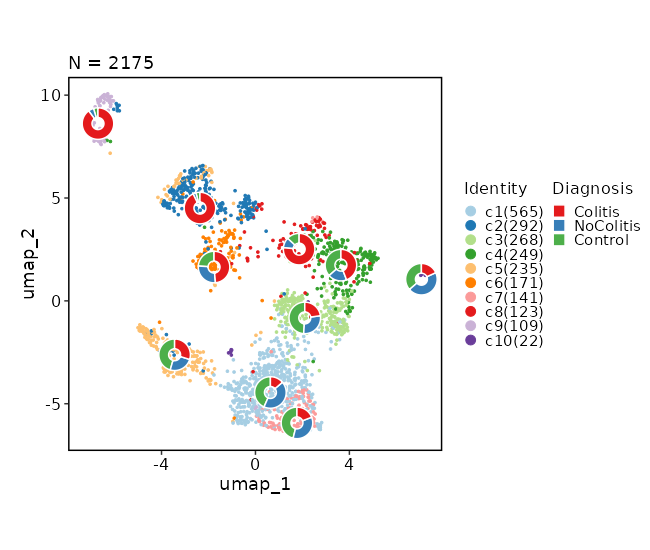
486
|
+
prefix = "seurat_clusters"
|
|
487
|
+
devpars = {height = 500}
|
|
488
|
+
```
|
|
489
|
+
|
|
490
|
+
{: width="80%" }
|
|
491
|
+
|
|
492
|
+
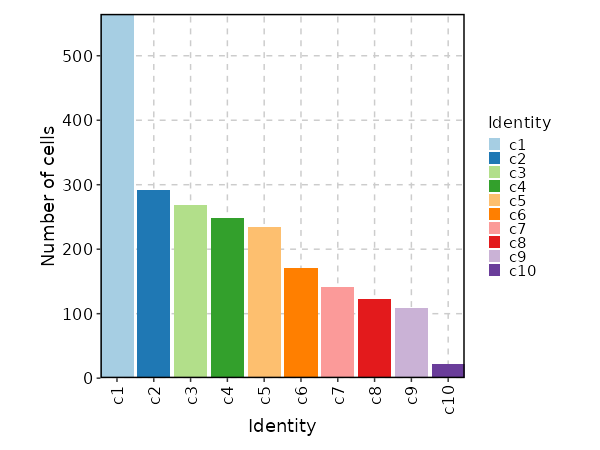
### Number of cells in each cluster (Bar Chart)
|
|
493
|
+
|
|
494
|
+
```toml
|
|
495
|
+
[SeuratClusterStats.envs.stats."Number of cells in each cluster (Bar Chart)"]
|
|
496
|
+
plot_type = "bar"
|
|
497
|
+
x_text_angle = 90
|
|
498
|
+
```
|
|
499
|
+
|
|
500
|
+
{: width="80%" }
|
|
501
|
+
|
|
502
|
+
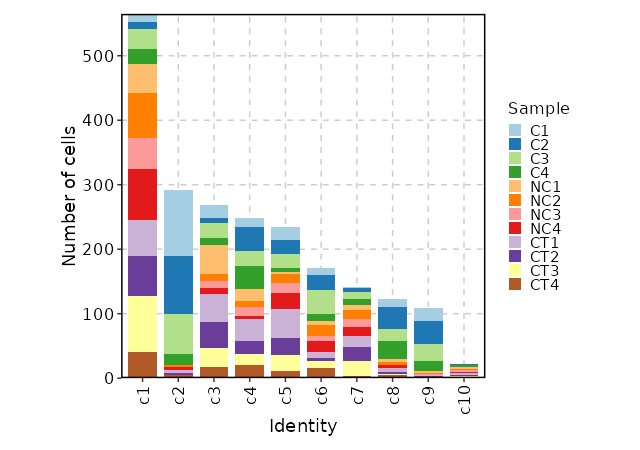
### Number of cells in each cluster by Sample (Bar Chart)
|
|
503
|
+
|
|
504
|
+
```toml
|
|
505
|
+
[SeuratClusterStats.envs.stats."Number of cells in each cluster by Sample (Bar Chart)"]
|
|
506
|
+
plot_type = "bar"
|
|
507
|
+
group_by = "Sample"
|
|
508
|
+
x_text_angle = 90
|
|
509
|
+
```
|
|
510
|
+
|
|
511
|
+
{: width="80%" }
|
|
512
|
+
|
|
513
|
+
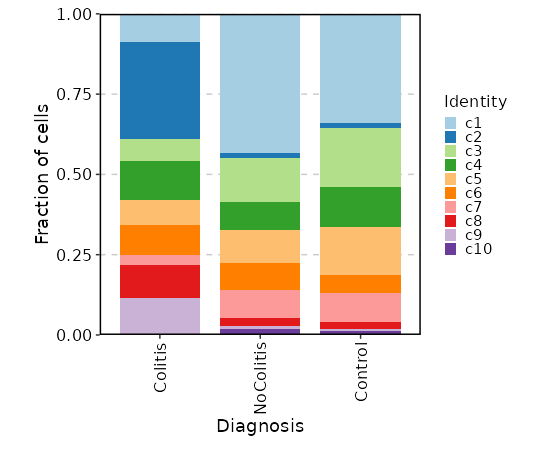
### Number of cells in each cluster by Diagnosis
|
|
514
|
+
|
|
515
|
+
```toml
|
|
516
|
+
[SeuratClusterStats.envs.stats."Number of cells in each cluster by Diagnosis"]
|
|
517
|
+
plot_type = "bar"
|
|
518
|
+
group_by = "Diagnosis"
|
|
519
|
+
frac = "group"
|
|
520
|
+
x_text_angle = 90
|
|
521
|
+
swap = true
|
|
522
|
+
position = "stack"
|
|
523
|
+
```
|
|
524
|
+
|
|
525
|
+
{: width="80%" }
|
|
526
|
+
|
|
527
|
+
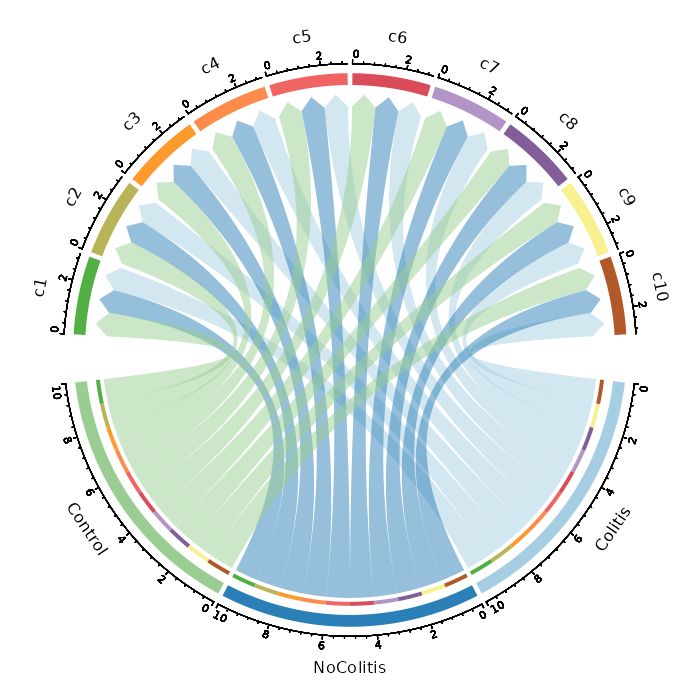
### Number of cells in each cluster by Diagnosis (Circos Plot)
|
|
528
|
+
|
|
529
|
+
```toml
|
|
530
|
+
[SeuratClusterStats.envs.stats."Number of cells in each cluster by Diagnosis (Circos Plot)"]
|
|
531
|
+
plot_type = "circos"
|
|
532
|
+
group_by = "Diagnosis"
|
|
533
|
+
```
|
|
534
|
+
|
|
535
|
+
{: width="80%" }
|
|
536
|
+
|
|
537
|
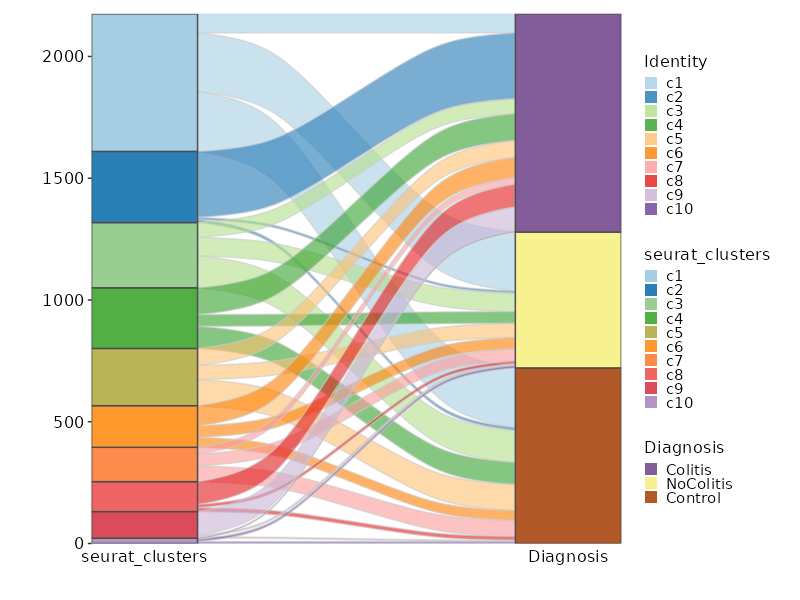
+
### Number of cells in each cluster by Diagnosis (Sankey Plot)
|
|
538
|
+
|
|
539
|
+
```toml
|
|
540
|
+
[SeuratClusterStats.envs.stats."Number of cells in each cluster by Diagnosis (Sankey Plot)"]
|
|
541
|
+
plot_type = "sankey"
|
|
542
|
+
group_by = ["seurat_clusters", "Diagnosis"]
|
|
543
|
+
links_alpha = 0.6
|
|
544
|
+
devpars = {width = 800}
|
|
545
|
+
```
|
|
546
|
+
|
|
547
|
+
{: width="80%" }
|
|
548
|
+
|
|
549
|
+
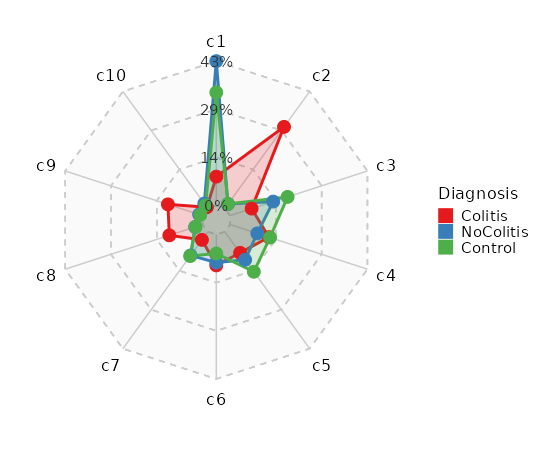
### Number of cells in each cluster by Sample (Spider Plot)
|
|
550
|
+
|
|
551
|
+
```toml
|
|
552
|
+
[SeuratClusterStats.envs.stats."Number of cells in each cluster by Sample (Spider Plot)"]
|
|
553
|
+
plot_type = "spider"
|
|
554
|
+
group_by = "Diagnosis"
|
|
555
|
+
palette = "Set1"
|
|
556
|
+
```
|
|
557
|
+
|
|
558
|
+
{: width="80%" }
|
|
559
|
+
|
|
560
|
+
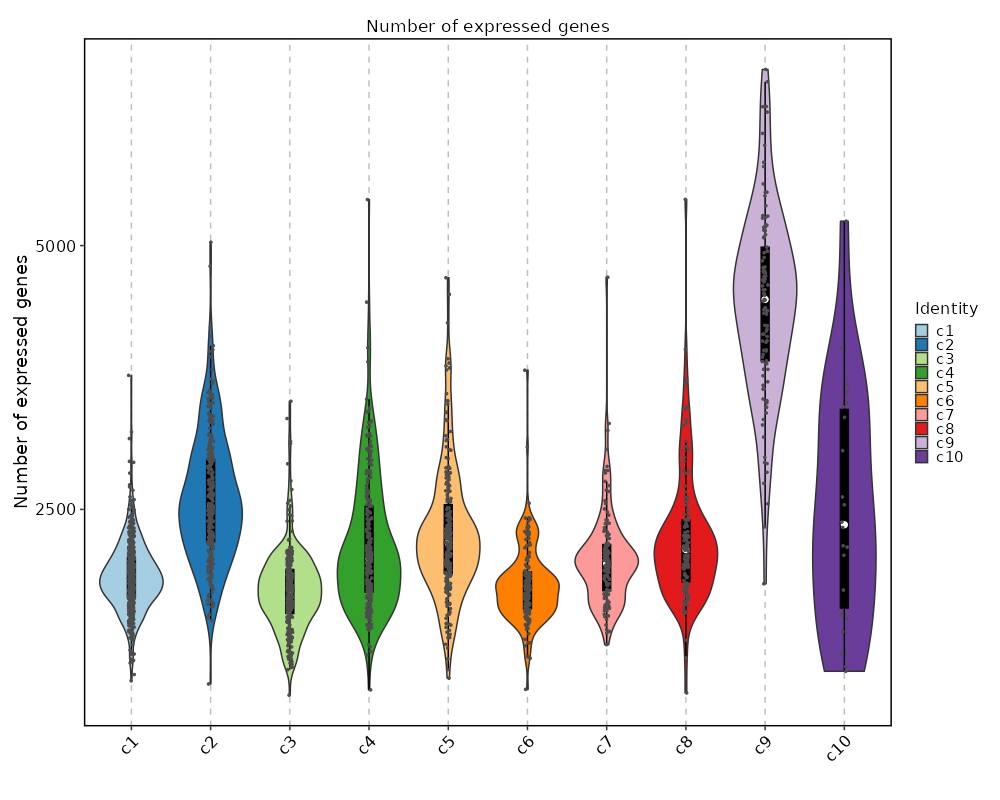
### Number of genes detected in each cluster
|
|
561
|
+
|
|
562
|
+
```toml
|
|
563
|
+
[SeuratClusterStats.envs.ngenes."Number of genes detected in each cluster"]
|
|
564
|
+
plot_type = "violin"
|
|
565
|
+
add_box = true
|
|
566
|
+
add_point = true
|
|
567
|
+
```
|
|
568
|
+
|
|
569
|
+
{: width="80%" }
|
|
570
|
+
|
|
571
|
+
### Feature Expression in Clusters (Violin Plots)
|
|
572
|
+
|
|
573
|
+
```toml
|
|
574
|
+
[SeuratClusterStats.envs.features_defaults]
|
|
575
|
+
features = ["CD3D", "CD4", "CD8A", "MS4A1", "CD14", "LYZ", "FCGR3A", "NCAM1", "KLRD1"]
|
|
576
|
+
|
|
577
|
+
[SeuratClusterStats.envs.features."Feature Expression in Clusters (Violin Plots)"]
|
|
578
|
+
plot_type = "violin"
|
|
579
|
+
ident = "seurat_clusters"
|
|
580
|
+
```
|
|
581
|
+
|
|
582
|
+
{: width="80%" }
|
|
583
|
+
|
|
584
|
+
### Feature Expression in Clusters (Ridge Plots)
|
|
585
|
+
|
|
586
|
+
```toml
|
|
587
|
+
# Using the same features as above
|
|
588
|
+
[SeuratClusterStats.envs.features."Feature Expression in Clusters (Ridge Plots)"]
|
|
589
|
+
plot_type = "ridge"
|
|
590
|
+
ident = "seurat_clusters"
|
|
591
|
+
flip = true
|
|
592
|
+
```
|
|
593
|
+
|
|
594
|
+
{: width="80%" }
|
|
595
|
+
|
|
596
|
+
### Feature Expression in Clusters by Diagnosis
|
|
480
597
|
|
|
481
598
|
```toml
|
|
482
|
-
|
|
483
|
-
|
|
484
|
-
|
|
485
|
-
|
|
599
|
+
# Using the same features as above
|
|
600
|
+
[SeuratClusterStats.envs.features."Feature Expression in Clusters by Diagnosis"]
|
|
601
|
+
plot_type = "violin"
|
|
602
|
+
group_by = "Diagnosis"
|
|
603
|
+
ident = "seurat_clusters"
|
|
604
|
+
comparisons = true
|
|
605
|
+
sig_label = "p.signif"
|
|
486
606
|
```
|
|
487
607
|
|
|
488
|
-
{: width="80%" }
|
|
489
609
|
|
|
490
|
-
###
|
|
610
|
+
### Feature Expression in Clusters (stacked)
|
|
491
611
|
|
|
492
612
|
```toml
|
|
493
|
-
|
|
494
|
-
|
|
613
|
+
# Using the same features as above
|
|
614
|
+
[SeuratClusterStats.envs.features."Feature Expression in Clusters (stacked)"]
|
|
615
|
+
plot_type = "violin"
|
|
616
|
+
ident = "seurat_clusters"
|
|
617
|
+
add_bg = true
|
|
618
|
+
stack = true
|
|
619
|
+
add_box = true
|
|
495
620
|
```
|
|
496
621
|
|
|
497
|
-
{: width="80%" }
|
|
498
623
|
|
|
499
|
-
###
|
|
624
|
+
### CD4 Expression on UMAP
|
|
500
625
|
|
|
501
626
|
```toml
|
|
502
|
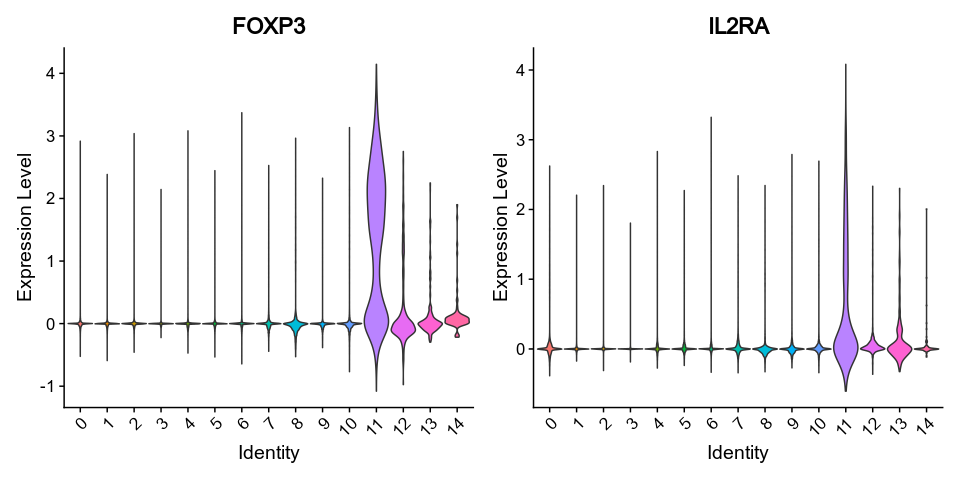
-
[SeuratClusterStats.envs.features]
|
|
503
|
-
|
|
504
|
-
|
|
505
|
-
|
|
506
|
-
# Don't use the default genes
|
|
507
|
-
vlnplots_1 = { features = ["FOXP3", "IL2RA"], pt-size = 0, kind = "vln" }
|
|
627
|
+
[SeuratClusterStats.envs.features."CD4 Expression on UMAP"]
|
|
628
|
+
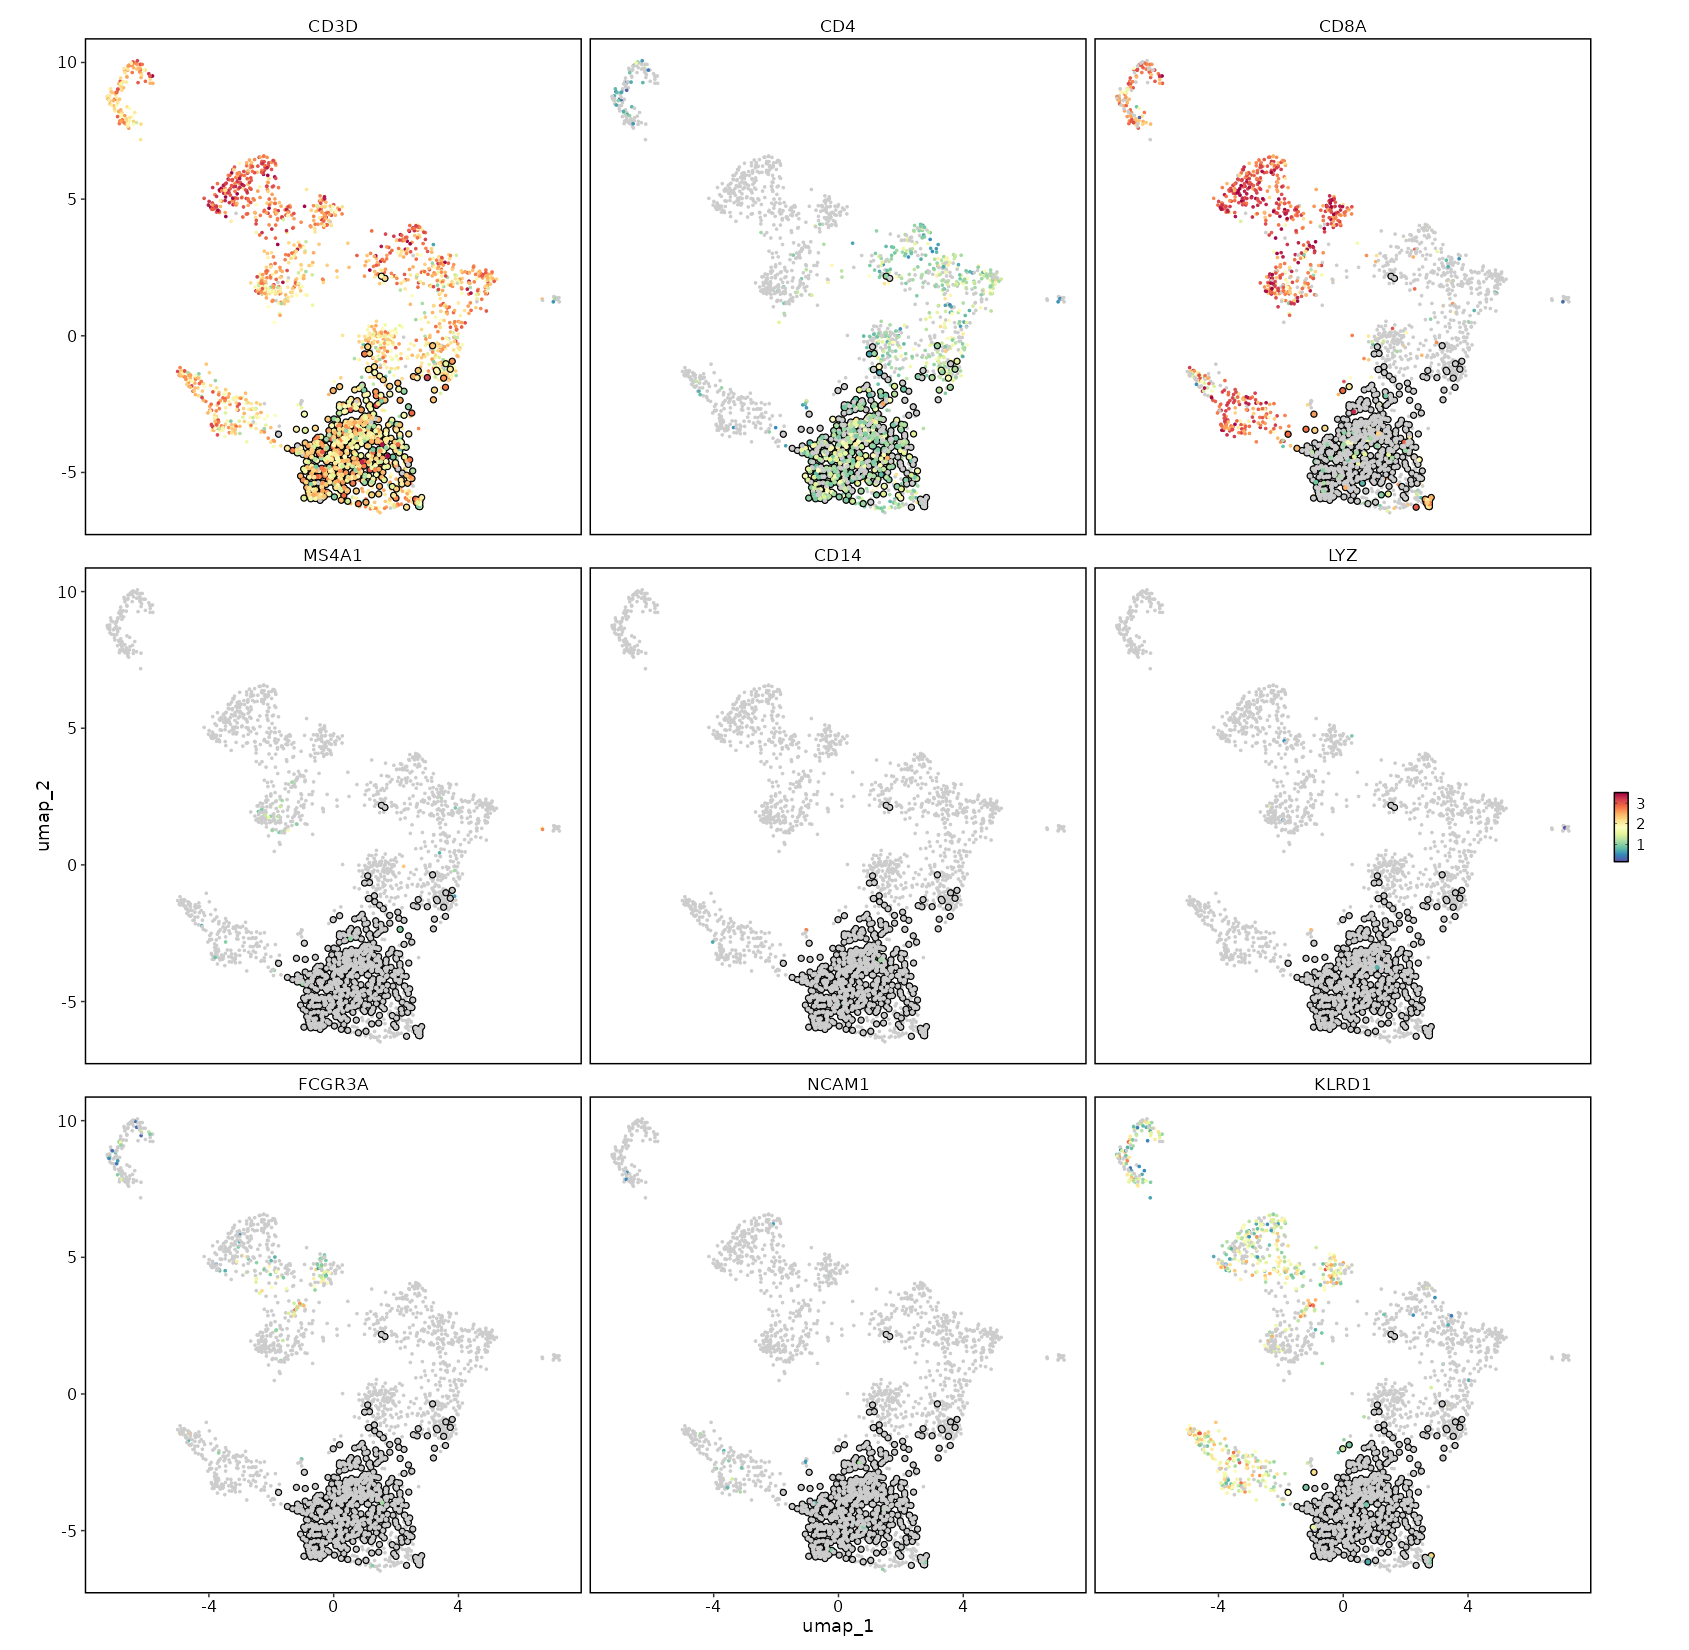
plot_type = "dim"
|
|
629
|
+
feature = "CD4"
|
|
630
|
+
highlight = "seurat_clusters == 'c1'"
|
|
508
631
|
```
|
|
509
632
|
|
|
510
|
-
{: width="80%" }
|
|
633
|
+
{: width="80%" }
|
|
512
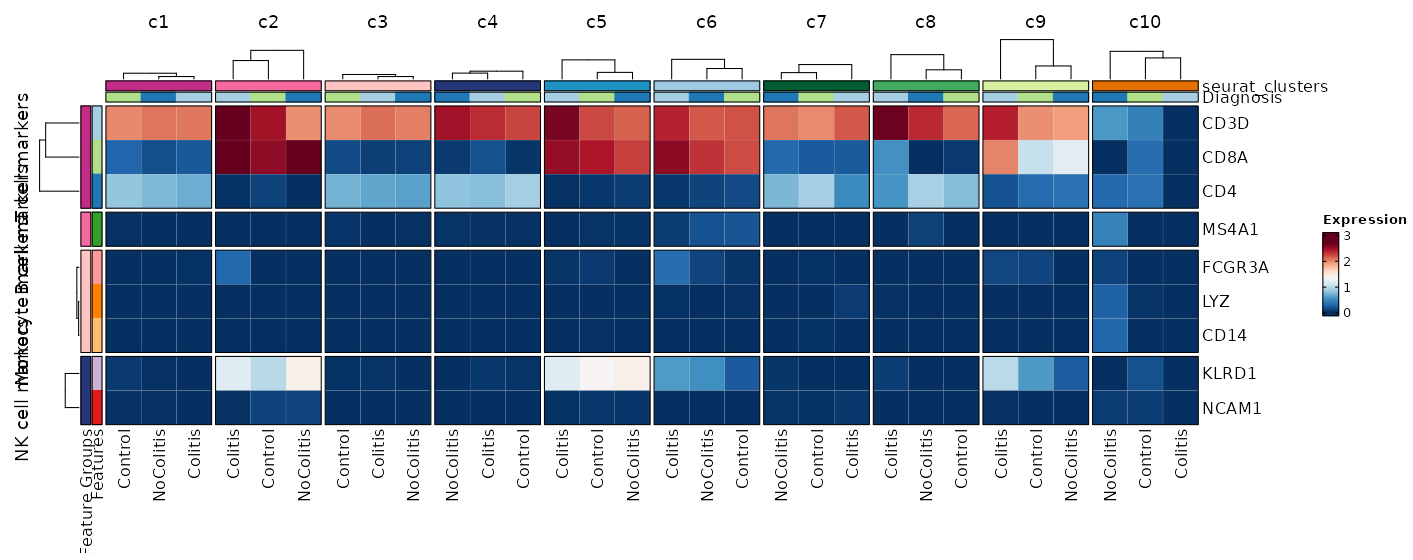
634
|
|
|
513
|
-
###
|
|
635
|
+
### Feature Expression in Clusters by Diagnosis (Heatmap)
|
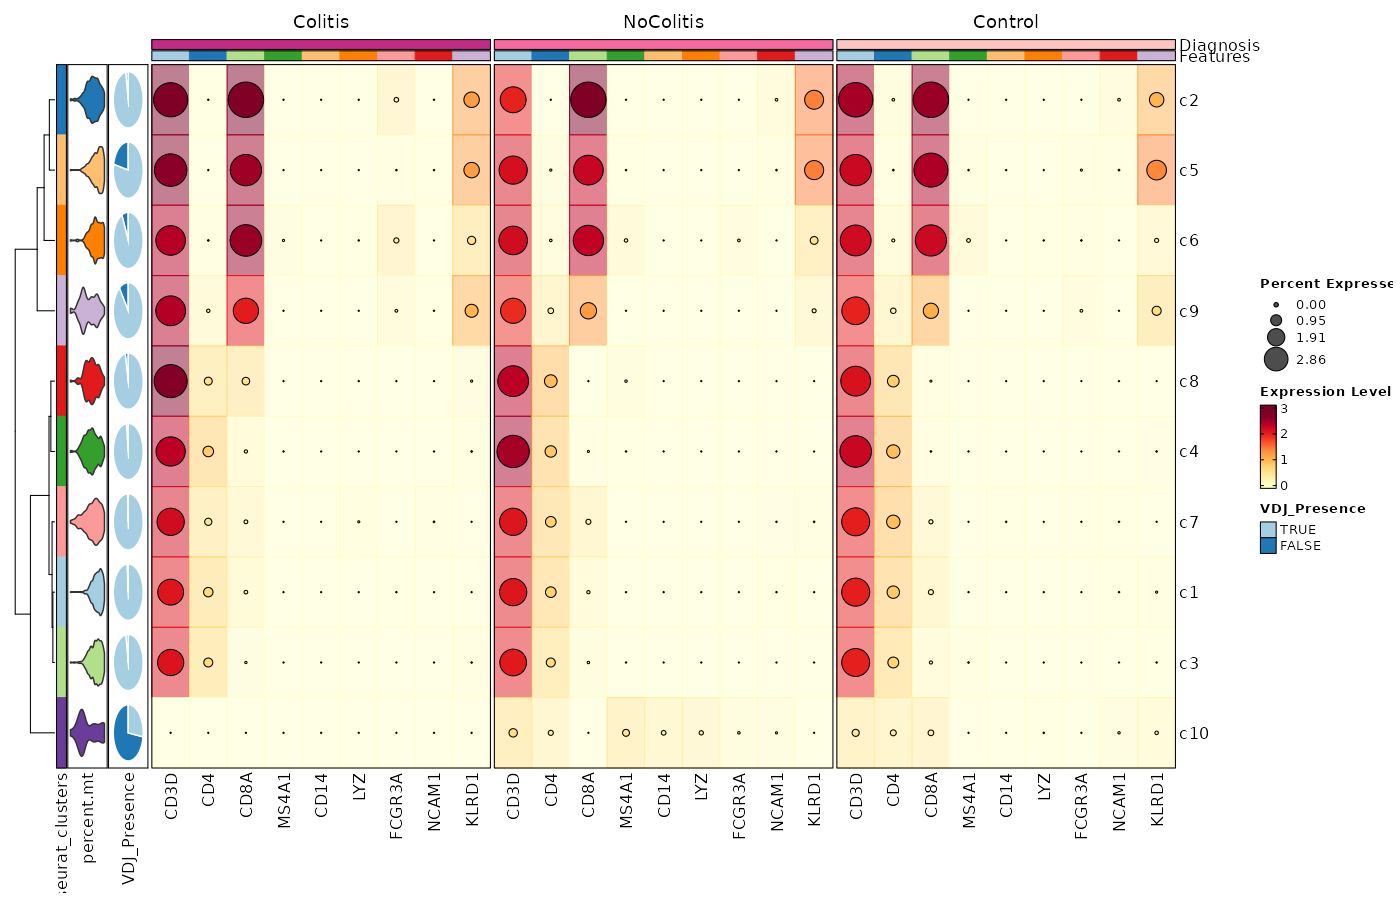
|
514
636
|
|
|
515
637
|
```toml
|
|
516
|
-
[SeuratClusterStats.envs.
|
|
638
|
+
[SeuratClusterStats.envs.features."Feature Expression in Clusters by Diagnosis (Heatmap)"]
|
|
639
|
+
# Grouped features
|
|
640
|
+
features = {"T cell markers" = ["CD3D", "CD4", "CD8A"], "B cell markers" = ["MS4A1"], "Monocyte markers" = ["CD14", "LYZ", "FCGR3A"], "NK cell markers" = ["NCAM1", "KLRD1"]}
|
|
641
|
+
plot_type = "heatmap"
|
|
642
|
+
ident = "Diagnosis"
|
|
643
|
+
columns_split_by = "seurat_clusters"
|
|
644
|
+
name = "Expression"
|
|
645
|
+
devpars = {height = 560}
|
|
646
|
+
```
|
|
647
|
+
|
|
648
|
+
{: width="80%" }
|
|
649
|
+
|
|
650
|
+
### Feature Expression in Clusters by Diagnosis (Heatmap with annotations)
|
|
651
|
+
|
|
652
|
+
```toml
|
|
653
|
+
# Using the default features
|
|
654
|
+
[SeuratClusterStats.envs.features."Feature Expression in Clusters by Diagnosis (Heatmap with annotations)"]
|
|
655
|
+
ident = "seurat_clusters"
|
|
656
|
+
cell_type = "dot"
|
|
657
|
+
plot_type = "heatmap"
|
|
658
|
+
name = "Expression Level"
|
|
659
|
+
dot_size = "nanmean"
|
|
660
|
+
dot_size_name = "Percent Expressed"
|
|
661
|
+
add_bg = true
|
|
662
|
+
rows_split_by = "Diagnosis"
|
|
663
|
+
cluster_rows = false
|
|
664
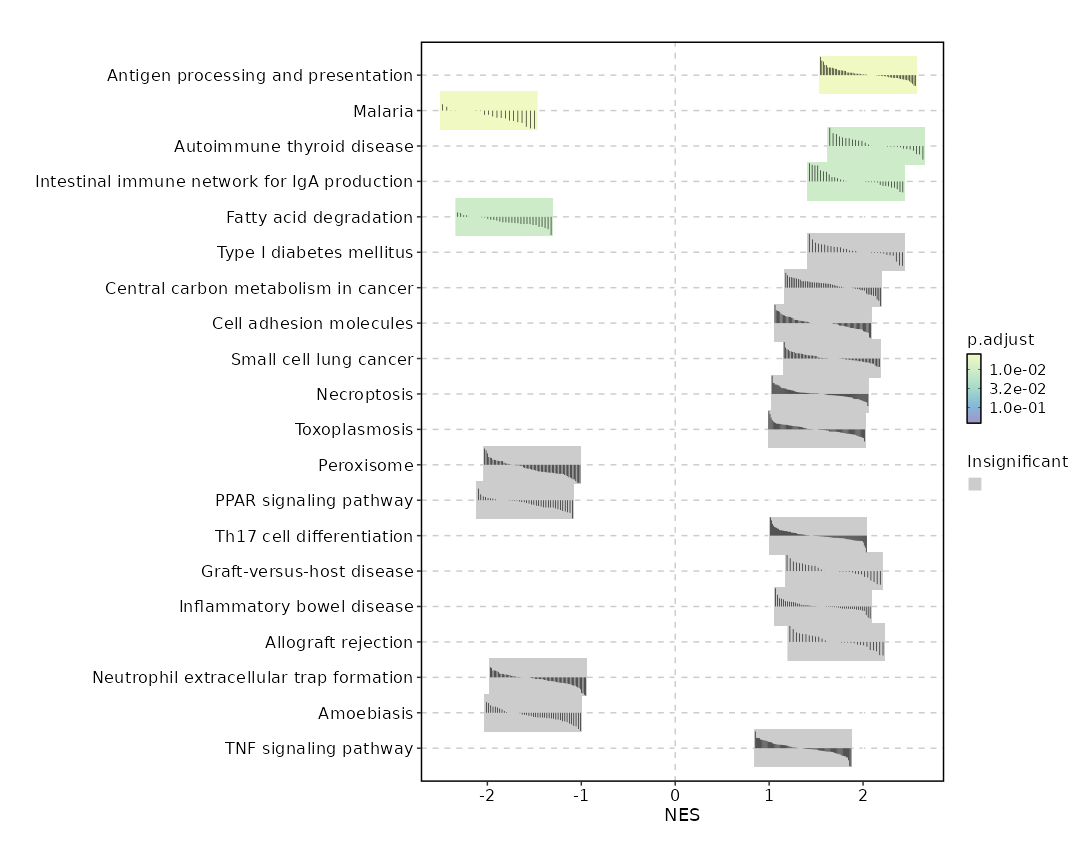
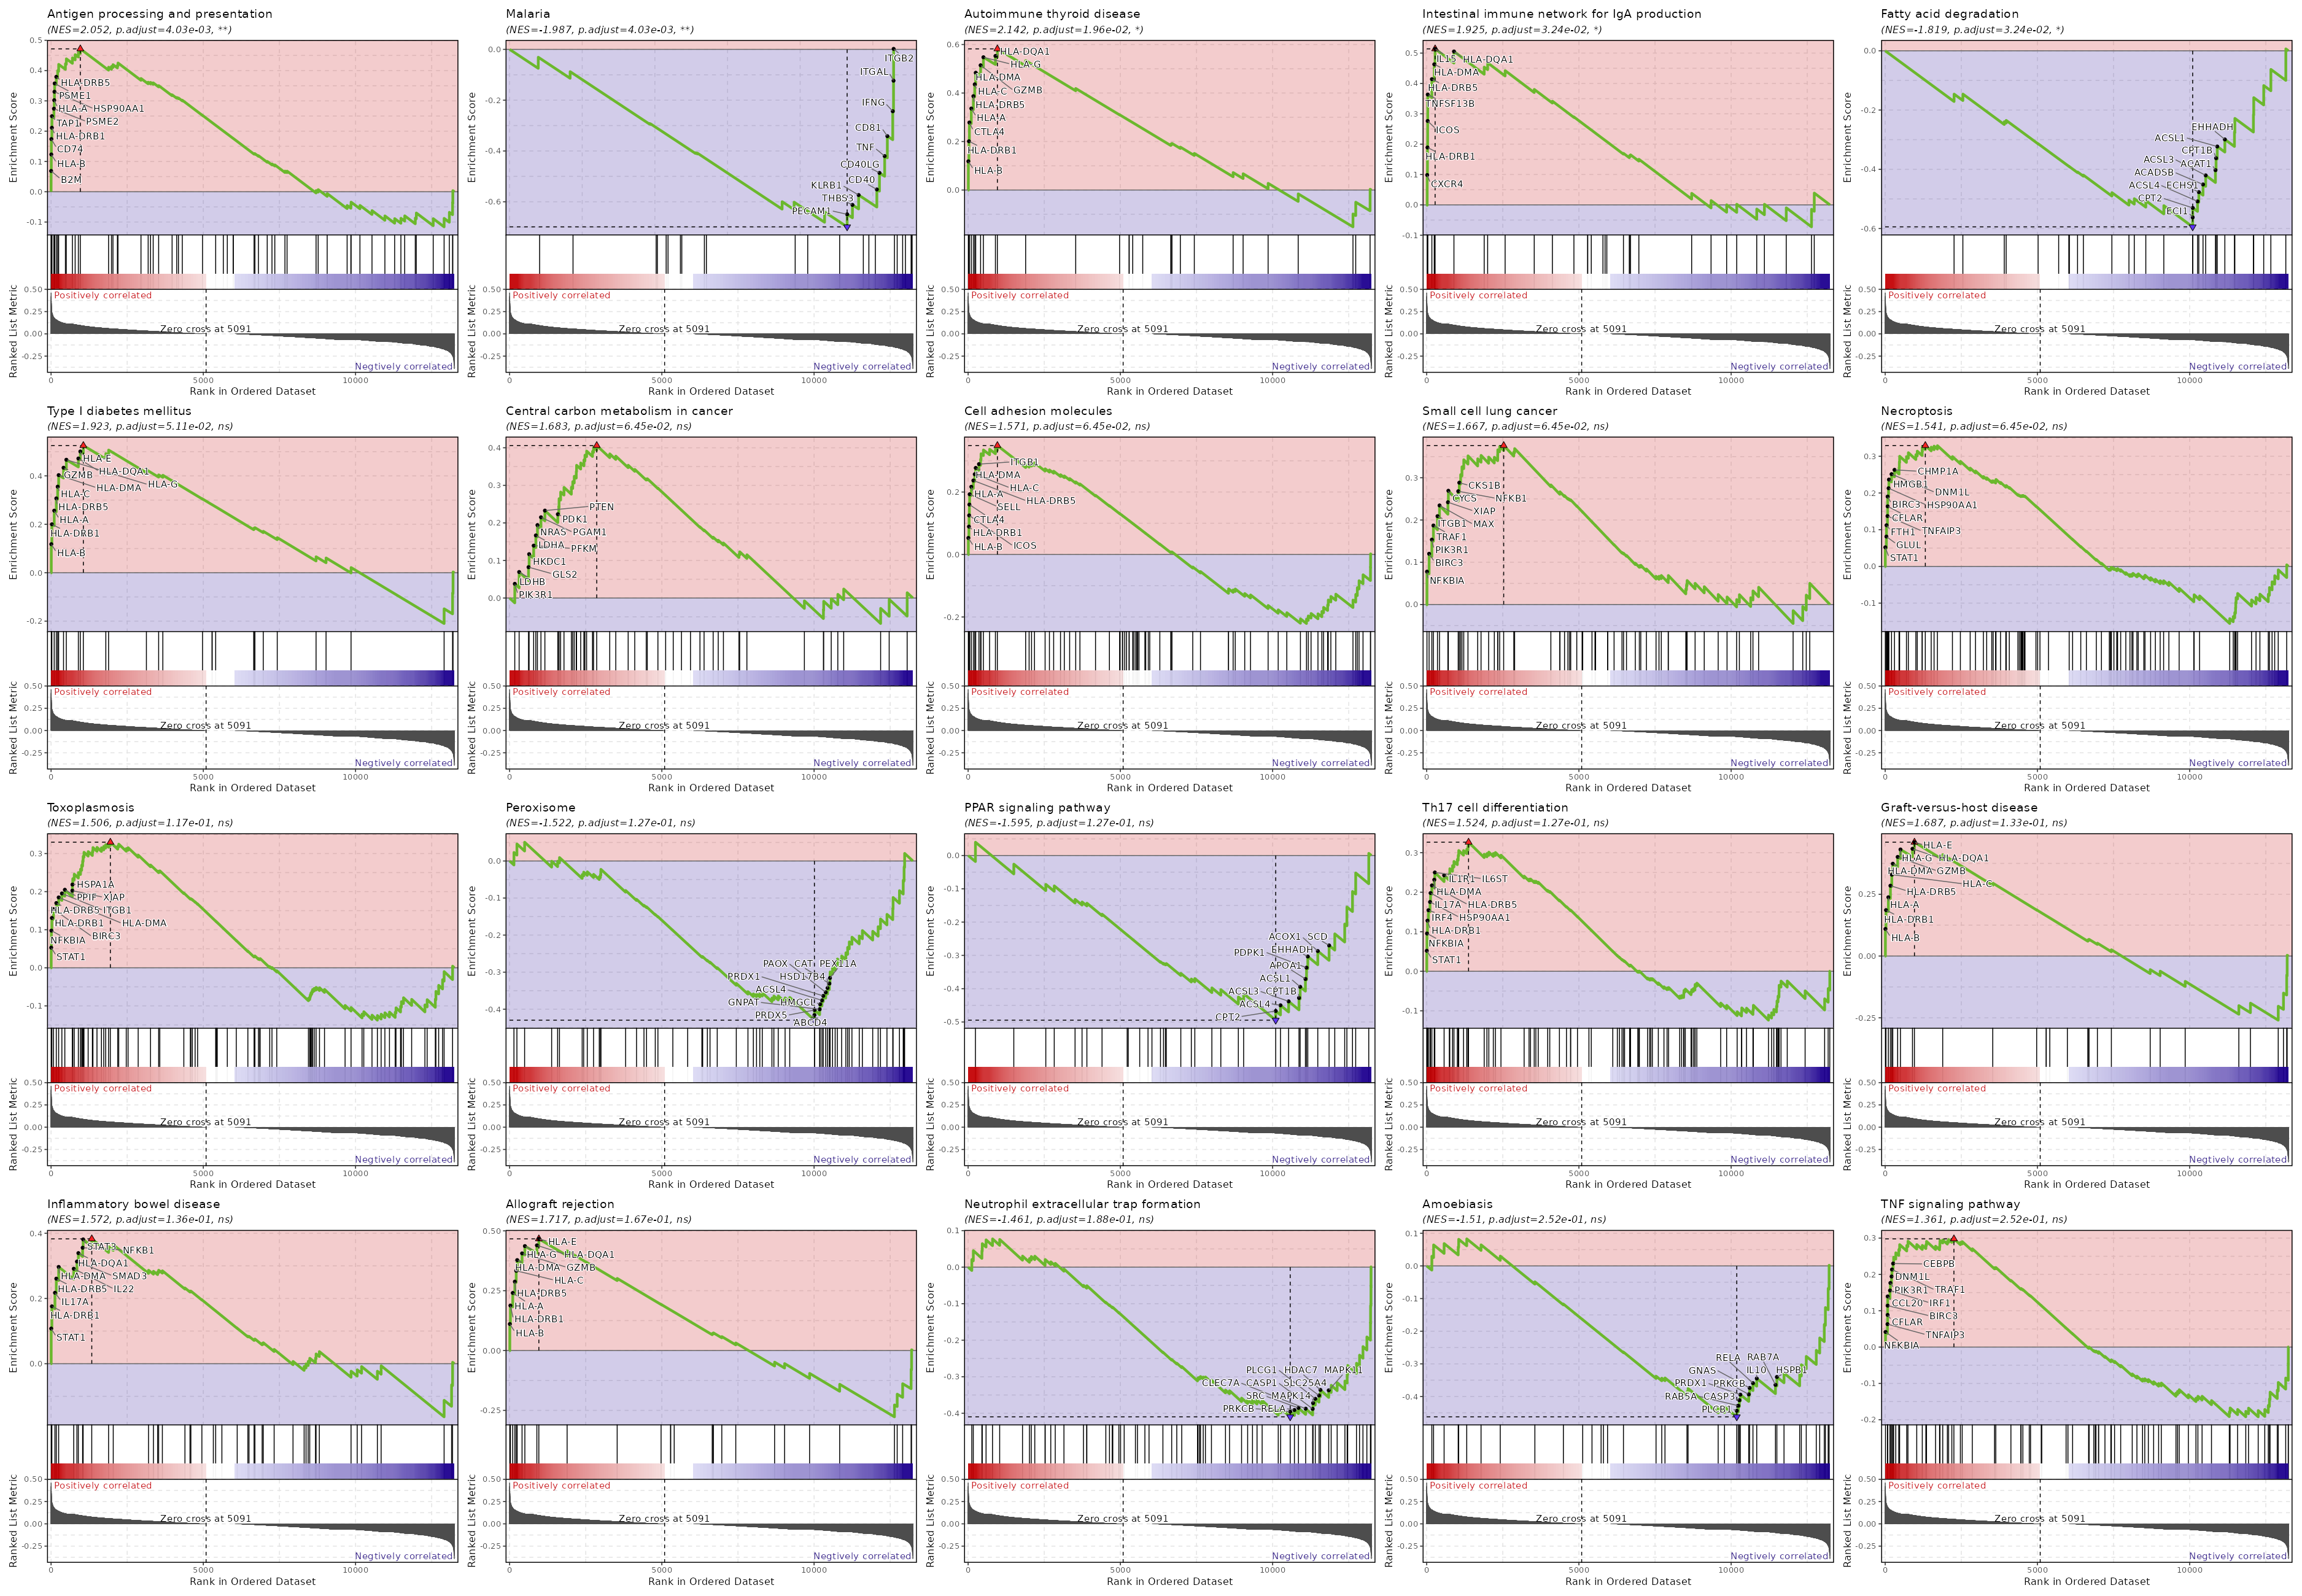
|
+
flip = true
|
|
665
|
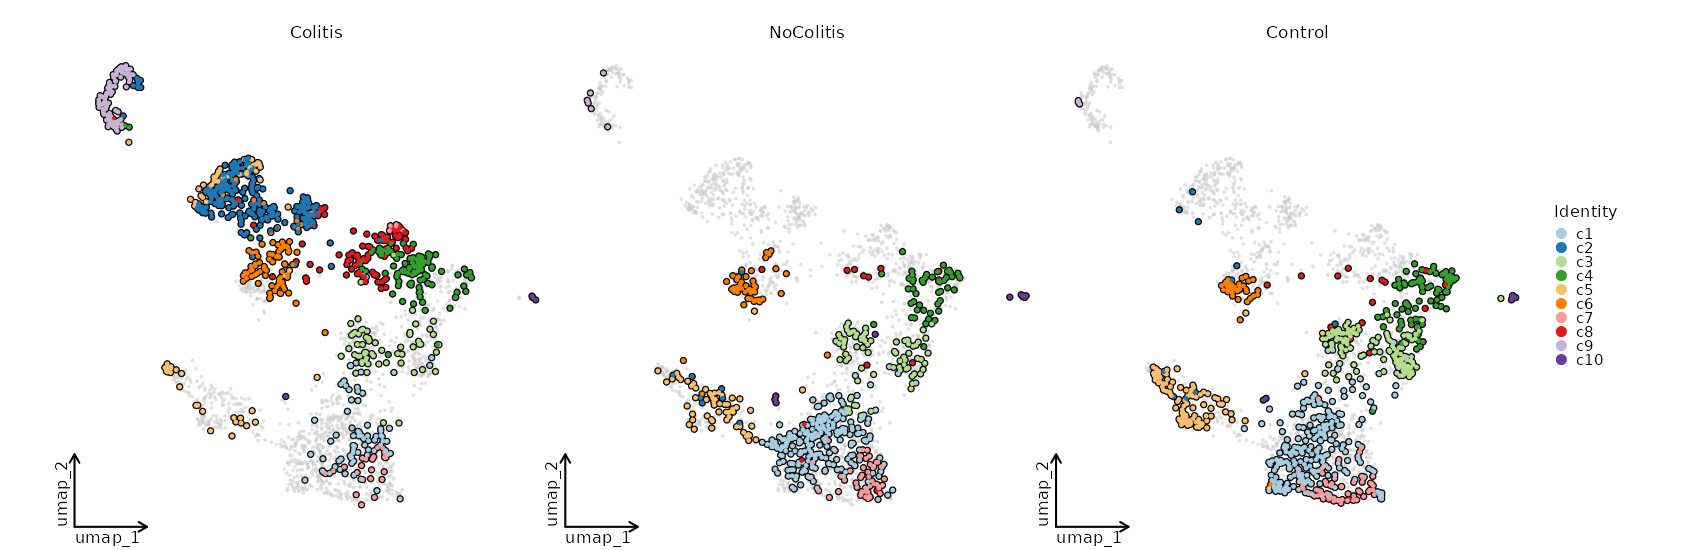
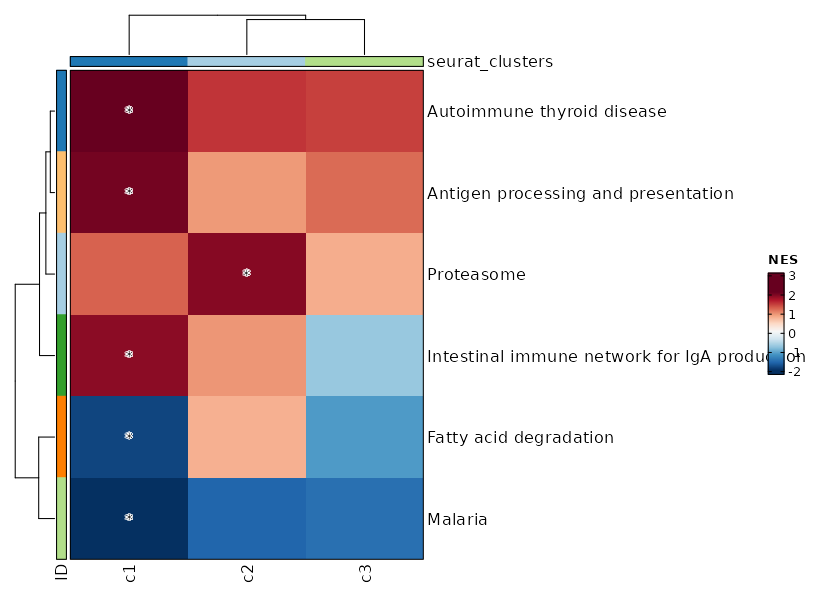
+
palette = "YlOrRd"
|
|
666
|
+
column_annotation = ["percent.mt", "VDJ_Presence"]
|
|
667
|
+
column_annotation_type = {"percent.mt" = "violin", VDJ_Presence = "pie"}
|
|
668
|
+
column_annotation_params = {"percent.mt" = {show_legend = false}}
|
|
669
|
+
devpars = {width = 1400, height = 900}
|
|
670
|
+
```
|
|
671
|
+
|
|
672
|
+
{: width="80%" }
|
|
673
|
+
|
|
674
|
+
### Dimensional reduction plot
|
|
675
|
+
|
|
676
|
+
```toml
|
|
677
|
+
[SeuratClusterStats.envs.features."Dimensional reduction plot"]
|
|
517
678
|
label = true
|
|
518
679
|
```
|
|
519
680
|
|
|
520
|
-
{: width="80%" }
|
|
682
|
+
|
|
683
|
+
### Dimensional reduction plot (with marks)
|
|
684
|
+
|
|
685
|
+
```toml
|
|
686
|
+
[SeuratClusterStats.envs.dimplots."Dimensional reduction plot (with marks)"]
|
|
687
|
+
add_mark = true
|
|
688
|
+
mark_linetype = 2
|
|
689
|
+
```
|
|
690
|
+
|
|
691
|
+
{: width="80%" }
|
|
692
|
+
|
|
693
|
+
### Dimensional reduction plot (with hex bins)
|
|
694
|
+
|
|
695
|
+
```toml
|
|
696
|
+
[SeuratClusterStats.envs.dimplots."Dimensional reduction plot (with hex bins)"]
|
|
697
|
+
hex = true
|
|
698
|
+
hex_bins = 50
|
|
699
|
+
```
|
|
700
|
+
|
|
701
|
+
{: width="80%" }
|
|
702
|
+
|
|
703
|
+
### Dimensional reduction plot (with Diagnosis stats)
|
|
704
|
+
|
|
705
|
+
```toml
|
|
706
|
+
[SeuratClusterStats.envs.dimplots."Dimensional reduction plot (with Diagnosis stats)"]
|
|
707
|
+
stat_by = "Diagnosis"
|
|
708
|
+
stat_plot_type = "ring"
|
|
709
|
+
stat_plot_size = 0.15
|
|
710
|
+
```
|
|
711
|
+
|
|
712
|
+
{: width="80%" }
|
|
713
|
+
|
|
714
|
+
### Dimensional reduction plot by Diagnosis
|
|
715
|
+
|
|
716
|
+
```toml
|
|
717
|
+
[SeuratClusterStats.envs.dimplots."Dimensional reduction plot by Diagnosis"]
|
|
718
|
+
facet_by = "Diagnosis"
|
|
719
|
+
highlight = true
|
|
720
|
+
theme = "theme_blank"
|
|
721
|
+
```
|
|
722
|
+
|
|
723
|
+
{: width="80%" }
|
|
521
724
|
|
|
522
725
|
Input:
|
|
523
726
|
srtobj: The seurat object loaded by `SeuratClustering`
|
|
@@ -574,12 +777,6 @@ class SeuratClusterStats(Proc):
|
|
|
574
777
|
See <https://pwwang.github.io/scplotter/reference/CellStatPlot.html>.
|
|
575
778
|
stats (type=json): The number/fraction of cells to plot.
|
|
576
779
|
Keys are the names of the plots and values are the dicts inherited from `env.stats_defaults`.
|
|
577
|
-
Here are some examples -
|
|
578
|
-
>>> {
|
|
579
|
-
>>> "nCells_All": {},
|
|
580
|
-
>>> "nCells_Sample": {"group_by": "Sample"},
|
|
581
|
-
>>> "fracCells_Sample": {"scale_y": True, "group_by": "Sample", plot_type = "pie"},
|
|
582
|
-
>>> }
|
|
583
780
|
ngenes_defaults (ns): The default parameters for `ngenes`.
|
|
584
781
|
The default parameters to plot the number of genes expressed in each cell.
|
|
585
782
|
- more_formats (type=list): The formats to save the plots other than `png`.
|
|
@@ -603,7 +800,7 @@ class SeuratClusterStats(Proc):
|
|
|
603
800
|
`ActivationScore` in the metadata.
|
|
604
801
|
You may also specify the literal order of the clusters by a list of strings (at least two).
|
|
605
802
|
- subset: An expression to subset the cells, will be passed to `tidyrseurat::filter()`.
|
|
606
|
-
- devpars (ns): The device parameters for the plots.
|
|
803
|
+
- devpars (ns): The device parameters for the plots.
|
|
607
804
|
- res (type=int): The resolution of the plots.
|
|
608
805
|
- height (type=int): The height of the plots.
|
|
609
806
|
- width (type=int): The width of the plots.
|
|
@@ -695,7 +892,7 @@ class SeuratClusterStats(Proc):
|
|
|
695
892
|
},
|
|
696
893
|
"features": {},
|
|
697
894
|
"dimplots_defaults": {
|
|
698
|
-
"group_by":
|
|
895
|
+
"group_by": None, # use default ident
|
|
699
896
|
"split_by": None,
|
|
700
897
|
"subset": None,
|
|
701
898
|
"reduction": "dim",
|
|
@@ -782,11 +979,16 @@ class ModuleScoreCalculator(Proc):
|
|
|
782
979
|
will perform diffusion map as a reduction and add the first 2
|
|
783
980
|
components as `DC_1` and `DC_2` to the metadata. `diffmap` is a shortcut
|
|
784
981
|
for `diffusion_map`. Other key-value pairs will pass to
|
|
785
|
-
[`destiny::DiffusionMap()`](https://www.rdocumentation.org/packages/destiny/versions/2.0.4/topics/DiffusionMap
|
|
982
|
+
[`destiny::DiffusionMap()`](https://www.rdocumentation.org/packages/destiny/versions/2.0.4/topics/DiffusionMap class).
|
|
786
983
|
You can later plot the diffusion map by using
|
|
787
984
|
`reduction = "DC"` in `env.dimplots` in `SeuratClusterStats`.
|
|
788
985
|
This requires [`SingleCellExperiment`](https://bioconductor.org/packages/release/bioc/html/SingleCellExperiment.html)
|
|
789
986
|
and [`destiny`](https://bioconductor.org/packages/release/bioc/html/destiny.html) R packages.
|
|
987
|
+
post_mutaters (type=json): The mutaters to mutate the metadata after
|
|
988
|
+
calculating the module scores.
|
|
989
|
+
The mutaters will be applied in the order specified.
|
|
990
|
+
This is useful when you want to create new scores based on the
|
|
991
|
+
calculated module scores.
|
|
790
992
|
""" # noqa: E501
|
|
791
993
|
|
|
792
994
|
input = "srtobj:file"
|
|
@@ -810,6 +1012,7 @@ class ModuleScoreCalculator(Proc):
|
|
|
810
1012
|
# "Activation": {"features": "IFNG"},
|
|
811
1013
|
# "Proliferation": {"features": "STMN1,TUBB"},
|
|
812
1014
|
},
|
|
1015
|
+
"post_mutaters": {},
|
|
813
1016
|
}
|
|
814
1017
|
script = "file://../scripts/scrna/ModuleScoreCalculator.R"
|
|
815
1018
|
|
|
@@ -1010,7 +1213,7 @@ class DimPlots(Proc):
|
|
|
1010
1213
|
class MarkersFinder(Proc):
|
|
1011
1214
|
"""Find markers between different groups of cells
|
|
1012
1215
|
|
|
1013
|
-
When only `group_by` is specified as
|
|
1216
|
+
When only `group_by` is specified as identity column in
|
|
1014
1217
|
`envs.cases`, the markers will be found for all the clusters.
|
|
1015
1218
|
|
|
1016
1219
|
You can also find the differentially expressed genes between
|
|
@@ -1034,7 +1237,7 @@ class MarkersFinder(Proc):
|
|
|
1034
1237
|
You can also use the clone selectors to select the TCR clones/clusters.
|
|
1035
1238
|
See <https://pwwang.github.io/scplotter/reference/clone_selectors.html>.
|
|
1036
1239
|
group_by: The column name in metadata to group the cells.
|
|
1037
|
-
If only `group_by` is specified, and `
|
|
1240
|
+
If only `group_by` is specified, and `ident_1` and `ident_2` are
|
|
1038
1241
|
not specified, markers will be found for all groups in this column
|
|
1039
1242
|
in the manner of "group vs rest" comparison.
|
|
1040
1243
|
`NA` group will be ignored.
|
|
@@ -1043,7 +1246,7 @@ class MarkersFinder(Proc):
|
|
|
1043
1246
|
ident_1: The first group of cells to compare
|
|
1044
1247
|
When this is empty, the comparisons will be expanded to each group v.s. the rest of the cells in `group_by`.
|
|
1045
1248
|
ident_2: The second group of cells to compare
|
|
1046
|
-
If not provided, the rest of the cells are used for `
|
|
1249
|
+
If not provided, the rest of the cells are used for `ident_2`.
|
|
1047
1250
|
each: The column name in metadata to separate the cells into different
|
|
1048
1251
|
cases.
|
|
1049
1252
|
When this is specified, the case will be expanded for each value of
|
|
@@ -1051,9 +1254,19 @@ class MarkersFinder(Proc):
|
|
|
1051
1254
|
then the case will be expanded as `envs.cases."Cluster Markers - Sample1"`, `envs.cases."Cluster Markers - Sample2"`, etc.
|
|
1052
1255
|
You can specify `allmarker_plots` and `overlaps` to plot the markers for all cases in the same plot and plot the overlaps of the markers
|
|
1053
1256
|
between different cases by values in this column.
|
|
1054
|
-
dbs (list): The dbs to do enrichment analysis for significant
|
|
1055
|
-
|
|
1056
|
-
<https://
|
|
1257
|
+
dbs (list): The dbs to do enrichment analysis for significant markers.
|
|
1258
|
+
You can use built-in dbs in `enrichit`, or provide your own gmt files.
|
|
1259
|
+
See also <https://pwwang.github.io/enrichit/reference/FetchGMT.html>.
|
|
1260
|
+
The built-in dbs include:
|
|
1261
|
+
* "BioCarta" or "BioCarta_2016"
|
|
1262
|
+
* "GO_Biological_Process" or "GO_Biological_Process_2025"
|
|
1263
|
+
* "GO_Cellular_Component" or "GO_Cellular_Component_2025"
|
|
1264
|
+
* "GO_Molecular_Function" or "GO_Molecular_Function_2025"
|
|
1265
|
+
* "KEGG", "KEGG_Human", "KEGG_2021", or "KEGG_2021_Human"
|
|
1266
|
+
* "Hallmark", "MSigDB_Hallmark", or "MSigDB_Hallmark_2020"
|
|
1267
|
+
* "Reactome", "Reactome_Pathways", or "Reactome_Pathways_2024"
|
|
1268
|
+
* "WikiPathways", "WikiPathways_2024", "WikiPathways_Human", or "WikiPathways_2024_Human"
|
|
1269
|
+
You can also fetch more dbs from <https://maayanlab.cloud/Enrichr/#libraries>.
|
|
1057
1270
|
sigmarkers: An expression passed to `dplyr::filter()` to filter the
|
|
1058
1271
|
significant markers for enrichment analysis.
|
|
1059
1272
|
Available variables are `p_val`, `avg_log2FC`, `pct.1`, `pct.2` and
|
|
@@ -1077,9 +1290,9 @@ class MarkersFinder(Proc):
|
|
|
1077
1290
|
Use `-` to replace `.` in the argument name. For example,
|
|
1078
1291
|
use `min-pct` instead of `min.pct`.
|
|
1079
1292
|
- <more>: See <https://satijalab.org/seurat/reference/findmarkers>
|
|
1080
|
-
allmarker_plots_defaults (ns): Default options for the plots for all markers when `
|
|
1293
|
+
allmarker_plots_defaults (ns): Default options for the plots for all markers when `ident_1` is not specified.
|
|
1081
1294
|
- plot_type: The type of the plot.
|
|
1082
|
-
See <https://pwwang.github.io/
|
|
1295
|
+
See <https://pwwang.github.io/biopipen.utils.R/reference/VizDEGs.html>.
|
|
1083
1296
|
Available types are `violin`, `box`, `bar`, `ridge`, `dim`, `heatmap` and `dot`.
|
|
1084
1297
|
- more_formats (type=list): The extra formats to save the plot in.
|
|
1085
1298
|
- save_code (flag): Whether to save the code to generate the plot.
|
|
@@ -1087,9 +1300,7 @@ class MarkersFinder(Proc):
|
|
|
1087
1300
|
- res (type=int): The resolution of the plots.
|
|
1088
1301
|
- height (type=int): The height of the plots.
|
|
1089
1302
|
- width (type=int): The width of the plots.
|
|
1090
|
-
-
|
|
1091
|
-
- genes: The number of top genes to show or an expression passed to `dplyr::filter()` to filter the genes.
|
|
1092
|
-
- <more>: Other arguments passed to [`scplotter::FeatureStatPlot()`](https://pwwang.github.io/scplotter/reference/FeatureStatPlot.html).
|
|
1303
|
+
- <more>: Other arguments passed to [`biopipen.utils::VizDEGs()`](https://pwwang.github.io/biopipen.utils.R/reference/VizDEGs.html).
|
|
1093
1304
|
allmarker_plots (type=json): All marker plot cases.
|
|
1094
1305
|
The keys are the names of the cases and the values are the dicts inherited from `allmarker_plots_defaults`.
|
|
1095
1306
|
allenrich_plots_defaults (ns): Default options for the plots to generate for the enrichment analysis.
|
|
@@ -1104,7 +1315,7 @@ class MarkersFinder(Proc):
|
|
|
1104
1315
|
The cases under `envs.cases` can inherit this options.
|
|
1105
1316
|
marker_plots_defaults (ns): Default options for the plots to generate for the markers.
|
|
1106
1317
|
- plot_type: The type of the plot.
|
|
1107
|
-
See <https://pwwang.github.io/
|
|
1318
|
+
See <https://pwwang.github.io/biopipen.utils.R/reference/VizDEGs.html>.
|
|
1108
1319
|
Available types are `violin`, `box`, `bar`, `ridge`, `dim`, `heatmap` and `dot`.
|
|
1109
1320
|
There are two additional types available - `volcano_pct` and `volcano_log2fc`.
|
|
1110
1321
|
- more_formats (type=list): The extra formats to save the plot in.
|
|
@@ -1113,9 +1324,7 @@ class MarkersFinder(Proc):
|
|
|
1113
1324
|
- res (type=int): The resolution of the plots.
|
|
1114
1325
|
- height (type=int): The height of the plots.
|
|
1115
1326
|
- width (type=int): The width of the plots.
|
|
1116
|
-
-
|
|
1117
|
-
- genes: The number of top genes to show or an expression passed to `dplyr::filter()` to filter the genes.
|
|
1118
|
-
- <more>: Other arguments passed to [`scplotter::FeatureStatPlot()`](https://pwwang.github.io/scplotter/reference/FeatureStatPlot.html).
|
|
1327
|
+
- <more>: Other arguments passed to [`biopipen.utils::VizDEGs()`](https://pwwang.github.io/biopipen.utils.R/reference/VizDEGs.html).
|
|
1119
1328
|
If `plot_type` is `volcano_pct` or `volcano_log2fc`, they will be passed to
|
|
1120
1329
|
[`scplotter::VolcanoPlot()`](https://pwwang.github.io/plotthis/reference/VolcanoPlot.html).
|
|
1121
1330
|
marker_plots (type=json): Cases of the plots to generate for the markers.
|
|
@@ -1131,12 +1340,12 @@ class MarkersFinder(Proc):
|
|
|
1131
1340
|
- res (type=int): The resolution of the plots.
|
|
1132
1341
|
- height (type=int): The height of the plots.
|
|
1133
1342
|
- width (type=int): The width of the plots.
|
|
1134
|
-
- <more>: See <https://pwwang.github.io/scplotter/reference/EnrichmentPlot.
|
|
1343
|
+
- <more>: See <https://pwwang.github.io/scplotter/reference/EnrichmentPlot.html>.
|
|
1135
1344
|
enrich_plots (type=json): Cases of the plots to generate for the enrichment analysis.
|
|
1136
1345
|
The keys are the names of the cases and the values are the dicts inherited from `enrich_plots_defaults`.
|
|
1137
1346
|
The cases under `envs.cases` can inherit this options.
|
|
1138
1347
|
overlaps_defaults (ns): Default options for investigating the overlapping of significant markers between different cases or comparisons.
|
|
1139
|
-
This means either `
|
|
1348
|
+
This means either `ident_1` should be empty, so that they can be expanded to multiple comparisons.
|
|
1140
1349
|
- sigmarkers: The expression to filter the significant markers for each case.
|
|
1141
1350
|
If not provided, `envs.sigmarkers` will be used.
|
|
1142
1351
|
- plot_type (choice): The type of the plot to generate for the overlaps.
|
|
@@ -1155,8 +1364,8 @@ class MarkersFinder(Proc):
|
|
|
1155
1364
|
overlaps (type=json): Cases for investigating the overlapping of significant markers between different cases or comparisons.
|
|
1156
1365
|
The keys are the names of the cases and the values are the dicts inherited from `overlaps_defaults`.
|
|
1157
1366
|
There are two situations that we can perform overlaps:
|
|
1158
|
-
1. If `
|
|
1159
|
-
2. If `each` is specified, the overlaps can be performed between different cases, where in each case, `
|
|
1367
|
+
1. If `ident_1` is not specified, the overlaps can be performed between different comparisons.
|
|
1368
|
+
2. If `each` is specified, the overlaps can be performed between different cases, where in each case, `ident_1` must be specified.
|
|
1160
1369
|
cases (type=json): If you have multiple cases for marker discovery, you can specify them
|
|
1161
1370
|
here. The keys are the names of the cases and the values are the above options. If some options are
|
|
1162
1371
|
not specified, the default values specified above (under `envs`) will be used.
|
|
@@ -1186,8 +1395,6 @@ class MarkersFinder(Proc):
|
|
|
1186
1395
|
"more_formats": [],
|
|
1187
1396
|
"save_code": False,
|
|
1188
1397
|
"devpars": {"res": 100},
|
|
1189
|
-
"order_by": "desc(abs(avg_log2FC))",
|
|
1190
|
-
"genes": 10,
|
|
1191
1398
|
},
|
|
1192
1399
|
"allmarker_plots": {},
|
|
1193
1400
|
"allenrich_plots_defaults": {
|
|
@@ -1200,8 +1407,6 @@ class MarkersFinder(Proc):
|
|
|
1200
1407
|
"more_formats": [],
|
|
1201
1408
|
"save_code": False,
|
|
1202
1409
|
"devpars": {"res": 100},
|
|
1203
|
-
"order_by": "desc(abs(avg_log2FC))",
|
|
1204
|
-
"genes": 10,
|
|
1205
1410
|
},
|
|
1206
1411
|
"marker_plots": {
|
|
1207
1412
|
"Volcano Plot (diff_pct)": {"plot_type": "volcano_pct"},
|
|
@@ -1255,9 +1460,19 @@ class TopExpressingGenes(Proc):
|
|
|
1255
1460
|
group_by: The column name in metadata to group the cells.
|
|
1256
1461
|
each: The column name in metadata to separate the cells into different
|
|
1257
1462
|
cases.
|
|
1258
|
-
dbs (list): The dbs to do enrichment analysis for significant
|
|
1259
|
-
|
|
1260
|
-
<https://
|
|
1463
|
+
dbs (list): The dbs to do enrichment analysis for significant markers.
|
|
1464
|
+
You can use built-in dbs in `enrichit`, or provide your own gmt files.
|
|
1465
|
+
See also <https://pwwang.github.io/enrichit/reference/FetchGMT.html>.
|
|
1466
|
+
The built-in dbs include:
|
|
1467
|
+
* "BioCarta" or "BioCarta_2016"
|
|
1468
|
+
* "GO_Biological_Process" or "GO_Biological_Process_2025"
|
|
1469
|
+
* "GO_Cellular_Component" or "GO_Cellular_Component_2025"
|
|
1470
|
+
* "GO_Molecular_Function" or "GO_Molecular_Function_2025"
|
|
1471
|
+
* "KEGG", "KEGG_Human", "KEGG_2021", or "KEGG_2021_Human"
|
|
1472
|
+
* "Hallmark", "MSigDB_Hallmark", or "MSigDB_Hallmark_2020"
|
|
1473
|
+
* "Reactome", "Reactome_Pathways", or "Reactome_Pathways_2024"
|
|
1474
|
+
* "WikiPathways", "WikiPathways_2024", "WikiPathways_Human", or "WikiPathways_2024_Human"
|
|
1475
|
+
You can also fetch more dbs from <https://maayanlab.cloud/Enrichr/#libraries>.
|
|
1261
1476
|
n (type=int): The number of top expressing genes to find.
|
|
1262
1477
|
enrich_style (choice): The style of the enrichment analysis.
|
|
1263
1478
|
The enrichment analysis will be done by `EnrichIt()` from [`enrichit`](https://pwwang.github.io/enrichit/).
|
|
@@ -1604,6 +1819,32 @@ class ScFGSEA(Proc):
|
|
|
1604
1819
|
For each case, the process will generate a table with the enrichment scores for
|
|
1605
1820
|
each gene set, and GSEA plots for the top gene sets.
|
|
1606
1821
|
|
|
1822
|
+
Examples:
|
|
1823
|
+
### The summary and GSEA plots
|
|
1824
|
+
|
|
1825
|
+
{: width="80%"}
|
|
1826
|
+
|
|
1827
|
+
{: width="80%"}
|
|
1828
|
+
|
|
1829
|
+
### Summary plot for all subsets or idents
|
|
1830
|
+
|
|
1831
|
+
If you use `each` to separate the cells into different subsets, this is useful to
|
|
1832
|
+
make a summary plot for all subsets. Or if you don't specify `ident_1`, the summary plot for all idents in `group_by` will be generated.
|
|
1833
|
+
|
|
1834
|
+
```toml
|
|
1835
|
+
[ScFGSEA.envs]
|
|
1836
|
+
group_by = "Diagnosis"
|
|
1837
|
+
ident_1 = "Colitis"
|
|
1838
|
+
ident_2 = "Control"
|
|
1839
|
+
each = "seurat_clusters"
|
|
1840
|
+
|
|
1841
|
+
[ScFGSEA.envs.alleach_plots.Heatmap]
|
|
1842
|
+
plot_type = "heatmap"
|
|
1843
|
+
group_by = "Diagnosis"
|
|
1844
|
+
```
|
|
1845
|
+
|
|
1846
|
+
{: width="80%"}
|
|
1847
|
+
|
|
1607
1848
|
Input:
|
|
1608
1849
|
srtobj: The seurat object in RDS format
|
|
1609
1850
|
|
|
@@ -1620,11 +1861,23 @@ class ScFGSEA(Proc):
|
|
|
1620
1861
|
|
|
1621
1862
|
group_by: The column name in metadata to group the cells.
|
|
1622
1863
|
ident_1: The first group of cells to compare
|
|
1623
|
-
ident_2: The second group of cells to compare, if not provided, the rest of the cells that are not `NA`s in `group_by` column are used for `
|
|
1864
|
+
ident_2: The second group of cells to compare, if not provided, the rest of the cells that are not `NA`s in `group_by` column are used for `ident_2`.
|
|
1865
|
+
assay: The assay to use. If not provided, the default assay will be used.
|
|
1624
1866
|
each: The column name in metadata to separate the cells into different subsets to do the analysis.
|
|
1625
1867
|
subset: An expression to subset the cells.
|
|
1626
1868
|
gmtfile: The pathways in GMT format, with the gene names/ids in the same format as the seurat object.
|
|
1627
|
-
|
|
1869
|
+
You can use built-in dbs in `enrichit`, or provide your own gmt files.
|
|
1870
|
+
See also <https://pwwang.github.io/enrichit/reference/FetchGMT.html>.
|
|
1871
|
+
The built-in dbs include:
|
|
1872
|
+
* "BioCarta" or "BioCarta_2016"
|
|
1873
|
+
* "GO_Biological_Process" or "GO_Biological_Process_2025"
|
|
1874
|
+
* "GO_Cellular_Component" or "GO_Cellular_Component_2025"
|
|
1875
|
+
* "GO_Molecular_Function" or "GO_Molecular_Function_2025"
|
|
1876
|
+
* "KEGG", "KEGG_Human", "KEGG_2021", or "KEGG_2021_Human"
|
|
1877
|
+
* "Hallmark", "MSigDB_Hallmark", or "MSigDB_Hallmark_2020"
|
|
1878
|
+
* "Reactome", "Reactome_Pathways", or "Reactome_Pathways_2024"
|
|
1879
|
+
* "WikiPathways", "WikiPathways_2024", "WikiPathways_Human", or "WikiPathways_2024_Human"
|
|
1880
|
+
You can also fetch more dbs from <https://maayanlab.cloud/Enrichr/#libraries>.
|
|
1628
1881
|
method (choice): The method to do the preranking.
|
|
1629
1882
|
- signal_to_noise: Signal to noise.
|
|
1630
1883
|
The larger the differences of the means (scaled by the standard deviations);
|
|
@@ -1677,6 +1930,7 @@ class ScFGSEA(Proc):
|
|
|
1677
1930
|
envs = {
|
|
1678
1931
|
"mutaters": {},
|
|
1679
1932
|
"ncores": config.misc.ncores,
|
|
1933
|
+
"assay": None,
|
|
1680
1934
|
"group_by": None,
|
|
1681
1935
|
"ident_1": None,
|
|
1682
1936
|
"ident_2": None,
|
|
@@ -1711,13 +1965,18 @@ class CellTypeAnnotation(Proc):
|
|
|
1711
1965
|
3. Use [`scCATCH`](https://github.com/ZJUFanLab/scCATCH)
|
|
1712
1966
|
4. Use [`hitype`](https://github.com/pwwang/hitype)
|
|
1713
1967
|
|
|
1714
|
-
The annotated cell types will replace the original
|
|
1968
|
+
The annotated cell types will replace the original identity column in the metadata,
|
|
1715
1969
|
so that the downstream processes will use the annotated cell types.
|
|
1716
1970
|
|
|
1717
|
-
|
|
1971
|
+
/// Note
|
|
1972
|
+
|
|
1973
|
+
When cell types are annotated, the original identity column (e.g. `seurat_clusters`) will be renamed
|
|
1974
|
+
to `envs.backup_col` (e.g. `seurat_clusters_id`), and the new identity column will be added.
|
|
1975
|
+
|
|
1976
|
+
///
|
|
1718
1977
|
|
|
1719
1978
|
If you are using `ScType`, `scCATCH`, or `hitype`, a text file containing the mapping from
|
|
1720
|
-
the
|
|
1979
|
+
the original identity to the new cell types will be generated and saved to
|
|
1721
1980
|
`cluster2celltype.tsv` under `<workdir>/<pipline_name>/CellTypeAnnotation/0/output/`.
|
|
1722
1981
|
|
|
1723
1982
|
Examples:
|
|
@@ -1741,8 +2000,10 @@ class CellTypeAnnotation(Proc):
|
|
|
1741
2000
|
|
|
1742
2001
|
Output:
|
|
1743
2002
|
outfile: The rds/qs/qs2/h5ad file of seurat object with cell type annotated.
|
|
1744
|
-
A text file containing the mapping from the old
|
|
2003
|
+
A text file containing the mapping from the old identity to the new cell types
|
|
1745
2004
|
will be generated and saved to `cluster2celltype.tsv` under the job output directory.
|
|
2005
|
+
Note that if `envs.ident` is specified, the output Seurat object will have
|
|
2006
|
+
the identity set to the specified column in metadata.
|
|
1746
2007
|
|
|
1747
2008
|
Envs:
|
|
1748
2009
|
tool (choice): The tool to use for cell type annotation.
|
|
@@ -1760,6 +2021,13 @@ class CellTypeAnnotation(Proc):
|
|
|
1760
2021
|
If not specified, all rows in `sctype_db` will be used.
|
|
1761
2022
|
sctype_db: The database to use for sctype.
|
|
1762
2023
|
Check examples at <https://github.com/IanevskiAleksandr/sc-type/blob/master/ScTypeDB_full.xlsx>
|
|
2024
|
+
ident: The column name in metadata to use as the clusters.
|
|
2025
|
+
If not specified, the identity column will be used when input is rds/qs/qs2 (supposing we have a Seurat object).
|
|
2026
|
+
If input data is h5ad, this is required to run cluster-based annotation tools.
|
|
2027
|
+
For `celltypist`, this is a shortcut to set `over_clustering` in `celltypist_args`.
|
|
2028
|
+
backup_col: The backup column name to store the original identities.
|
|
2029
|
+
If not specified, the original identity column will not be stored.
|
|
2030
|
+
If `envs.newcol` is specified, this will be ignored.
|
|
1763
2031
|
hitype_tissue: The tissue to use for `hitype`.
|
|
1764
2032
|
Avaiable tissues should be the first column (`tissueType`) of `hitype_db`.
|
|
1765
2033
|
If not specified, all rows in `hitype_db` will be used.
|
|
@@ -1769,7 +2037,7 @@ class CellTypeAnnotation(Proc):
|
|
|
1769
2037
|
You can also use built-in databases, including `hitypedb_short`, `hitypedb_full`, and `hitypedb_pbmc3k`.
|
|
1770
2038
|
cell_types (list): The cell types to use for direct annotation.
|
|
1771
2039
|
You can use `"-"` or `""` as the placeholder for the clusters that
|
|
1772
|
-
you want to keep the original cell types
|
|
2040
|
+
you want to keep the original cell types.
|
|
1773
2041
|
If the length of `cell_types` is shorter than the number of
|
|
1774
2042
|
clusters, the remaining clusters will be kept as the original cell
|
|
1775
2043
|
types.
|
|
@@ -1781,6 +2049,11 @@ class CellTypeAnnotation(Proc):
|
|
|
1781
2049
|
the original cell types will be kept and nothing will be changed.
|
|
1782
2050
|
///
|
|
1783
2051
|
|
|
2052
|
+
more_cell_types (type=json): The additional cell type annotations to add to the metadata.
|
|
2053
|
+
The keys are the new column names and the values are the cell types lists.
|
|
2054
|
+
The cell type lists work the same as `cell_types` above.
|
|
2055
|
+
This is useful when you want to keep multiple annotations of cell types.
|
|
2056
|
+
|
|
1784
2057
|
sccatch_args (ns): The arguments for `scCATCH::findmarkergene()` if `tool` is `sccatch`.
|
|
1785
2058
|
- species: The specie of cells.
|
|
1786
2059
|
- cancer: If the sample is from cancer tissue, then the cancer type may be defined.
|
|
@@ -1805,8 +2078,8 @@ class CellTypeAnnotation(Proc):
|
|
|
1805
2078
|
merge (flag): Whether to merge the clusters with the same cell types.
|
|
1806
2079
|
Otherwise, a suffix will be added to the cell types (ie. `.1`, `.2`, etc).
|
|
1807
2080
|
newcol: The new column name to store the cell types.
|
|
1808
|
-
If not specified, the
|
|
1809
|
-
If specified, the original
|
|
2081
|
+
If not specified, the identity column will be overwritten.
|
|
2082
|
+
If specified, the original identity column will be kept and `Idents` will be kept as the original identity.
|
|
1810
2083
|
outtype (choice): The output file type. Currently only works for `celltypist`.
|
|
1811
2084
|
An RDS file will be generated for other tools.
|
|
1812
2085
|
- input: Use the same file type as the input.
|
|
@@ -1841,7 +2114,10 @@ class CellTypeAnnotation(Proc):
|
|
|
1841
2114
|
"tool": "hitype",
|
|
1842
2115
|
"sctype_tissue": None,
|
|
1843
2116
|
"sctype_db": config.ref.sctype_db,
|
|
2117
|
+
"ident": None,
|
|
2118
|
+
"backup_col": "seurat_clusters_id",
|
|
1844
2119
|
"cell_types": [],
|
|
2120
|
+
"more_cell_types": None,
|
|
1845
2121
|
"sccatch_args": {
|
|
1846
2122
|
"species": None,
|
|
1847
2123
|
"cancer": "Normal",
|
|
@@ -2217,9 +2493,19 @@ class MetaMarkers(Proc):
|
|
|
2217
2493
|
idents: The groups of cells to compare, values should be in the `group-by` column.
|
|
2218
2494
|
each: The column name in metadata to separate the cells into different cases.
|
|
2219
2495
|
prefix_each (flag): Whether to add the `each` value as prefix to the case name.
|
|
2220
|
-
dbs (list): The dbs to do enrichment analysis for significant
|
|
2221
|
-
|
|
2222
|
-
<https://
|
|
2496
|
+
dbs (list): The dbs to do enrichment analysis for significant markers.
|
|
2497
|
+
You can use built-in dbs in `enrichit`, or provide your own gmt files.
|
|
2498
|
+
See also <https://pwwang.github.io/enrichit/reference/FetchGMT.html>.
|
|
2499
|
+
The built-in dbs include:
|
|
2500
|
+
* "BioCarta" or "BioCarta_2016"
|
|
2501
|
+
* "GO_Biological_Process" or "GO_Biological_Process_2025"
|
|
2502
|
+
* "GO_Cellular_Component" or "GO_Cellular_Component_2025"
|
|
2503
|
+
* "GO_Molecular_Function" or "GO_Molecular_Function_2025"
|
|
2504
|
+
* "KEGG", "KEGG_Human", "KEGG_2021", or "KEGG_2021_Human"
|
|
2505
|
+
* "Hallmark", "MSigDB_Hallmark", or "MSigDB_Hallmark_2020"
|
|
2506
|
+
* "Reactome", "Reactome_Pathways", or "Reactome_Pathways_2024"
|
|
2507
|
+
* "WikiPathways", "WikiPathways_2024", "WikiPathways_Human", or "WikiPathways_2024_Human"
|
|
2508
|
+
You can also fetch more dbs from <https://maayanlab.cloud/Enrichr/#libraries>.
|
|
2223
2509
|
subset: The subset of the cells to do the analysis.
|
|
2224
2510
|
An expression passed to `dplyr::filter()`.
|
|
2225
2511
|
p_adjust (choice): The method to adjust the p values, which can be used to filter the significant markers.
|
|
@@ -2310,6 +2596,9 @@ class AnnData2Seurat(Proc):
|
|
|
2310
2596
|
|
|
2311
2597
|
Envs:
|
|
2312
2598
|
assay: The assay to use to convert to seurat object.
|
|
2599
|
+
ident: The column name in `adfile.obs` to use as the identity
|
|
2600
|
+
for the seurat object.
|
|
2601
|
+
If not specified, no identity will be set.
|
|
2313
2602
|
dotplot_check (type=auto): Whether to do a check with a dot plot.
|
|
2314
2603
|
(`scplotter::FeatureStatPlot(plot_type = "dot", ..)` will be used)
|
|
2315
2604
|
to see if the conversion is successful.
|
|
@@ -2322,7 +2611,7 @@ class AnnData2Seurat(Proc):
|
|
|
2322
2611
|
input = "adfile:file"
|
|
2323
2612
|
output = "outfile:file:{{in.adfile | stem}}.qs"
|
|
2324
2613
|
lang = config.lang.rscript
|
|
2325
|
-
envs = {"assay": "RNA", "dotplot_check": True}
|
|
2614
|
+
envs = {"assay": "RNA", "ident": None, "dotplot_check": True}
|
|
2326
2615
|
script = "file://../scripts/scrna/AnnData2Seurat.R"
|
|
2327
2616
|
|
|
2328
2617
|
|
|
@@ -2415,6 +2704,18 @@ class CellCellCommunication(Proc):
|
|
|
2415
2704
|
* `lr_means`: mean ligand-receptor expression, as a measure of ligand-receptor interaction magnitude.
|
|
2416
2705
|
* `cellphone_pvals`: permutation-based p-values, as a measure of interaction specificity.
|
|
2417
2706
|
|
|
2707
|
+
A typical output will look like this:
|
|
2708
|
+
|
|
2709
|
+
| ligand | ligand_complex | ligand_props | ligand_trimean | mat_max | receptor | receptor_complex | receptor_props | receptor_trimean | source | target | lr_probs | cellchat_pvals | mag_score | spec_score |
|
|
2710
|
+
|--------|---------------|--------------|----------------|---------|----------|------------------|----------------|------------------|--------|--------|----------|----------------|-----------|------------|
|
|
2711
|
+
| VIM | VIM | 1.00 | 0.36 | 8.73 | CD44 | CD44 | 0.77 | 0.16 | c7 | c3 | 0.10 | 0.00 | 0.10 | 0.00 |
|
|
2712
|
+
| MIF | MIF | 0.97 | 0.22 | 8.73 | CXCR4 | CD74_CXCR4 | 0.87 | 0.26 | c5 | c6 | 0.10 | 0.00 | 0.10 | 0.00 |
|
|
2713
|
+
| HLA-B | HLA-B | 1.00 | 0.44 | 8.73 | KLRD1 | KLRD1 | 0.73 | 0.13 | c9 | c2 | 0.10 | 0.00 | 0.10 | 0.00 |
|
|
2714
|
+
| HMGB1 | HMGB1 | 0.99 | 0.26 | 8.73 | CXCR4 | CXCR4 | 0.81 | 0.21 | c2 | c7 | 0.10 | 0.00 | 0.10 | 0.00 |
|
|
2715
|
+
| CD48 | CD48 | 0.94 | 0.20 | 8.73 | CD2 | CD2 | 0.99 | 0.28 | c7 | c8 | 0.10 | 0.00 | 0.10 | 0.00 |
|
|
2716
|
+
| HLA-C | HLA-C | 1.00 | 0.38 | 8.73 | CD8B | CD8B | 0.73 | 0.15 | c1 | c9 | 0.10 | 0.00 | 0.10 | 0.00 |
|
|
2717
|
+
| LGALS1 | LGALS1 | 0.95 | 0.17 | 8.73 | CD69 | CD69 | 0.99 | 0.34 | c10 | c5 | 0.10 | 0.00 | 0.10 | 0.00 |
|
|
2718
|
+
|
|
2418
2719
|
Envs:
|
|
2419
2720
|
method (choice): The method to use for cell-cell communication inference.
|
|
2420
2721
|
- CellPhoneDB: Use CellPhoneDB method.
|
|
@@ -2457,6 +2758,11 @@ class CellCellCommunication(Proc):
|
|
|
2457
2758
|
ncores (type=int): The number of cores to use.
|
|
2458
2759
|
groupby: The column name in metadata to group the cells.
|
|
2459
2760
|
Typically, this column should be the cluster id.
|
|
2761
|
+
If provided input is a Seurat object, the default identity will be used by default.
|
|
2762
|
+
Otherwise, it is recommended to provide this parameter.
|
|
2763
|
+
"seurat_clusters" will be used with a warning if the input is in AnnData format and
|
|
2764
|
+
this parameter is not provided.
|
|
2765
|
+
group_by: alias for `groupby`
|
|
2460
2766
|
species (choice): The species of the cells.
|
|
2461
2767
|
- human: Human cells, the 'consensus' resource will be used.
|
|
2462
2768
|
- mouse: Mouse cells, the 'mouseconsensus' resource will be used.
|
|
@@ -2488,7 +2794,8 @@ class CellCellCommunication(Proc):
|
|
|
2488
2794
|
"subset_using": "auto",
|
|
2489
2795
|
"split_by": None,
|
|
2490
2796
|
"ncores": config.misc.ncores,
|
|
2491
|
-
"groupby":
|
|
2797
|
+
"groupby": None,
|
|
2798
|
+
"group_by": None,
|
|
2492
2799
|
"species": "human",
|
|
2493
2800
|
"expr_prop": 0.1,
|
|
2494
2801
|
"min_cells": 5,
|
|
@@ -2501,6 +2808,38 @@ class CellCellCommunication(Proc):
|
|
|
2501
2808
|
class CellCellCommunicationPlots(Proc):
|
|
2502
2809
|
"""Visualization for cell-cell communication inference.
|
|
2503
2810
|
|
|
2811
|
+
Examples:
|
|
2812
|
+
### Network Plot
|
|
2813
|
+
|
|
2814
|
+
```toml
|
|
2815
|
+
[CellCellCommunicationPlots.envs.cases."Cell-Cell Communication Network"]
|
|
2816
|
+
plot_type = "network"
|
|
2817
|
+
legend-position = "none"
|
|
2818
|
+
theme = "theme_blank"
|
|
2819
|
+
theme_args = {add_coord = false}
|
|
2820
|
+
```
|
|
2821
|
+
|
|
2822
|
+
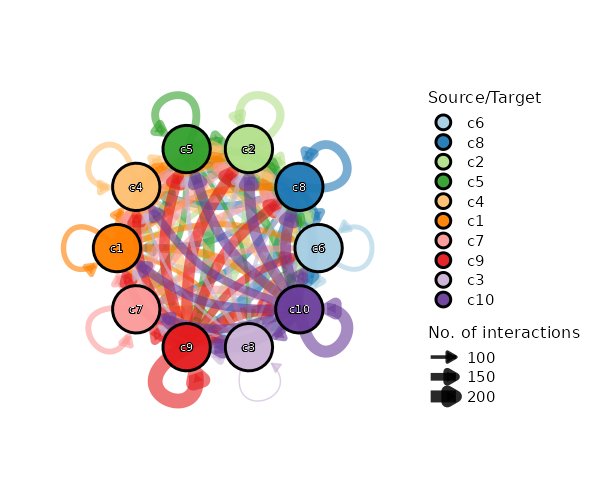{: width="80%"}
|
|
2823
|
+
|
|
2824
|
+
### Circos Plot
|
|
2825
|
+
|
|
2826
|
+
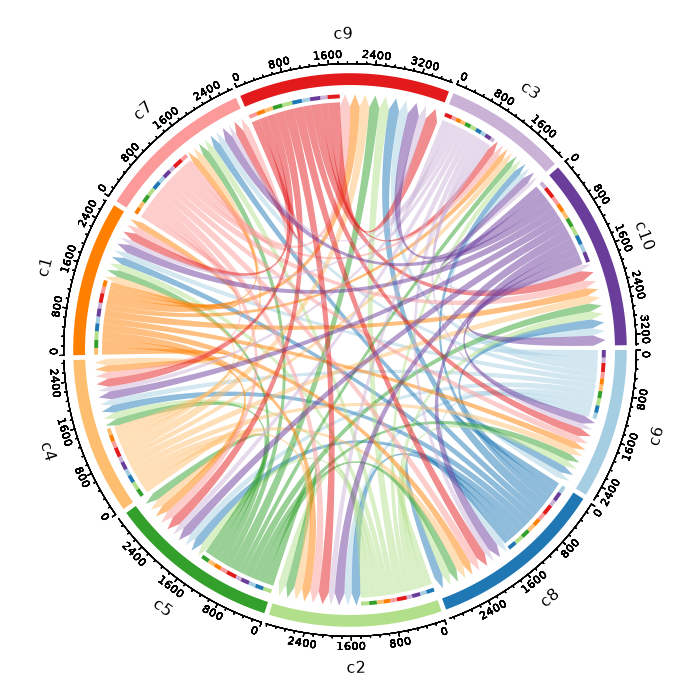{: width="80%"}
|
|
2827
|
+
|
|
2828
|
+
### Heatmap Plot
|
|
2829
|
+
|
|
2830
|
+
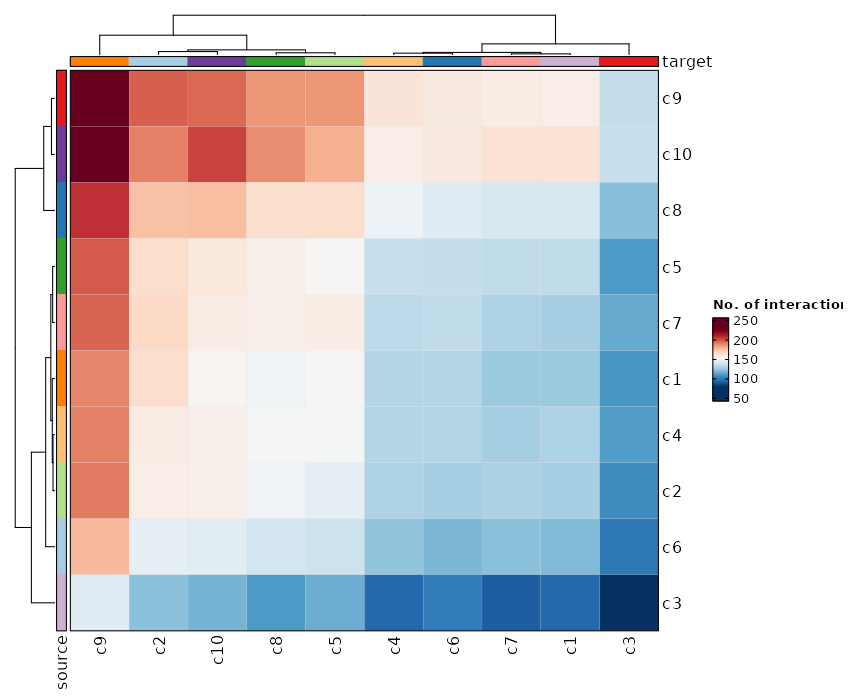{: width="80%"}
|
|
2831
|
+
|
|
2832
|
+
### Cell-Cell Communication Interaction (Box Plot)
|
|
2833
|
+
|
|
2834
|
+
```toml
|
|
2835
|
+
[CellCellCommunicationPlots.envs.cases."Cell-Cell Communication Interaction (Box Plot)"]
|
|
2836
|
+
plot_type = "box"
|
|
2837
|
+
x_text_angle = 90
|
|
2838
|
+
method = "interaction"
|
|
2839
|
+
```
|
|
2840
|
+
|
|
2841
|
+
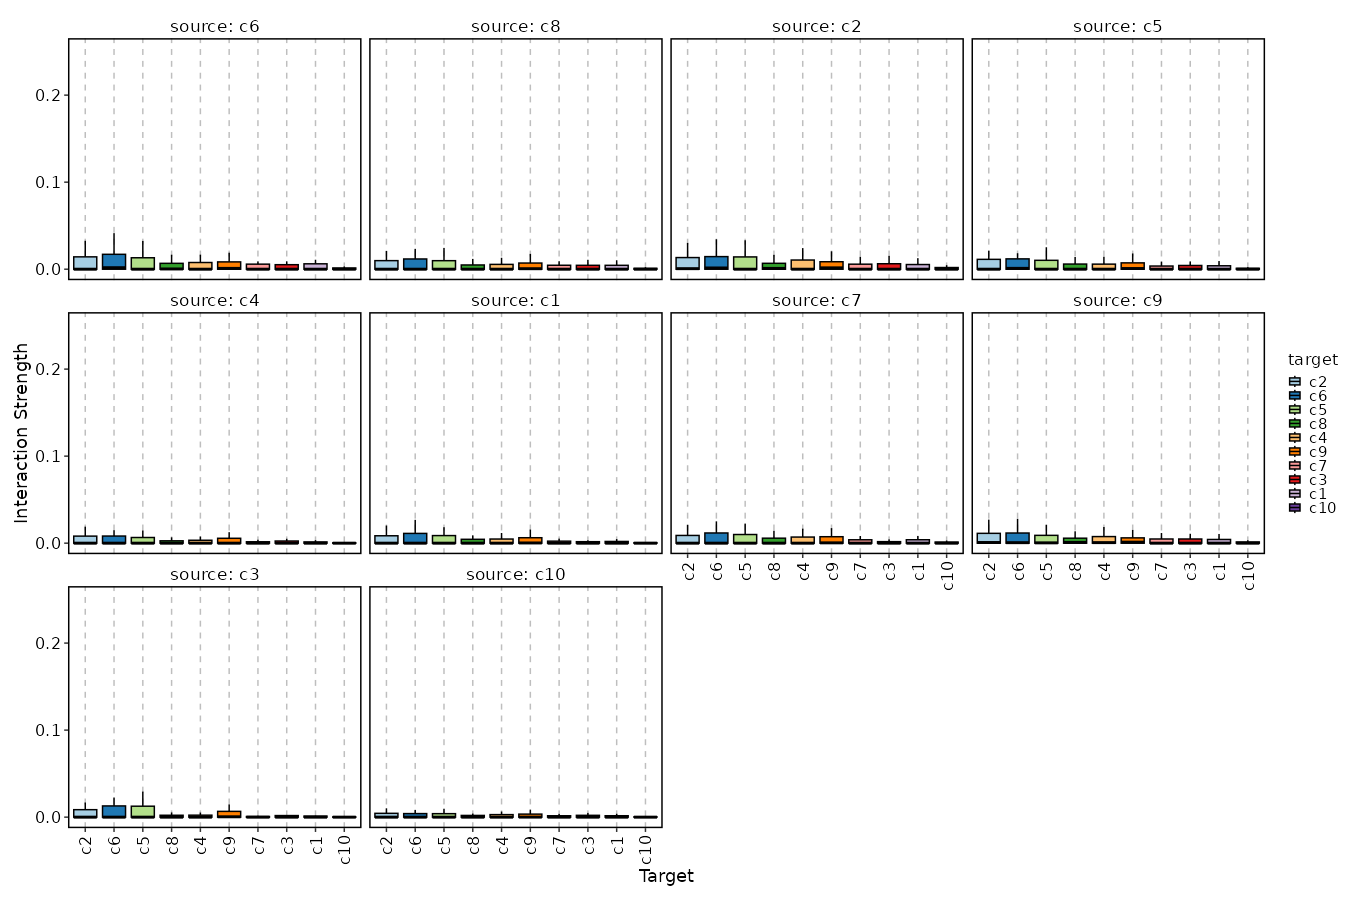{: width="80%"}
|
|
2842
|
+
|
|
2504
2843
|
Input:
|
|
2505
2844
|
cccfile: The output file from `CellCellCommunication`
|
|
2506
2845
|
|
|
@@ -2524,6 +2863,10 @@ class CellCellCommunicationPlots(Proc):
|
|
|
2524
2863
|
cases (type=json): The cases for the plots.
|
|
2525
2864
|
The keys are the names of the cases and the values are the arguments for
|
|
2526
2865
|
the plots. The arguments include the ones inherited from `envs`.
|
|
2866
|
+
You can have a special `plot_type` `"table"` to generate a table for the
|
|
2867
|
+
ccc data to save as a text file and show in the report.
|
|
2868
|
+
If no cases are given, a default case will be used, with the
|
|
2869
|
+
key `Cell-Cell Communication`.
|
|
2527
2870
|
<more>: Other arguments passed to
|
|
2528
2871
|
[scplotter::CCCPlot](https://pwwang.github.io/scplotter/reference/CCCPlot.html)
|
|
2529
2872
|
""" # noqa: E501
|
|
@@ -2569,6 +2912,10 @@ class ScVelo(Proc):
|
|
|
2569
2912
|
ncores (type=int): Number of cores to use.
|
|
2570
2913
|
group_by: The column name in metadata to group the cells.
|
|
2571
2914
|
Typically, this column should be the cluster id.
|
|
2915
|
+
If provided input is a Seurat object, the default identity will be used by
|
|
2916
|
+
default. Otherwise, it is recommended to provide this parameter.
|
|
2917
|
+
"seurat_clusters" will be used with a warning if the input is in AnnData
|
|
2918
|
+
format and this parameter is not provided.
|
|
2572
2919
|
mode (type=list): The mode to use for the velocity analysis.
|
|
2573
2920
|
It should be a subset of `['deterministic', 'stochastic', 'dynamical']`,
|
|
2574
2921
|
meaning that we can perform the velocity analysis in multiple modes.
|
|
@@ -2607,7 +2954,7 @@ class ScVelo(Proc):
|
|
|
2607
2954
|
lang = config.lang.python
|
|
2608
2955
|
envs = {
|
|
2609
2956
|
"ncores": config.misc.ncores,
|
|
2610
|
-
"group_by":
|
|
2957
|
+
"group_by": None,
|
|
2611
2958
|
"mode": ["deterministic", "stochastic", "dynamical"],
|
|
2612
2959
|
"fitting_by": "stochastic",
|
|
2613
2960
|
"min_shared_counts": 30,
|
|
@@ -2645,6 +2992,7 @@ class Slingshot(Proc):
|
|
|
2645
2992
|
Envs:
|
|
2646
2993
|
group_by: The column name in metadata to group the cells.
|
|
2647
2994
|
Typically, this column should be the cluster id.
|
|
2995
|
+
Default is the default identity of the seurat object.
|
|
2648
2996
|
reduction: The nonlinear reduction to use for the trajectory analysis.
|
|
2649
2997
|
dims (type=auto): The dimensions to use for the analysis.
|
|
2650
2998
|
A list or a string with comma separated values.
|
|
@@ -2661,7 +3009,7 @@ class Slingshot(Proc):
|
|
|
2661
3009
|
output = "outfile:file:{{in.sobjfile | stem}}.qs"
|
|
2662
3010
|
lang = config.lang.rscript
|
|
2663
3011
|
envs = {
|
|
2664
|
-
"group_by":
|
|
3012
|
+
"group_by": None,
|
|
2665
3013
|
"reduction": None,
|
|
2666
3014
|
"dims": [1, 2],
|
|
2667
3015
|
"start": None,
|
|
@@ -2706,6 +3054,7 @@ class PseudoBulkDEG(Proc):
|
|
|
2706
3054
|
analysis.
|
|
2707
3055
|
|
|
2708
3056
|
Envs:
|
|
3057
|
+
ncores (type=int): Number of cores to use for parallelization.
|
|
2709
3058
|
mutaters (type=json): Mutaters to mutate the metadata of the
|
|
2710
3059
|
seurat object. Keys are the new column names and values are the
|
|
2711
3060
|
expressions to mutate the columns. These new columns can be
|
|
@@ -2715,6 +3064,9 @@ class PseudoBulkDEG(Proc):
|
|
|
2715
3064
|
each: The column name in metadata to separate the cells into different cases.
|
|
2716
3065
|
When specified, the case will be expanded to multiple cases for
|
|
2717
3066
|
each value in the column.
|
|
3067
|
+
cache (type=auto): Where to cache the results.
|
|
3068
|
+
If `True`, cache to `outdir` of the job. If `False`, don't cache.
|
|
3069
|
+
Otherwise, specify the directory to cache to.
|
|
2718
3070
|
subset: An expression in string to subset the cells.
|
|
2719
3071
|
aggregate_by: The column names in metadata to aggregate the cells.
|
|
2720
3072
|
layer: The layer to pull and aggregate the data.
|
|
@@ -2728,11 +3080,18 @@ class PseudoBulkDEG(Proc):
|
|
|
2728
3080
|
paired_by: The column name in metadata to mark the paired samples.
|
|
2729
3081
|
For example, subject. If specified, the paired test will be performed.
|
|
2730
3082
|
dbs (list): The databases to use for enrichment analysis.
|
|
2731
|
-
|
|
2732
|
-
|
|
2733
|
-
|
|
2734
|
-
|
|
2735
|
-
|
|
3083
|
+
You can use built-in dbs in `enrichit`, or provide your own gmt files.
|
|
3084
|
+
See also <https://pwwang.github.io/enrichit/reference/FetchGMT.html>.
|
|
3085
|
+
The built-in dbs include:
|
|
3086
|
+
* "BioCarta" or "BioCarta_2016"
|
|
3087
|
+
* "GO_Biological_Process" or "GO_Biological_Process_2025"
|
|
3088
|
+
* "GO_Cellular_Component" or "GO_Cellular_Component_2025"
|
|
3089
|
+
* "GO_Molecular_Function" or "GO_Molecular_Function_2025"
|
|
3090
|
+
* "KEGG", "KEGG_Human", "KEGG_2021", or "KEGG_2021_Human"
|
|
3091
|
+
* "Hallmark", "MSigDB_Hallmark", or "MSigDB_Hallmark_2020"
|
|
3092
|
+
* "Reactome", "Reactome_Pathways", or "Reactome_Pathways_2024"
|
|
3093
|
+
* "WikiPathways", "WikiPathways_2024", "WikiPathways_Human", or "WikiPathways_2024_Human"
|
|
3094
|
+
You can also fetch more dbs from <https://maayanlab.cloud/Enrichr/#libraries>.
|
|
2736
3095
|
sigmarkers: An expression passed to `dplyr::filter()` to filter the
|
|
2737
3096
|
significant markers for enrichment analysis.
|
|
2738
3097
|
The default is `p_val_adj < 0.05`.
|
|
@@ -2743,7 +3102,7 @@ class PseudoBulkDEG(Proc):
|
|
|
2743
3102
|
enrich_style (choice): The style of the enrichment analysis.
|
|
2744
3103
|
- enrichr: Use `enrichr`-style for the enrichment analysis.
|
|
2745
3104
|
- clusterProfiler: Use `clusterProfiler`-style for the enrichment analysis.
|
|
2746
|
-
allmarker_plots_defaults (ns): Default options for the plots for all markers when `
|
|
3105
|
+
allmarker_plots_defaults (ns): Default options for the plots for all markers when `ident_1` is not specified.
|
|
2747
3106
|
- plot_type: The type of the plot.
|
|
2748
3107
|
See <https://pwwang.github.io/scplotter/reference/FeatureStatPlot.html>.
|
|
2749
3108
|
Available types are `violin`, `box`, `bar`, `ridge`, `dim`, `heatmap` and `dot`.
|
|
@@ -2802,7 +3161,7 @@ class PseudoBulkDEG(Proc):
|
|
|
2802
3161
|
The keys are the names of the cases and the values are the dicts inherited from `enrich_plots_defaults`.
|
|
2803
3162
|
The cases under `envs.cases` can inherit this options.
|
|
2804
3163
|
overlaps_defaults (ns): Default options for investigating the overlapping of significant markers between different cases or comparisons.
|
|
2805
|
-
This means either `
|
|
3164
|
+
This means either `ident_1` should be empty, so that they can be expanded to multiple comparisons.
|
|
2806
3165
|
- sigmarkers: The expression to filter the significant markers for each case.
|
|
2807
3166
|
If not provided, `envs.sigmarkers` will be used.
|
|
2808
3167
|
- plot_type (choice): The type of the plot to generate for the overlaps.
|
|
@@ -2821,8 +3180,8 @@ class PseudoBulkDEG(Proc):
|
|
|
2821
3180
|
overlaps (type=json): Cases for investigating the overlapping of significant markers between different cases or comparisons.
|
|
2822
3181
|
The keys are the names of the cases and the values are the dicts inherited from `overlaps_defaults`.
|
|
2823
3182
|
There are two situations that we can perform overlaps:
|
|
2824
|
-
1. If `
|
|
2825
|
-
2. If `each` is specified, the overlaps can be performed between different cases, where in each case, `
|
|
3183
|
+
1. If `ident_1` is not specified, the overlaps can be performed between different comparisons.
|
|
3184
|
+
2. If `each` is specified, the overlaps can be performed between different cases, where in each case, `ident_1` must be specified.
|
|
2826
3185
|
tool (choice): The method to use for the differential expression analysis.
|
|
2827
3186
|
- DESeq2: Use DESeq2 for the analysis.
|
|
2828
3187
|
- edgeR: Use edgeR for the analysis.
|
|
@@ -2844,12 +3203,14 @@ class PseudoBulkDEG(Proc):
|
|
|
2844
3203
|
lang = config.lang.rscript
|
|
2845
3204
|
script = "file://../scripts/scrna/PseudoBulkDEG.R"
|
|
2846
3205
|
envs = {
|
|
3206
|
+
"ncores": config.misc.ncores,
|
|
2847
3207
|
"mutaters": {},
|
|
3208
|
+
"cache": config.path.tmpdir,
|
|
2848
3209
|
"each": None,
|
|
2849
3210
|
"subset": None,
|
|
2850
3211
|
"aggregate_by": None,
|
|
2851
3212
|
"layer": "counts",
|
|
2852
|
-
"assay":
|
|
3213
|
+
"assay": None,
|
|
2853
3214
|
"error": False,
|
|
2854
3215
|
"group_by": None,
|
|
2855
3216
|
"ident_1": None,
|
|
@@ -2906,3 +3267,92 @@ class PseudoBulkDEG(Proc):
|
|
|
2906
3267
|
"report": "file://../reports/common.svelte",
|
|
2907
3268
|
"report_paging": 8,
|
|
2908
3269
|
}
|
|
3270
|
+
|
|
3271
|
+
|
|
3272
|
+
class CellSNPLite(Proc):
|
|
3273
|
+
"""Genotyping bi-allelic SNPs on single cells using cellsnp-lite.
|
|
3274
|
+
|
|
3275
|
+
The output from cellsnp-lite can be directly used for downstream analysis such as -
|
|
3276
|
+
|
|
3277
|
+
* Donor deconvolution in multiplexed single-cell RNA-seq data (e.g., with vireo).
|
|
3278
|
+
* Allele-specific CNV analysis in single-cell or spatial transcriptomics data (e.g., with Numbat, XClone, or CalicoST).
|
|
3279
|
+
* Clonal substructure discovery using single cell mitochondrial variants (e.g., with MQuad).
|
|
3280
|
+
|
|
3281
|
+
Here we only support model `1a`/`2a` in cellsnp-lite, which is designed for a single bam file as input.
|
|
3282
|
+
For model `1b`/`2b`, which is designed for multiple bam files as input (e.g., one per cell), you can still
|
|
3283
|
+
run with this process, but only one bam file is allowed.
|
|
3284
|
+
|
|
3285
|
+
See <https://github.com/single-cell-genetics/cellsnp-lite> for more details about cellsnp-lite.
|
|
3286
|
+
|
|
3287
|
+
Input:
|
|
3288
|
+
crdir: The cellranger output directory or the directory containing
|
|
3289
|
+
the bam file and barcode file.
|
|
3290
|
+
It should contain the `outs/possorted_genome_bam.bam` file and
|
|
3291
|
+
the `outs/filtered_feature_bc_matrix/barcodes.tsv.gz` file.
|
|
3292
|
+
|
|
3293
|
+
Output:
|
|
3294
|
+
outdir: The output directory for cellsnp-lite results.
|
|
3295
|
+
|
|
3296
|
+
Envs:
|
|
3297
|
+
ncores (type=int): The number of cores to use.
|
|
3298
|
+
Will pass to `-p` option in cellsnp-lite.
|
|
3299
|
+
regionsVCF: A vcf file listing all candidate SNPs, for fetch each variants.
|
|
3300
|
+
genotype (flag): Whether to perform genotyping.
|
|
3301
|
+
If `False`, only the allele counts will be computed.
|
|
3302
|
+
gzip (flag): Whether to gzip the output files.
|
|
3303
|
+
<more>: Other arguments passed to cellsnp-lite.
|
|
3304
|
+
See <https://cellsnp-lite.readthedocs.io/en/latest/main/manual.html#full-parameters> for more details.
|
|
3305
|
+
""" # noqa: E501
|
|
3306
|
+
|
|
3307
|
+
input = "crdir:dir"
|
|
3308
|
+
output = """
|
|
3309
|
+
outdir:dir:
|
|
3310
|
+
{%- if basename(in.crdir) == 'outs' -%}
|
|
3311
|
+
{{in.crdir | dirname | basename}}
|
|
3312
|
+
{%- else -%}
|
|
3313
|
+
{{in.crdir | basename}}
|
|
3314
|
+
{%- endif -%}
|
|
3315
|
+
.cellsnp
|
|
3316
|
+
""" # noqa: E501
|
|
3317
|
+
lang = config.lang.python
|
|
3318
|
+
envs = {
|
|
3319
|
+
"cellsnp_lite": config.exe.cellsnp_lite,
|
|
3320
|
+
"ncores": config.misc.ncores,
|
|
3321
|
+
"regionsVCF": None,
|
|
3322
|
+
"genotype": False,
|
|
3323
|
+
"gzip": True,
|
|
3324
|
+
}
|
|
3325
|
+
script = "file://../scripts/scrna/CellSNPLite.py"
|
|
3326
|
+
|
|
3327
|
+
|
|
3328
|
+
class MQuad(Proc):
|
|
3329
|
+
"""Clonal substructure discovery using single cell mitochondrial variants with MQuad.
|
|
3330
|
+
|
|
3331
|
+
MQuad uses a Mixture Model for Mitochondrial Mutation detection in single-cell omics data.
|
|
3332
|
+
|
|
3333
|
+
MQuad is a tool that detects mitochondrial mutations that are informative for clonal substructure inference. It uses a binomial mixture model to assess the heteroplasmy of mtDNA variants among background noise.
|
|
3334
|
+
|
|
3335
|
+
Input:
|
|
3336
|
+
cellsnpout: The output directory from `CellSNPLite` process, which should contain
|
|
3337
|
+
AD and DP sparse matrices (.mtx) or the vcf file.
|
|
3338
|
+
|
|
3339
|
+
Output:
|
|
3340
|
+
outdir: The output directory for MQuad results.
|
|
3341
|
+
|
|
3342
|
+
Envs:
|
|
3343
|
+
ncores (type=int): The number of cores to use.
|
|
3344
|
+
It will be passed to `--nproc` option in MQuad.
|
|
3345
|
+
seed (type=int): The seed for the random number generator.
|
|
3346
|
+
It will be passed to `--randSeed` option in MQuad.
|
|
3347
|
+
<more>: Other arguments passed to MQuad.
|
|
3348
|
+
See <https://github.com/single-cell-genetics/MQuad/blob/main/mquad/mquad_CLI.py> for more details.
|
|
3349
|
+
""" # noqa: E501
|
|
3350
|
+
input = "cellsnpout:dir"
|
|
3351
|
+
output = "outdir:dir:{{in.cellsnpout | stem}}.mquad"
|
|
3352
|
+
lang = config.lang.python
|
|
3353
|
+
envs = {
|
|
3354
|
+
"mquad": config.exe.mquad,
|
|
3355
|
+
"ncores": config.misc.ncores,
|
|
3356
|
+
"seed": 8525,
|
|
3357
|
+
}
|
|
3358
|
+
script = "file://../scripts/scrna/MQuad.py"
|