@arcgis/core 5.1.0-next.18 → 5.1.0-next.19
This diff represents the content of publicly available package versions that have been released to one of the supported registries. The information contained in this diff is provided for informational purposes only and reflects changes between package versions as they appear in their respective public registries.
- package/Camera.d.ts +1 -1
- package/Ground.d.ts +7 -7
- package/PopupTemplate.d.ts +6 -6
- package/WebScene.d.ts +1 -1
- package/analysis/AreaMeasurementAnalysis.d.ts +1 -1
- package/analysis/DirectLineMeasurementAnalysis.d.ts +1 -1
- package/analysis/LengthDimension.d.ts +4 -4
- package/analysis/ShadowCastAnalysis.d.ts +3 -3
- package/analysis/SliceAnalysis.d.ts +1 -1
- package/analysis/SlicePlane.d.ts +1 -1
- package/analysis/VolumeMeasurement/VolumeMeasurementCutFillOptions.d.ts +1 -1
- package/analysis/VolumeMeasurementAnalysis.d.ts +1 -1
- package/applications/Components/applySetUtils.d.ts +1 -1
- package/applications/WebEditor/geometryUtils.d.ts +26 -0
- package/applications/WebEditor/geometryUtils.js +2 -0
- package/assets/esri/core/workers/RemoteClient.js +1 -1
- package/assets/esri/core/workers/chunks/045e4e520d6dffe06ba7.js +1 -0
- package/assets/esri/core/workers/chunks/05d6cd51ca970705e46a.js +1 -0
- package/assets/esri/core/workers/chunks/{fd125618f513bc2f5206.js → 08d73543c713984f6ecf.js} +1 -1
- package/assets/esri/core/workers/chunks/{982e709d2cef971ecd82.js → 0d9d33f29124d464a4cb.js} +1 -1
- package/assets/esri/core/workers/chunks/{07317f6b57c1314db442.js → 0e1d559d05229ef92e35.js} +1 -1
- package/assets/esri/core/workers/chunks/{2762149a922275136171.js → 112227b862b935123ddf.js} +2 -2
- package/assets/esri/core/workers/chunks/128cdb4a02549abc68b5.js +1 -0
- package/assets/esri/core/workers/chunks/1336f685bae5f1251558.js +1 -0
- package/assets/esri/core/workers/chunks/{b71e4f48377fefe2537d.js → 15d46482ec096e3ce161.js} +1 -1
- package/assets/esri/core/workers/chunks/1794db88a2006711eff3.js +1 -0
- package/assets/esri/core/workers/chunks/{a327f36561f093dc0fab.js → 19fcc74d34cbbaa56a41.js} +1 -1
- package/assets/esri/core/workers/chunks/{d0d1378e714ff0e43e26.js → 1cfa8d404d42b9eccf78.js} +1 -1
- package/assets/esri/core/workers/chunks/1e916e552ce7d53692d2.js +1 -0
- package/assets/esri/core/workers/chunks/2011da6dfc4bb89829c6.js +1 -0
- package/assets/esri/core/workers/chunks/{1e29a114c1cfe21121c4.js → 203ef5459fc5dde12851.js} +1 -1
- package/assets/esri/core/workers/chunks/215c54520d0da638fe57.js +1 -0
- package/assets/esri/core/workers/chunks/22045f85e503ae0ec8f4.js +1 -0
- package/assets/esri/core/workers/chunks/{78fc7ef00cc4931ef47d.js → 2351b713ba3d05de0728.js} +1 -1
- package/assets/esri/core/workers/chunks/{0a4ebb5dca630a4ab0dd.js → 236f8137ae505c8f0764.js} +1 -1
- package/assets/esri/core/workers/chunks/249630af2fb01257eb75.js +1 -0
- package/assets/esri/core/workers/chunks/{1f30558e3ad6ac68bdb8.js → 25d34552bfb255af9467.js} +1 -1
- package/assets/esri/core/workers/chunks/{7cd4280d24b24045bd7e.js → 27e14277128446e76b45.js} +1 -1
- package/assets/esri/core/workers/chunks/3214763f268622f09986.js +1 -0
- package/assets/esri/core/workers/chunks/32a1ccc145c9f6091e13.js +1 -0
- package/assets/esri/core/workers/chunks/34691b147318b2cfdd45.js +1 -0
- package/assets/esri/core/workers/chunks/{18c05353d6d8950d1491.js → 36215b2c0b1020743458.js} +1 -1
- package/assets/esri/core/workers/chunks/3d3b1ce112be6ea31d93.js +1 -0
- package/assets/esri/core/workers/chunks/{2badadf8032e166b34ec.js → 3f3c63420644f9522ab1.js} +1 -1
- package/assets/esri/core/workers/chunks/41108f58f0f439ebba3f.js +1 -0
- package/assets/esri/core/workers/chunks/{bc9997d15ec0a86793c6.js → 415957a42e45eb21aa84.js} +1 -1
- package/assets/esri/core/workers/chunks/43c797bfc2191b51875b.js +1 -0
- package/assets/esri/core/workers/chunks/460a82f3e4838b13e3b4.js +1 -0
- package/assets/esri/core/workers/chunks/4ad6f80488aa218b95e3.js +1 -0
- package/assets/esri/core/workers/chunks/4e9863a11d09900baf30.js +1 -0
- package/assets/esri/core/workers/chunks/4fe210314813ea1f7a26.js +1 -0
- package/assets/esri/core/workers/chunks/5028de543cc1b8e60e65.js +1 -0
- package/assets/esri/core/workers/chunks/52705ccbb452a3edb064.js +1 -0
- package/assets/esri/core/workers/chunks/{17b39b88547968048113.js → 531c55f3b8e708ccf767.js} +1 -1
- package/assets/esri/core/workers/chunks/{72acfb74fd9ab9bae923.js → 53e348f5585fa8c53fe8.js} +2 -2
- package/assets/esri/core/workers/chunks/54c545f44b7ce21fb604.js +1 -0
- package/assets/esri/core/workers/chunks/558e9fed2e58cbbf9947.js +1 -0
- package/assets/esri/core/workers/chunks/{b50d2d3379654de1f2f3.js → 58134617fb7530836b81.js} +1 -1
- package/assets/esri/core/workers/chunks/58c4be467a922fe37f01.js +1 -0
- package/assets/esri/core/workers/chunks/{ec4e2f18453e1cb68fed.js → 5f10f39835cb40179000.js} +1 -1
- package/assets/esri/core/workers/chunks/{7b1964255722e756eba3.js → 5f9eeab833a6c08c76c4.js} +1 -1
- package/assets/esri/core/workers/chunks/651b46aeabf22ff53a38.js +1 -0
- package/assets/esri/core/workers/chunks/65f86594c42ff82095fe.js +1 -0
- package/assets/esri/core/workers/chunks/{90316fb569389d48920f.js → 666f201d222c50ab8428.js} +1 -1
- package/assets/esri/core/workers/chunks/677f5e444ff588ab670f.js +1 -0
- package/assets/esri/core/workers/chunks/{323f6077a659416c4cee.js → 6a9a96aa811c1d3b6edb.js} +1 -1
- package/assets/esri/core/workers/chunks/6bf7d8de86b9eb76f920.js +1 -0
- package/assets/esri/core/workers/chunks/6c0b7890c8eec7febe28.js +1 -0
- package/assets/esri/core/workers/chunks/{25c189e894927099c239.js → 6c85396c90941a042c33.js} +1 -1
- package/assets/esri/core/workers/chunks/{18b0776aef1536867ab8.js → 6f337c3ccd84d90a35e5.js} +1 -1
- package/assets/esri/core/workers/chunks/711bec78dc00fad0f78d.js +1 -0
- package/assets/esri/core/workers/chunks/7382c9882525101eddad.js +1 -0
- package/assets/esri/core/workers/chunks/778ab9e4c3928b0d7d74.js +1 -0
- package/assets/esri/core/workers/chunks/{a3e8b7185d63a0f85931.js → 79c69ae86a1f4a56f7c7.js} +1 -1
- package/assets/esri/core/workers/chunks/{0420fb4b3592f8a26b1f.js → 7d2b1e5402a88b6bee85.js} +1 -1
- package/assets/esri/core/workers/chunks/7ec83fc059325e207825.js +1 -0
- package/assets/esri/core/workers/chunks/7f385e9c88df3395e678.js +1 -0
- package/assets/esri/core/workers/chunks/{66ed527cd8ad11d008be.js → 80d51d58db09b9f96cb5.js} +1 -1
- package/assets/esri/core/workers/chunks/81a45d7e9dadf678b584.js +1 -0
- package/assets/esri/core/workers/chunks/81c758bdc07ed9d9a132.js +1 -0
- package/assets/esri/core/workers/chunks/{8670d9d11950f3c61b79.js → 83711695e16912e9b9c5.js} +1 -1
- package/assets/esri/core/workers/chunks/8c3bf66f8543cedc72ef.js +1 -0
- package/assets/esri/core/workers/chunks/8cade3af17a8bb6d4e37.js +1 -0
- package/assets/esri/core/workers/chunks/920d6330df72e2f01d19.js +1 -0
- package/assets/esri/core/workers/chunks/9dc7abca1d1eb9ba5b58.js +1 -0
- package/assets/esri/core/workers/chunks/9e054c264b17f04b7efa.js +1 -0
- package/assets/esri/core/workers/chunks/a143a6f8e2f21548b244.js +1 -0
- package/assets/esri/core/workers/chunks/a48a6232fa33084cb686.js +1 -0
- package/assets/esri/core/workers/chunks/a4947d5d2fa6b7bd399b.js +1 -0
- package/assets/esri/core/workers/chunks/a49f1172b17c14527acf.js +1 -0
- package/assets/esri/core/workers/chunks/{6af14a0217077d9ab47f.js → aaf3ed508d30ed583915.js} +1 -1
- package/assets/esri/core/workers/chunks/{ab9156be67332338bbe4.js → aceec85ce64a3e6d8761.js} +1 -1
- package/assets/esri/core/workers/chunks/b10b3eb8c2ed9be14ab2.js +1 -0
- package/assets/esri/core/workers/chunks/b315b3771d0d19681aa5.js +1 -0
- package/assets/esri/core/workers/chunks/{91858b02da40ff251ab2.js → b397a9f87082705301a4.js} +2 -2
- package/assets/esri/core/workers/chunks/b40e4ed067da65c3d7ce.js +1 -0
- package/assets/esri/core/workers/chunks/b4b16914950792c46bd3.js +1 -0
- package/assets/esri/core/workers/chunks/{360b3499e2a671c309ce.js → b6969a42602517a6ef1c.js} +1 -1
- package/assets/esri/core/workers/chunks/baad696d84ab78b3d00e.js +2 -0
- package/assets/esri/core/workers/chunks/{2e7d4a437717606bc39c.js → bc2dcbdc414d157ab727.js} +1 -1
- package/assets/esri/core/workers/chunks/{1aa2187597f7c4adb67f.js → bcb254cb7297fec88679.js} +1 -1
- package/assets/esri/core/workers/chunks/{2d1a772abd730b61854f.js → bd2125e0a68378533641.js} +1 -1
- package/assets/esri/core/workers/chunks/{6bd910e0480451a8d6aa.js → bde2c3199f667b63dbe8.js} +1 -1
- package/assets/esri/core/workers/chunks/bf595eb10f99b8a96baa.js +1 -0
- package/assets/esri/core/workers/chunks/c0b6706f86665cec85f8.js +1 -0
- package/assets/esri/core/workers/chunks/{12fd2e26e949d90abfbd.js → c3c6d337ff53e5d921e8.js} +1 -1
- package/assets/esri/core/workers/chunks/c461c19e4fdbdd2e94d4.js +1 -0
- package/assets/esri/core/workers/chunks/{4214f46bee613dea72f3.js → c66aa57b6360963bd938.js} +1 -1
- package/assets/esri/core/workers/chunks/c873ac660e7d5dc88781.js +1 -0
- package/assets/esri/core/workers/chunks/c99f36159b5ed6f9267e.js +1 -0
- package/assets/esri/core/workers/chunks/cb5f4820277f3fc7ff2f.js +1 -0
- package/assets/esri/core/workers/chunks/cbcb3530375e280bfeac.js +1 -0
- package/assets/esri/core/workers/chunks/cf4202ad468501ef24cf.js +1 -0
- package/assets/esri/core/workers/chunks/d03d50f3247327257d8b.js +1 -0
- package/assets/esri/core/workers/chunks/{a5af20f3d484d2d3bafe.js → d2017b0b27b9e4ada922.js} +1 -1
- package/assets/esri/core/workers/chunks/d2d9c1f32a75befe168b.js +1 -0
- package/assets/esri/core/workers/chunks/{5c12a9b0db317620dce2.js → d39f5d57f7e35c00ca16.js} +1 -1
- package/assets/esri/core/workers/chunks/d5b4487a983921572e58.js +1 -0
- package/assets/esri/core/workers/chunks/d78b2f85ec9212a973e8.js +1 -0
- package/assets/esri/core/workers/chunks/d9dc8d9fc8ab2706f96b.js +1 -0
- package/assets/esri/core/workers/chunks/{09cf8aed89a1ea1f8b28.js → da42da04a9df651b06cc.js} +1 -1
- package/assets/esri/core/workers/chunks/{a82587f69c4bbcac7e0b.js → dc7df2072c0ebed5602c.js} +1 -1
- package/assets/esri/core/workers/chunks/dd24cddc406f610d2483.js +1 -0
- package/assets/esri/core/workers/chunks/dd3789e71270a4640551.js +1 -0
- package/assets/esri/core/workers/chunks/de5719ef663224860af5.js +1 -0
- package/assets/esri/core/workers/chunks/de6438fdbe38d32c4ad5.js +1 -0
- package/assets/esri/core/workers/chunks/ded71a656e2626a411f9.js +1 -0
- package/assets/esri/core/workers/chunks/df1fa0f7e8f7e2bcc2e6.js +1 -0
- package/assets/esri/core/workers/chunks/{b705f837caa76cee81fc.js → e09722903e63f6cc2540.js} +1 -1
- package/assets/esri/core/workers/chunks/e2e03622936d2b35afc0.js +1 -0
- package/assets/esri/core/workers/chunks/e33f5780fb45ac7ca889.js +1 -0
- package/assets/esri/core/workers/chunks/{eb9e913fe0dfcc71cf92.js → e4611ebd7dba7692a914.js} +1 -1
- package/assets/esri/core/workers/chunks/e52793690dff1a199647.js +1 -0
- package/assets/esri/core/workers/chunks/{c13efb74aa4602f6a1ee.js → e56a10a475ce128b5fce.js} +1 -1
- package/assets/esri/core/workers/chunks/{9531f17cecd50431cce2.js → e8ae71e482b8d5f54a72.js} +1 -1
- package/assets/esri/core/workers/chunks/ea633a6a3b9ea8ce965d.js +1 -0
- package/assets/esri/core/workers/chunks/eae1c098c16e2faaf90d.js +1 -0
- package/assets/esri/core/workers/chunks/{f7e25a85a79c4e3c1c9f.js → ec63c0fa21cd3c872633.js} +1 -1
- package/assets/esri/core/workers/chunks/ece363681bb09072f379.js +1 -0
- package/assets/esri/core/workers/chunks/edaae0fc63d16b0f675d.js +2 -0
- package/assets/esri/core/workers/chunks/{8650fbe1db55b7280c00.js → ef4237dc7b67c9039826.js} +1 -1
- package/assets/esri/core/workers/chunks/ef9106ee818ec732b670.js +1 -0
- package/assets/esri/core/workers/chunks/f121a0bf33c03abfa0b6.js +1 -0
- package/assets/esri/core/workers/chunks/{a2f38e86acf45272dbc2.js → f7506c9d57b2ae0c5fd3.js} +1 -1
- package/assets/esri/core/workers/chunks/fab7e3e07d700d7bb651.js +1 -0
- package/assets/esri/core/workers/chunks/fcc8d0b60f7c2397e550.js +1 -0
- package/assets/esri/core/workers/chunks/fe5aec7e2da4465422b4.js +1 -0
- package/assets/esri/themes/base/widgets/_BasemapGallery.scss +1 -0
- package/assets/esri/themes/base/widgets/_Editor.scss +1 -0
- package/assets/esri/themes/dark/main.css +1 -1
- package/assets/esri/themes/light/main.css +1 -1
- package/assets/esri/themes/light/view.css +1 -1
- package/chunks/Envelope.js +1 -1
- package/chunks/GeodeticDistanceCalculator-Ce-woMPw.js +1 -1
- package/chunks/GeodeticUtils.js +1 -1
- package/chunks/Geometry.js +1 -1
- package/chunks/MultiPathImpl.js +1 -1
- package/chunks/OperatorGeodesicBuffer.js +1 -1
- package/chunks/OperatorGeodeticArea.js +1 -1
- package/chunks/OperatorGeodeticDensifyByLength.js +1 -1
- package/chunks/OperatorGeodeticLength.js +1 -1
- package/chunks/OperatorIntegrate.js +2 -0
- package/chunks/OperatorMultiPartToSinglePart.js +1 -1
- package/chunks/OperatorProximityGeodesic.js +1 -1
- package/chunks/OperatorShapePreservingLength.js +1 -1
- package/chunks/OperatorShapePreservingProject.js +1 -1
- package/chunks/Point2D.js +1 -1
- package/chunks/SpatialReference.js +1 -1
- package/chunks/containsOperator.js +1 -1
- package/chunks/disjointOperator.js +1 -1
- package/chunks/relateOperator.js +1 -1
- package/config.js +1 -1
- package/core/has.js +1 -1
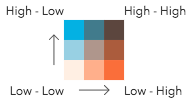
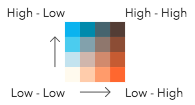
- package/editing/sharedTemplates/SharedTemplateMetadata.d.ts +0 -31
- package/{layers/graphics/editingSupport.d.ts → editing/types.d.ts} +8 -8
- package/editing/types.js +2 -0
- package/effects/FocusAreas.d.ts +1 -1
- package/form/elements/FieldElement.d.ts +1 -1
- package/form/elements/GroupElement.d.ts +1 -1
- package/form/elements/TextElement.d.ts +1 -1
- package/form/elements/inputs/ComboBoxInput.d.ts +1 -1
- package/form/elements/inputs/RadioButtonsInput.d.ts +1 -1
- package/form/elements/inputs/SwitchInput.d.ts +1 -1
- package/geometry/Mesh.d.ts +7 -7
- package/geometry/operators/alphaShapeOperator.d.ts +1 -1
- package/geometry/operators/areaOperator.d.ts +1 -1
- package/geometry/operators/bufferOperator.d.ts +1 -1
- package/geometry/operators/centroidOperator.d.ts +1 -1
- package/geometry/operators/clipOperator.d.ts +1 -1
- package/geometry/operators/containsOperator.d.ts +1 -1
- package/geometry/operators/convexHullOperator.d.ts +1 -1
- package/geometry/operators/crossesOperator.d.ts +1 -1
- package/geometry/operators/cutOperator.d.ts +1 -1
- package/geometry/operators/densifyOperator.d.ts +1 -1
- package/geometry/operators/differenceOperator.d.ts +1 -1
- package/geometry/operators/disjointOperator.d.ts +1 -1
- package/geometry/operators/distanceOperator.d.ts +1 -1
- package/geometry/operators/extendOperator.js +1 -1
- package/geometry/operators/generalizeOperator.d.ts +1 -1
- package/geometry/operators/geodesicProximityOperator.d.ts +1 -1
- package/geometry/operators/geodeticDistanceOperator.d.ts +1 -1
- package/geometry/operators/geodeticUtilsOperator.d.ts +2 -2
- package/geometry/operators/graphicBufferOperator.d.ts +1 -1
- package/geometry/operators/gx/operatorAlphaShape.js +1 -1
- package/geometry/operators/gx/operatorAutoComplete.js +1 -1
- package/geometry/operators/gx/operatorConvexHull.js +1 -1
- package/geometry/operators/gx/operatorIntegrate.js +1 -1
- package/geometry/operators/gx/operatorIntersection.js +1 -1
- package/geometry/operators/gx/operatorLabelPoint.js +1 -1
- package/geometry/operators/gx/operatorMinimumBoundingCircle.js +1 -1
- package/geometry/operators/gx/operatorPolygonOverlay.js +1 -1
- package/geometry/operators/gx/operatorSymmetricDifference.js +1 -1
- package/geometry/operators/intersectionOperator.d.ts +1 -1
- package/geometry/operators/intersectsOperator.d.ts +1 -1
- package/geometry/operators/isNearOperator.d.ts +1 -1
- package/geometry/operators/json/containsOperator.js +1 -1
- package/geometry/operators/json/disjointOperator.js +1 -1
- package/geometry/operators/lengthOperator.d.ts +1 -1
- package/geometry/operators/locateBetweenOperator.d.ts +1 -1
- package/geometry/operators/multiPartToSinglePartOperator.d.ts +1 -1
- package/geometry/operators/offsetOperator.d.ts +5 -5
- package/geometry/operators/overlapsOperator.d.ts +1 -1
- package/geometry/operators/proximityOperator.d.ts +1 -1
- package/geometry/operators/reshapeOperator.js +1 -1
- package/geometry/operators/simplifyOGCOperator.d.ts +1 -1
- package/geometry/operators/simplifyOperator.d.ts +1 -1
- package/geometry/operators/support/GeographicTransformation.d.ts +6 -4
- package/geometry/operators/support/GeographicTransformation.js +1 -1
- package/geometry/operators/support/GeographicTransformationStep.d.ts +5 -3
- package/geometry/operators/support/GeographicTransformationStep.js +1 -1
- package/geometry/operators/support/Transformation.d.ts +6 -6
- package/geometry/operators/support/jsonConverter.js +1 -1
- package/geometry/operators/support/projectionTransformation.js +1 -1
- package/geometry/operators/symmetricDifferenceOperator.d.ts +1 -1
- package/geometry/operators/touchesOperator.d.ts +1 -1
- package/geometry/operators/unionOperator.d.ts +1 -1
- package/geometry/operators/withinOperator.d.ts +1 -1
- package/geometry/support/MeshMaterialMetallicRoughness.d.ts +1 -1
- package/geometry/support/zscale.js +1 -1
- package/graphic/KnowledgeGraphGraphicOrigin.d.ts +0 -1
- package/graphic/LinkChartGraphicOrigin.js +1 -1
- package/interfaces.d.ts +60 -60
- package/kernel.js +1 -1
- package/layers/BuildingSceneLayer.d.ts +4 -4
- package/layers/CSVLayer.d.ts +319 -542
- package/layers/CSVLayer.js +1 -1
- package/layers/CatalogLayer.d.ts +2 -2
- package/layers/ElevationLayer.d.ts +1 -1
- package/layers/FeatureLayer.d.ts +15 -15
- package/layers/FeatureLayer.js +1 -1
- package/layers/GeoJSONLayer.d.ts +6 -6
- package/layers/GeoRSSLayer.d.ts +1 -1
- package/layers/GraphicsLayer.d.ts +2 -2
- package/layers/ImageryLayer.d.ts +3 -3
- package/layers/ImageryTileLayer.d.ts +2 -2
- package/layers/IntegratedMesh3DTilesLayer.d.ts +6 -6
- package/layers/IntegratedMeshLayer.d.ts +7 -7
- package/layers/MapImageLayer.d.ts +1 -1
- package/layers/MediaLayer.d.ts +1 -1
- package/layers/OGCFeatureLayer.d.ts +2 -2
- package/layers/OrientedImageryLayer.d.ts +6 -6
- package/layers/OrientedImageryLayer.js +1 -1
- package/layers/PointCloudLayer.d.ts +1 -1
- package/layers/SceneLayer.d.ts +7 -7
- package/layers/StreamLayer.d.ts +2 -2
- package/layers/SubtypeGroupLayer.d.ts +5 -5
- package/layers/VectorTileLayer.d.ts +2 -2
- package/layers/VideoLayer.d.ts +1 -1
- package/layers/VoxelLayer.d.ts +8 -8
- package/layers/WFSLayer.d.ts +6 -6
- package/layers/catalog/CatalogFootprintLayer.d.ts +1 -1
- package/layers/graphics/applyEditsUtils.js +1 -1
- package/layers/graphics/data/QueryEngineCapabilities.js +1 -1
- package/layers/graphics/data/QueryEngineResult.js +1 -1
- package/layers/graphics/editingSupport.js +1 -1
- package/layers/graphics/sources/FeatureLayerSource.js +1 -1
- package/layers/graphics/sources/OGCFeatureSource.js +1 -1
- package/layers/graphics/sources/support/CSVSourceWorker.js +1 -1
- package/layers/graphics/sources/support/ParquetSourceWorker.js +1 -1
- package/layers/graphics/sources/support/QueryTask.js +1 -1
- package/layers/mixins/ArcGISImageService.js +1 -1
- package/layers/mixins/BlendLayer.d.ts +6 -6
- package/layers/mixins/EditBusLayer.d.ts +1 -1
- package/layers/orientedImagery/core/ExposurePoint.js +1 -1
- package/layers/orientedImagery/transformations/utils.js +1 -1
- package/layers/pointCloudFilters/PointCloudReturnFilter.d.ts +1 -1
- package/layers/pointCloudFilters/PointCloudValueFilter.d.ts +1 -1
- package/layers/raster/datasets/ImageServerRaster.js +1 -1
- package/layers/raster/functions/ExtractBandFunction.js +1 -1
- package/layers/support/DimensionalDefinition.d.ts +2 -2
- package/layers/support/FeatureEffect.d.ts +4 -4
- package/layers/support/FeatureFilter.d.ts +17 -17
- package/layers/support/FeatureReductionBinning.d.ts +1 -1
- package/layers/support/FeatureReductionCluster.d.ts +9 -9
- package/layers/support/LabelClass.d.ts +2 -2
- package/layers/support/RasterFunction.d.ts +1 -1
- package/layers/support/SceneFilter.d.ts +2 -2
- package/layers/support/SceneModification.d.ts +3 -3
- package/layers/support/SubtypeSublayer.d.ts +5 -5
- package/layers/support/arcgisLayerUrl.js +1 -1
- package/layers/support/capabilities.js +1 -1
- package/layers/support/featurePopupQueryUtils.js +1 -1
- package/layers/support/serviceCapabilitiesUtils.js +1 -1
- package/networks/support/Circuit.d.ts +11 -2
- package/networks/support/CircuitSection.d.ts +3 -2
- package/networks/support/TraceConfiguration.d.ts +5 -4
- package/networks/support/UNTraceConfiguration.d.ts +6 -5
- package/networks/support/jsonTypes.d.ts +305 -0
- package/package.json +3 -3
- package/popup/content/AttachmentsContent.d.ts +1 -1
- package/popup/content/BarChartMediaInfo.d.ts +1 -1
- package/popup/content/ColumnChartMediaInfo.d.ts +1 -1
- package/popup/content/FieldsContent.d.ts +1 -1
- package/popup/content/ImageMediaInfo.d.ts +1 -1
- package/popup/content/LineChartMediaInfo.d.ts +1 -1
- package/popup/content/MediaContent.d.ts +1 -1
- package/popup/content/PieChartMediaInfo.d.ts +1 -1
- package/popup/content/RelationshipContent.d.ts +1 -1
- package/popup/content/TextContent.d.ts +1 -1
- package/portal/schemas/definitions.js +1 -1
- package/portal/support/urlUtils.js +1 -1
- package/renderers/DotDensityRenderer.d.ts +3 -3
- package/renderers/FlowRenderer.d.ts +6 -6
- package/renderers/HeatmapRenderer.d.ts +3 -3
- package/renderers/PieChartRenderer.d.ts +1 -1
- package/renderers/RasterShadedReliefRenderer.d.ts +1 -1
- package/renderers/Renderer.d.ts +2 -2
- package/renderers/SimpleRenderer.d.ts +1 -1
- package/renderers/VectorFieldRenderer.d.ts +1 -1
- package/renderers/mixins/VisualVariablesMixin.d.ts +8 -8
- package/rest/featureService/FeatureService.js +1 -1
- package/rest/featureService/types.d.ts +7 -1
- package/rest/query/operations/editsZScale.js +1 -1
- package/rest/query/operations/pbfFlatFeatureSet.js +1 -1
- package/rest/query/support/AttachmentInfo.d.ts +1 -1
- package/rest/support/AutoIntervalBinParameters.d.ts +1 -1
- package/rest/support/DateBinParameters.d.ts +1 -1
- package/rest/support/FixedBoundariesBinParameters.d.ts +1 -1
- package/rest/support/FixedIntervalBinParameters.d.ts +1 -1
- package/rest/support/Query.d.ts +3 -2
- package/rest/types.d.ts +1 -3
- package/smartMapping/labels/clusters.d.ts +1 -1
- package/smartMapping/popup/clusters.d.ts +2 -2
- package/smartMapping/popup/templates.d.ts +1 -1
- package/smartMapping/raster/renderers/flow.d.ts +2 -2
- package/smartMapping/renderers/color.d.ts +12 -12
- package/smartMapping/renderers/predominance.d.ts +3 -3
- package/smartMapping/renderers/relationship.d.ts +15 -15
- package/smartMapping/renderers/univariateColorSize.d.ts +4 -4
- package/smartMapping/support/adapters/FeatureLayerAdapter.js +1 -1
- package/smartMapping/support/adapters/InMemoryLayerAdapter.js +1 -1
- package/smartMapping/support/utils.js +1 -1
- package/smartMapping/symbology/color.d.ts +4 -4
- package/smartMapping/symbology/flow.d.ts +2 -2
- package/smartMapping/symbology/types.d.ts +18 -18
- package/support/revision.js +1 -1
- package/symbols/CIMSymbol.d.ts +1 -1
- package/symbols/FillSymbol3DLayer.d.ts +3 -3
- package/symbols/IconSymbol3DLayer.d.ts +1 -1
- package/symbols/LabelSymbol3D.d.ts +2 -2
- package/symbols/LineStyleMarker3D.d.ts +7 -7
- package/symbols/LineSymbol3D.d.ts +2 -2
- package/symbols/LineSymbol3DLayer.d.ts +7 -7
- package/symbols/LineSymbolMarker.d.ts +6 -6
- package/symbols/MarkerSymbol.d.ts +1 -1
- package/symbols/MeshSymbol3D.d.ts +2 -2
- package/symbols/ObjectSymbol3DLayer.d.ts +1 -1
- package/symbols/PathSymbol3DLayer.d.ts +14 -14
- package/symbols/PictureFillSymbol.d.ts +1 -1
- package/symbols/PictureMarkerSymbol.d.ts +1 -1
- package/symbols/PointSymbol3D.d.ts +3 -3
- package/symbols/PolygonSymbol3D.d.ts +8 -26
- package/symbols/PolygonSymbol3D.js +1 -1
- package/symbols/SimpleFillSymbol.d.ts +8 -8
- package/symbols/SimpleLineSymbol.d.ts +20 -20
- package/symbols/SimpleMarkerSymbol.d.ts +7 -7
- package/symbols/Symbol3DLayer.d.ts +16 -16
- package/symbols/TextSymbol.d.ts +1 -1
- package/symbols/TextSymbol3DLayer.d.ts +1 -1
- package/symbols/WaterSymbol3DLayer.d.ts +3 -3
- package/symbols/WebStyleSymbol.d.ts +1 -1
- package/symbols/callouts/Callout3D.d.ts +1 -1
- package/symbols/callouts/LineCallout3D.d.ts +3 -3
- package/symbols/cim/CIMCursor.js +1 -1
- package/symbols/cim/CIMSymbolHelper.js +1 -1
- package/symbols/cim/cimAnalyzer.js +1 -1
- package/symbols/cim/placements/PlacementAlongLineSameSize.js +1 -1
- package/symbols/cim/placements/PlacementAtExtremities.js +1 -1
- package/symbols/cim/placements/PlacementAtMeasuredUnits.js +1 -1
- package/symbols/cim/placements/PlacementAtRatioPositions.js +1 -1
- package/symbols/cim/placements/PlacementOnLine.js +1 -1
- package/symbols/cim/placements/PlacementOnVertices.js +1 -1
- package/symbols/cim/types.d.ts +30 -23
- package/symbols/edges/Edges3D.d.ts +1 -1
- package/symbols/edges/SolidEdges3D.d.ts +1 -1
- package/symbols/patterns/LineStylePattern3D.d.ts +11 -11
- package/symbols/patterns/StylePattern3D.d.ts +8 -8
- package/symbols/support/ElevationInfo.d.ts +2 -2
- package/symbols/support/IconSymbol3DLayerResource.d.ts +6 -6
- package/symbols/support/ObjectSymbol3DLayerResource.d.ts +7 -7
- package/symbols/support/Symbol3DEmissive.d.ts +24 -13
- package/symbols/support/Symbol3DVerticalOffset.d.ts +2 -2
- package/symbols/support/previewSymbol3D.js +1 -1
- package/versionManagement/VersionManagementService.d.ts +3 -2
- package/views/2d/analysis/DistanceMeasurement/utils.js +1 -1
- package/views/2d/engine/webgl/shaderGraph/techniques/GraphicInstanceStore.js +1 -1
- package/views/2d/engine/webgl/shaderGraph/techniques/animated/AAnimatedPolyShader.js +1 -1
- package/views/2d/engine/webgl/shaderGraph/techniques/animated/AnimatedFillShader.js +1 -1
- package/views/2d/engine/webgl/shaderGraph/techniques/animated/AnimatedPolyMeshWriters.js +1 -1
- package/views/2d/engine/webgl/shaderGraph/techniques/animated/attributes.js +1 -1
- package/views/2d/engine/webgl/shaders/sources/shaderRepository.js +1 -1
- package/views/2d/layers/BaseLayerViewGL2D.d.ts +1 -1
- package/views/2d/layers/features/schema/processor/symbols/ComplexSymbolSchema.js +1 -1
- package/views/2d/layers/imagery/BaseImageryTileSubView2D.js +1 -1
- package/views/2d/types.d.ts +3 -3
- package/views/3d/environment/CloudyWeather.d.ts +1 -1
- package/views/3d/environment/Environment.d.ts +4 -4
- package/views/3d/environment/FoggyWeather.d.ts +1 -1
- package/views/3d/environment/RainyWeather.d.ts +1 -1
- package/views/3d/environment/SnowyWeather.d.ts +1 -1
- package/views/3d/environment/SunLighting.d.ts +1 -1
- package/views/3d/environment/SunnyWeather.d.ts +1 -1
- package/views/3d/environment/VirtualLighting.d.ts +1 -1
- package/views/3d/layers/graphics/Deconflictor.js +1 -1
- package/views/3d/layers/i3s/I3SViewportQueries.js +1 -1
- package/views/3d/support/MemoryController.js +1 -1
- package/views/3d/support/orientedBoundingBox.js +1 -1
- package/views/3d/webgl/RenderNode.d.ts +46 -57
- package/views/3d/webgl-engine/collections/Component/Material/ComponentMaterial.js +1 -1
- package/views/3d/webgl-engine/lib/Viewshed.js +1 -1
- package/views/3d/webgl.d.ts +8 -5
- package/views/DOMContainer.js +1 -1
- package/views/Magnifier.d.ts +3 -3
- package/views/MapView.d.ts +7 -7
- package/views/SceneView.d.ts +34 -37
- package/views/View.d.ts +2 -2
- package/views/analysis/ElevationProfile/ElevationProfileChart.js +1 -1
- package/views/draw/DrawOperation.js +1 -1
- package/views/draw/DrawTool.js +1 -1
- package/views/draw/plugins/BezierSegmentPlugin.js +1 -1
- package/views/draw/plugins/CircularArcSegmentPlugin.js +1 -1
- package/views/draw/plugins/FreehandSegmentPlugin.js +1 -1
- package/views/draw/plugins/MultipointPlugin.js +1 -1
- package/views/draw/plugins/PointPlugin.js +1 -1
- package/views/draw/plugins/PolygonPlugin.js +1 -1
- package/views/draw/plugins/PolylinePlugin.js +1 -1
- package/views/draw/plugins/ShapePlugin.js +1 -1
- package/views/draw/support/managers/TooltipManager.js +1 -1
- package/views/interactive/sketch/SketchLabelOptions.d.ts +1 -1
- package/views/interactive/sketch/SketchTooltipOptions.d.ts +1 -1
- package/views/interactive/snapping/RightAngleSnapper.js +1 -1
- package/views/interactive/snapping/RightAngleTriangleSnapper.js +1 -1
- package/views/interactive/snapping/SnappingOptions.d.ts +7 -7
- package/views/interactive/snapping/featureSources/featureServiceSource/FeatureServiceTiledFetcher.js +1 -1
- package/views/interactive/tooltip/content/TooltipContentDynamic.js +1 -1
- package/views/interactive/tooltip/infos/DynamicTooltipInfo.js +1 -1
- package/views/layers/FeatureLikeLayerView.js +1 -1
- package/views/support/HighlightOptions.d.ts +1 -1
- package/views/support/flow/dataUtils.js +1 -1
- package/views/ui/DefaultUI.d.ts +2 -2
- package/webscene/Environment.d.ts +10 -10
- package/webscene/Glow.d.ts +13 -2
- package/webscene/background/ColorBackground.d.ts +1 -1
- package/webscene/spec-certification/spec.js +1 -1
- package/widgets/AreaMeasurement2D.d.ts +1 -1
- package/widgets/AreaMeasurement3D.d.ts +2 -2
- package/widgets/Attachments.d.ts +1 -1
- package/widgets/Attribution.d.ts +1 -1
- package/widgets/BasemapGallery.d.ts +1 -1
- package/widgets/BasemapLayerList.d.ts +3 -3
- package/widgets/BasemapToggle.d.ts +1 -1
- package/widgets/Bookmarks/BookmarksVisibleElements.d.ts +1 -1
- package/widgets/Bookmarks.d.ts +2 -2
- package/widgets/BuildingExplorer.d.ts +1 -1
- package/widgets/CatalogLayerList.d.ts +3 -3
- package/widgets/Compass.d.ts +2 -2
- package/widgets/CoordinateConversion.d.ts +1 -1
- package/widgets/Daylight.d.ts +5 -5
- package/widgets/DirectLineMeasurement3D.d.ts +2 -2
- package/widgets/Directions/DirectionsViewModel.d.ts +12 -0
- package/widgets/Directions/DirectionsViewModel.js +1 -1
- package/widgets/Directions.d.ts +4 -4
- package/widgets/Directions.js +1 -1
- package/widgets/DistanceMeasurement2D.d.ts +1 -1
- package/widgets/Editor/CreateFeaturesWorkflow.d.ts +1 -1
- package/widgets/Editor/CreateFeaturesWorkflow.js +1 -1
- package/widgets/Editor/SplitFeatureWorkflow.js +1 -1
- package/widgets/Editor.d.ts +2 -2
- package/widgets/ElevationProfile/ElevationProfileLineGround.d.ts +1 -1
- package/widgets/ElevationProfile/ElevationProfileLineInput.d.ts +1 -1
- package/widgets/ElevationProfile/ElevationProfileLineView.d.ts +1 -1
- package/widgets/ElevationProfile.d.ts +3 -3
- package/widgets/Expand.d.ts +1 -1
- package/widgets/FeatureForm.d.ts +1 -1
- package/widgets/FeatureTable/ActionColumn.d.ts +1 -1
- package/widgets/FeatureTable/AttachmentsColumn.d.ts +1 -1
- package/widgets/FeatureTable/FeatureTableViewModel.d.ts +3 -3
- package/widgets/FeatureTable/Grid/GroupColumn.d.ts +1 -1
- package/widgets/FeatureTable/RelationshipColumn.d.ts +1 -1
- package/widgets/FeatureTable/VisibleElements.d.ts +1 -1
- package/widgets/FeatureTable.d.ts +9 -9
- package/widgets/FeatureTemplates/FeatureTemplatesViewModel.d.ts +5 -5
- package/widgets/FeatureTemplates.d.ts +8 -8
- package/widgets/Features/FeaturesViewModel.d.ts +2 -2
- package/widgets/Features/FeaturesVisibleElements.d.ts +2 -2
- package/widgets/Features.d.ts +1 -1
- package/widgets/FloorFilter/FloorFilterViewModel.js +1 -1
- package/widgets/Histogram.d.ts +2 -2
- package/widgets/HistogramRangeSlider.d.ts +1 -1
- package/widgets/Home/HomeViewModel.d.ts +2 -1
- package/widgets/Home/HomeViewModel.js +1 -1
- package/widgets/Home.d.ts +1 -1
- package/widgets/Home.js +1 -1
- package/widgets/LayerList.d.ts +4 -4
- package/widgets/Legend.d.ts +8 -8
- package/widgets/LineOfSight.d.ts +1 -1
- package/widgets/Locate.d.ts +2 -2
- package/widgets/Measurement.d.ts +1 -1
- package/widgets/NavigationToggle/NavigationToggleViewModel.d.ts +1 -1
- package/widgets/NavigationToggle.d.ts +3 -3
- package/widgets/OrientedImageryViewer/OrientedImageryViewerViewModel.js +1 -1
- package/widgets/OrientedImageryViewer/adapters/sketch/MeasurementAdapter.js +1 -1
- package/widgets/OrientedImageryViewer/adapters/sketch/TriangulatedMeasurementAdapter.js +1 -1
- package/widgets/OrientedImageryViewer/components/ImageLocationViewModel.js +1 -1
- package/widgets/OrientedImageryViewer/components/OrientedImageryVideoViewModel.js +1 -1
- package/widgets/OrientedImageryViewer/constants.js +1 -1
- package/widgets/OrientedImageryViewer/imageMeasurementUtils.js +1 -1
- package/widgets/OrientedImageryViewer/navigation/NavigationManager.js +1 -1
- package/widgets/OrientedImageryViewer/navigation/queries.js +1 -1
- package/widgets/OrientedImageryViewer/navigation/utils.js +1 -1
- package/widgets/OrientedImageryViewer/services/ImageMeasurementService.js +1 -1
- package/widgets/OrientedImageryViewer/services/TransformationService.js +1 -1
- package/widgets/OrientedImageryViewer/types.js +1 -1
- package/widgets/OrientedImageryViewer/videoViewerUtils.js +1 -1
- package/widgets/OrientedImageryViewer.js +1 -1
- package/widgets/Popup/PopupVisibleElements.d.ts +2 -2
- package/widgets/Popup.d.ts +5 -5
- package/widgets/Print/CustomTemplate.d.ts +1 -1
- package/widgets/Print/TemplateOptions.d.ts +4 -4
- package/widgets/ScaleRangeSlider.d.ts +1 -1
- package/widgets/Search/SearchViewModel.d.ts +4 -4
- package/widgets/Search.d.ts +5 -5
- package/widgets/ShadowCast.d.ts +3 -3
- package/widgets/Sketch/SketchViewModel.d.ts +39 -39
- package/widgets/Sketch/SketchViewModel.js +1 -1
- package/widgets/Sketch/support/PluginManager.js +1 -1
- package/widgets/Sketch.d.ts +43 -43
- package/widgets/Slice.d.ts +2 -2
- package/widgets/Slider/SliderViewModel.d.ts +2 -2
- package/widgets/Slider.d.ts +9 -9
- package/widgets/Swipe/SwipeViewModel.d.ts +1 -1
- package/widgets/Swipe.d.ts +2 -2
- package/widgets/TableList.d.ts +1 -1
- package/widgets/TimeSlider/TimeSliderViewModel.d.ts +8 -8
- package/widgets/TimeSlider/types.d.ts +1 -1
- package/widgets/TimeSlider.d.ts +11 -11
- package/widgets/Track.d.ts +2 -2
- package/widgets/UtilityNetworkAssociations.d.ts +3 -3
- package/widgets/UtilityNetworkTrace.d.ts +4 -4
- package/widgets/UtilityNetworkValidateTopology.d.ts +1 -1
- package/widgets/ValuePicker.d.ts +5 -5
- package/widgets/VideoPlayer.d.ts +1 -1
- package/widgets/smartMapping/ClassedColorSlider.d.ts +1 -1
- package/widgets/smartMapping/ClassedSizeSlider.d.ts +1 -1
- package/widgets/smartMapping/ColorSizeSlider.d.ts +2 -2
- package/widgets/smartMapping/ColorSlider.d.ts +1 -1
- package/widgets/smartMapping/HeatmapSlider.d.ts +1 -1
- package/widgets/smartMapping/OpacitySlider.d.ts +1 -1
- package/widgets/smartMapping/SizeSlider.d.ts +1 -1
- package/widgets/smartMapping/SmartMappingSliderBase.d.ts +4 -4
- package/widgets/smartMapping/SmartMappingSliderViewModel.d.ts +6 -6
- package/widgets/support/GridControls.d.ts +1 -1
- package/widgets/support/SnappingControls/VisibleElements.d.ts +1 -1
- package/widgets/support/SnappingControls.d.ts +6 -6
- package/assets/esri/core/workers/chunks/0184b4c0c92c76c60ab2.js +0 -1
- package/assets/esri/core/workers/chunks/08616877b58b518e7461.js +0 -1
- package/assets/esri/core/workers/chunks/089cef7124173a5cd5f9.js +0 -1
- package/assets/esri/core/workers/chunks/0baa0d66003d23cc76a7.js +0 -1
- package/assets/esri/core/workers/chunks/0baf2cf9d8998045a605.js +0 -1
- package/assets/esri/core/workers/chunks/0bf742d48f434c4c575f.js +0 -1
- package/assets/esri/core/workers/chunks/0cc68540194bd9f7aa3c.js +0 -1
- package/assets/esri/core/workers/chunks/0e216f0075fd531c3a2b.js +0 -1
- package/assets/esri/core/workers/chunks/1219b588f983b4f35033.js +0 -1
- package/assets/esri/core/workers/chunks/13e913aa5f5113fceb16.js +0 -1
- package/assets/esri/core/workers/chunks/15ba0296403dd4152b88.js +0 -1
- package/assets/esri/core/workers/chunks/15e5471277a48f482383.js +0 -1
- package/assets/esri/core/workers/chunks/16abc548724e428c325a.js +0 -1
- package/assets/esri/core/workers/chunks/1d124a55f6804be19e09.js +0 -1
- package/assets/esri/core/workers/chunks/1ede5fa7a16839ed9444.js +0 -1
- package/assets/esri/core/workers/chunks/25267253ba578eba38cf.js +0 -1
- package/assets/esri/core/workers/chunks/27aa21da934ecaca381a.js +0 -1
- package/assets/esri/core/workers/chunks/27d1f8279df34d8b15b5.js +0 -1
- package/assets/esri/core/workers/chunks/2907e9a7216b5a29729b.js +0 -1
- package/assets/esri/core/workers/chunks/2b0891ba57ba66b913ce.js +0 -1
- package/assets/esri/core/workers/chunks/2bb7bb7901bd343201fc.js +0 -1
- package/assets/esri/core/workers/chunks/2c7e5b78d94e5850537b.js +0 -1
- package/assets/esri/core/workers/chunks/2d52b137ee64469a46b2.js +0 -1
- package/assets/esri/core/workers/chunks/2eb7df99170b7bb2a914.js +0 -1
- package/assets/esri/core/workers/chunks/36b8dd092697ef544f40.js +0 -1
- package/assets/esri/core/workers/chunks/395ee51a863757ea8124.js +0 -1
- package/assets/esri/core/workers/chunks/3b0cfe3db8d90e02d6c6.js +0 -1
- package/assets/esri/core/workers/chunks/454150571b5b664b576a.js +0 -1
- package/assets/esri/core/workers/chunks/4740d319f233b7f528fe.js +0 -1
- package/assets/esri/core/workers/chunks/4742a8c19b86a5f859f0.js +0 -1
- package/assets/esri/core/workers/chunks/49d58bacb5b397246978.js +0 -1
- package/assets/esri/core/workers/chunks/4ba4aa6c75e3f8950e65.js +0 -1
- package/assets/esri/core/workers/chunks/59f955c7d6b0589e7cc6.js +0 -1
- package/assets/esri/core/workers/chunks/5a347b1d87eb6f710136.js +0 -1
- package/assets/esri/core/workers/chunks/5b97cdeb5949822fbef3.js +0 -1
- package/assets/esri/core/workers/chunks/5cd614f50e8925eeeaf4.js +0 -1
- package/assets/esri/core/workers/chunks/620d7cd0b0885122aa0f.js +0 -1
- package/assets/esri/core/workers/chunks/6321680c8070dffa3b6c.js +0 -1
- package/assets/esri/core/workers/chunks/7017c2e621236c7a7da4.js +0 -1
- package/assets/esri/core/workers/chunks/731e6eaad319865fb780.js +0 -1
- package/assets/esri/core/workers/chunks/7407a1e0cef508116a0b.js +0 -1
- package/assets/esri/core/workers/chunks/752c43cdd38dfde912d2.js +0 -1
- package/assets/esri/core/workers/chunks/78936c591fd49ff955a9.js +0 -1
- package/assets/esri/core/workers/chunks/796f5265747ce8be910e.js +0 -1
- package/assets/esri/core/workers/chunks/7b7288c431933a75daca.js +0 -1
- package/assets/esri/core/workers/chunks/7e6309bfed6692e8d2d7.js +0 -2
- package/assets/esri/core/workers/chunks/7f60309d211c49721265.js +0 -1
- package/assets/esri/core/workers/chunks/7f9b0ef7f9b3f3fd3df9.js +0 -1
- package/assets/esri/core/workers/chunks/8177e95596b71bf020aa.js +0 -1
- package/assets/esri/core/workers/chunks/9bb04d5f2e6f6e4585a0.js +0 -1
- package/assets/esri/core/workers/chunks/a03196e6579d738251fc.js +0 -1
- package/assets/esri/core/workers/chunks/a0b715cf03895082b773.js +0 -1
- package/assets/esri/core/workers/chunks/a115984b794a7f90b2c0.js +0 -1
- package/assets/esri/core/workers/chunks/a5e91cf150f6cf6a5d2a.js +0 -1
- package/assets/esri/core/workers/chunks/a60a84c8c45f6d03443f.js +0 -1
- package/assets/esri/core/workers/chunks/aec827b50df6edc54808.js +0 -1
- package/assets/esri/core/workers/chunks/aef2832902b270f1a594.js +0 -1
- package/assets/esri/core/workers/chunks/b0b24fb60a21b995b348.js +0 -1
- package/assets/esri/core/workers/chunks/bb830d93e97dceac350f.js +0 -1
- package/assets/esri/core/workers/chunks/bd05e68b00b9878d0266.js +0 -1
- package/assets/esri/core/workers/chunks/bd12ca39198e6efbefbb.js +0 -1
- package/assets/esri/core/workers/chunks/bdd246cc50ccd5c10987.js +0 -1
- package/assets/esri/core/workers/chunks/c080e189764d8bb9cf25.js +0 -1
- package/assets/esri/core/workers/chunks/c15f0769a64863cccef0.js +0 -1
- package/assets/esri/core/workers/chunks/c516b185b099bf69c0ed.js +0 -1
- package/assets/esri/core/workers/chunks/c53048b0f153b251d792.js +0 -1
- package/assets/esri/core/workers/chunks/c693e8eb96ab8a4b9cbe.js +0 -1
- package/assets/esri/core/workers/chunks/c9babe86c00ae69e63ee.js +0 -2
- package/assets/esri/core/workers/chunks/cf09408cb7729126caae.js +0 -1
- package/assets/esri/core/workers/chunks/d9c1e1ec5c56f09fb82f.js +0 -1
- package/assets/esri/core/workers/chunks/e0565849281ffbe8269e.js +0 -1
- package/assets/esri/core/workers/chunks/e1ba6f857ca12f154e77.js +0 -1
- package/assets/esri/core/workers/chunks/e4f1e584f89ffb86206b.js +0 -1
- package/assets/esri/core/workers/chunks/e60684918100666bb892.js +0 -1
- package/assets/esri/core/workers/chunks/e94448b371cd17d7a472.js +0 -1
- package/assets/esri/core/workers/chunks/ed78e19b1e400c0db309.js +0 -1
- package/assets/esri/core/workers/chunks/ede1d1cc2f315a34f4ca.js +0 -1
- package/assets/esri/core/workers/chunks/f17a301516f008abef3a.js +0 -1
- package/assets/esri/core/workers/chunks/fc98b8351be567d3eb62.js +0 -1
- package/assets/esri/core/workers/chunks/fd5a5b05a1551cdb8c87.js +0 -1
- package/assets/esri/core/workers/chunks/fda0f4469d9cda637af4.js +0 -1
- package/assets/esri/core/workers/chunks/fe52117fe6982046c9e3.js +0 -1
- package/assets/esri/core/workers/chunks/ff961bb6d29ab3fe129d.js +0 -1
- /package/assets/esri/core/workers/chunks/{2762149a922275136171.js.LICENSE.txt → 112227b862b935123ddf.js.LICENSE.txt} +0 -0
- /package/assets/esri/core/workers/chunks/{72acfb74fd9ab9bae923.js.LICENSE.txt → 53e348f5585fa8c53fe8.js.LICENSE.txt} +0 -0
- /package/assets/esri/core/workers/chunks/{7e6309bfed6692e8d2d7.js.LICENSE.txt → b397a9f87082705301a4.js.LICENSE.txt} +0 -0
- /package/assets/esri/core/workers/chunks/{91858b02da40ff251ab2.js.LICENSE.txt → baad696d84ab78b3d00e.js.LICENSE.txt} +0 -0
- /package/assets/esri/core/workers/chunks/{c9babe86c00ae69e63ee.js.LICENSE.txt → edaae0fc63d16b0f675d.js.LICENSE.txt} +0 -0
|
@@ -10,7 +10,7 @@
|
|
|
10
10
|
*
|
|
11
11
|
* The example below depicts the predominant decade in which homes were constructed based on a city's block groups.
|
|
12
12
|
*
|
|
13
|
-
* [](https://developers.arcgis.com/javascript/latest/sample-code/visualization-sm-predominance/)
|
|
14
14
|
*
|
|
15
15
|
* > [!WARNING]
|
|
16
16
|
* >
|
|
@@ -158,7 +158,7 @@ export interface RendererParameters extends AbortOptions {
|
|
|
158
158
|
* where the predominant value beats all others by a large margin are given a high opacity. Features where the predominant value beats
|
|
159
159
|
* others by a small margin will be assigned a low opacity, indicating that while the feature has a winning value, it doesn't win by much.
|
|
160
160
|
*
|
|
161
|
-
* 
|
|
162
162
|
*/
|
|
163
163
|
includeOpacityVariable?: boolean | null;
|
|
164
164
|
/**
|
|
@@ -168,7 +168,7 @@ export interface RendererParameters extends AbortOptions {
|
|
|
168
168
|
* is good for visualizing how influential a particular feature is compared to the dataset as a whole. It removes bias introduced by
|
|
169
169
|
* features with large geographic areas, but relatively small data values.
|
|
170
170
|
*
|
|
171
|
-
* 
|
|
172
172
|
*/
|
|
173
173
|
includeSizeVariable?: boolean | null;
|
|
174
174
|
/**
|
|
@@ -8,7 +8,7 @@
|
|
|
8
8
|
* another.
|
|
9
9
|
*
|
|
10
10
|
* <figure>
|
|
11
|
-
* <a href="https://www.esri.com/arcgis-blog/products/arcgis-online/mapping/what-is-a-relationship-map" target="_blank"><img src="https://developers.arcgis.com/javascript/latest/assets/
|
|
11
|
+
* <a href="https://www.esri.com/arcgis-blog/products/arcgis-online/mapping/what-is-a-relationship-map" target="_blank"><img src="https://developers.arcgis.com/javascript/latest/assets/references/core/renderers/smartmapping/relationship-legend.png" alt="Relationship renderer legend"></a>
|
|
12
12
|
* <figcaption style="border-left: none;margin-top:0">
|
|
13
13
|
* The legend of a relationship renderer resembles a grid of two single-hue sequential color ramps overlaid on each other, forming a third
|
|
14
14
|
* hue along a diagonal line, which indicates where the two variables could potentially be related.
|
|
@@ -19,14 +19,14 @@
|
|
|
19
19
|
* vice versa. The image below shows what this style looks like on a map of U.S. counties where the percent of the population diagnosed
|
|
20
20
|
* with Diabetes is compared to the percent of the population that is obese.
|
|
21
21
|
*
|
|
22
|
-
* [](https://www.arcgis.com/home/webmap/viewer.html?webmap=c09aee5d3fee41c489fdffec21cb270a)
|
|
23
23
|
*
|
|
24
24
|
* While this visualization style was originally designed for 2D choropleth maps, it is particularly useful in 3D scenes where
|
|
25
25
|
* bivariate visualizations of color and size would not otherwise be possible since the size of features is reserved for real-world sizes of objects,
|
|
26
26
|
* such as buildings. Therefore, the relationship renderer becomes ideal for creating thematic bivariate visualizations of
|
|
27
27
|
* 3d object [SceneLayers](https://developers.arcgis.com/javascript/latest/references/core/layers/SceneLayer/).
|
|
28
28
|
*
|
|
29
|
-
* [](https://developers.arcgis.com/javascript/latest/sample-code/visualization-sm-relationship/)
|
|
30
30
|
*
|
|
31
31
|
* Keep in mind that even if you observe a positive relationship between the two variables of interest, it doesn't mean they
|
|
32
32
|
* are statistically correlated. It also doesn't imply the presence of one variable influences the other. Therefore, this
|
|
@@ -172,11 +172,11 @@ export interface RendererParameters extends AbortOptions {
|
|
|
172
172
|
*
|
|
173
173
|
* Value | Example | Description
|
|
174
174
|
* ------|-------------|--------
|
|
175
|
-
* null |  | The legend renders as a square. The top right corner of the legend indicates that values from both `field1` and `field2` are considered high. |
|
|
176
|
+
* HH |  | The legend renders as a diamond with the focus on the top corner where values from both `field1` and `field2` are considered high. |
|
|
177
|
+
* HL |  | The legend renders as a diamond with the focus on the top corner where values from `field1` are high and values from `field2` are low. |
|
|
178
|
+
* LH |  | The legend renders as a diamond with the focus on the top corner where values from `field1` are low and values from `field2` are high. |
|
|
179
|
+
* LL |  | The legend renders as a diamond with the focus on the top corner where values from both `field1` and `field2` are considered low. |
|
|
180
180
|
*
|
|
181
181
|
* @default null
|
|
182
182
|
*/
|
|
@@ -187,7 +187,7 @@ export interface RendererParameters extends AbortOptions {
|
|
|
187
187
|
*
|
|
188
188
|
* 2 classes | 3 classes | 4 classes
|
|
189
189
|
* --|--|---
|
|
190
|
-
*  |  | 
|
|
191
191
|
*
|
|
192
192
|
* **Possible Values:** 2 | 3 | 4
|
|
193
193
|
*
|
|
@@ -352,7 +352,7 @@ export interface UpdateRendererParameters {
|
|
|
352
352
|
*
|
|
353
353
|
* 2 classes | 3 classes | 4 classes
|
|
354
354
|
* --|--|---
|
|
355
|
-
*  |  | 
|
|
356
356
|
*
|
|
357
357
|
* **Possible Values:** 2 | 3 | 4
|
|
358
358
|
*/
|
|
@@ -364,11 +364,11 @@ export interface UpdateRendererParameters {
|
|
|
364
364
|
*
|
|
365
365
|
* Value | Example | Description
|
|
366
366
|
* ------|-------------|--------
|
|
367
|
-
* null |  | The legend renders as a square. The top right corner of the legend indicates that values from both `field1` and `field2` are considered high. |
|
|
368
|
+
* HH |  | The legend renders as a diamond with the focus on the top corner where values from both `field1` and `field2` are considered high. |
|
|
369
|
+
* HL |  | The legend renders as a diamond with the focus on the top corner where values from `field1` are high and values from `field2` are low. |
|
|
370
|
+
* LH |  | The legend renders as a diamond with the focus on the top corner where values from `field1` are low and values from `field2` are high. |
|
|
371
|
+
* LL |  | The legend renders as a diamond with the focus on the top corner where values from both `field1` and `field2` are considered low. |
|
|
372
372
|
*
|
|
373
373
|
* @default null
|
|
374
374
|
*/
|
|
@@ -289,10 +289,10 @@ export interface VisualVariablesParamsBaseColorOptions {
|
|
|
289
289
|
* Possible values are listed below.
|
|
290
290
|
* | Value | Description | Example |
|
|
291
291
|
* | ----- | ----------- | ------- |
|
|
292
|
-
* | high-to-low | High values are emphasized with strong colors. |  are visualized with weak colors while other values are emphasized with strong colors. |  are emphasized with strong colors while other values are visualized with weak colors. |  |
|
|
293
|
+
* | above-and-below | Values centered around a given point (e.g. the average) are visualized with weak colors while other values are emphasized with strong colors. |  |
|
|
294
|
+
* | centered-on | Values centered around a given point (e.g. the average) are emphasized with strong colors while other values are visualized with weak colors. |  |
|
|
295
|
+
* | extremes | High and low values are emphasized with strong colors. All others are visualized with weak colors. |  |
|
|
296
296
|
*
|
|
297
297
|
* @default high-to-low
|
|
298
298
|
*/
|
|
@@ -1,2 +1,2 @@
|
|
|
1
1
|
/* COPYRIGHT Esri - https://js.arcgis.com/5.1/LICENSE.txt */
|
|
2
|
-
import{__decorate as e}from"tslib";import t from"../../../Graphic.js";import{pickRandom as i}from"../../../core/arrayUtils.js";import s from"../../../core/Error.js";import{throwIfAborted as r}from"../../../core/promiseUtils.js";import{property as a,subclass as n}from"../../../core/accessorSupport/decorators.js";import{isHostedAgolService as o}from"../../../layers/support/arcgisLayerUrl.js";import{isTimeOnlyField as l,isNumericField as u}from"../../../layers/support/fieldUtils.js";import{generateRenderer as c}from"../../../rest/generateRenderer.js";import m from"../../../rest/support/GenerateRendererParameters.js";import h from"../../../rest/support/PivotQuery.js";import p from"../../../rest/support/StatisticDefinition.js";import d from"../../../rest/support/UniqueValueDefinition.js";import y from"../../../rest/support/UnPivotDefinition.js";import{getArcadeForPredominantCategory as f,getSQLForPredominantCategoryName as F}from"../../statistics/support/predominanceUtils.js";import{mergeWhereClauses as S,getRangeExpr as w,getSQLFilterForNormalization as g}from"../../statistics/support/utils.js";import{WorkerClient as v}from"../../statistics/support/WorkerClient.js";import{isAnyDateField as _,isIntegerField as x,castIntegerFieldToFloat as q,fieldDelimiter as V}from"../utils.js";import E from"./InMemoryLayerAdapter.js";import{getQueryParamsForExpr as b,getDataRange as z,getAttributeBinsQuery as L,processQueryAttributeBinsResult as Q,binParamsFromGenRend as T}from"./support/histogramUtils.js";import{ensureFeaturesJSON as j,getSummaryStatsQuery as N,getSummaryStatisticsFromFeatureSet as B,getSummaryStatsQueryForFields as M,getSummaryStatsPivotQuery as $,getUVQuery as O,getUniqueValuesFromFeatureSet as C,defaultNumBins as P,updateQueryWithFeatureFilter as R,getHistogramFromFeatureSet as I,getFieldExpr as A,getDomainsForFields as k,getBins as U,getPredominantCategoriesFromUVInfos as D,getMissingFields as G}from"./support/utils.js";import{processSummaryStatisticsResult as J,createUVResult as W,getEqualIntervalBins as H,createClassBreaksDefinition as Z,resolveCBResult as K}from"../../../statistics/utils.js";import{getScaleToResolutionFactor as X}from"../../../views/2d/viewpointUtils.js";const Y=5,ee=2e4,te=4e5;let ie=class extends E{constructor(){super(...arguments),this.adapterName="feature-layer-adapter"}_isStatsSupportedOnService(){const e=this.layer;if(!e.capabilities?.query?.supportsStatistics||"multipatch"===this.geometryType&&!o(e.url)&&e.version<10.5)throw new s(`${this.adapterName}:not-supported`,"Layer does not support statistics query");return Promise.resolve()}_fetchFeaturesFromService(e,t){return this.layer.queryFeatures(e,{signal:t}).then(e=>e.features)}_fetchFeaturesJSONFromService(e,t){return this._fetchFeaturesFromService(e,t).then(j)}_summaryStatsFromGenRend(e){const t=e.normalizationType,i=e.normalizationField;return this.classBreaks({field:e.field,numClasses:Y,classificationMethod:"standard-deviation",standardDeviationInterval:.25,normalizationType:t,normalizationField:"field"===t?i:void 0,minValue:e.minValue,maxValue:e.maxValue,filter:e.filter,signal:e.signal}).then(t=>{let i,s,r;if(t.classBreakInfos?.some(e=>(e.hasAvg&&(i=e),!!i)),i){const e=i.maxValue-i.minValue;s=i.minValue+e/2,r=4*e}const a={min:t.minValue,max:t.maxValue,avg:s,stddev:r};return J(a,e.outStatisticTypes)})}async _summaryStatsFromServiceQuery(e,t){await this._isStatsSupportedOnService(),"percent-of-total"===e.normalizationType&&(e.normalizationTotal=await this._getNormalizationTotal(e.field,e.normalizationType,e.filter));const i=_(t)||l(t),s="capabilities"in this.layer?this.layer.capabilities:null,r=N(this,e,t,s?.query?.supportsPercentileStatistics??!1),a=await this.layer.queryFeatures(r,{signal:e.signal}),n=B(a,i);return J(n,e.outStatisticTypes)}async _summaryStatsForFieldsBasic(e){const{outStatisticTypes:t,fields:i}=e,s=50,r=[];for(let o=0;o<i.length;o+=s){const t=i.slice(o,o+s),a=M(this,e,t);r.push(this.layer.queryFeatures(a,{signal:e.signal}))}const a=(await Promise.all(r)).flatMap(e=>e.features).map(e=>e.attributes).reduce((e,t)=>Object.assign(e,t),{}),n={};for(const o in a){const e=o.match(/^(\w+)_value_/);if(null==a[o]||!e)continue;switch(e[1]){case"min":n.min=null==n.min?a[o]:Math.min(n.min,a[o]);break;case"max":n.max=null==n.max?a[o]:Math.max(n.max,a[o]);break;case"sum":n.sum=(n.sum||0)+a[o];break;case"count":n.count=(n.count||0)+a[o]}}return J(n,t)}async _summaryStatsForFieldsAdvanced(e,t){const{outStatisticTypes:i,fields:s}=e,r=i?.exclude?.includes("variance")||i?.include&&!i.include.includes("variance"),a=i?.exclude?.includes("stddev")||i?.include&&!i.include.includes("stddev");if(null==t.sum||!t.count||r&&a)return t;t.avg=t.sum/t.count;const n=50,o=[];for(let u=0;u<s.length;u+=n){const i=s.slice(u,u+n),r=M(this,e,i);r.outStatistics=[];for(const e of i){const i=`sumOfSquares_${e}`,s=`(power(${x(this.layer,e)?q(e):e} - ${t.avg}, 2))`,a=new p({statisticType:"sum",onStatisticField:s,outStatisticFieldName:i});r.outStatistics.push(a)}o.push(this.layer.queryFeatures(r,{signal:e.signal}))}const l=(await Promise.all(o)).reduce((e,t)=>e+Object.values(t.features[0].attributes).reduce((e,t)=>e+t,0),0);return t.variance=l/(t.count-1),t.stddev=Math.sqrt(t.variance),J(t,i)}async _summaryStatsForFields(e){const t=await this._summaryStatsForFieldsBasic(e);return this._summaryStatsForFieldsAdvanced(e,t)}async _summaryStatsUsingQueryPivot(e){await this._isStatsSupportedOnService();const t="capabilities"in this.layer?this.layer.capabilities:null,i=$(this,e,t?.query?.supportsPercentileStatistics??!1),s=await this.layer.queryPivot(i,{signal:e.signal}),r=B(s,!1);return J(r,e.outStatisticTypes)}_uvFromGenRenderer(e,t){const i=e.field??void 0,s=new d({attributeField:i}),r=new m({classificationDefinition:s});return this.generateRenderer(r,e.signal).then(e=>{const t={},s=this.getField(i);return e.uniqueValues.forEach(e=>{let i=e.value;null!=i&&""!==i&&("string"!=typeof i||""!==i.trim()&&"<null>"!==i.toLowerCase())||(i=null),null==t[i]?t[i]={count:e.count,data:u(s)&&i?Number(i):i}:t[i].count=t[i].count+e.count}),{count:t}}).then(i=>W(i,[t],e.returnAllCodedValues))}async _uvFromServiceQuery(e,t){return this._isStatsSupportedOnService().then(()=>this.layer.queryFeatures(O(this,e),{signal:e.signal})).then(t=>C(t,{layer:this,field:e.field,field2:e.field2,field3:e.field3,fieldDelimiter:V,view:e.view,signal:e.signal})).then(i=>W(i,t,e.returnAllCodedValues,V))}_getNormalizationTotal(e,t,i,s){return e&&"percent-of-total"===t?this.summaryStatistics({field:e,outStatisticTypes:{include:["sum"]},filter:i,signal:s}).then(e=>e.sum):Promise.resolve(null)}_histogramForExpr(e){return this._getNormalizationTotal(e.field,e.normalizationType,e.filter,e.signal).then(t=>{const i=b(e,this,t);return z(i,this,e.minValue,e.maxValue).then(s=>{const r=s.min,a=s.max;if(null==r||null==a)return{bins:[],minValue:r,maxValue:a,normalizationTotal:t};const n=e.numBins||P,o=H(r,a,n),l=se(i.sqlExpression,o,null!=e.minValue&&null!=e.maxValue),u=new p({statisticType:"count",outStatisticFieldName:"countOFExpr",onStatisticField:"1"}),c=this.layer.createQuery();return c.where=S(c.where,i.sqlWhere),c.sqlFormat="standard",c.outStatistics=[u],c.groupByFieldsForStatistics=[l],c.orderByFields=[l],R(c,e.filter),this._isStatsSupportedOnService().then(()=>this.layer.queryFeatures(c,{signal:i.signal})).then(e=>I(e,r,a,n,t))})})}async _histogramForFields(e){const{min:t,max:i}=await z({fields:e.fields,sqlWhere:e.sqlWhere,filter:e.filter,signal:e.signal},this,e.minValue,e.maxValue);if(null==t||null==i)return{bins:[],minValue:t,maxValue:i};const s="newField",r=e.numBins||P,a=se(s,H(t,i,r),null!=e.minValue&&null!=e.maxValue),n=new p({statisticType:"count",outStatisticFieldName:"countOFExpr",onStatisticField:s}),o=new h,{where:l,timeExtent:u}=this.createQuery();return o.where=S(l,e.sqlWhere),o.outPivots=[new y({sourceFields:e.fields,valueFieldName:s})],o.outStatistics=[n],o.groupByFieldsForStatistics=[a],o.orderByFields=[a],o.timeExtent=u,R(o,e.filter),this._isStatsSupportedOnService().then(()=>this.layer.queryPivot(o,{signal:e.signal})).then(e=>I(e,t,i,r))}async _histogramFromQueryAttributeBins(e){const{field:t,normalizationType:i,filter:s,signal:r}=e,a=await this._getNormalizationTotal(t,i,s,r),{query:n,min:o,max:l}=await L(e,this,a,this.createQuery());if(!n)return{bins:[],minValue:o,maxValue:l,normalizationTotal:a};const u=await this.layer.queryAttributeBins(n,{signal:r});return Q(u,t?this.getField(t):null,{minValue:o,maxValue:l,normalizationTotal:a})}_classBreaksFromGenRend(e){const{field:t,normalizationType:i,normalizationField:s,normalizationTotal:r,signal:a}=e,n=g({field:t,normalizationType:i,normalizationField:s}),o=A({field:t,normalizationType:i,normalizationField:s,normalizationTotal:r,layer:this}),l=w(o,e.minValue,e.maxValue),u=Z({field:t,normalizationType:i,normalizationField:s,classificationMethod:e.classificationMethod,standardDeviationInterval:e.standardDeviationInterval,breakCount:e.numClasses||Y}),c=new m({classificationDefinition:u});return c.where=S(n,l),this.generateRenderer(c,a).then(t=>K(t,e.classificationMethod))}async summaryStatistics(e){const{field:t,fields:i,normalizationType:a,valueExpression:n,sqlExpression:o,view:u,features:c,useFeaturesInView:m}=e,h=t?this.getField(t):null,p=_(h)||l(h),d=n&&!(o&&this.supportsSQLExpression),y=this._hasLocalSource||c||m,f="3d"===u?.type;if(i?.length){const t={...e,fields:i};if(!this.layer.capabilities?.operations?.supportsQueryPivot)return await this._summaryStatsForFields(t);try{return await this._summaryStatsUsingQueryPivot(t)}catch{return await this._summaryStatsForFields(t)}}if(y||d)return d||c||m||f||this._hasLocalSource&&!this.layer.capabilities.query.supportsStatistics?this._summaryStatsFromMemory(e,h):this._summaryStatsFromClientQuery(e,h);if(!this.supportsSQLExpression&&(p||o||"natural-log"===a||"square-root"===a))throw new s(`${this.adapterName}:not-supported`,"Layer does not support standardized SQL expression for queries");return(a&&!this.supportsSQLExpression?this._summaryStatsFromGenRend(e):this._summaryStatsFromServiceQuery(e,h)).catch(()=>(r(e.signal),this._summaryStatsFromMemory(e,h)))}async uniqueValues(e){const{valueExpression:t,sqlExpression:i,features:s,useFeaturesInView:a,signal:n}=e,o=t&&!(i&&this.supportsSQLExpression),l=this._hasLocalSource||s||a||o,u=e.view,c="3d"===u?.type,m=await k(e,this);return l?o||s||a||c||this._hasLocalSource&&!this.layer.capabilities.query.supportsStatistics?this._uvFromMemory(e,m):this._uvFromClientQuery(e,m):this._uvFromServiceQuery(e,m).catch(t=>(r(n),!e.field||e.field2||e.field3||e.filter?t:this._uvFromGenRenderer(e,m[0]))).catch(()=>(r(n),c?this._uvFromMemory(e,m):this._uvFromClientQuery(e,m)))}async histogram(e){const{field:t,normalizationType:i,normalizationField:a,classificationMethod:n,view:o,filter:u,signal:c}=e,m=t?this.getField(t):null,h=_(m)||l(m),p=e.valueExpression||e.sqlExpression,d=e.valueExpression&&!(e.sqlExpression&&this.supportsSQLExpression),y=this._hasLocalSource||e.features||e.useFeaturesInView||d,f=this.supportsSQLExpression,F=!n||"equal-interval"===n,S=e.minValue,g=e.maxValue,v=null!=S&&null!=g,x=e.numBins||P;if(e.fields?.length){if(!f)throw new s(`${this.adapterName}:not-supported`,"Layer does not support standardized SQL expression for queries");if(!this.layer.capabilities?.operations?.supportsQueryPivot)throw new s(`${this.adapterName}:not-supported`,"Layer does not support pivot queries");return this._histogramForFields(e)}if(this.layer.capabilities?.operations?.supportsQueryBins&&e.useQueryAttributeBins&&!d){if(y)return this._histogramFromQueryAttributeBinsFromMemory(e);try{return await this._histogramFromQueryAttributeBins(e)}catch{return r(c),this._histogramFromQueryAttributeBinsFromMemory(e)}}if(y)return this._histogramFromMemory(e);if((p||f)&&F){if(!f&&(p||"natural-log"===i||"square-root"===i))throw new s(`${this.adapterName}:not-supported`,"Layer does not support standardized SQL expression for queries");return this._histogramForExpr(e)}if(h&&F)throw new s(`${this.adapterName}:not-supported`,"Normalization and date field are not allowed when layer does not support standardized SQL expression for queries");return i||!F?T(e,this).then(r=>{if(!v)return U(this,r,t,x,o,u,c);if(S>r.max||g<r.min)throw new s(`${this.adapterName}:insufficient-data`,"Range defined by 'minValue' and 'maxValue' does not intersect available data range of the field");if(F)return U(this,{min:S,max:g,sqlExpr:r.sqlExpr,excludeZerosExpr:r.excludeZerosExpr},t,x,o,u,c);{const s={field:t,normalizationType:i,normalizationField:a,normalizationTotal:r.normTotal,layer:this},n=A(s),l=w(n,S,g);return T(e,this,l).then(e=>U(this,e,t,x,o,u,c))}}):this._histogramForField(e)}async classBreaks(e){const t=!1!==e.analyzeData,i=this._hasLocalSource||e.features||e.useFeaturesInView||e.valueExpression||e.filter;if(t&&i)return this._classBreaksFromMemory(e);return(t?this._classBreaksFromGenRend(e):this._classBreaksFromInterpolation(e)).catch(()=>(r(e.signal),this._classBreaksFromMemory(e)))}async queryFeatureCount(e){if(this._hasLocalSource)throw new s(`${this.adapterName}:not-supported`,"Layer does not support count query");const t=this.layer,i=t.createQuery();return i.where=S(i.where,e.whereClause),R(i,e.filter),t.queryFeatureCount(i,{signal:e.signal})}async generateRenderer(e,t){const i=this.layer;if(this._hasLocalSource||i.version<10.1)throw new s(`${this.adapterName}:not-supported`,"Layer does not support generateRenderer operation (requires ArcGIS Server version 10.1+)");const r=i.createQuery();return e.where=S(e.where,r.where),c(i.parsedUrl?.path??"",{source:i.dynamicDataSource??void 0,gdbVersion:i.gdbVersion??void 0},e,{signal:t})}async predominantCategories(e){if(!this._hasLocalSource&&!this.supportsSQLExpression)throw new s(`${this.adapterName}:not-supported`,"Layer does not support advanced SQL expressions and standardized queries");const{fields:t,view:i,signal:r,filter:a}=e,n=f(t),o=F(t),l=i&&this._hasLocalSource?await this._uvFromMemory({valueExpression:n,view:i,signal:r,filter:a}):await this._uvFromServiceQuery({sqlExpression:o.expression,valueExpression:n,signal:r,filter:a});return D(l.uniqueValueInfos,t)}async getSampleFeatures(e,s){const{view:a,requiredFields:n,returnGeometry:o,filter:l,signal:u}=e,c=e.sampleSize;if(null==c||0===c)return[];const m=this.layer.createQuery(),h=1,p="json"===s;m.outSpatialReference=a?.spatialReference,m.returnGeometry=!!o,m.outFields=n,R(m,l);let d=[],y=!1;if(a)try{const r=await a.whenLayerView(this.layer);if(y=!G(this,n,r).length,y){if(c>=1&&!e.filter&&"getSampleFeatures"in r){await this._waitForLayerViewUpdate(r);const e=await r.getSampleFeatures({minFeatureCount:c,sampleSize:c});if(null!=e)return p?e:e.map(e=>t.fromJSON(e))}if(d=await this._fetchFeaturesFromMemory(r,m,u,s),d.length>=c&&c>0)return i(d,c,h)}}catch(f){r(u)}try{if(this._hasLocalSource)return y?d:p?await this._fetchFeaturesJSONFromService(m,u):await this._fetchFeaturesFromService(m,u);const t=await this.queryFeatureCount({view:a,filter:l,signal:u}),s=this.layer.capabilities.query.maxRecordCount;let r=-1===c?t:c;if(r=s&&r>s?s:r,t<=d.length||d.length>=s)return d;if(m.maxAllowableOffset=e.resolution||(a?a.extent.width/a.width/a.scale:X(this.layer.spatialReference))*te,t<=r)return p?await this._fetchFeaturesJSONFromService(m,u):await this._fetchFeaturesFromService(m,u);if(t<=ee){const e=this.layer.createQuery();R(e,l);const t=await this.layer.queryObjectIds();return m.objectIds=i(t,r,h),p?await this._fetchFeaturesJSONFromService(m,u):await this._fetchFeaturesFromService(m,u)}return this.layer.capabilities?.query?.supportsPagination&&(m.num=Math.min(r,ee)),p?await this._fetchFeaturesJSONFromService(m,u):await this._fetchFeaturesFromService(m,u)}catch(f){return r(u),d}}load(e){const t=this.layer.load(e).then(async t=>{this.geometryType=t.geometryType,this.objectIdField=t.objectIdField,this.supportsSQLExpression=t.capabilities?.query?.supportsSqlExpression,this._hasLocalSource="parquet"===t.type||!t.url&&!!t.source,this.hasQueryEngine=this._hasLocalSource,this.minScale=t.minScale,this.maxScale=t.maxScale,this.fullExtent=t.fullExtent,this.workerClient=v.getInstance(),await this.workerClient.open(e.signal)});return this.addResolvingPromise(t),Promise.resolve(this)}};function se(e,t,i){const s=[],r=t.length;return t.forEach((t,a)=>{const[n,o]=t;let l=null;l=0!==a||i?a!==r-1||i?S(`${e} >= ${n}`,`${e} ${a===r-1?" <= ":" < "} ${o}`):`${e} >= ${n}`:`${e} < ${o}`,s.push("WHEN ("+l+") THEN "+(a+1))}),["CASE",s.join(" "),"ELSE 0","END"].join(" ")}e([a({readOnly:!0})],ie.prototype,"adapterName",void 0),e([a({constructOnly:!0})],ie.prototype,"layer",void 0),ie=e([n("esri.smartMapping.support.adapters.FeatureLayerAdapter")],ie);export{ie as default};
|
|
2
|
+
import{__decorate as e}from"tslib";import t from"../../../Graphic.js";import{pickRandom as i}from"../../../core/arrayUtils.js";import s from"../../../core/Error.js";import{throwIfAborted as r}from"../../../core/promiseUtils.js";import{property as a,subclass as n}from"../../../core/accessorSupport/decorators.js";import{isHostedAgolService as o}from"../../../layers/support/arcgisLayerUrl.js";import{isTimeOnlyField as l,isNumericField as u}from"../../../layers/support/fieldUtils.js";import{generateRenderer as c}from"../../../rest/generateRenderer.js";import m from"../../../rest/support/GenerateRendererParameters.js";import h from"../../../rest/support/PivotQuery.js";import p from"../../../rest/support/StatisticDefinition.js";import d from"../../../rest/support/UniqueValueDefinition.js";import y from"../../../rest/support/UnPivotDefinition.js";import{getArcadeForPredominantCategory as f,getSQLForPredominantCategoryName as F}from"../../statistics/support/predominanceUtils.js";import{mergeWhereClauses as S,getRangeExpr as w,getSQLFilterForNormalization as g}from"../../statistics/support/utils.js";import{WorkerClient as v}from"../../statistics/support/WorkerClient.js";import{isAnyDateField as _,isIntegerField as x,castIntegerFieldToFloat as q,fieldDelimiter as V}from"../utils.js";import E from"./InMemoryLayerAdapter.js";import{getQueryParamsForExpr as b,getDataRange as z,getAttributeBinsQuery as L,processQueryAttributeBinsResult as Q,binParamsFromGenRend as T}from"./support/histogramUtils.js";import{ensureFeaturesJSON as j,getSummaryStatsQuery as N,getSummaryStatisticsFromFeatureSet as B,getSummaryStatsQueryForFields as M,getSummaryStatsPivotQuery as $,getUVQuery as O,getUniqueValuesFromFeatureSet as C,defaultNumBins as P,updateQueryWithFeatureFilter as R,getHistogramFromFeatureSet as I,getFieldExpr as A,getDomainsForFields as k,getBins as U,getPredominantCategoriesFromUVInfos as D,getMissingFields as G}from"./support/utils.js";import{processSummaryStatisticsResult as W,createUVResult as J,getEqualIntervalBins as H,createClassBreaksDefinition as Z,resolveCBResult as K}from"../../../statistics/utils.js";import{getScaleToResolutionFactor as X}from"../../../views/2d/viewpointUtils.js";const Y=5,ee=2e4,te=4e5;let ie=class extends E{constructor(){super(...arguments),this.adapterName="feature-layer-adapter"}_isStatsSupportedOnService(){const e=this.layer;if(!e.capabilities?.query?.supportsStatistics||"multipatch"===this.geometryType&&!o(e.url)&&e.version<10.5)throw new s(`${this.adapterName}:not-supported`,"Layer does not support statistics query");return Promise.resolve()}_fetchFeaturesFromService(e,t){return this.layer.queryFeatures(e,{signal:t}).then(e=>e.features)}_fetchFeaturesJSONFromService(e,t){return this._fetchFeaturesFromService(e,t).then(j)}_summaryStatsFromGenRend(e){const t=e.normalizationType,i=e.normalizationField;return this.classBreaks({field:e.field,numClasses:Y,classificationMethod:"standard-deviation",standardDeviationInterval:.25,normalizationType:t,normalizationField:"field"===t?i:void 0,minValue:e.minValue,maxValue:e.maxValue,filter:e.filter,signal:e.signal}).then(t=>{let i,s,r;if(t.classBreakInfos?.some(e=>(e.hasAvg&&(i=e),!!i)),i){const e=i.maxValue-i.minValue;s=i.minValue+e/2,r=4*e}const a={min:t.minValue,max:t.maxValue,avg:s,stddev:r};return W(a,e.outStatisticTypes)})}async _summaryStatsFromServiceQuery(e,t){await this._isStatsSupportedOnService(),"percent-of-total"===e.normalizationType&&(e.normalizationTotal=await this._getNormalizationTotal(e.field,e.normalizationType,e.filter));const i=_(t)||l(t),s="capabilities"in this.layer?this.layer.capabilities:null,r=N(this,e,t,s?.query?.supportsPercentileStatistics??!1),a=await this.layer.queryFeatures(r,{signal:e.signal}),n=B(a,i);return W(n,e.outStatisticTypes)}async _summaryStatsForFieldsBasic(e){const{outStatisticTypes:t,fields:i}=e,s=50,r=[];for(let o=0;o<i.length;o+=s){const t=i.slice(o,o+s),a=M(this,e,t);r.push(this.layer.queryFeatures(a,{signal:e.signal}))}const a=(await Promise.all(r)).flatMap(e=>e.features).map(e=>e.attributes).reduce((e,t)=>Object.assign(e,t),{}),n={};for(const o in a){const e=o.match(/^(\w+)_value_/);if(null==a[o]||!e)continue;switch(e[1]){case"min":n.min=null==n.min?a[o]:Math.min(n.min,a[o]);break;case"max":n.max=null==n.max?a[o]:Math.max(n.max,a[o]);break;case"sum":n.sum=(n.sum||0)+a[o];break;case"count":n.count=(n.count||0)+a[o]}}return W(n,t)}async _summaryStatsForFieldsAdvanced(e,t){const{outStatisticTypes:i,fields:s}=e,r=i?.exclude?.includes("variance")||i?.include&&!i.include.includes("variance"),a=i?.exclude?.includes("stddev")||i?.include&&!i.include.includes("stddev");if(null==t.sum||!t.count||r&&a)return t;t.avg=t.sum/t.count;const n=50,o=[];for(let u=0;u<s.length;u+=n){const i=s.slice(u,u+n),r=M(this,e,i);r.outStatistics=[];for(const e of i){const i=`sumOfSquares_${e}`,s=`(power(${x(this.layer,e)?q(e):e} - ${t.avg}, 2))`,a=new p({statisticType:"sum",onStatisticField:s,outStatisticFieldName:i});r.outStatistics.push(a)}o.push(this.layer.queryFeatures(r,{signal:e.signal}))}const l=(await Promise.all(o)).reduce((e,t)=>e+Object.values(t.features[0].attributes).reduce((e,t)=>e+t,0),0);return t.variance=l/(t.count-1),t.stddev=Math.sqrt(t.variance),W(t,i)}async _summaryStatsForFields(e){const t=await this._summaryStatsForFieldsBasic(e);return this._summaryStatsForFieldsAdvanced(e,t)}async _summaryStatsUsingQueryPivot(e){await this._isStatsSupportedOnService();const t="capabilities"in this.layer?this.layer.capabilities:null,i=$(this,e,t?.query?.supportsPercentileStatistics??!1),s=await this.layer.queryPivot(i,{signal:e.signal}),r=B(s,!1);return W(r,e.outStatisticTypes)}_uvFromGenRenderer(e,t){const i=e.field??void 0,s=new d({attributeField:i}),r=new m({classificationDefinition:s});return this.generateRenderer(r,e.signal).then(e=>{const t={},s=this.getField(i);return e.uniqueValues.forEach(e=>{let i=e.value;null!=i&&""!==i&&("string"!=typeof i||""!==i.trim()&&"<null>"!==i.toLowerCase())||(i=null),null==t[i]?t[i]={count:e.count,data:u(s)&&i?Number(i):i}:t[i].count=t[i].count+e.count}),{count:t}}).then(i=>J(i,[t],e.returnAllCodedValues))}async _uvFromServiceQuery(e,t){return this._isStatsSupportedOnService().then(()=>this.layer.queryFeatures(O(this,e),{signal:e.signal})).then(t=>C(t,{layer:this,field:e.field,field2:e.field2,field3:e.field3,fieldDelimiter:V,view:e.view,signal:e.signal})).then(i=>J(i,t,e.returnAllCodedValues,V))}_getNormalizationTotal(e,t,i,s){return e&&"percent-of-total"===t?this.summaryStatistics({field:e,outStatisticTypes:{include:["sum"]},filter:i,signal:s}).then(e=>e.sum):Promise.resolve(null)}_histogramForExpr(e){return this._getNormalizationTotal(e.field,e.normalizationType,e.filter,e.signal).then(t=>{const i=b(e,this,t);return z(i,this,e.minValue,e.maxValue).then(s=>{const r=s.min,a=s.max;if(null==r||null==a)return{bins:[],minValue:r,maxValue:a,normalizationTotal:t};const n=e.numBins||P,o=H(r,a,n),l=se(i.sqlExpression,o,null!=e.minValue&&null!=e.maxValue),u=new p({statisticType:"count",outStatisticFieldName:"countOFExpr",onStatisticField:"1"}),c=this.layer.createQuery();return c.where=S(c.where,i.sqlWhere),c.sqlFormat="standard",c.outStatistics=[u],c.groupByFieldsForStatistics=[l],c.orderByFields=[l],R(c,e.filter),this._isStatsSupportedOnService().then(()=>this.layer.queryFeatures(c,{signal:i.signal})).then(e=>I(e,r,a,n,t))})})}async _histogramForFields(e){const{min:t,max:i}=await z({fields:e.fields,sqlWhere:e.sqlWhere,filter:e.filter,signal:e.signal},this,e.minValue,e.maxValue);if(null==t||null==i)return{bins:[],minValue:t,maxValue:i};const s="newField",r=e.numBins||P,a=se(s,H(t,i,r),null!=e.minValue&&null!=e.maxValue),n=new p({statisticType:"count",outStatisticFieldName:"countOFExpr",onStatisticField:s}),o=new h,{where:l,timeExtent:u}=this.createQuery();return o.where=S(l,e.sqlWhere),o.outPivots=[new y({sourceFields:e.fields,valueFieldName:s})],o.outStatistics=[n],o.groupByFieldsForStatistics=[a],o.orderByFields=[a],o.timeExtent=u,R(o,e.filter),this._isStatsSupportedOnService().then(()=>this.layer.queryPivot(o,{signal:e.signal})).then(e=>I(e,t,i,r))}async _histogramFromQueryAttributeBins(e){const{field:t,normalizationType:i,filter:s,signal:r}=e,a=await this._getNormalizationTotal(t,i,s,r),{query:n,min:o,max:l}=await L(e,this,a,this.createQuery());if(!n)return{bins:[],minValue:o,maxValue:l,normalizationTotal:a};const u=await this.layer.queryAttributeBins(n,{signal:r});return Q(u,t?this.getField(t):null,{minValue:o,maxValue:l,normalizationTotal:a})}_classBreaksFromGenRend(e){const{field:t,normalizationType:i,normalizationField:s,normalizationTotal:r,signal:a}=e,n=g({field:t,normalizationType:i,normalizationField:s}),o=A({field:t,normalizationType:i,normalizationField:s,normalizationTotal:r,layer:this}),l=w(o,e.minValue,e.maxValue),u=Z({field:t,normalizationType:i,normalizationField:s,classificationMethod:e.classificationMethod,standardDeviationInterval:e.standardDeviationInterval,breakCount:e.numClasses||Y}),c=new m({classificationDefinition:u});return c.where=S(n,l),this.generateRenderer(c,a).then(t=>K(t,e.classificationMethod))}async summaryStatistics(e){const{field:t,fields:i,normalizationType:a,valueExpression:n,sqlExpression:o,view:u,features:c,useFeaturesInView:m}=e,h=t?this.getField(t):null,p=_(h)||l(h),d=n&&!(o&&this.supportsSQLExpression),y=this._hasLocalSource||c||m,f="3d"===u?.type;if(i?.length){const t={...e,fields:i};if(!this.layer.capabilities?.operations?.supportsQueryPivot)return await this._summaryStatsForFields(t);try{return await this._summaryStatsUsingQueryPivot(t)}catch{return await this._summaryStatsForFields(t)}}if(y||d)return d||c||m||f||this._hasLocalSource&&!this.layer.capabilities.query.supportsStatistics?this._summaryStatsFromMemory(e,h):this._summaryStatsFromClientQuery(e,h);if(!this.supportsSQLExpression&&(p||o||"natural-log"===a||"square-root"===a))throw new s(`${this.adapterName}:not-supported`,"Layer does not support standardized SQL expression for queries");return(a&&!this.supportsSQLExpression?this._summaryStatsFromGenRend(e):this._summaryStatsFromServiceQuery(e,h)).catch(()=>(r(e.signal),this._summaryStatsFromMemory(e,h)))}async uniqueValues(e){const{valueExpression:t,sqlExpression:i,features:s,useFeaturesInView:a,signal:n}=e,o=t&&!(i&&this.supportsSQLExpression),l=this._hasLocalSource||s||a||o,u=e.view,c="3d"===u?.type,m=await k(e,this);return l?o||s||a||c||this._hasLocalSource&&!this.layer.capabilities.query.supportsStatistics?this._uvFromMemory(e,m):this._uvFromClientQuery(e,m):this._uvFromServiceQuery(e,m).catch(t=>(r(n),!e.field||e.field2||e.field3||e.filter?t:this._uvFromGenRenderer(e,m[0]))).catch(()=>(r(n),c?this._uvFromMemory(e,m):this._uvFromClientQuery(e,m)))}async histogram(e){const{field:t,normalizationType:i,normalizationField:a,classificationMethod:n,view:o,filter:u,signal:c}=e,m=t?this.getField(t):null,h=_(m)||l(m),p=e.valueExpression||e.sqlExpression,d=e.valueExpression&&!(e.sqlExpression&&this.supportsSQLExpression),y=this._hasLocalSource||e.features||e.useFeaturesInView||d,f=this.supportsSQLExpression,F=!n||"equal-interval"===n,S=e.minValue,g=e.maxValue,v=null!=S&&null!=g,x=e.numBins||P;if(e.fields?.length){if(!f)throw new s(`${this.adapterName}:not-supported`,"Layer does not support standardized SQL expression for queries");if(!this.layer.capabilities?.operations?.supportsQueryPivot)throw new s(`${this.adapterName}:not-supported`,"Layer does not support pivot queries");return this._histogramForFields(e)}if(this.layer.capabilities?.operations?.supportsQueryBins&&e.useQueryAttributeBins&&!d){if(y)return this._histogramFromQueryAttributeBinsFromMemory(e);try{return await this._histogramFromQueryAttributeBins(e)}catch{return r(c),this._histogramFromQueryAttributeBinsFromMemory(e)}}if(y)return this._histogramFromMemory(e);if((p||f)&&F){if(!f&&(p||"natural-log"===i||"square-root"===i))throw new s(`${this.adapterName}:not-supported`,"Layer does not support standardized SQL expression for queries");return this._histogramForExpr(e)}if(h&&F)throw new s(`${this.adapterName}:not-supported`,"Normalization and date field are not allowed when layer does not support standardized SQL expression for queries");return i||!F?T(e,this).then(r=>{if(!v)return U(this,r,t,x,o,u,c);if(S>r.max||g<r.min)throw new s(`${this.adapterName}:insufficient-data`,"Range defined by 'minValue' and 'maxValue' does not intersect available data range of the field");if(F)return U(this,{min:S,max:g,sqlExpr:r.sqlExpr,excludeZerosExpr:r.excludeZerosExpr},t,x,o,u,c);{const s={field:t,normalizationType:i,normalizationField:a,normalizationTotal:r.normTotal,layer:this},n=A(s),l=w(n,S,g);return T(e,this,l).then(e=>U(this,e,t,x,o,u,c))}}):this._histogramForField(e)}async classBreaks(e){const t=!1!==e.analyzeData,i=this._hasLocalSource||e.features||e.useFeaturesInView||e.valueExpression||e.filter;if(t&&i)return this._classBreaksFromMemory(e);return(t?this._classBreaksFromGenRend(e):this._classBreaksFromInterpolation(e)).catch(()=>(r(e.signal),this._classBreaksFromMemory(e)))}async queryFeatureCount(e){if(this._hasLocalSource)throw new s(`${this.adapterName}:not-supported`,"Layer does not support count query");const t=this.layer,i=t.createQuery();return i.where=S(i.where,e.whereClause),R(i,e.filter),t.queryFeatureCount(i,{signal:e.signal})}async generateRenderer(e,t){const i=this.layer;if(this._hasLocalSource||i.version<10.1)throw new s(`${this.adapterName}:not-supported`,"Layer does not support generateRenderer operation (requires ArcGIS Server version 10.1+)");const r=i.createQuery();return e.where=S(e.where,r.where),c(i.parsedUrl?.path??"",{source:i.dynamicDataSource??void 0,gdbVersion:i.gdbVersion??void 0},e,{signal:t})}async predominantCategories(e){if(!this._hasLocalSource&&!this.supportsSQLExpression)throw new s(`${this.adapterName}:not-supported`,"Layer does not support advanced SQL expressions and standardized queries");const{fields:t,view:i,signal:r,filter:a}=e,n=f(t),o=F(t),l=i&&this._hasLocalSource?await this._uvFromMemory({valueExpression:n,view:i,signal:r,filter:a}):await this._uvFromServiceQuery({sqlExpression:o.expression,valueExpression:n,signal:r,filter:a});return D(l.uniqueValueInfos,t)}async getSampleFeatures(e,s){const{view:a,requiredFields:n,returnGeometry:o,sqlWhere:l,filter:u,signal:c}=e,m=e.sampleSize;if(null==m||0===m)return[];const h=this.layer.createQuery(),p=1,d="json"===s;h.outSpatialReference=a?.spatialReference,h.returnGeometry=!!o,h.outFields=n,h.where=S(h.where,l),R(h,u);let y=[],f=!1;if(a)try{const r=await a.whenLayerView(this.layer);if(f=!G(this,n,r).length,f){if(m>=1&&!e.filter&&"getSampleFeatures"in r){await this._waitForLayerViewUpdate(r);const e=await r.getSampleFeatures({minFeatureCount:m,sampleSize:m});if(null!=e)return d?e:e.map(e=>t.fromJSON(e))}if(y=await this._fetchFeaturesFromMemory(r,h,c,s),y.length>=m&&m>0)return i(y,m,p)}}catch(F){r(c)}try{if(this._hasLocalSource)return f?y:d?await this._fetchFeaturesJSONFromService(h,c):await this._fetchFeaturesFromService(h,c);const t=await this.queryFeatureCount({view:a,filter:u,signal:c}),s=this.layer.capabilities.query.maxRecordCount;let r=-1===m?t:m;if(r=s&&r>s?s:r,t<=y.length||y.length>=s)return y;if(h.maxAllowableOffset=e.resolution||(a?a.extent.width/a.width/a.scale:X(this.layer.spatialReference))*te,t<=r)return d?await this._fetchFeaturesJSONFromService(h,c):await this._fetchFeaturesFromService(h,c);if(t<=ee){const e=this.layer.createQuery();R(e,u);const t=await this.layer.queryObjectIds();return h.objectIds=i(t,r,p),d?await this._fetchFeaturesJSONFromService(h,c):await this._fetchFeaturesFromService(h,c)}return this.layer.capabilities?.query?.supportsPagination&&(h.num=Math.min(r,ee)),d?await this._fetchFeaturesJSONFromService(h,c):await this._fetchFeaturesFromService(h,c)}catch(F){return r(c),y}}load(e){const t=this.layer.load(e).then(async t=>{this.geometryType=t.geometryType,this.objectIdField=t.objectIdField,this.supportsSQLExpression=t.capabilities?.query?.supportsSqlExpression,this._hasLocalSource="parquet"===t.type||!t.url&&!!t.source,this.hasQueryEngine=this._hasLocalSource,this.minScale=t.minScale,this.maxScale=t.maxScale,this.fullExtent=t.fullExtent,this.workerClient=v.getInstance(),await this.workerClient.open(e.signal)});return this.addResolvingPromise(t),Promise.resolve(this)}};function se(e,t,i){const s=[],r=t.length;return t.forEach((t,a)=>{const[n,o]=t;let l=null;l=0!==a||i?a!==r-1||i?S(`${e} >= ${n}`,`${e} ${a===r-1?" <= ":" < "} ${o}`):`${e} >= ${n}`:`${e} < ${o}`,s.push("WHEN ("+l+") THEN "+(a+1))}),["CASE",s.join(" "),"ELSE 0","END"].join(" ")}e([a({readOnly:!0})],ie.prototype,"adapterName",void 0),e([a({constructOnly:!0})],ie.prototype,"layer",void 0),ie=e([n("esri.smartMapping.support.adapters.FeatureLayerAdapter")],ie);export{ie as default};
|
|
@@ -1,2 +1,2 @@
|
|
|
1
1
|
/* COPYRIGHT Esri - https://js.arcgis.com/5.1/LICENSE.txt */
|
|
2
|
-
import{__decorate as e}from"tslib";import{pickRandom as t}from"../../../core/arrayUtils.js";import r from"../../../core/Error.js";import a from"../../../core/Logger.js";import{assertIsSome as i}from"../../../core/maybe.js";import{timeout as s,throwIfAborted as o}from"../../../core/promiseUtils.js";import{whenOnce as n}from"../../../core/reactiveUtils.js";import{property as l,subclass as u}from"../../../core/accessorSupport/decorators.js";import{toQuantizationTransform as m}from"../../../geometry/support/quantizationUtils.js";import{kebabDict as p}from"../../../layers/support/fieldType.js";import{isTimeOnlyField as y}from"../../../layers/support/fieldUtils.js";import f from"../../../rest/support/QuantizationParameters.js";import{getArcadeForPredominantCategory as c}from"../../statistics/support/predominanceUtils.js";import{summaryStatistics as d,uniqueValues as h,histogram as w,classBreaks as g,heatmapStatistics as F}from"../../statistics/support/statsWorker.js";import{mergeWhereClauses as S}from"../../statistics/support/utils.js";import{WorkerClient as q}from"../../statistics/support/WorkerClient.js";import{getFieldsList as v,isAnyDateField as x,getWhereClause as V,fieldDelimiter as _}from"../utils.js";import z from"./LayerAdapter.js";import{getHistogramAttributeDefinition as T,getAttributeBinsQuery as N,processQueryAttributeBinsResult as M}from"./support/histogramUtils.js";import{ensureFeaturesJSON as L,getSummaryStatsQuery as E,getSummaryStatisticsFromFeatureSet as C,getViewInfoParams as j,getMissingFields as b,updateQueryWithFeatureFilter as I,getUVQuery as k,getUniqueValuesFromFeatureSet as O,getBins as Q,getDomainsForFields as J,getPredominantCategoriesFromUVInfos as B}from"./support/utils.js";import{processSummaryStatisticsResult as P,createUVResult as U,resolveCBResult as A}from"../../../statistics/utils.js";import{loadArcade as $}from"../../../support/loadArcade.js";const G=5;let R=null,D=class extends z{constructor(){super(...arguments),this._hasLocalSource=!1,this.adapterName="in-memory-layer-adapter"}destroy(){this.workerClient?.destroy()}async _waitForLayerViewUpdate(e){if(!e)throw new r(`${this.adapterName}:insufficient-data`,"layerView is required to fetch the features");const t=new AbortController,i=n(()=>!e.updating,t.signal);await s(i,5e3,t).catch(e=>{throw a.getLogger(this).warn("LayerView is taking too long to update. Aborting fetch from layerView."),e})}async _fetchFeatureSetFromMemory(e,t,a){const i=this.layer;if(this._hasLocalSource&&"queryFeatures"in i)return i.queryFeatures(e);if(!t)throw new r(`${this.adapterName}:insufficient-data`,"view is required to fetch the features from layerView");const s=await t.whenLayerView(this.layer);return await this._waitForLayerViewUpdate(s),s.queryFeatures(e,{signal:a})}async _fetchFeaturesFromMemory(e,t,a,i){const s=this.layer,o="json"===i;if(this._hasLocalSource&&"queryFeatures"in s){const e=await s.queryFeatures(t);return o?L(e.features):e.features}if(await this._waitForLayerViewUpdate(e),o&&"queryFeaturesJSON"in e&&e.queryFeaturesJSON){const{features:r}=await e.queryFeaturesJSON(t,{signal:a});return r}if(!("queryFeatures"in e))throw new r(`${this.adapterName}:not-supported`,"'queryFeatures' is not supported on the layerView");const n=await e.queryFeatures(t,{signal:a});return o?L(n.features):n.features}_fetchFeaturesForStats(e,t){return v({field:e.field,field2:e.field2,field3:e.field3,normalizationField:e.normalizationField,valueExpression:e.valueExpression,fields:e.fields}).then(r=>this.getSampleFeatures({sampleSize:-1,view:e.view,returnGeometry:e.returnGeometry,filter:e.filter,requiredFields:r,signal:e.signal},t))}async _summaryStatsFromClientQuery(e,t){const{view:r,signal:a}=e,i=E(this,e,t),s=await this._fetchFeatureSetFromMemory(i,r,a),o=C(s,x(t)||y(t));return P(o,e.outStatisticTypes)}async _getNormalizationTotalFromMemory(e,t,a){const{featuresJSON:i,graphics:s,layerView:o,query:n}=t,l={include:["sum"]},u=(!i&&!s&&o&&"querySummaryStatistics"in o?await o.querySummaryStatistics(n,{field:e},{signal:a}):i?await this.workerClient.summaryStatistics({field:e,outStatisticTypes:l},i):await d({attribute:{field:e,outStatisticTypes:l},features:s??[]})).sum;if(null==u)throw new r(`${this.adapterName}:invalid`,"invalid normalizationTotal");return u}async _summaryStatsFromMemory(e,t){const{view:r,field:a,valueExpression:i,normalizationType:s,signal:o}=e,n={field:a,valueExpression:i,normalizationType:s,normalizationField:e.normalizationField,normalizationTotal:e.normalizationTotal,minValue:e.minValue,maxValue:e.maxValue,outStatisticTypes:e.outStatisticTypes},{featuresJSON:l,graphics:u,layerView:m,query:y,fieldInfos:f}=await this._processStatsFromMemoryParams({...e,layerViewFunc:"querySummaryStatistics"});return i&&r&&(l||u)&&(n.fieldType=t?.type?p.toJSON(t.type):null,n.viewInfoParams=j(r),n.timeZone=r.timeZone,n.fieldInfos=f),"percent-of-total"===s&&null==e.normalizationTotal&&(n.normalizationTotal=await this._getNormalizationTotalFromMemory(a,{featuresJSON:l,graphics:u,layerView:m,query:y},o)),!l&&!u&&m&&"querySummaryStatistics"in m?m.querySummaryStatistics(y,n,{signal:o}):l?this.workerClient.summaryStatistics(n,l):d({attribute:n,features:u})}async _getFilteredFeatures(e,t){let r=e;const a=t?.geometry;if("intersects"===t?.spatialRelationship&&a){const t=await import("../../../geometry/operators/intersectionOperator.js");r=e.filter(({geometry:e})=>!(!e||!t.execute(e,a)))}return e.length&&"declaredClass"in e[0]&&"esri.Graphic"===e[0].declaredClass?{graphics:r}:{featuresJSON:r}}async _processStatsFromMemoryParams(e){const{features:t,filter:r}=e;if(t?.length)return this._getFilteredFeatures(t,r);const{view:a,field:i,field2:s,field3:o,normalizationField:n,valueExpression:l,sqlExpression:u,layerViewFunc:m,signal:p}=e;let y=e.returnGeometry;if(null==y&&l){if(!R){const{arcadeUtils:e}=await $();R=e}const e=R.hasGeometryOperations(l);e&&await R.enableGeometryOperations(),y=e}let f=null,c=null,d=null,h=null,w=null;if(a)try{const e="subtype-sublayer"===this.layer.type?this.layer.parent:this.layer;f=await a.whenLayerView(e),c=null!=m&&null!=f&&m in f&&"function"==typeof f[m]}catch{c=!1}if(c)try{await this._waitForLayerViewUpdate(f);const e=u?await V(u,this.layer.fieldsIndex):null,t=e?.fieldNames,a=await v({field:i,field2:s,field3:o,normalizationField:n,valueExpression:l,fields:t});b(this,a,f).length?c=!1:(d=this.layer.createQuery(),d.outFields=a,d.returnGeometry=!1,I(d,r)),f.suspended&&(c=!1)}catch{c=!1}if(!c){const e=u?await V(u,this.layer.fieldsIndex):null,t=e?.fieldNames;h=await this._fetchFeaturesForStats({field:i,field2:s,field3:o,fields:t,valueExpression:l,normalizationField:n,returnGeometry:y,filter:r,view:a,signal:p},"json"),w=(await v({valueExpression:l})).map(e=>this.getField(e)?.toJSON()).filter(Boolean)}return{layerView:f,query:d,featuresJSON:h,fieldInfos:w}}async _uvFromClientQuery(e,t){const{view:r,signal:a}=e,i=k(this,e),s=await this._fetchFeatureSetFromMemory(i,r,a),o=await O(s,{layer:this,field:e.field,field2:e.field2,field3:e.field3,fieldDelimiter:_,view:e.view,signal:e.signal});return U(o,t,e.returnAllCodedValues,_)}async _uvFromMemory(e,t){const{view:r,field:a,valueExpression:i,returnAllCodedValues:s,signal:o}=e,{featuresJSON:n,graphics:l,layerView:u,query:m,fieldInfos:p}=await this._processStatsFromMemoryParams({...e,layerViewFunc:"queryUniqueValues"}),y={field:a,field2:e.field2,field3:e.field3,fieldDelimiter:_,valueExpression:i,domains:t,returnAllCodedValues:s};return i&&r&&(n||l)&&(y.viewInfoParams=j(r),y.timeZone=r.timeZone,y.fieldInfos=p),!n&&!l&&u&&"queryUniqueValues"in u?u.queryUniqueValues(m,y,{signal:o}):n?this.workerClient.uniqueValues(y,n):h({attribute:y,features:l})}_histogramForField(e){let t=null;return t=null!=e.minValue&&null!=e.maxValue?Promise.resolve({min:e.minValue,max:e.maxValue}):this.summaryStatistics({...e,outStatisticTypes:{include:["min","max","count"]}}).then(e=>{if(!e.count)throw new r(`${this.adapterName}:insufficient-data`,"Either the layer has no features or none of the features have data for the field");return{min:e.min,max:e.max}}),t.then(t=>Q(this,{min:t.min,max:t.max},e.field,e.numBins??void 0,e.view,e.filter,e.signal))}async _histogramFromQueryAttributeBinsFromMemory(e){const{field:t,normalizationType:r,signal:a}=e,i=await this._processStatsFromMemoryParams({...e,layerViewFunc:"queryAttributeBins"}),{featuresJSON:s,graphics:o,layerView:n,query:l}=i,u="percent-of-total"===r?e.normalizationTotal??await this._getNormalizationTotalFromMemory(t,i,a):void 0;if(!n||!("queryAttributeBins"in n)||s||o){const t=T(e,i,u);return s?this.workerClient.histogram(t,s):w({attribute:t,features:o})}const{query:m,min:p,max:y}=await N(e,this,u,l);if(!m)return{bins:[],minValue:p,maxValue:y,normalizationTotal:u};const f=await n.queryAttributeBins(m,{signal:a});return M(f,t?this.getField(t):null,{minValue:p,maxValue:y,normalizationTotal:u})}async _histogramFromMemory(e){const{field:t,signal:r}=e,a=await this._processStatsFromMemoryParams({...e,layerViewFunc:"queryHistogram"}),{featuresJSON:i,graphics:s,layerView:o,query:n}=a,l="percent-of-total"===e.normalizationType?e.normalizationTotal??await this._getNormalizationTotalFromMemory(t,a,r):void 0,u=T(e,a,l);return!i&&!s&&o&&"queryHistogram"in o?o.queryHistogram(n,u,{signal:r}):i?this.workerClient.histogram(u,i):w({attribute:u,features:s})}_classBreaksFromInterpolation(e){const{minValue:t,maxValue:r}=e,a=e.numClasses||G,i=[],s=(r-t)/a;for(let l=0;l<a;l++){const e=t+l*s;i.push({minValue:e,maxValue:e+s})}i[a-1].maxValue=r;const o={classBreaks:i,normalizationTotal:e.normalizationTotal},n=A(o,e.classificationMethod);return Promise.resolve(n)}async _classBreaksFromMemory(e){const{view:t,field:r,valueExpression:a,signal:i}=e,{featuresJSON:s,graphics:o,layerView:n,query:l,fieldInfos:u}=await this._processStatsFromMemoryParams({...e,layerViewFunc:"queryClassBreaks"}),m={field:r,valueExpression:a,normalizationType:e.normalizationType,normalizationField:e.normalizationField,normalizationTotal:e.normalizationTotal,minValue:e.minValue,maxValue:e.maxValue,standardDeviationInterval:e.standardDeviationInterval,classificationMethod:e.classificationMethod,numClasses:e.numClasses};return a&&t&&(s||o)&&(m.viewInfoParams=j(t),m.timeZone=t.timeZone,m.fieldInfos=u),"percent-of-total"===e.normalizationType&&null==e.normalizationTotal&&(m.normalizationTotal=await this._getNormalizationTotalFromMemory(r,{featuresJSON:s,graphics:o,layerView:n,query:l},i)),!s&&!o&&n&&"queryClassBreaks"in n?n.queryClassBreaks(l,m,{signal:i}):s?this.workerClient.classBreaks(m,s):g({attribute:m,features:o})}async _heatmapStatsFromMemory(e){const{view:t,field:r,radius:a,signal:s}=e;i(t,"InMemoryLayerAdapter: must have a view");try{const r=await t.whenLayerView(this.layer);if("queryHeatmapStatistics"in r&&!r.updating&&!e.filter)return await r.queryHeatmapStatistics({field:e.field,radius:e.radius})}catch{o(s)}const{featuresJSON:n,graphics:l}=await this._processStatsFromMemoryParams({...e,returnGeometry:!0}),u=new f({extent:t.extent,tolerance:"2d"===t.type?t.state.resolution:t.pixelSizeAt?.(t.center)}),p={field:r,radius:a,transform:m(u),spatialReference:t.spatialReference?.toJSON(),size:t.size};return n?.length||l?.length?n?this.workerClient.heatmapStatistics(p,n):F({attribute:p,features:l}):{min:null,max:null}}getField(e=""){return this.layer.getField(e)}getFieldUsageInfo(e){return this.getField(e)?{supportsLabelingInfo:!0,supportsRenderer:!0,supportsPopupTemplate:!0,supportsLayerQuery:!0,supportsStatistics:!0}:null}getFieldDomain(e,t){return this.layer.getFieldDomain(e,t)}createQuery(){return this.layer.createQuery()}async summaryStatistics(e){const{field:t,valueExpression:a,sqlExpression:i,features:s,view:o}=e,n=t?this.getField(t):null,l=!!a,u="3d"===o?.type;if(!a&&i&&!this.supportsSQLExpression)throw new r(`${this.adapterName}:not-supported`,"Layer does not support standardized SQL expression for queries");return l||s||u?this._summaryStatsFromMemory(e,n):this._summaryStatsFromClientQuery(e,n)}async uniqueValues(e){const{valueExpression:t,sqlExpression:a,features:i,view:s}=e,o=await J(e,this),n=!!t,l="3d"===s?.type;if(!t&&a&&!this.supportsSQLExpression)throw new r(`${this.adapterName}:not-supported`,"Layer does not support standardized SQL expression for queries");return n||i||l?this._uvFromMemory(e,o):this._uvFromClientQuery(e,o)}async histogram(e){const{features:t,valueExpression:a,normalizationType:i,sqlExpression:s}=e,o=t||!!a;if(!a&&s&&!this.supportsSQLExpression)throw new r(`${this.adapterName}:not-supported`,"Layer does not support standardized SQL expression for queries");return o||i?this._histogramFromMemory(e):this._histogramForField(e)}async classBreaks(e){return!1!==e.analyzeData?this._classBreaksFromMemory(e):this._classBreaksFromInterpolation(e)}async queryFeatureCount(e){const{whereClause:t,view:a,signal:i}=e;if(!a)throw new r(`${this.adapterName}:insufficient-data`,"view is required to fetch the features from layerView");const s=this.layer.createQuery();s.where=S(s.where,t);const o=await a.whenLayerView(this.layer);return await n(()=>!o.updating,i),o.queryFeatureCount(s,{signal:i})}async generateRenderer(e,t){throw new r(`${this.adapterName}:not-supported`,"Layer does not support generateRenderer operation")}async predominantCategories(e){const{fields:t,view:r,signal:a,filter:i}=e,s=c(t),o=await this._uvFromMemory({valueExpression:s,view:r,signal:a,filter:i});return B(o.uniqueValueInfos,t)}async heatmapStatistics(e){return this._heatmapStatsFromMemory(e)}async getSampleFeatures(e,a){const{view:i,sampleSize:s,requiredFields:o,returnGeometry:n,filter:l,signal:u}=e,m=this.layer.createQuery(),p=1;if(m.outSpatialReference=i?.spatialReference,m.returnGeometry=!!n,m.outFields=o,I(m,l),!i)throw new r(`${this.adapterName}:not-supported`,"view is required to get sample features for Layer");const y=await i.whenLayerView(this.layer);if(b(this,o,y).length)throw new r(`${this.adapterName}:not-supported`,"Required fields need to be passed in the outFields for Layer");const f=await this._fetchFeaturesFromMemory(y,m,u,a),c=null!=s&&s>0&&s<=f.length?s:f.length;return t(f,c,p)}load(e){const t=this.layer.load(e).then(async t=>{this.geometryType=t.geometryType,this.objectIdField=t.objectIdField,this.supportsSQLExpression="stream"===t.type||!!t.capabilities?.query?.supportsSqlExpression,this.minScale=t.minScale,this.maxScale=t.maxScale,this.fullExtent="fullExtent"in t?t.fullExtent:t.parent?.fullExtent,this._hasLocalSource=!1,this.hasQueryEngine=!0,this.workerClient=q.getInstance(),await this.workerClient.open(e.signal)});return this.addResolvingPromise(t),Promise.resolve(this)}};e([l({readOnly:!0})],D.prototype,"adapterName",void 0),e([l({constructOnly:!0})],D.prototype,"layer",void 0),D=e([u("esri.smartMapping.support.adapters.InMemoryLayerAdapter")],D);export{D as default};
|
|
2
|
+
import{__decorate as e}from"tslib";import{pickRandom as t}from"../../../core/arrayUtils.js";import r from"../../../core/Error.js";import a from"../../../core/Logger.js";import{assertIsSome as i}from"../../../core/maybe.js";import{timeout as s,throwIfAborted as o}from"../../../core/promiseUtils.js";import{whenOnce as n}from"../../../core/reactiveUtils.js";import{property as l,subclass as u}from"../../../core/accessorSupport/decorators.js";import{toQuantizationTransform as m}from"../../../geometry/support/quantizationUtils.js";import{kebabDict as p}from"../../../layers/support/fieldType.js";import{isTimeOnlyField as y}from"../../../layers/support/fieldUtils.js";import f from"../../../rest/support/QuantizationParameters.js";import{getArcadeForPredominantCategory as c}from"../../statistics/support/predominanceUtils.js";import{summaryStatistics as d,uniqueValues as h,histogram as w,classBreaks as g,heatmapStatistics as F}from"../../statistics/support/statsWorker.js";import{mergeWhereClauses as S}from"../../statistics/support/utils.js";import{WorkerClient as q}from"../../statistics/support/WorkerClient.js";import{getFieldsList as v,isAnyDateField as x,getFieldsFromWhereClauses as V,fieldDelimiter as _}from"../utils.js";import z from"./LayerAdapter.js";import{getHistogramAttributeDefinition as T,getAttributeBinsQuery as N,processQueryAttributeBinsResult as M}from"./support/histogramUtils.js";import{ensureFeaturesJSON as L,getSummaryStatsQuery as E,getSummaryStatisticsFromFeatureSet as C,getViewInfoParams as j,getMissingFields as b,updateQueryWithFeatureFilter as I,getUVQuery as k,getUniqueValuesFromFeatureSet as O,getBins as Q,getDomainsForFields as J,getPredominantCategoriesFromUVInfos as B}from"./support/utils.js";import{processSummaryStatisticsResult as P,createUVResult as U,resolveCBResult as A}from"../../../statistics/utils.js";import{loadArcade as $}from"../../../support/loadArcade.js";const G=5;let R=null,D=class extends z{constructor(){super(...arguments),this._hasLocalSource=!1,this.adapterName="in-memory-layer-adapter"}destroy(){this.workerClient?.destroy()}async _waitForLayerViewUpdate(e){if(!e)throw new r(`${this.adapterName}:insufficient-data`,"layerView is required to fetch the features");const t=new AbortController,i=n(()=>!e.updating,t.signal);await s(i,5e3,t).catch(e=>{throw a.getLogger(this).warn("LayerView is taking too long to update. Aborting fetch from layerView."),e})}async _fetchFeatureSetFromMemory(e,t,a){const i=this.layer;if(this._hasLocalSource&&"queryFeatures"in i)return i.queryFeatures(e);if(!t)throw new r(`${this.adapterName}:insufficient-data`,"view is required to fetch the features from layerView");const s=await t.whenLayerView(this.layer);return await this._waitForLayerViewUpdate(s),s.queryFeatures(e,{signal:a})}async _fetchFeaturesFromMemory(e,t,a,i){const s=this.layer,o="json"===i;if(this._hasLocalSource&&"queryFeatures"in s){const e=await s.queryFeatures(t);return o?L(e.features):e.features}if(await this._waitForLayerViewUpdate(e),o&&"queryFeaturesJSON"in e&&e.queryFeaturesJSON){const{features:r}=await e.queryFeaturesJSON(t,{signal:a});return r}if(!("queryFeatures"in e))throw new r(`${this.adapterName}:not-supported`,"'queryFeatures' is not supported on the layerView");const n=await e.queryFeatures(t,{signal:a});return o?L(n.features):n.features}_fetchFeaturesForStats(e,t){return v({field:e.field,field2:e.field2,field3:e.field3,normalizationField:e.normalizationField,valueExpression:e.valueExpression,fields:e.fields}).then(r=>this.getSampleFeatures({sampleSize:-1,view:e.view,returnGeometry:e.returnGeometry,filter:e.filter,requiredFields:r,sqlWhere:e.sqlWhere,signal:e.signal},t))}async _summaryStatsFromClientQuery(e,t){const{view:r,signal:a}=e,i=E(this,e,t),s=await this._fetchFeatureSetFromMemory(i,r,a),o=C(s,x(t)||y(t));return P(o,e.outStatisticTypes)}async _getNormalizationTotalFromMemory(e,t,a){const{featuresJSON:i,graphics:s,layerView:o,query:n}=t,l={include:["sum"]},u=(!i&&!s&&o&&"querySummaryStatistics"in o?await o.querySummaryStatistics(n,{field:e},{signal:a}):i?await this.workerClient.summaryStatistics({field:e,outStatisticTypes:l},i):await d({attribute:{field:e,outStatisticTypes:l},features:s??[]})).sum;if(null==u)throw new r(`${this.adapterName}:invalid`,"invalid normalizationTotal");return u}async _summaryStatsFromMemory(e,t){const{view:r,field:a,valueExpression:i,normalizationType:s,signal:o}=e,n={field:a,valueExpression:i,normalizationType:s,normalizationField:e.normalizationField,normalizationTotal:e.normalizationTotal,minValue:e.minValue,maxValue:e.maxValue,outStatisticTypes:e.outStatisticTypes},{featuresJSON:l,graphics:u,layerView:m,query:y,fieldInfos:f}=await this._processStatsFromMemoryParams({...e,layerViewFunc:"querySummaryStatistics"});return i&&r&&(l||u)&&(n.fieldType=t?.type?p.toJSON(t.type):null,n.viewInfoParams=j(r),n.timeZone=r.timeZone,n.fieldInfos=f),"percent-of-total"===s&&null==e.normalizationTotal&&(n.normalizationTotal=await this._getNormalizationTotalFromMemory(a,{featuresJSON:l,graphics:u,layerView:m,query:y},o)),!l&&!u&&m&&"querySummaryStatistics"in m?m.querySummaryStatistics(y,n,{signal:o}):l?this.workerClient.summaryStatistics(n,l):d({attribute:n,features:u})}async _getFilteredFeatures(e,t){let r=e;const a=t?.geometry;if("intersects"===t?.spatialRelationship&&a){const t=await import("../../../geometry/operators/intersectionOperator.js");r=e.filter(({geometry:e})=>!(!e||!t.execute(e,a)))}return e.length&&"declaredClass"in e[0]&&"esri.Graphic"===e[0].declaredClass?{graphics:r}:{featuresJSON:r}}async _processStatsFromMemoryParams(e){const{features:t,filter:r}=e;if(t?.length)return this._getFilteredFeatures(t,r);const{view:a,field:i,field2:s,field3:o,normalizationField:n,valueExpression:l,sqlExpression:u,sqlWhere:m,layerViewFunc:p,signal:y}=e;let f=e.returnGeometry;if(null==f&&l){if(!R){const{arcadeUtils:e}=await $();R=e}const e=R.hasGeometryOperations(l);e&&await R.enableGeometryOperations(),f=e}let c=null,d=null,h=null,w=null,g=null;if(a)try{const e="subtype-sublayer"===this.layer.type?this.layer.parent:this.layer;c=await a.whenLayerView(e),d=null!=p&&null!=c&&p in c&&"function"==typeof c[p]}catch{d=!1}if(d)try{await this._waitForLayerViewUpdate(c);const e=await v({field:i,field2:s,field3:o,normalizationField:n,valueExpression:l,fields:await V([u,m],this.layer.fieldsIndex)});b(this,e,c).length?d=!1:(h=this.layer.createQuery(),h.outFields=e,h.returnGeometry=!1,h.where=S(h.where,m),I(h,r)),c.suspended&&(d=!1)}catch{d=!1}return d||(w=await this._fetchFeaturesForStats({field:i,field2:s,field3:o,fields:await V([u,m],this.layer.fieldsIndex),valueExpression:l,normalizationField:n,returnGeometry:f,filter:r,sqlWhere:m,view:a,signal:y},"json"),g=(await v({valueExpression:l})).map(e=>this.getField(e)?.toJSON()).filter(Boolean)),{layerView:c,query:h,featuresJSON:w,fieldInfos:g}}async _uvFromClientQuery(e,t){const{view:r,signal:a}=e,i=k(this,e),s=await this._fetchFeatureSetFromMemory(i,r,a),o=await O(s,{layer:this,field:e.field,field2:e.field2,field3:e.field3,fieldDelimiter:_,view:e.view,signal:e.signal});return U(o,t,e.returnAllCodedValues,_)}async _uvFromMemory(e,t){const{view:r,field:a,valueExpression:i,returnAllCodedValues:s,signal:o}=e,{featuresJSON:n,graphics:l,layerView:u,query:m,fieldInfos:p}=await this._processStatsFromMemoryParams({...e,layerViewFunc:"queryUniqueValues"}),y={field:a,field2:e.field2,field3:e.field3,fieldDelimiter:_,valueExpression:i,domains:t,returnAllCodedValues:s};return i&&r&&(n||l)&&(y.viewInfoParams=j(r),y.timeZone=r.timeZone,y.fieldInfos=p),!n&&!l&&u&&"queryUniqueValues"in u?u.queryUniqueValues(m,y,{signal:o}):n?this.workerClient.uniqueValues(y,n):h({attribute:y,features:l})}_histogramForField(e){let t=null;return t=null!=e.minValue&&null!=e.maxValue?Promise.resolve({min:e.minValue,max:e.maxValue}):this.summaryStatistics({...e,outStatisticTypes:{include:["min","max","count"]}}).then(e=>{if(!e.count)throw new r(`${this.adapterName}:insufficient-data`,"Either the layer has no features or none of the features have data for the field");return{min:e.min,max:e.max}}),t.then(t=>Q(this,{min:t.min,max:t.max},e.field,e.numBins??void 0,e.view,e.filter,e.signal))}async _histogramFromQueryAttributeBinsFromMemory(e){const{field:t,normalizationType:r,signal:a}=e,i=await this._processStatsFromMemoryParams({...e,layerViewFunc:"queryAttributeBins"}),{featuresJSON:s,graphics:o,layerView:n,query:l}=i,u="percent-of-total"===r?e.normalizationTotal??await this._getNormalizationTotalFromMemory(t,i,a):void 0;if(!n||!("queryAttributeBins"in n)||s||o){const t=T(e,i,u);return s?this.workerClient.histogram(t,s):w({attribute:t,features:o})}const{query:m,min:p,max:y}=await N(e,this,u,l);if(!m)return{bins:[],minValue:p,maxValue:y,normalizationTotal:u};const f=await n.queryAttributeBins(m,{signal:a});return M(f,t?this.getField(t):null,{minValue:p,maxValue:y,normalizationTotal:u})}async _histogramFromMemory(e){const{field:t,signal:r}=e,a=await this._processStatsFromMemoryParams({...e,layerViewFunc:"queryHistogram"}),{featuresJSON:i,graphics:s,layerView:o,query:n}=a,l="percent-of-total"===e.normalizationType?e.normalizationTotal??await this._getNormalizationTotalFromMemory(t,a,r):void 0,u=T(e,a,l);return!i&&!s&&o&&"queryHistogram"in o?o.queryHistogram(n,u,{signal:r}):i?this.workerClient.histogram(u,i):w({attribute:u,features:s})}_classBreaksFromInterpolation(e){const{minValue:t,maxValue:r}=e,a=e.numClasses||G,i=[],s=(r-t)/a;for(let l=0;l<a;l++){const e=t+l*s;i.push({minValue:e,maxValue:e+s})}i[a-1].maxValue=r;const o={classBreaks:i,normalizationTotal:e.normalizationTotal},n=A(o,e.classificationMethod);return Promise.resolve(n)}async _classBreaksFromMemory(e){const{view:t,field:r,valueExpression:a,signal:i}=e,{featuresJSON:s,graphics:o,layerView:n,query:l,fieldInfos:u}=await this._processStatsFromMemoryParams({...e,layerViewFunc:"queryClassBreaks"}),m={field:r,valueExpression:a,normalizationType:e.normalizationType,normalizationField:e.normalizationField,normalizationTotal:e.normalizationTotal,minValue:e.minValue,maxValue:e.maxValue,standardDeviationInterval:e.standardDeviationInterval,classificationMethod:e.classificationMethod,numClasses:e.numClasses};return a&&t&&(s||o)&&(m.viewInfoParams=j(t),m.timeZone=t.timeZone,m.fieldInfos=u),"percent-of-total"===e.normalizationType&&null==e.normalizationTotal&&(m.normalizationTotal=await this._getNormalizationTotalFromMemory(r,{featuresJSON:s,graphics:o,layerView:n,query:l},i)),!s&&!o&&n&&"queryClassBreaks"in n?n.queryClassBreaks(l,m,{signal:i}):s?this.workerClient.classBreaks(m,s):g({attribute:m,features:o})}async _heatmapStatsFromMemory(e){const{view:t,field:r,radius:a,signal:s}=e;i(t,"InMemoryLayerAdapter: must have a view");try{const r=await t.whenLayerView(this.layer);if("queryHeatmapStatistics"in r&&!r.updating&&!e.filter)return await r.queryHeatmapStatistics({field:e.field,radius:e.radius})}catch{o(s)}const{featuresJSON:n,graphics:l}=await this._processStatsFromMemoryParams({...e,returnGeometry:!0}),u=new f({extent:t.extent,tolerance:"2d"===t.type?t.state.resolution:t.pixelSizeAt?.(t.center)}),p={field:r,radius:a,transform:m(u),spatialReference:t.spatialReference?.toJSON(),size:t.size};return n?.length||l?.length?n?this.workerClient.heatmapStatistics(p,n):F({attribute:p,features:l}):{min:null,max:null}}getField(e=""){return this.layer.getField(e)}getFieldUsageInfo(e){return this.getField(e)?{supportsLabelingInfo:!0,supportsRenderer:!0,supportsPopupTemplate:!0,supportsLayerQuery:!0,supportsStatistics:!0}:null}getFieldDomain(e,t){return this.layer.getFieldDomain(e,t)}createQuery(){return this.layer.createQuery()}async summaryStatistics(e){const{field:t,valueExpression:a,sqlExpression:i,features:s,view:o}=e,n=t?this.getField(t):null,l=!!a,u="3d"===o?.type;if(!a&&i&&!this.supportsSQLExpression)throw new r(`${this.adapterName}:not-supported`,"Layer does not support standardized SQL expression for queries");return l||s||u?this._summaryStatsFromMemory(e,n):this._summaryStatsFromClientQuery(e,n)}async uniqueValues(e){const{valueExpression:t,sqlExpression:a,features:i,view:s}=e,o=await J(e,this),n=!!t,l="3d"===s?.type;if(!t&&a&&!this.supportsSQLExpression)throw new r(`${this.adapterName}:not-supported`,"Layer does not support standardized SQL expression for queries");return n||i||l?this._uvFromMemory(e,o):this._uvFromClientQuery(e,o)}async histogram(e){const{features:t,valueExpression:a,normalizationType:i,sqlExpression:s}=e,o=t||!!a;if(!a&&s&&!this.supportsSQLExpression)throw new r(`${this.adapterName}:not-supported`,"Layer does not support standardized SQL expression for queries");return o||i?this._histogramFromMemory(e):this._histogramForField(e)}async classBreaks(e){return!1!==e.analyzeData?this._classBreaksFromMemory(e):this._classBreaksFromInterpolation(e)}async queryFeatureCount(e){const{whereClause:t,view:a,signal:i}=e;if(!a)throw new r(`${this.adapterName}:insufficient-data`,"view is required to fetch the features from layerView");const s=this.layer.createQuery();s.where=S(s.where,t);const o=await a.whenLayerView(this.layer);return await n(()=>!o.updating,i),o.queryFeatureCount(s,{signal:i})}async generateRenderer(e,t){throw new r(`${this.adapterName}:not-supported`,"Layer does not support generateRenderer operation")}async predominantCategories(e){const{fields:t,view:r,signal:a,filter:i}=e,s=c(t),o=await this._uvFromMemory({valueExpression:s,view:r,signal:a,filter:i});return B(o.uniqueValueInfos,t)}async heatmapStatistics(e){return this._heatmapStatsFromMemory(e)}async getSampleFeatures(e,a){const{view:i,sampleSize:s,requiredFields:o,returnGeometry:n,sqlWhere:l,filter:u,signal:m}=e,p=this.layer.createQuery(),y=1;if(p.outSpatialReference=i?.spatialReference,p.returnGeometry=!!n,p.outFields=o,p.where=S(p.where,l),I(p,u),!i)throw new r(`${this.adapterName}:not-supported`,"view is required to get sample features for Layer");const f=await i.whenLayerView(this.layer);if(b(this,o,f).length)throw new r(`${this.adapterName}:not-supported`,"Required fields need to be passed in the outFields for Layer");const c=await this._fetchFeaturesFromMemory(f,p,m,a),d=null!=s&&s>0&&s<=c.length?s:c.length;return t(c,d,y)}load(e){const t=this.layer.load(e).then(async t=>{this.geometryType=t.geometryType,this.objectIdField=t.objectIdField,this.supportsSQLExpression="stream"===t.type||!!t.capabilities?.query?.supportsSqlExpression,this.minScale=t.minScale,this.maxScale=t.maxScale,this.fullExtent="fullExtent"in t?t.fullExtent:t.parent?.fullExtent,this._hasLocalSource=!1,this.hasQueryEngine=!0,this.workerClient=q.getInstance(),await this.workerClient.open(e.signal)});return this.addResolvingPromise(t),Promise.resolve(this)}};e([l({readOnly:!0})],D.prototype,"adapterName",void 0),e([l({constructOnly:!0})],D.prototype,"layer",void 0),D=e([u("esri.smartMapping.support.adapters.InMemoryLayerAdapter")],D);export{D as default};
|
|
@@ -1,2 +1,2 @@
|
|
|
1
1
|
/* COPYRIGHT Esri - https://js.arcgis.com/5.1/LICENSE.txt */
|
|
2
|
-
import{convertDateTimeFieldFormatToIntlOptions as t,convertDateFormatToIntlOptions as e,formatDate as n,formatTimestamp as r,formatTimeOnly as o,formatDateOnly as i}from"../../intl/date.js";import{isDateField as s,isDateOnlyField as a,isTimestampOffsetField as l}from"../../layers/support/fieldUtils.js";import{getWellKnownBasemapId as u}from"../../support/basemapUtils.js";import{loadArcade as f}from"../../support/loadArcade.js";import{utc as
|
|
2
|
+
import{convertDateTimeFieldFormatToIntlOptions as t,convertDateFormatToIntlOptions as e,formatDate as n,formatTimestamp as r,formatTimeOnly as o,formatDateOnly as i}from"../../intl/date.js";import{isDateField as s,isDateOnlyField as a,isTimestampOffsetField as l}from"../../layers/support/fieldUtils.js";import{getWellKnownBasemapId as u}from"../../support/basemapUtils.js";import{loadArcade as f}from"../../support/loadArcade.js";import{utc as c}from"../../time/constants.js";import{getTimeZoneFormattingOptions as m}from"../../time/timeZoneUtils.js";const d=",",p={light:["streets","gray","topo","terrain","oceans","osm","gray-vector","streets-vector","topo-vector","streets-relief-vector","streets-navigation-vector","topo-3d","navigation-3d","streets-3d","osm-3d","gray-3d"],dark:["satellite","hybrid","dark-gray","dark-gray-vector","streets-night-vector","navigation-dark-3d","streets-dark-3d","dark-gray-3d"]},g="percent-of-total",y="field",h={exclude:["median"]},v={years:365,months:30,days:1,hours:1/24,minutes:1/1440,seconds:1/86400,milliseconds:1/864e5},T=new Set(["integer","small-integer"]);let w,Z=null;const $=["date","date-only","timestamp-offset"];function C(t){return s(t)||a(t)||l(t)}async function U(t,e){if(!t)return null;if(!w){const t=await import("../../core/sql/WhereClauseCache.js").then(t=>t.WhereClauseCache);w=new t(50,500)}return w.get(t,e)}async function S(t){const{field:e,field2:n,field3:r,normalizationField:o,valueExpression:i,fields:s}=t;let a=[];if(i){if(!Z){const{arcadeUtils:t}=await f();Z=t}a=Z.extractFieldNames(i)}return e&&a.push(e),n&&a.push(n),r&&a.push(r),o&&a.push(o),s&&a.push(...s),a}async function F(t,e){const n=[];for(const r of t)if(r){const t=await U(r,e),o=t?.fieldNames;o&&n.push(...o)}return[...new Set(n)]}function j(t){let e=t.normalizationType;return e||(t.normalizationField?e=y:null!=t.normalizationTotal&&(e=g)),e??void 0}function k(t){return String(t).padStart(2,"0")}function D(t,e,n){let r;if("date"===e||"number"===e){"number"===e&&(t=new Date(t));r=`TIMESTAMP'${n?t.getFullYear():t.getUTCFullYear()}-${k((n?t.getMonth():t.getUTCMonth())+1)}-${k(n?t.getDate():t.getUTCDate())} ${k(n?t.getHours():t.getUTCHours())}:${k(n?t.getMinutes():t.getUTCMinutes())}:${k(n?t.getSeconds():t.getUTCSeconds())}'`}else r=t;return r}function N(t,e,n,r){const{hasQueryEngine:o}=t,i=`(${D(n,b(t,n),o)} - ${D(e,b(t,e),o)})`;let s=v[r],a="/";s<1&&(s=1/s,a="*");return{sqlExpression:1===s?i:`(${i} ${a} ${s})`,sqlWhere:null}}function b(t,e){if(e instanceof Date)return"date";if("number"==typeof e)return"number";if("string"==typeof e){const n=t.getField(e);if("<now>"===e.toLowerCase())return;if(s(n))return"field"}}function M(t,e=p){for(const n in e)if(e[n].includes(t))return n}function x(t,e,n=!0){let r=null;return t&&("string"==typeof t?e.includes(t)&&(r=t):r=u(t)),n?r||"gray":r}function z(t,e){const n=e&&t.getField(e);return!!n&&T.has(n.type)}function E(t){return`cast(${t} as float)`}function q(s,a){const{format:l,fieldFormat:u,timeZoneOptions:f,fieldType:d}=a??{},p=u?t(u):null;let g,y;if(f&&({timeZone:g,timeZoneName:y}=m(f.layerTimeZone,f.datesInUnknownTimezone,f.viewTimeZone,p||e(l||"short-date-short-time"),d)),"string"==typeof s&&isNaN(Date.parse("time-only"===d?`1970-01-01T${s}Z`:s)))return s;switch(d){case"date-only":{const t=p||e(l||"short-date");return"string"==typeof s?i(s,{...t}):n(s,{...t,timeZone:c})}case"time-only":{const t=p||e(l||"short-time");return"string"==typeof s?o(s,t):n(s,{...t,timeZone:c})}case"timestamp-offset":{if(!g&&"string"==typeof s&&new Date(s).toISOString()!==s)return s;const t=l||p||f?p||e(l||"short-date-short-time"):void 0,o=t?{...t,timeZone:g,timeZoneName:y}:void 0;return"string"==typeof s?r(s,o):n(s,o)}default:{const t=l||p||f?p||e(l||"short-date-short-time"):void 0;return n("string"==typeof s?new Date(s):s,t?{...t,timeZone:g,timeZoneName:y}:void 0)}}}export{E as castIntegerFieldToFloat,$ as dateTypes,p as defaultBasemapGroups,h as defaultStatisticTypes,d as fieldDelimiter,q as formatAnyDate,M as getBasemapGroup,x as getBasemapId,N as getDateDiffSQL,b as getDateType,F as getFieldsFromWhereClauses,S as getFieldsList,j as getNormalizationType,U as getWhereClause,C as isAnyDateField,z as isIntegerField,v as unitValueInDays};
|
|
@@ -146,10 +146,10 @@ export interface GetSchemesParameters {
|
|
|
146
146
|
* Possible values are listed below.
|
|
147
147
|
* | Value | Description | Example |
|
|
148
148
|
* | ----- | ----------- | ------- |
|
|
149
|
-
* | high-to-low | High values are emphasized with strong colors. |  are visualized with weak colors while other values are emphasized with strong colors. |  are emphasized with strong colors while other values are visualized with weak colors. |  |
|
|
150
|
+
* | above-and-below | Values centered around a given point (e.g. the average) are visualized with weak colors while other values are emphasized with strong colors. |  |
|
|
151
|
+
* | centered-on | Values centered around a given point (e.g. the average) are emphasized with strong colors while other values are visualized with weak colors. |  |
|
|
152
|
+
* | extremes | High and low values are emphasized with strong colors. All others are visualized with weak colors. |  |
|
|
153
153
|
*/
|
|
154
154
|
theme?: "high-to-low" | "above-and-below" | "centered-on" | "extremes";
|
|
155
155
|
/**
|
|
@@ -96,8 +96,8 @@ export interface GetSchemesParameters {
|
|
|
96
96
|
* Possible values are listed below.
|
|
97
97
|
* | Value | Description | Example |
|
|
98
98
|
* | ----- | ----------- | ------- |
|
|
99
|
-
* | flow-line | Renders the uv and magnitude data as animated flow lines. This is ideal for representing wind and other atmospheric data. |  |
|
|
100
|
+
* | wave-front | Renders UV and magnitude data in a wave-like animation. This theme works well for ocean data. |  |
|
|
101
101
|
*
|
|
102
102
|
* > [!WARNING]
|
|
103
103
|
* >
|
|
@@ -79,10 +79,10 @@ export interface ColorSchemeForPoint {
|
|
|
79
79
|
* Possible values are listed below.
|
|
80
80
|
* | Value | Description | Example |
|
|
81
81
|
* | ----- | ----------- | ------- |
|
|
82
|
-
* | high-to-low | High values are emphasized with strong colors. |  are visualized with weak colors while other values are emphasized with strong colors. |  are emphasized with strong colors while other values are visualized with weak colors. |  |
|
|
83
|
+
* | above-and-below | Values centered around a given point (e.g. the average) are visualized with weak colors while other values are emphasized with strong colors. |  |
|
|
84
|
+
* | centered-on | Values centered around a given point (e.g. the average) are emphasized with strong colors while other values are visualized with weak colors. |  |
|
|
85
|
+
* | extremes | High and low values are emphasized with strong colors. All others are visualized with weak colors. |  |
|
|
86
86
|
*
|
|
87
87
|
* @since 5.0
|
|
88
88
|
*/
|
|
@@ -156,10 +156,10 @@ export interface ColorSchemeForPolyline {
|
|
|
156
156
|
* Possible values are listed below.
|
|
157
157
|
* | Value | Description | Example |
|
|
158
158
|
* | ----- | ----------- | ------- |
|
|
159
|
-
* | high-to-low | High values are emphasized with strong colors. |  are visualized with weak colors while other values are emphasized with strong colors. |  are emphasized with strong colors while other values are visualized with weak colors. |  |
|
|
160
|
+
* | above-and-below | Values centered around a given point (e.g. the average) are visualized with weak colors while other values are emphasized with strong colors. |  |
|
|
161
|
+
* | centered-on | Values centered around a given point (e.g. the average) are emphasized with strong colors while other values are visualized with weak colors. |  |
|
|
162
|
+
* | extremes | High and low values are emphasized with strong colors. All others are visualized with weak colors. |  |
|
|
163
163
|
*
|
|
164
164
|
* @since 5.0
|
|
165
165
|
*/
|
|
@@ -227,10 +227,10 @@ export interface ColorSchemeForPolygon {
|
|
|
227
227
|
* Possible values are listed below.
|
|
228
228
|
* | Value | Description | Example |
|
|
229
229
|
* | ----- | ----------- | ------- |
|
|
230
|
-
* | high-to-low | High values are emphasized with strong colors. |  are visualized with weak colors while other values are emphasized with strong colors. |  are emphasized with strong colors while other values are visualized with weak colors. |  |
|
|
231
|
+
* | above-and-below | Values centered around a given point (e.g. the average) are visualized with weak colors while other values are emphasized with strong colors. |  |
|
|
232
|
+
* | centered-on | Values centered around a given point (e.g. the average) are emphasized with strong colors while other values are visualized with weak colors. |  |
|
|
233
|
+
* | extremes | High and low values are emphasized with strong colors. All others are visualized with weak colors. |  |
|
|
234
234
|
*
|
|
235
235
|
* @since 5.0
|
|
236
236
|
*/
|
|
@@ -298,10 +298,10 @@ export interface ColorSchemeForMesh {
|
|
|
298
298
|
* Possible values are listed below.
|
|
299
299
|
* | Value | Description | Example |
|
|
300
300
|
* | ----- | ----------- | ------- |
|
|
301
|
-
* | high-to-low | High values are emphasized with strong colors. |  are visualized with weak colors while other values are emphasized with strong colors. |  are emphasized with strong colors while other values are visualized with weak colors. |  |
|
|
302
|
+
* | above-and-below | Values centered around a given point (e.g. the average) are visualized with weak colors while other values are emphasized with strong colors. |  |
|
|
303
|
+
* | centered-on | Values centered around a given point (e.g. the average) are emphasized with strong colors while other values are visualized with weak colors. |  |
|
|
304
|
+
* | extremes | High and low values are emphasized with strong colors. All others are visualized with weak colors. |  |
|
|
305
305
|
*
|
|
306
306
|
* @since 5.0
|
|
307
307
|
*/
|
|
@@ -1749,8 +1749,8 @@ export interface FlowScheme {
|
|
|
1749
1749
|
* Possible values are listed below.
|
|
1750
1750
|
* | Value | Description | Example |
|
|
1751
1751
|
* | ----- | ----------- | ------- |
|
|
1752
|
-
* | flow-line | Renders the uv and magnitude data as animated flow lines. This is ideal for representing wind and other atmospheric data. |  |
|
|
1753
|
+
* | wave-front | Renders UV and magnitude data in a wave-like animation. This theme works well for ocean data. |  |
|
|
1754
1754
|
*
|
|
1755
1755
|
* > [!WARNING]
|
|
1756
1756
|
* >
|
package/support/revision.js
CHANGED
|
@@ -1,2 +1,2 @@
|
|
|
1
1
|
/* COPYRIGHT Esri - https://js.arcgis.com/5.1/LICENSE.txt */
|
|
2
|
-
const
|
|
2
|
+
const b="20260218",d="7ca8a2db1dd4cb806053b4fe22d33e0052b5524b";export{b as buildDate,d as commitHash};
|
package/symbols/CIMSymbol.d.ts
CHANGED
|
@@ -210,7 +210,7 @@ export interface CIMSymbolProperties extends SymbolProperties, Partial<Pick<CIMS
|
|
|
210
210
|
*
|
|
211
211
|
* The [symbolService](https://developers.arcgis.com/javascript/latest/references/core/rest/symbolService/) can be used to create a CIMSymbol from SVG.
|
|
212
212
|
*
|
|
213
|
-
* 
|
|
214
214
|
*
|
|
215
215
|
* <span id="known-limitations"></span>
|
|
216
216
|
* > [!WARNING]
|
|
@@ -13,7 +13,7 @@ export interface FillSymbol3DLayerProperties extends Symbol3DLayerProperties, Pa
|
|
|
13
13
|
/**
|
|
14
14
|
* Sets the contour edges on 3D Objects. This is only applicable for [MeshSymbol3D](https://developers.arcgis.com/javascript/latest/references/core/symbols/MeshSymbol3D/).
|
|
15
15
|
*
|
|
16
|
-
* 
|
|
17
17
|
*
|
|
18
18
|
* @since 4.7
|
|
19
19
|
* @example
|
|
@@ -131,7 +131,7 @@ export interface FillSymbol3DLayerProperties extends Symbol3DLayerProperties, Pa
|
|
|
131
131
|
* The image below depicts a polygon [FeatureLayer](https://developers.arcgis.com/javascript/latest/references/core/layers/FeatureLayer/) whose features are
|
|
132
132
|
* symbolized with a [PolygonSymbol3D](https://developers.arcgis.com/javascript/latest/references/core/symbols/PolygonSymbol3D/) containing a FillSymbol3DLayer.
|
|
133
133
|
*
|
|
134
|
-
* 
|
|
135
135
|
*
|
|
136
136
|
* See [Symbol3DLayer](https://developers.arcgis.com/javascript/latest/references/core/symbols/Symbol3DLayer/) and [Symbol3D](https://developers.arcgis.com/javascript/latest/references/core/symbols/Symbol3D/) to read
|
|
137
137
|
* more general information about 3D symbols, symbol layers and how they relate to one another.
|
|
@@ -172,7 +172,7 @@ export default class FillSymbol3DLayer extends Symbol3DLayer {
|
|
|
172
172
|
/**
|
|
173
173
|
* Sets the contour edges on 3D Objects. This is only applicable for [MeshSymbol3D](https://developers.arcgis.com/javascript/latest/references/core/symbols/MeshSymbol3D/).
|
|
174
174
|
*
|
|
175
|
-
* 
|
|
176
176
|
*
|
|
177
177
|
* @since 4.7
|
|
178
178
|
* @example
|
|
@@ -136,7 +136,7 @@ export interface IconSymbol3DLayerProperties extends Symbol3DLayerProperties, Pa
|
|
|
136
136
|
*
|
|
137
137
|
* Draped icons | Billboarded icons
|
|
138
138
|
* -------------|------------------
|
|
139
|
-
* [](https://developers.arcgis.com/javascript/latest/sample-code/visualization-multivariate-2d/) | [](https://developers.arcgis.com/javascript/latest/sample-code/symbols-points-3d/)
|
|
140
140
|
*
|
|
141
141
|
* The ability to drape and billboard icons is controlled in the
|
|
142
142
|
* [FeatureLayer.elevationInfo](https://developers.arcgis.com/javascript/latest/references/core/layers/FeatureLayer/#elevationInfo) property of the
|
|
@@ -71,12 +71,12 @@ export interface LabelSymbol3DProperties extends Symbol3DProperties {
|
|
|
71
71
|
*
|
|
72
72
|
* [Symbol3DLayer](https://developers.arcgis.com/javascript/latest/references/core/symbols/Symbol3DLayer/) Type | Flat/Volumetric | Size Units | Example
|
|
73
73
|
* ------------|-----------|------------|-----------
|
|
74
|
-
* [TextSymbol3DLayer](https://developers.arcgis.com/javascript/latest/references/core/symbols/TextSymbol3DLayer/)| flat | points | | flat | points | 
|
|
75
75
|
*
|
|
76
76
|
* The image below depicts a [FeatureLayer](https://developers.arcgis.com/javascript/latest/references/core/layers/FeatureLayer/) with labels defined
|
|
77
77
|
* by LabelSymbol3D.
|
|
78
78
|
*
|
|
79
|
-
* 
|
|
80
80
|
*
|
|
81
81
|
* @since 4.0
|
|
82
82
|
* @see [Symbol Builder](https://developers.arcgis.com/javascript/latest/visualization/symbols-color-ramps/symbol-builder/)
|
|
@@ -16,7 +16,7 @@ export interface LineStyleMarker3DProperties extends Partial<Pick<LineStyleMarke
|
|
|
16
16
|
* Markers can enhance the cartographic information of a line by
|
|
17
17
|
* providing additional visual cues about the associated feature.
|
|
18
18
|
*
|
|
19
|
-
* 
|
|
20
20
|
*
|
|
21
21
|
* @since 4.23
|
|
22
22
|
* @see [LineSymbol3DLayer](https://developers.arcgis.com/javascript/latest/references/core/symbols/LineSymbol3DLayer/)
|
|
@@ -66,12 +66,12 @@ export default class LineStyleMarker3D extends LineStyleMarker3DSuperclass {
|
|
|
66
66
|
*
|
|
67
67
|
* Value | Example
|
|
68
68
|
* -------|--------
|
|
69
|
-
* arrow | 
|
|
70
|
+
* circle | 
|
|
71
|
+
* square | 
|
|
72
|
+
* diamond| 
|
|
73
|
+
* cross | 
|
|
74
|
+
* x | 
|
|
75
75
|
*
|
|
76
76
|
* @default "arrow"
|
|
77
77
|
*/
|
|
@@ -29,8 +29,8 @@ export type LineSymbol3DSupportedSymbolLayerTypes = LineSymbol3DLayer | PathSymb
|
|
|
29
29
|
*
|
|
30
30
|
* [Symbol3DLayer](https://developers.arcgis.com/javascript/latest/references/core/symbols/Symbol3DLayer/) Type | Flat/Volumetric | Size Units | Example
|
|
31
31
|
* ------------|-----------|------------|-----------
|
|
32
|
-
* [LineSymbol3DLayer](https://developers.arcgis.com/javascript/latest/references/core/symbols/LineSymbol3DLayer/)| flat | points |  | volumetric | meters | | flat | points | 
|
|
33
|
+
* [PathSymbol3DLayer](https://developers.arcgis.com/javascript/latest/references/core/symbols/PathSymbol3DLayer/) | volumetric | meters | 
|
|
34
34
|
*
|
|
35
35
|
* See [Symbol3DLayer](https://developers.arcgis.com/javascript/latest/references/core/symbols/Symbol3DLayer/) and [Symbol3D](https://developers.arcgis.com/javascript/latest/references/core/symbols/Symbol3D/) to read
|
|
36
36
|
* more general information about 3D symbols, symbol layers and how they relate to one another.
|