biopipen 0.34.0__py3-none-any.whl → 0.34.2__py3-none-any.whl
This diff represents the content of publicly available package versions that have been released to one of the supported registries. The information contained in this diff is provided for informational purposes only and reflects changes between package versions as they appear in their respective public registries.
Potentially problematic release.
This version of biopipen might be problematic. Click here for more details.
- biopipen/__init__.py +1 -1
- biopipen/ns/scrna.py +276 -30
- biopipen/ns/tcr.py +4 -4
- biopipen/scripts/scrna/MarkersFinder.R +190 -49
- biopipen/scripts/scrna/PseudoBulkDEG.R +592 -0
- biopipen/scripts/scrna/ScFGSEA.R +101 -28
- biopipen/scripts/scrna/SeuratClusterStats-features.R +4 -0
- biopipen/scripts/scrna/TopExpressingGenes.R +9 -7
- biopipen/scripts/tcr/ClonalStats.R +1 -1
- biopipen/scripts/tcr/ScRepCombiningExpression.R +2 -2
- {biopipen-0.34.0.dist-info → biopipen-0.34.2.dist-info}/METADATA +1 -1
- {biopipen-0.34.0.dist-info → biopipen-0.34.2.dist-info}/RECORD +14 -15
- biopipen/reports/scrna/ScFGSEA.svelte +0 -16
- biopipen/reports/scrna/TopExpressingGenes.svelte +0 -17
- {biopipen-0.34.0.dist-info → biopipen-0.34.2.dist-info}/WHEEL +0 -0
- {biopipen-0.34.0.dist-info → biopipen-0.34.2.dist-info}/entry_points.txt +0 -0
biopipen/__init__.py
CHANGED
|
@@ -1 +1 @@
|
|
|
1
|
-
__version__ = "0.34.
|
|
1
|
+
__version__ = "0.34.2"
|
biopipen/ns/scrna.py
CHANGED
|
@@ -61,7 +61,8 @@ class SeuratPreparing(Proc):
|
|
|
61
61
|
Those paths should be either paths to directoies containing `matrix.mtx`,
|
|
62
62
|
`barcodes.tsv` and `features.tsv` files that can be loaded by
|
|
63
63
|
[`Seurat::Read10X()`](https://satijalab.org/seurat/reference/read10x),
|
|
64
|
-
or paths
|
|
64
|
+
or paths of loom files that can be loaded by `SeuratDisk::LoadLoom()`, or paths to
|
|
65
|
+
`h5` files that can be loaded by
|
|
65
66
|
[`Seurat::Read10X_h5()`](https://satijalab.org/seurat/reference/read10x_h5).
|
|
66
67
|
|
|
67
68
|
Each sample will be loaded individually and then merged into one `Seurat` object, and then perform QC.
|
|
@@ -110,9 +111,11 @@ class SeuratPreparing(Proc):
|
|
|
110
111
|
min_cells (type=int): The minimum number of cells that a gene must be
|
|
111
112
|
expressed in to be kept. This is used in `Seurat::CreateSeuratObject()`.
|
|
112
113
|
Futher QC (`envs.cell_qc`, `envs.gene_qc`) will be performed after this.
|
|
114
|
+
It doesn't work when data is loaded from loom files.
|
|
113
115
|
min_features (type=int): The minimum number of features that a cell must
|
|
114
116
|
express to be kept. This is used in `Seurat::CreateSeuratObject()`.
|
|
115
117
|
Futher QC (`envs.cell_qc`, `envs.gene_qc`) will be performed after this.
|
|
118
|
+
It doesn't work when data is loaded from loom files.
|
|
116
119
|
cell_qc: Filter expression to filter cells, using
|
|
117
120
|
`tidyrseurat::filter()`.
|
|
118
121
|
Available QC keys include `nFeature_RNA`, `nCount_RNA`,
|
|
@@ -194,8 +197,8 @@ class SeuratPreparing(Proc):
|
|
|
194
197
|
|
|
195
198
|
SCTransform (ns): Arguments for [`SCTransform()`](https://satijalab.org/seurat/reference/sctransform).
|
|
196
199
|
`object` is specified internally, and `-` in the key will be replaced with `.`.
|
|
197
|
-
-
|
|
198
|
-
-
|
|
200
|
+
- return-only-var-genes: Whether to return only variable genes.
|
|
201
|
+
- min_cells: The minimum number of cells that a gene must be expressed in to be kept.
|
|
199
202
|
A hidden argument of `SCTransform` to filter genes.
|
|
200
203
|
If you try to keep all genes in the `RNA` assay, you can set `min_cells` to `0` and
|
|
201
204
|
`return-only-var-genes` to `False`.
|
|
@@ -488,7 +491,7 @@ class SeuratClusterStats(Proc):
|
|
|
488
491
|
|
|
489
492
|
```toml
|
|
490
493
|
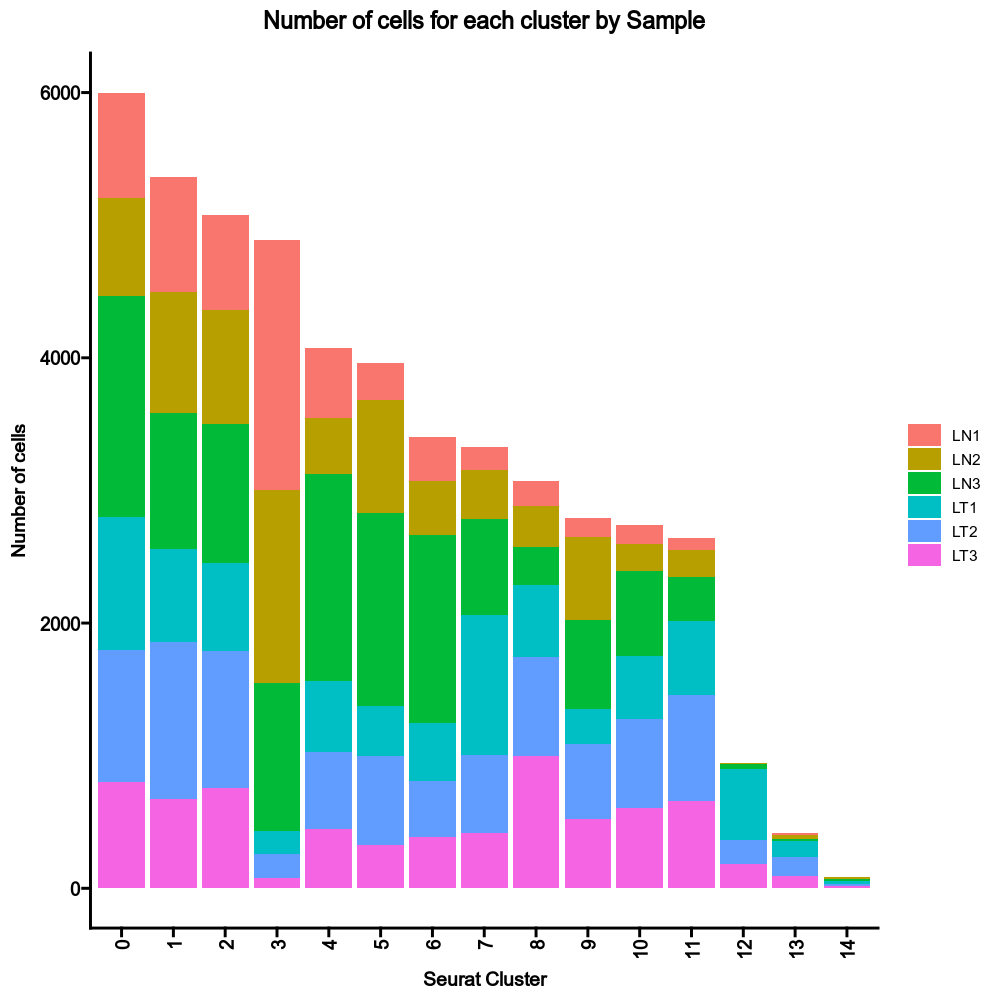
[SeuratClusterStats.envs.stats]
|
|
491
|
-
nCells_Sample = {
|
|
494
|
+
nCells_Sample = { group_by = "Sample" }
|
|
492
495
|
```
|
|
493
496
|
|
|
494
497
|
{: width="80%" }
|
|
@@ -512,8 +515,6 @@ class SeuratClusterStats(Proc):
|
|
|
512
515
|
```toml
|
|
513
516
|
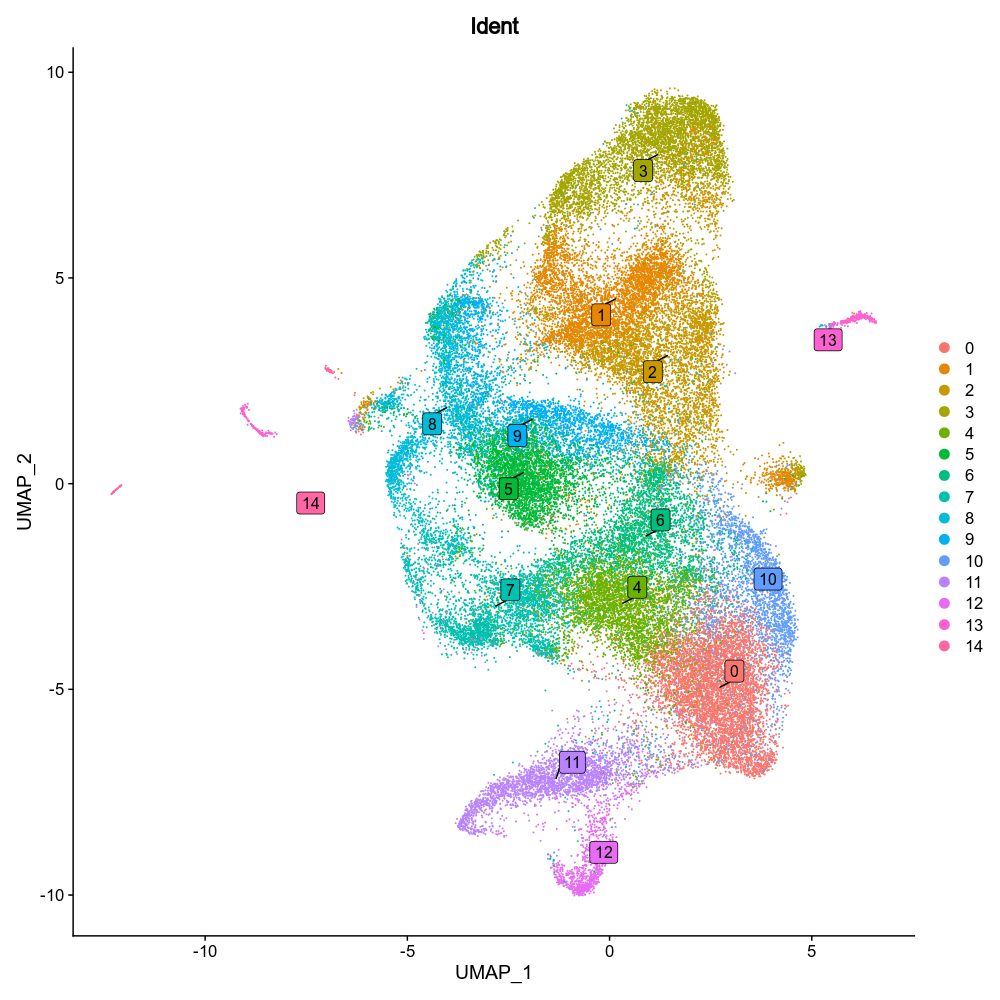
[SeuratClusterStats.envs.dimplots.Idents]
|
|
514
517
|
label = true
|
|
515
|
-
label-box = true
|
|
516
|
-
repel = true
|
|
517
518
|
```
|
|
518
519
|
|
|
519
520
|
{: width="80%" }
|
|
@@ -587,9 +588,11 @@ class SeuratClusterStats(Proc):
|
|
|
587
588
|
ngenes (type=json): The number of genes expressed in each cell.
|
|
588
589
|
Keys are the names of the plots and values are the dicts inherited from `env.ngenes_defaults`.
|
|
589
590
|
features_defaults (ns): The default parameters for `features`.
|
|
590
|
-
- features: The features to plot.
|
|
591
|
+
- features (type=auto): The features to plot.
|
|
591
592
|
It can be either a string with comma separated features, a list of features, a file path with `file://` prefix with features
|
|
592
593
|
(one per line), or an integer to use the top N features from `VariantFeatures(srtobj)`.
|
|
594
|
+
It can also be a dict with the keys as the feature group names and the values as the features, which
|
|
595
|
+
is used for heatmap to group the features.
|
|
593
596
|
- order_by (type=auto): The order of the clusters to show on the plot.
|
|
594
597
|
An expression passed to `dplyr::arrange()` on the grouped meta data frame (by `ident`).
|
|
595
598
|
For example, you can order the clusters by the activation score of
|
|
@@ -1002,11 +1005,11 @@ class DimPlots(Proc):
|
|
|
1002
1005
|
class MarkersFinder(Proc):
|
|
1003
1006
|
"""Find markers between different groups of cells
|
|
1004
1007
|
|
|
1005
|
-
When only `
|
|
1008
|
+
When only `group_by` is specified as `"seurat_clusters"` in
|
|
1006
1009
|
`envs.cases`, the markers will be found for all the clusters.
|
|
1007
1010
|
|
|
1008
1011
|
You can also find the differentially expressed genes between
|
|
1009
|
-
any two groups of cells by setting `
|
|
1012
|
+
any two groups of cells by setting `group_by` to a different
|
|
1010
1013
|
column name in metadata. Follow `envs.cases` for more details.
|
|
1011
1014
|
|
|
1012
1015
|
Input:
|
|
@@ -1023,16 +1026,16 @@ class MarkersFinder(Proc):
|
|
|
1023
1026
|
* Used in `future::plan(strategy = "multicore", workers = <ncores>)` to parallelize some Seurat procedures.
|
|
1024
1027
|
* See also: <https://satijalab.org/seurat/articles/future_vignette.html>
|
|
1025
1028
|
mutaters (type=json): The mutaters to mutate the metadata
|
|
1026
|
-
|
|
1027
|
-
If only `
|
|
1029
|
+
group_by: The column name in metadata to group the cells.
|
|
1030
|
+
If only `group_by` is specified, and `ident-1` and `ident-2` are
|
|
1028
1031
|
not specified, markers will be found for all groups in this column
|
|
1029
1032
|
in the manner of "group vs rest" comparison.
|
|
1030
1033
|
`NA` group will be ignored.
|
|
1031
1034
|
If `None`, `Seurat::Idents(srtobj)` will be used, which is usually
|
|
1032
1035
|
`"seurat_clusters"` after unsupervised clustering.
|
|
1033
|
-
|
|
1034
|
-
When this is empty, the comparisons will be expanded to each group v.s. the rest of the cells in `
|
|
1035
|
-
|
|
1036
|
+
ident_1: The first group of cells to compare
|
|
1037
|
+
When this is empty, the comparisons will be expanded to each group v.s. the rest of the cells in `group_by`.
|
|
1038
|
+
ident_2: The second group of cells to compare
|
|
1036
1039
|
If not provided, the rest of the cells are used for `ident-2`.
|
|
1037
1040
|
each: The column name in metadata to separate the cells into different
|
|
1038
1041
|
cases.
|
|
@@ -1082,6 +1085,16 @@ class MarkersFinder(Proc):
|
|
|
1082
1085
|
- <more>: Other arguments passed to [`scplotter::FeatureStatPlot()`](https://pwwang.github.io/scplotter/reference/FeatureStatPlot.html).
|
|
1083
1086
|
allmarker_plots (type=json): All marker plot cases.
|
|
1084
1087
|
The keys are the names of the cases and the values are the dicts inherited from `allmarker_plots_defaults`.
|
|
1088
|
+
allenrich_plots_defaults (ns): Default options for the plots to generate for the enrichment analysis.
|
|
1089
|
+
- plot_type: The type of the plot.
|
|
1090
|
+
- devpars (ns): The device parameters for the plots.
|
|
1091
|
+
- res (type=int): The resolution of the plots.
|
|
1092
|
+
- height (type=int): The height of the plots.
|
|
1093
|
+
- width (type=int): The width of the plots.
|
|
1094
|
+
- <more>: See <https://pwwang.github.io/scplotter/reference/EnrichmentPlot.html>.
|
|
1095
|
+
allenrich_plots (type=json): Cases of the plots to generate for the enrichment analysis.
|
|
1096
|
+
The keys are the names of the cases and the values are the dicts inherited from `allenrich_plots_defaults`.
|
|
1097
|
+
The cases under `envs.cases` can inherit this options.
|
|
1085
1098
|
marker_plots_defaults (ns): Default options for the plots to generate for the markers.
|
|
1086
1099
|
- plot_type: The type of the plot.
|
|
1087
1100
|
See <https://pwwang.github.io/scplotter/reference/FeatureStatPlot.html>.
|
|
@@ -1149,9 +1162,9 @@ class MarkersFinder(Proc):
|
|
|
1149
1162
|
envs = {
|
|
1150
1163
|
"ncores": config.misc.ncores,
|
|
1151
1164
|
"mutaters": {},
|
|
1152
|
-
"
|
|
1153
|
-
"
|
|
1154
|
-
"
|
|
1165
|
+
"group_by": None,
|
|
1166
|
+
"ident_1": None,
|
|
1167
|
+
"ident_2": None,
|
|
1155
1168
|
"each": None,
|
|
1156
1169
|
"dbs": ["KEGG_2021_Human", "MSigDB_Hallmark_2020"],
|
|
1157
1170
|
"sigmarkers": "p_val_adj < 0.05",
|
|
@@ -1170,6 +1183,11 @@ class MarkersFinder(Proc):
|
|
|
1170
1183
|
"genes": 10,
|
|
1171
1184
|
},
|
|
1172
1185
|
"allmarker_plots": {},
|
|
1186
|
+
"allenrich_plots_defaults": {
|
|
1187
|
+
"plot_type": "heatmap",
|
|
1188
|
+
"devpars": {"res": 100},
|
|
1189
|
+
},
|
|
1190
|
+
"allenrich_plots": {},
|
|
1173
1191
|
"marker_plots_defaults": {
|
|
1174
1192
|
"plot_type": None,
|
|
1175
1193
|
"more_formats": [],
|
|
@@ -1221,11 +1239,11 @@ class TopExpressingGenes(Proc):
|
|
|
1221
1239
|
Envs:
|
|
1222
1240
|
mutaters (type=json): The mutaters to mutate the metadata
|
|
1223
1241
|
ident: The group of cells to find the top expressing genes.
|
|
1224
|
-
The cells will be selected by the `
|
|
1242
|
+
The cells will be selected by the `group_by` column with this
|
|
1225
1243
|
`ident` value in metadata.
|
|
1226
1244
|
If not provided, the top expressing genes will be found for all
|
|
1227
|
-
groups of cells in the `
|
|
1228
|
-
|
|
1245
|
+
groups of cells in the `group_by` column.
|
|
1246
|
+
group_by: The column name in metadata to group the cells.
|
|
1229
1247
|
each: The column name in metadata to separate the cells into different
|
|
1230
1248
|
cases.
|
|
1231
1249
|
dbs (list): The dbs to do enrichment analysis for significant
|
|
@@ -1268,7 +1286,7 @@ class TopExpressingGenes(Proc):
|
|
|
1268
1286
|
envs = {
|
|
1269
1287
|
"mutaters": {},
|
|
1270
1288
|
"ident": None,
|
|
1271
|
-
"
|
|
1289
|
+
"group_by": None,
|
|
1272
1290
|
"each": None,
|
|
1273
1291
|
"dbs": ["KEGG_2021_Human", "MSigDB_Hallmark_2020"],
|
|
1274
1292
|
"n": 250,
|
|
@@ -1285,7 +1303,7 @@ class TopExpressingGenes(Proc):
|
|
|
1285
1303
|
"cases": {},
|
|
1286
1304
|
}
|
|
1287
1305
|
plugin_opts = {
|
|
1288
|
-
"report": "file://../reports/
|
|
1306
|
+
"report": "file://../reports/common.svelte",
|
|
1289
1307
|
"report_paging": 8,
|
|
1290
1308
|
}
|
|
1291
1309
|
|
|
@@ -1589,9 +1607,9 @@ class ScFGSEA(Proc):
|
|
|
1589
1607
|
mutaters (type=json): The mutaters to mutate the metadata.
|
|
1590
1608
|
The key-value pairs will be passed the `dplyr::mutate()` to mutate the metadata.
|
|
1591
1609
|
|
|
1592
|
-
|
|
1593
|
-
|
|
1594
|
-
|
|
1610
|
+
group_by: The column name in metadata to group the cells.
|
|
1611
|
+
ident_1: The first group of cells to compare
|
|
1612
|
+
ident_2: The second group of cells to compare, if not provided, the rest of the cells that are not `NA`s in `group_by` column are used for `ident-2`.
|
|
1595
1613
|
each: The column name in metadata to separate the cells into different subsets to do the analysis.
|
|
1596
1614
|
subset: An expression to subset the cells.
|
|
1597
1615
|
gmtfile: The pathways in GMT format, with the gene names/ids in the same format as the seurat object.
|
|
@@ -1617,6 +1635,15 @@ class ScFGSEA(Proc):
|
|
|
1617
1635
|
If it is < 1, will apply it to `padj`, selecting pathways with `padj` < `top`.
|
|
1618
1636
|
eps (type=float): This parameter sets the boundary for calculating the p value.
|
|
1619
1637
|
See <https://rdrr.io/bioc/fgsea/man/fgseaMultilevel.html>
|
|
1638
|
+
alleach_plots_defaults (ns): Default options for the plots to generate for all pathways.
|
|
1639
|
+
- plot_type: The type of the plot, currently either dot or heatmap (default)
|
|
1640
|
+
- devpars (ns): The device parameters for the plots.
|
|
1641
|
+
- res (type=int): The resolution of the plots.
|
|
1642
|
+
- height (type=int): The height of the plots.
|
|
1643
|
+
- width (type=int): The width of the plots.
|
|
1644
|
+
- <more>: See <https://pwwang.github.io/biopipen.utils.R/reference/VizGSEA.html>.
|
|
1645
|
+
alleach_plots (type=json): Cases of the plots to generate for all pathways.
|
|
1646
|
+
The keys are the names of the cases and the values are the dicts inherited from `alleach_plots_defaults`.
|
|
1620
1647
|
minsize (type=int): Minimal size of a gene set to test. All pathways below the threshold are excluded.
|
|
1621
1648
|
maxsize (type=int): Maximal size of a gene set to test. All pathways above the threshold are excluded.
|
|
1622
1649
|
rest (type=json;order=98): Rest arguments for [`fgsea()`](https://rdrr.io/bioc/fgsea/man/fgsea.html)
|
|
@@ -1639,23 +1666,28 @@ class ScFGSEA(Proc):
|
|
|
1639
1666
|
envs = {
|
|
1640
1667
|
"mutaters": {},
|
|
1641
1668
|
"ncores": config.misc.ncores,
|
|
1642
|
-
"
|
|
1643
|
-
"
|
|
1644
|
-
"
|
|
1669
|
+
"group_by": None,
|
|
1670
|
+
"ident_1": None,
|
|
1671
|
+
"ident_2": None,
|
|
1645
1672
|
"each": None,
|
|
1646
1673
|
"subset": None,
|
|
1647
|
-
"gmtfile": "",
|
|
1674
|
+
"gmtfile": "KEGG_2021_Human",
|
|
1648
1675
|
"method": "s2n",
|
|
1649
1676
|
"top": 20,
|
|
1650
1677
|
"minsize": 10,
|
|
1651
1678
|
"maxsize": 100,
|
|
1652
1679
|
"eps": 0,
|
|
1680
|
+
"alleach_plots_defaults": {
|
|
1681
|
+
"plot_type": "heatmap",
|
|
1682
|
+
"devpars": {"res": 100},
|
|
1683
|
+
},
|
|
1684
|
+
"alleach_plots": {},
|
|
1653
1685
|
"rest": {},
|
|
1654
1686
|
"cases": {},
|
|
1655
1687
|
}
|
|
1656
1688
|
script = "file://../scripts/scrna/ScFGSEA.R"
|
|
1657
1689
|
plugin_opts = {
|
|
1658
|
-
"report": "file://../reports/
|
|
1690
|
+
"report": "file://../reports/common.svelte",
|
|
1659
1691
|
"report_paging": 8,
|
|
1660
1692
|
}
|
|
1661
1693
|
|
|
@@ -2647,3 +2679,217 @@ class LoomTo10X(Proc):
|
|
|
2647
2679
|
output = "outdir:dir:{{in.loomfile | stem}}.10X"
|
|
2648
2680
|
lang = config.lang.rscript
|
|
2649
2681
|
script = "file://../scripts/scrna/LoomTo10X.R"
|
|
2682
|
+
|
|
2683
|
+
|
|
2684
|
+
class PseudoBulkDEG(Proc):
|
|
2685
|
+
"""Pseduo-bulk differential gene expression analysis
|
|
2686
|
+
|
|
2687
|
+
This process performs differential gene expression analysis, instead of
|
|
2688
|
+
on single-cell level, on the pseudo-bulk data, aggregated from the single-cell data.
|
|
2689
|
+
|
|
2690
|
+
Input:
|
|
2691
|
+
sobjfile: The seurat object file in RDS or qs/qs2 format.
|
|
2692
|
+
|
|
2693
|
+
Output:
|
|
2694
|
+
outdir: The output containing the results of the differential gene expression
|
|
2695
|
+
analysis.
|
|
2696
|
+
|
|
2697
|
+
Envs:
|
|
2698
|
+
mutaters (type=json): Mutaters to mutate the metadata of the
|
|
2699
|
+
seurat object. Keys are the new column names and values are the
|
|
2700
|
+
expressions to mutate the columns. These new columns can be
|
|
2701
|
+
used to define your cases.
|
|
2702
|
+
each: The column name in metadata to separate the cells into different cases.
|
|
2703
|
+
When specified, the case will be expanded to multiple cases for
|
|
2704
|
+
each value in the column.
|
|
2705
|
+
subset: An expression in string to subset the cells.
|
|
2706
|
+
aggregate_by: The column names in metadata to aggregate the cells.
|
|
2707
|
+
layer: The layer to pull and aggregate the data.
|
|
2708
|
+
assay: The assay to pull and aggregate the data.
|
|
2709
|
+
error (flag): Error out if no/not enough markers are found or no pathways are enriched.
|
|
2710
|
+
If `False`, empty results will be returned.
|
|
2711
|
+
group_by: The column name in metadata to group the cells.
|
|
2712
|
+
ident_1: The first identity to compare.
|
|
2713
|
+
ident_2: The second identity to compare.
|
|
2714
|
+
If not specified, the rest of the identities will be compared with `ident_1`.
|
|
2715
|
+
paired_by: The column name in metadata to mark the paired samples.
|
|
2716
|
+
For example, subject. If specified, the paired test will be performed.
|
|
2717
|
+
dbs (list): The databases to use for enrichment analysis.
|
|
2718
|
+
The databases are passed to `biopipen.utils::Enrichr()` to do the
|
|
2719
|
+
enrichment analysis. The default databases are `KEGG_2021_Human` and
|
|
2720
|
+
`MSigDB_Hallmark_2020`.
|
|
2721
|
+
See <https://maayanlab.cloud/Enrichr/#libraries> for the available
|
|
2722
|
+
libraries.
|
|
2723
|
+
sigmarkers: An expression passed to `dplyr::filter()` to filter the
|
|
2724
|
+
significant markers for enrichment analysis.
|
|
2725
|
+
The default is `p_val_adj < 0.05`.
|
|
2726
|
+
If `tool = 'DESeq2'`, the variables that can be used for filtering
|
|
2727
|
+
are: `baseMean`, `log2FC`, `lfcSE`, `stat`, `p_val`, `p_val_adj`.
|
|
2728
|
+
If `tool = 'edgeR'`, the variables that can be used for filtering
|
|
2729
|
+
are: `logCPM`, `log2FC`, `LR`, `p_val`, `p_val_adj`.
|
|
2730
|
+
enrich_style (choice): The style of the enrichment analysis.
|
|
2731
|
+
- enrichr: Use `enrichr`-style for the enrichment analysis.
|
|
2732
|
+
- clusterProfiler: Use `clusterProfiler`-style for the enrichment analysis.
|
|
2733
|
+
allmarker_plots_defaults (ns): Default options for the plots for all markers when `ident-1` is not specified.
|
|
2734
|
+
- plot_type: The type of the plot.
|
|
2735
|
+
See <https://pwwang.github.io/scplotter/reference/FeatureStatPlot.html>.
|
|
2736
|
+
Available types are `violin`, `box`, `bar`, `ridge`, `dim`, `heatmap` and `dot`.
|
|
2737
|
+
- more_formats (type=list): The extra formats to save the plot in.
|
|
2738
|
+
- save_code (flag): Whether to save the code to generate the plot.
|
|
2739
|
+
- devpars (ns): The device parameters for the plots.
|
|
2740
|
+
- res (type=int): The resolution of the plots.
|
|
2741
|
+
- height (type=int): The height of the plots.
|
|
2742
|
+
- width (type=int): The width of the plots.
|
|
2743
|
+
- order_by: an expression to order the markers, passed by `dplyr::arrange()`.
|
|
2744
|
+
- genes: The number of top genes to show or an expression passed to `dplyr::filter()` to filter the genes.
|
|
2745
|
+
- <more>: Other arguments passed to [`scplotter::FeatureStatPlot()`](https://pwwang.github.io/scplotter/reference/FeatureStatPlot.html).
|
|
2746
|
+
allmarker_plots (type=json): All marker plot cases.
|
|
2747
|
+
The keys are the names of the cases and the values are the dicts inherited from `allmarker_plots_defaults`.
|
|
2748
|
+
allenrich_plots_defaults (ns): Default options for the plots to generate for the enrichment analysis.
|
|
2749
|
+
- plot_type: The type of the plot.
|
|
2750
|
+
- devpars (ns): The device parameters for the plots.
|
|
2751
|
+
- res (type=int): The resolution of the plots.
|
|
2752
|
+
- height (type=int): The height of the plots.
|
|
2753
|
+
- width (type=int): The width of the plots.
|
|
2754
|
+
- <more>: See <https://pwwang.github.io/scplotter/reference/EnrichmentPlot.html>.
|
|
2755
|
+
allenrich_plots (type=json): Cases of the plots to generate for the enrichment analysis.
|
|
2756
|
+
The keys are the names of the cases and the values are the dicts inherited from `allenrich_plots_defaults`.
|
|
2757
|
+
The cases under `envs.cases` can inherit this options.
|
|
2758
|
+
marker_plots_defaults (ns): Default options for the plots to generate for the markers.
|
|
2759
|
+
- plot_type: The type of the plot.
|
|
2760
|
+
See <https://pwwang.github.io/scplotter/reference/FeatureStatPlot.html>.
|
|
2761
|
+
Available types are `violin`, `box`, `bar`, `ridge`, `dim`, `heatmap` and `dot`.
|
|
2762
|
+
There are two additional types available - `volcano_pct` and `volcano_log2fc`.
|
|
2763
|
+
- more_formats (type=list): The extra formats to save the plot in.
|
|
2764
|
+
- save_code (flag): Whether to save the code to generate the plot.
|
|
2765
|
+
- devpars (ns): The device parameters for the plots.
|
|
2766
|
+
- res (type=int): The resolution of the plots.
|
|
2767
|
+
- height (type=int): The height of the plots.
|
|
2768
|
+
- width (type=int): The width of the plots.
|
|
2769
|
+
- order_by: an expression to order the markers, passed by `dplyr::arrange()`.
|
|
2770
|
+
- genes: The number of top genes to show or an expression passed to `dplyr::filter()` to filter the genes.
|
|
2771
|
+
- <more>: Other arguments passed to [`scplotter::FeatureStatPlot()`](https://pwwang.github.io/scplotter/reference/FeatureStatPlot.html).
|
|
2772
|
+
If `plot_type` is `volcano_pct` or `volcano_log2fc`, they will be passed to
|
|
2773
|
+
[`scplotter::VolcanoPlot()`](https://pwwang.github.io/plotthis/reference/VolcanoPlot.html).
|
|
2774
|
+
marker_plots (type=json): Cases of the plots to generate for the markers.
|
|
2775
|
+
Plot cases. The keys are the names of the cases and the values are the dicts inherited from `marker_plots_defaults`.
|
|
2776
|
+
The cases under `envs.cases` can inherit this options.
|
|
2777
|
+
enrich_plots_defaults (ns): Default options for the plots to generate for the enrichment analysis.
|
|
2778
|
+
- plot_type: The type of the plot.
|
|
2779
|
+
See <https://pwwang.github.io/scplotter/reference/EnrichmentPlot.html>.
|
|
2780
|
+
Available types are `bar`, `dot`, `lollipop`, `network`, `enrichmap` and `wordcloud`.
|
|
2781
|
+
- more_formats (type=list): The extra formats to save the plot in.
|
|
2782
|
+
- save_code (flag): Whether to save the code to generate the plot.
|
|
2783
|
+
- devpars (ns): The device parameters for the plots.
|
|
2784
|
+
- res (type=int): The resolution of the plots.
|
|
2785
|
+
- height (type=int): The height of the plots.
|
|
2786
|
+
- width (type=int): The width of the plots.
|
|
2787
|
+
- <more>: See <https://pwwang.github.io/scplotter/reference/EnrichmentPlot.htmll>.
|
|
2788
|
+
enrich_plots (type=json): Cases of the plots to generate for the enrichment analysis.
|
|
2789
|
+
The keys are the names of the cases and the values are the dicts inherited from `enrich_plots_defaults`.
|
|
2790
|
+
The cases under `envs.cases` can inherit this options.
|
|
2791
|
+
overlaps_defaults (ns): Default options for investigating the overlapping of significant markers between different cases or comparisons.
|
|
2792
|
+
This means either `ident-1` should be empty, so that they can be expanded to multiple comparisons.
|
|
2793
|
+
- sigmarkers: The expression to filter the significant markers for each case.
|
|
2794
|
+
If not provided, `envs.sigmarkers` will be used.
|
|
2795
|
+
- plot_type (choice): The type of the plot to generate for the overlaps.
|
|
2796
|
+
- venn: Use `plotthis::VennDiagram()`.
|
|
2797
|
+
- upset: Use `plotthis::UpsetPlot()`.
|
|
2798
|
+
- more_formats (type=list): The extra formats to save the plot in.
|
|
2799
|
+
- save_code (flag): Whether to save the code to generate the plot.
|
|
2800
|
+
- devpars (ns): The device parameters for the plots.
|
|
2801
|
+
- res (type=int): The resolution of the plots.
|
|
2802
|
+
- height (type=int): The height of the plots.
|
|
2803
|
+
- width (type=int): The width of the plots.
|
|
2804
|
+
- <more>: More arguments pased to `plotthis::VennDiagram()`
|
|
2805
|
+
(<https://pwwang.github.io/plotthis/reference/venndiagram1.html>)
|
|
2806
|
+
or `plotthis::UpsetPlot()`
|
|
2807
|
+
(<https://pwwang.github.io/plotthis/reference/upsetplot1.html>)
|
|
2808
|
+
overlaps (type=json): Cases for investigating the overlapping of significant markers between different cases or comparisons.
|
|
2809
|
+
The keys are the names of the cases and the values are the dicts inherited from `overlaps_defaults`.
|
|
2810
|
+
There are two situations that we can perform overlaps:
|
|
2811
|
+
1. If `ident-1` is not specified, the overlaps can be performed between different comparisons.
|
|
2812
|
+
2. If `each` is specified, the overlaps can be performed between different cases, where in each case, `ident-1` must be specified.
|
|
2813
|
+
tool (choice): The method to use for the differential expression analysis.
|
|
2814
|
+
- DESeq2: Use DESeq2 for the analysis.
|
|
2815
|
+
- edgeR: Use edgeR for the analysis.
|
|
2816
|
+
plots_defaults (ns): The default parameters for the plots.
|
|
2817
|
+
- <more>: Parameters passed to `biopipen.utils::VizBulkDEGs()`.
|
|
2818
|
+
See: <https://pwwang.github.io/biopipen.utils.R/reference/VizBulkDEGs.html>
|
|
2819
|
+
plots (type=json): The parameters for the plots.
|
|
2820
|
+
The keys are the names of the plots and the values are the parameters
|
|
2821
|
+
for the plots. The parameters will override the defaults in `plots_defaults`.
|
|
2822
|
+
If not specified, no plots will be generated.
|
|
2823
|
+
cases (type=json): The cases for the analysis.
|
|
2824
|
+
The keys are the names of the cases and the values are the arguments for
|
|
2825
|
+
the analysis. The arguments include the ones inherited from `envs`.
|
|
2826
|
+
If no cases are specified, a default case will be added with
|
|
2827
|
+
the name `DEG Analysis` and the default values specified above.
|
|
2828
|
+
""" # noqa: E501
|
|
2829
|
+
input = "sobjfile:file"
|
|
2830
|
+
output = "outdir:dir:{{in.sobjfile | stem}}.pseudobulk_deg"
|
|
2831
|
+
lang = config.lang.rscript
|
|
2832
|
+
script = "file://../scripts/scrna/PseudoBulkDEG.R"
|
|
2833
|
+
envs = {
|
|
2834
|
+
"mutaters": {},
|
|
2835
|
+
"each": None,
|
|
2836
|
+
"subset": None,
|
|
2837
|
+
"aggregate_by": None,
|
|
2838
|
+
"layer": "counts",
|
|
2839
|
+
"assay": "RNA",
|
|
2840
|
+
"error": True,
|
|
2841
|
+
"group_by": None,
|
|
2842
|
+
"ident_1": None,
|
|
2843
|
+
"ident_2": None,
|
|
2844
|
+
"paired_by": None,
|
|
2845
|
+
"tool": "DESeq2",
|
|
2846
|
+
"dbs": ["KEGG_2021_Human", "MSigDB_Hallmark_2020"],
|
|
2847
|
+
"sigmarkers": "p_val_adj < 0.05",
|
|
2848
|
+
"enrich_style": "enrichr",
|
|
2849
|
+
"allmarker_plots_defaults": {
|
|
2850
|
+
"plot_type": None,
|
|
2851
|
+
"more_formats": [],
|
|
2852
|
+
"save_code": False,
|
|
2853
|
+
"devpars": {"res": 100},
|
|
2854
|
+
"order_by": "desc(abs(log2FC))",
|
|
2855
|
+
"genes": 10,
|
|
2856
|
+
},
|
|
2857
|
+
"allmarker_plots": {},
|
|
2858
|
+
"allenrich_plots_defaults": {
|
|
2859
|
+
"plot_type": "heatmap",
|
|
2860
|
+
"devpars": {"res": 100},
|
|
2861
|
+
},
|
|
2862
|
+
"allenrich_plots": {},
|
|
2863
|
+
"marker_plots_defaults": {
|
|
2864
|
+
"plot_type": None,
|
|
2865
|
+
"more_formats": [],
|
|
2866
|
+
"save_code": False,
|
|
2867
|
+
"devpars": {"res": 100},
|
|
2868
|
+
"order_by": "desc(abs(log2FC))",
|
|
2869
|
+
"genes": 10,
|
|
2870
|
+
},
|
|
2871
|
+
"marker_plots": {
|
|
2872
|
+
"Volcano Plot": {"plot_type": "volcano"},
|
|
2873
|
+
},
|
|
2874
|
+
"enrich_plots_defaults": {
|
|
2875
|
+
"more_formats": [],
|
|
2876
|
+
"save_code": False,
|
|
2877
|
+
"devpars": {"res": 100},
|
|
2878
|
+
},
|
|
2879
|
+
"enrich_plots": {
|
|
2880
|
+
"Bar Plot": {"plot_type": "bar", "ncol": 1, "top_term": 10},
|
|
2881
|
+
},
|
|
2882
|
+
"overlaps_defaults": {
|
|
2883
|
+
"sigmarkers": None,
|
|
2884
|
+
"plot_type": "venn",
|
|
2885
|
+
"more_formats": [],
|
|
2886
|
+
"save_code": False,
|
|
2887
|
+
"devpars": {"res": 100},
|
|
2888
|
+
},
|
|
2889
|
+
"overlaps": {},
|
|
2890
|
+
"cases": {},
|
|
2891
|
+
}
|
|
2892
|
+
plugin_opts = {
|
|
2893
|
+
"report": "file://../reports/common.svelte",
|
|
2894
|
+
"report_paging": 8,
|
|
2895
|
+
}
|
biopipen/ns/tcr.py
CHANGED
|
@@ -1756,10 +1756,10 @@ class ScRepCombiningExpression(Proc):
|
|
|
1756
1756
|
a custom variable in the data.
|
|
1757
1757
|
chain: indicate if both or a specific chain should be used
|
|
1758
1758
|
e.g. "both", "TRA", "TRG", "IGH", "IGL".
|
|
1759
|
-
|
|
1759
|
+
group_by: The column label in the combined clones in which clone frequency will
|
|
1760
1760
|
be calculated. NULL or "none" will keep the format of input.data.
|
|
1761
1761
|
proportion (flag): Whether to proportion (TRUE) or total frequency (FALSE) of
|
|
1762
|
-
the clone based on the
|
|
1762
|
+
the clone based on the group_by variable.
|
|
1763
1763
|
filterNA (flag): Method to subset Seurat/SCE object of barcodes without clone
|
|
1764
1764
|
information
|
|
1765
1765
|
cloneSize (type=json): The bins for the grouping based on proportion or
|
|
@@ -1767,7 +1767,7 @@ class ScRepCombiningExpression(Proc):
|
|
|
1767
1767
|
If proportion is FALSE and the cloneSizes are not set high enough based on
|
|
1768
1768
|
frequency, the upper limit of cloneSizes will be automatically updated.
|
|
1769
1769
|
addLabel (flag): This will add a label to the frequency header, allowing the
|
|
1770
|
-
user to try multiple
|
|
1770
|
+
user to try multiple group_by variables or recalculate frequencies after
|
|
1771
1771
|
subsetting the data.
|
|
1772
1772
|
"""
|
|
1773
1773
|
input = "screpfile:file,srtobj:file"
|
|
@@ -1776,7 +1776,7 @@ class ScRepCombiningExpression(Proc):
|
|
|
1776
1776
|
envs = {
|
|
1777
1777
|
"cloneCall": "aa",
|
|
1778
1778
|
"chain": "both",
|
|
1779
|
-
"
|
|
1779
|
+
"group_by": "Sample",
|
|
1780
1780
|
"proportion": True,
|
|
1781
1781
|
"filterNA": False,
|
|
1782
1782
|
"cloneSize": {
|