orgchart 6.0.0 → 7.0.0
This diff represents the content of publicly available package versions that have been released to one of the supported registries. The information contained in this diff is provided for informational purposes only and reflects changes between package versions as they appear in their respective public registries.
- package/.github/workflows/publish.yml +11 -8
- package/README.md +47 -35
- package/README.zh-cn.md +73 -30
- package/README.zh-tw.md +73 -30
- package/demo/edit-chart.html +0 -4
- package/demo/edit-hybrid-chart.html +3 -4
- package/demo/index.html +5 -1
- package/demo/ondemand-loading-data.html +137 -80
- package/demo/options-compact-drag.html +82 -0
- package/demo/options-export-navigation.html +76 -0
- package/demo/options-horizontal-template.html +80 -0
- package/demo/options-hybrid-navigation.html +71 -0
- package/dist/css/orgchart.css +12 -1
- package/dist/css/orgchart.min.css +1 -1
- package/dist/js/orgchart.js +896 -523
- package/dist/js/orgchart.min.js +1 -1
- package/dist/js/orgchart.min.js.map +1 -1
- package/gulpfile.js +5 -1
- package/package.json +2 -1
- package/src/css/orgchart.css +12 -1
- package/src/js/orgchart.js +896 -523
- package/test/compatibility/README.md +123 -0
- package/test/compatibility/browser.tests.js +1279 -0
- package/test/compatibility/options.tests.js +628 -0
- package/test/cypress/e2e/demo-interactions.cy.js +3 -3
- package/test/cypress/e2e/demo-rendering.cy.js +62 -1
- package/test/cypress/e2e/drag-drop-hybrid-chart.cy.js +2 -1
- package/test/cypress/e2e/local-datasource.cy.js +16 -16
- package/test/cypress/e2e/ondemand-loading-data.cy.js +34 -10
- package/test/cypress/e2e/toggle-sibs-resp.cy.js +4 -4
- package/test/cypress/e2e/vertical-vevel.cy.js +5 -5
- package/test/integration/init-tests.js +30 -43
- package/test/integration/tests.js +21 -13
- package/test/unit/lifecycle-builders-export.tests.js +179 -118
- package/test/unit/tests.js +33 -34
|
@@ -15,18 +15,21 @@ jobs:
|
|
|
15
15
|
runs-on: ubuntu-latest
|
|
16
16
|
steps:
|
|
17
17
|
- uses: actions/checkout@v4
|
|
18
|
+
with:
|
|
19
|
+
persist-credentials: false
|
|
18
20
|
|
|
19
21
|
- uses: actions/setup-node@v4
|
|
20
22
|
with:
|
|
21
23
|
node-version: '22'
|
|
22
24
|
registry-url: 'https://registry.npmjs.org'
|
|
23
25
|
|
|
24
|
-
- name:
|
|
25
|
-
run: npm
|
|
26
|
+
- name: Install dependencies
|
|
27
|
+
run: npm ci
|
|
28
|
+
|
|
29
|
+
- name: Build and test
|
|
30
|
+
run: npm run build
|
|
31
|
+
|
|
32
|
+
- name: Publish package
|
|
33
|
+
run: npm publish --access public --provenance
|
|
26
34
|
env:
|
|
27
|
-
|
|
28
|
-
|
|
29
|
-
- run: npm ci
|
|
30
|
-
|
|
31
|
-
# 3. 直接运行 npm publish,无需任何令牌
|
|
32
|
-
- run: npm publish --access public --provenance
|
|
35
|
+
NODE_AUTH_TOKEN: ${{ secrets.NPM_TOKEN }}
|
package/README.md
CHANGED
|
@@ -1,4 +1,4 @@
|
|
|
1
|
-

|
|
2
2
|
|
|
3
3
|
# [简体文档](https://github.com/dabeng/OrgChart/blob/master/README.zh-cn.md), [繁體文档](https://github.com/dabeng/OrgChart/blob/master/README.zh-tw.md)
|
|
4
4
|
|
|
@@ -55,6 +55,10 @@ FYI, [How to use jQuery Orchart in React](https://stackblitz.com/edit/vitejs-vit
|
|
|
55
55
|
## [Demos based on nested table](https://codepen.io/collection/AWxGVb/) (obsolete)
|
|
56
56
|
|
|
57
57
|
### online demos
|
|
58
|
+
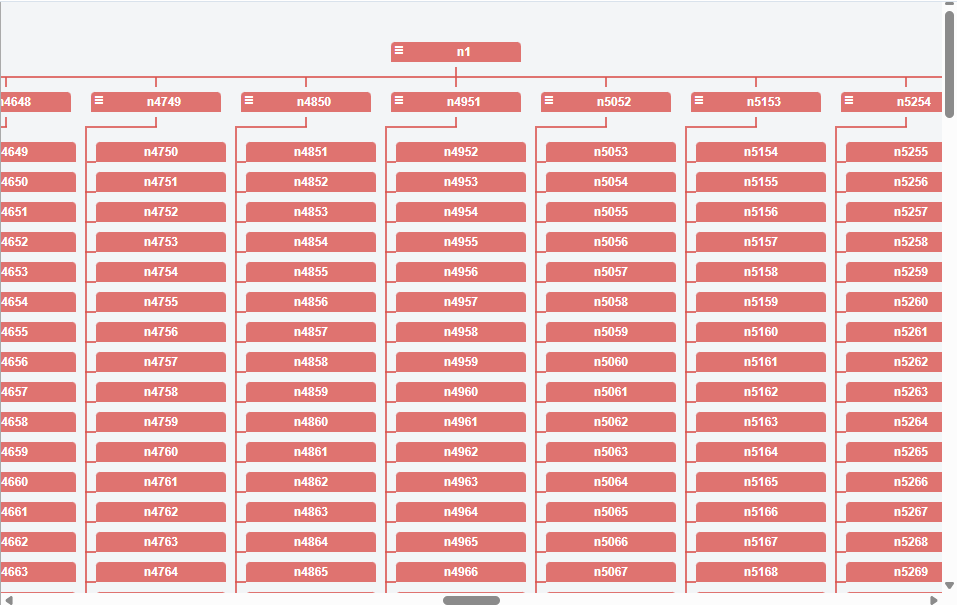
- [I want to render 10,000 nodes within 500 milliseconds](https://dabeng.github.io/OrgChart/10000-nodes.html)
|
|
59
|
+
|
|
60
|
+
|
|
61
|
+
|
|
58
62
|
- [using ul datasource](https://dabeng.github.io/OrgChart/ul-datasource.html)(this feature comes from [Tobyee's good idea :blush:](https://github.com/dabeng/OrgChart/issues/1))
|
|
59
63
|
|
|
60
64
|
- [using local datasource](https://dabeng.github.io/OrgChart/local-datasource.html)
|
|
@@ -79,7 +83,7 @@ FYI, [How to use jQuery Orchart in React](https://stackblitz.com/edit/vitejs-vit
|
|
|
79
83
|
|
|
80
84
|

|
|
81
85
|
|
|
82
|
-
**Note:**
|
|
86
|
+
**Note:** the library manages expand/collapse controls only for loaded nodes. The demo creates separate request buttons and handles loading through application code; no relationship metadata or loading callback option is required.
|
|
83
87
|
|
|
84
88
|
- [I wanna customize the structure of node](https://dabeng.github.io/OrgChart/option-createNode.html)
|
|
85
89
|
|
|
@@ -129,7 +133,7 @@ This feature is inspired by the issues([Aligning Children Vertical](https://gith
|
|
|
129
133
|
|
|
130
134
|
From now on, users never have to worry about how to align a huge of nodes in one screen of browser. The option "verticalLevel" allows users to align child nodes vertically from the given level.
|
|
131
135
|
|
|
132
|
-
|
|
136
|
+
When combined with `compact`, `verticalLevel` determines the layout from its configured level onward. Direction, depth limits and drag/drop continue to use the actual node hierarchy.
|
|
133
137
|
|
|
134
138
|
- [I want to collapse some nodes by default](https://dabeng.github.io/OrgChart/default-collapsed.html)
|
|
135
139
|
|
|
@@ -169,6 +173,10 @@ You need the solution based on new datasource structure with **levelOffset data
|
|
|
169
173
|
|
|
170
174
|
**compact data property** is designed for your use case. Once node data includes a "compact" prop with truthy value, itself and its descendant nodes will be arranged with compact mode.
|
|
171
175
|
|
|
176
|
+
Compact layouts support `draggable`, `visibleLevel`, direction, pan, zoom and minimap together. Use `compact: true` to compact every branch, or a callback to select dense branches. `drag` is an alias for `draggable`; when both are supplied, `draggable` takes precedence. Compact drag/drop and node editing may rebuild the chart, so reacquire rendered node elements afterward.
|
|
177
|
+
|
|
178
|
+
Grouped family sources use the configured `nodeId` for every member and the same one-based depth as JSON and UL sources. Compact family children are arranged as household grids. Drag/drop and editing modify the selected member and its descendants, not its surrounding household; family mutations may rebuild rendered nodes. `getHierarchy()` preserves grouped family arrays, and related-node queries include all members with the same chart parent.
|
|
179
|
+
|
|
172
180
|
- [ I want to visualize genealogy/pedigree/family tree information](https://dabeng.github.io/OrgChart/family-tree.html)
|
|
173
181
|
|
|
174
182
|

|
|
@@ -249,27 +257,24 @@ var oc = new OrgChart({
|
|
|
249
257
|
// which will be used as className attribute of node.
|
|
250
258
|
'nodeTitle': 'name', // This property is used to retrieve “title†value in datasource
|
|
251
259
|
'nodeContent': 'title',// This property is used to retrieve "content" value in datasource
|
|
252
|
-
'relationship': relationshipValue, // Note: when you activate ondemand loading nodes feature,
|
|
253
|
-
// you should use json datsource (local or remote) and set this property.
|
|
254
|
-
// This property implies that whether this node has parent, siblings, children.
|
|
255
|
-
// relationshipValue is a string composed of three "0/1" identifier.
|
|
256
|
-
// First character stands for wether current node has parent node;
|
|
257
|
-
// Scond character stands for wether current node has siblings nodes;
|
|
258
|
-
// Third character stands for wether current node has children node.
|
|
259
260
|
'children': [ // The property stands for nested nodes.
|
|
260
|
-
{ 'name': 'Bo Miao', 'title': 'department manager'
|
|
261
|
-
{ 'name': 'Su Miao', 'title': 'department manager',
|
|
261
|
+
{ 'name': 'Bo Miao', 'title': 'department manager' },
|
|
262
|
+
{ 'name': 'Su Miao', 'title': 'department manager',
|
|
262
263
|
'children': [
|
|
263
|
-
{ 'name': 'Tie Hua', 'title': 'senior engineer'
|
|
264
|
-
{ 'name': 'Hei Hei', 'title': 'senior engineer'
|
|
264
|
+
{ 'name': 'Tie Hua', 'title': 'senior engineer' },
|
|
265
|
+
{ 'name': 'Hei Hei', 'title': 'senior engineer' }
|
|
265
266
|
]
|
|
266
267
|
},
|
|
267
|
-
{ 'name': 'Yu Jie', 'title': 'department manager'
|
|
268
|
+
{ 'name': 'Yu Jie', 'title': 'department manager' }
|
|
268
269
|
],
|
|
269
270
|
'otherPro': anyValue // feel free to append any useful properties
|
|
270
271
|
};
|
|
271
272
|
```
|
|
272
273
|
|
|
274
|
+
Node relations are derived from the current loaded structure. Expand/collapse and compact-layout controls are created when a node is hovered, focused, or selected by touch, and removed when interaction ends. A control involved in loading is retained until loading finishes. Keyboard users can focus a node and activate its controls with Enter or Space.
|
|
275
|
+
|
|
276
|
+
The `createNode` callback runs without prebuilt interaction controls; customize icons through `icons` rather than querying initial arrow elements. For on-demand loading, create application-owned request buttons through `createNode` and handle requests with event delegation. Keep their behavior selectors separate from built-in controls, then insert loaded nodes with `addAncestors()`, `addChildren()`, or `addDescendants()`. `getNodeState()` describes loaded relations, not data that may exist on a server. The former relationship field and relation-preprocessing method are no longer supported.
|
|
277
|
+
|
|
273
278
|
### Data Props
|
|
274
279
|
<table>
|
|
275
280
|
<thead>
|
|
@@ -307,10 +312,10 @@ var oc = new OrgChart({
|
|
|
307
312
|
<tbody>
|
|
308
313
|
<tr>
|
|
309
314
|
<td>data</td>
|
|
310
|
-
<td>
|
|
315
|
+
<td>object / array / HTMLUListElement</td>
|
|
311
316
|
<td>yes</td>
|
|
312
317
|
<td></td>
|
|
313
|
-
<td>
|
|
318
|
+
<td>Datasource: a JSON tree object, grouped family-tree arrays, or an HTML ul element. UL data is normalized internally so later option changes retain edits.</td>
|
|
314
319
|
</tr>
|
|
315
320
|
<tr>
|
|
316
321
|
<td>pan</td>
|
|
@@ -326,19 +331,26 @@ var oc = new OrgChart({
|
|
|
326
331
|
<td>false</td>
|
|
327
332
|
<td>Users could zoomin/zoomout the orgchart by mouse wheel if they enable this option.</td>
|
|
328
333
|
</tr>
|
|
334
|
+
<tr>
|
|
335
|
+
<td>minimap</td>
|
|
336
|
+
<td>boolean</td>
|
|
337
|
+
<td>no</td>
|
|
338
|
+
<td>false</td>
|
|
339
|
+
<td>Displays an overview navigator. Drag its viewport to move the chart, or use the wheel over the minimap to zoom. Minimap wheel zoom remains available when zoom is false.</td>
|
|
340
|
+
</tr>
|
|
329
341
|
<tr>
|
|
330
342
|
<td>zoominLimit</td>
|
|
331
343
|
<td>number</td>
|
|
332
344
|
<td>no</td>
|
|
333
345
|
<td>7</td>
|
|
334
|
-
<td>
|
|
346
|
+
<td>Inclusive maximum scale. Zoom steps are clamped to this bound. Limits must be finite, positive, and ordered.</td>
|
|
335
347
|
</tr>
|
|
336
348
|
<tr>
|
|
337
349
|
<td>zoomoutLimit</td>
|
|
338
350
|
<td>number</td>
|
|
339
351
|
<td>no</td>
|
|
340
352
|
<td>0.5</td>
|
|
341
|
-
<td>
|
|
353
|
+
<td>Inclusive minimum scale. It must not exceed zoominLimit. Invalid limits throw a RangeError before the chart is replaced.</td>
|
|
342
354
|
</tr>
|
|
343
355
|
<tr>
|
|
344
356
|
<td>direction</td>
|
|
@@ -363,10 +375,10 @@ var oc = new OrgChart({
|
|
|
363
375
|
</tr>
|
|
364
376
|
<tr>
|
|
365
377
|
<td>visibleLevel</td>
|
|
366
|
-
<td>
|
|
378
|
+
<td>nonnegative integer or boolean</td>
|
|
367
379
|
<td>no</td>
|
|
368
380
|
<td>999</td>
|
|
369
|
-
<td>It indicates the
|
|
381
|
+
<td>It indicates the initially expanded depth. true uses the default depth (999); false shows the first level; 0 hides all initial nodes. Deeper branches can be expanded later.</td>
|
|
370
382
|
</tr>
|
|
371
383
|
<tr>
|
|
372
384
|
<td>nodeTitle</td>
|
|
@@ -375,13 +387,6 @@ var oc = new OrgChart({
|
|
|
375
387
|
<td>"name"</td>
|
|
376
388
|
<td>It sets one property of datasource as text content of title section of orgchart node. In fact, users can create a simple orghcart with only nodeTitle option.</td>
|
|
377
389
|
</tr>
|
|
378
|
-
<tr>
|
|
379
|
-
<td>parentNodeSymbol</td>
|
|
380
|
-
<td>string</td>
|
|
381
|
-
<td>no</td>
|
|
382
|
-
<td>"oci-menu"</td>
|
|
383
|
-
<td>Using your own icon to imply that the node has child nodes.</td>
|
|
384
|
-
</tr>
|
|
385
390
|
<tr>
|
|
386
391
|
<td>nodeContent</td>
|
|
387
392
|
<td>string</td>
|
|
@@ -428,7 +433,7 @@ var oc = new OrgChart({
|
|
|
428
433
|
<td>exportFilename</td>
|
|
429
434
|
<td>string</td>
|
|
430
435
|
<td>no</td>
|
|
431
|
-
<td>"
|
|
436
|
+
<td>"OrgChart"</td>
|
|
432
437
|
<td>It's filename when you export current orgchart as a picture.</td>
|
|
433
438
|
</tr>
|
|
434
439
|
<tr>
|
|
@@ -438,6 +443,13 @@ var oc = new OrgChart({
|
|
|
438
443
|
<td>"png"</td>
|
|
439
444
|
<td>Available values are png and pdf.</td>
|
|
440
445
|
</tr>
|
|
446
|
+
<tr>
|
|
447
|
+
<td>exportScale</td>
|
|
448
|
+
<td>number</td>
|
|
449
|
+
<td>no</td>
|
|
450
|
+
<td>2</td>
|
|
451
|
+
<td>Canvas resolution multiplier for PNG and PDF exports; PDF pages retain the chart's logical dimensions. Nonpositive values fall back to 1.</td>
|
|
452
|
+
</tr>
|
|
441
453
|
<tr>
|
|
442
454
|
<td>chartClass</td>
|
|
443
455
|
<td>string</td>
|
|
@@ -471,7 +483,7 @@ var oc = new OrgChart({
|
|
|
471
483
|
<td>json</td>
|
|
472
484
|
<td>no</td>
|
|
473
485
|
<td></td>
|
|
474
|
-
<td>Users can use this option to plug Font Awesome icons back in.
|
|
486
|
+
<td>Users can use this option to plug Font Awesome icons back in. Partial icon objects are merged with the defaults by field. Set icons.parentNode to customize the parent-node symbol.
|
|
475
487
|
<pre>
|
|
476
488
|
<code>
|
|
477
489
|
'icons': {
|
|
@@ -490,10 +502,10 @@ var oc = new OrgChart({
|
|
|
490
502
|
</tr>
|
|
491
503
|
<tr>
|
|
492
504
|
<td>compact</td>
|
|
493
|
-
<td>function</td>
|
|
505
|
+
<td>boolean or function</td>
|
|
494
506
|
<td>no</td>
|
|
495
507
|
<td></td>
|
|
496
|
-
<td>
|
|
508
|
+
<td>true compacts every branch; a callback receiving node data selects additional compact branches. Explicit compact data properties are preserved. Vertical/hybrid layout takes precedence at nodes where it applies.</td>
|
|
497
509
|
</tr>
|
|
498
510
|
</tbody>
|
|
499
511
|
</table>
|
|
@@ -511,14 +523,14 @@ The public API is: `init`, `setOptions`, `attachMinimap`, `detachMinimap`, `upda
|
|
|
511
523
|
| Call | Parameters | Return value and behavior |
|
|
512
524
|
| --- | --- | --- |
|
|
513
525
|
| `oc.init(options)` | Partial options object; use `data` to replace the data source. | Rebuilds the chart and returns `oc`. |
|
|
514
|
-
| `oc.setOptions(options)`<br>`oc.setOptions(name, value)` |
|
|
526
|
+
| `oc.setOptions(options)`<br>`oc.setOptions(name, value)` | Partial options object, or an option name and value. | Applies navigation/export settings in place; rebuilds for data, layout or node-rendering settings; returns `oc`. |
|
|
515
527
|
| `oc.attachMinimap()`<br>`oc.detachMinimap()`<br>`oc.updateMinimap(forceRefresh)` | `forceRefresh` is optional; `true` redraws preview nodes. | Creates, removes, or refreshes the minimap. Prefer `setOptions('minimap', value)` for normal enablement. |
|
|
516
528
|
| `oc.addAncestors(data, parentId)` | Ancestor data and the id of the ancestor node that receives the existing root. | Inserts ancestor hierarchy; no return value. |
|
|
517
529
|
| `oc.addDescendants(data, parent)` | Array of descendant data and a rendered parent `.node`. | Appends descendant hierarchy; no return value. |
|
|
518
530
|
| `oc.addParent(currentRoot, data)` | Rendered root `.node` and its new parent data. | Wraps the current root with a parent; no return value. |
|
|
519
531
|
| `oc.addSiblings(node, data)`<br>`oc.addChildren(node, data)` | Rendered `.node` and an array of sibling or child data. | Adds rendered nodes; no return value. |
|
|
520
532
|
| `oc.removeNodes(node)` | Rendered `.node` to remove. | Removes the node and its descendants; no return value. |
|
|
521
|
-
| `oc.getHierarchy(includeNodeData)` | Optional boolean, default `false`. | Returns
|
|
533
|
+
| `oc.getHierarchy(includeNodeData)` | Optional boolean, default `false`. | Returns a hierarchy object for tree sources or grouped arrays for family sources; returns an error string when the chart or required node ids are unavailable. |
|
|
522
534
|
| `oc.getNodeState(node, relation)` | Rendered `.node`; `relation` is `parent`, `children`, or `siblings`. | Returns `{ exist, visible }`. |
|
|
523
535
|
| `oc.getParent(node)` | Rendered `.node`. | Returns its parent `.node`, or `null`. |
|
|
524
536
|
| `oc.getChildren(node)`<br>`oc.getSiblings(node)` | Rendered `.node`. | Returns an array of direct child or sibling `.node` elements. |
|
|
@@ -533,7 +545,7 @@ The public API is: `init`, `setOptions`, `attachMinimap`, `detachMinimap`, `upda
|
|
|
533
545
|
It's the useful way when users want to re-initialize or refresh orgchart based on new options or reload new data.
|
|
534
546
|
|
|
535
547
|
#### setOptions(options) / setOptions(name, value)
|
|
536
|
-
Updates `pan`, `zoom`,
|
|
548
|
+
Updates `pan`, `zoom`, `minimap`, zoom limits and export scale/filename/extension without rebuilding the chart. Other options rebuild the chart. Pass a partial options object, or an option name and value. Changes are retained by later `init()` calls; icon defaults are merged field by field. Reacquire node elements after a rebuild.
|
|
537
549
|
|
|
538
550
|
#### attachMinimap() / detachMinimap()
|
|
539
551
|
Creates or removes the minimap overlay for the current chart. Usually use `setOptions('minimap', true|false)` so the option state and overlay stay synchronized.
|
package/README.zh-cn.md
CHANGED
|
@@ -1,4 +1,4 @@
|
|
|
1
|
-

|
|
2
2
|
|
|
3
3
|
# Read this in other languages: [繁體中文](https://github.com/dabeng/OrgChart/blob/master/README.zh-tw.md), [English](https://github.com/dabeng/OrgChart/blob/master/README.md)
|
|
4
4
|
|
|
@@ -52,6 +52,10 @@ $ npm install orgchart
|
|
|
52
52
|
## [基于嵌套table的实例集合](https://codepen.io/collection/AWxGVb/) (过时)
|
|
53
53
|
|
|
54
54
|
### 天马行空的需求
|
|
55
|
+
- [我想在500毫秒内渲染10,000个节点](https://dabeng.github.io/OrgChart/10000-nodes.html)
|
|
56
|
+
|
|
57
|
+

|
|
58
|
+
|
|
55
59
|
- [ul数据源](https://dabeng.github.io/OrgChart/ul-datasource.html)(感谢 [Tobyee的好点子 :blush:](https://github.com/dabeng/OrgChart/issues/1))
|
|
56
60
|
|
|
57
61
|
- [本地数据源](https://dabeng.github.io/OrgChart/local-datasource.html)
|
|
@@ -114,6 +118,8 @@ $ npm install orgchart
|
|
|
114
118
|
|
|
115
119
|
这个特性的灵感来源于这两个话题的讨论--[Aligning Children Vertical](https://github.com/dabeng/OrgChart/issues/46), [Hybrid(horizontal + vertical) OrgChart](https://github.com/dabeng/OrgChart/issues/61)。感谢[mfahadi](https://github.com/mfahadi)和[Destructrix](https://github.com/Destructrix)建设性的讨论:blush:尤其感谢[tedliang](https://github.com/tedliang)提供了非常棒的混合布局的解决方案。
|
|
116
120
|
|
|
121
|
+
与 `compact` 同时配置时,`verticalLevel` 从指定层级开始决定布局方式。方向、层级限制和拖放仍按照真实的父子关系处理。
|
|
122
|
+
|
|
117
123
|
- [我想在组织结构图初始化时,就默认折叠掉若干节点(不限时这些节点的子节点)](https://dabeng.github.io/OrgChart/default-collapsed.html)
|
|
118
124
|
|
|
119
125
|
这个好办。在数据源中,给父节点追加`'collapsed': true`,给子节点追加`'className': 'slide-up'`。
|
|
@@ -152,6 +158,10 @@ $ npm install orgchart
|
|
|
152
158
|
|
|
153
159
|
**compact data property** 就派上用场了. 在数据源的某个节点里提供了"compact"属性,并赋为真值,那么它和它的子节点就会展示为压缩模式。
|
|
154
160
|
|
|
161
|
+
紧凑布局可以与 `draggable`、`visibleLevel`、方向、平移、缩放和小地图同时使用。`compact: true` 会将所有分支设为紧凑布局,也可以通过回调选择子节点较多的分支。`drag` 是 `draggable` 的别名,同时提供两者时以 `draggable` 为准。紧凑布局中的拖放和节点编辑可能重建图表,操作后应重新查询已渲染的节点元素。
|
|
162
|
+
|
|
163
|
+
家谱分组数据中的每个成员都使用配置的 `nodeId`,层级与 JSON、UL 数据一样从第 1 层起算。紧凑家谱的子节点按家庭分组排列成网格。拖放和编辑只修改选中成员及其后代,不会误移动整个家庭;家谱修改可能重建节点元素。`getHierarchy()` 会保留家谱分组数组,关联节点查询包含同一图表父级下的全部成员。
|
|
164
|
+
|
|
155
165
|
- [我想构造族谱,家谱,宗谱的关系图](https://dabeng.github.io/OrgChart/family-tree.html)
|
|
156
166
|
|
|
157
167
|

|
|
@@ -233,28 +243,25 @@ var oc = new OrgChart({
|
|
|
233
243
|
// 来检索数据源,然后渲染默认结构样式的节点的上半部分
|
|
234
244
|
'nodeContent': 'title', // 可选属性。插件会以该属性的值为属性,
|
|
235
245
|
// 来检索数据源,然后渲染默认结构样式的节点的下半部分
|
|
236
|
-
'relationship': relationshipValue, // 注意:当你激活按需载入节点特性时
|
|
237
|
-
// 你应该使用JSON数据源(不论本地或远程)并设置本属性
|
|
238
|
-
// 本属性标识当前节点是否具有父节点,兄弟节点,子节点
|
|
239
|
-
// relationshipValue的值是由“0”或“1”组成的长度为3的字符串
|
|
240
|
-
// 第1个字符代表当前节点是否具有父节点
|
|
241
|
-
// 第2个字符代表当前节点是否具有兄弟节点
|
|
242
|
-
// 第三个字符代表当前节点是否具有孩子节点
|
|
243
246
|
'children': [ // The property stands for nested nodes.
|
|
244
|
-
{ 'name': 'Bo Miao', 'title': 'department manager'
|
|
245
|
-
{ 'name': 'Su Miao', 'title': 'department manager',
|
|
247
|
+
{ 'name': 'Bo Miao', 'title': 'department manager' },
|
|
248
|
+
{ 'name': 'Su Miao', 'title': 'department manager',
|
|
246
249
|
'children': [
|
|
247
|
-
{ 'name': 'Tie Hua', 'title': 'senior engineer'
|
|
248
|
-
{ 'name': 'Hei Hei', 'title': 'senior engineer'
|
|
250
|
+
{ 'name': 'Tie Hua', 'title': 'senior engineer' },
|
|
251
|
+
{ 'name': 'Hei Hei', 'title': 'senior engineer' }
|
|
249
252
|
]
|
|
250
253
|
},
|
|
251
|
-
{ 'name': 'Yu Jie', 'title': 'department manager'
|
|
254
|
+
{ 'name': 'Yu Jie', 'title': 'department manager' }
|
|
252
255
|
],
|
|
253
256
|
'otherPro': anyValue // 数据源中可以追加任意其他字段,只要你觉得
|
|
254
257
|
// 在之后的渲染和操作组织结构图时派得上用场
|
|
255
258
|
};
|
|
256
259
|
```
|
|
257
260
|
|
|
261
|
+
节点关系直接依据当前已加载的结构判断。展开折叠和紧凑布局切换按钮在节点悬浮、聚焦或触屏选中时才创建,交互结束后回收;参与加载的按钮保留至加载完成。键盘用户可以聚焦节点,再用 Enter 或空格激活按钮。
|
|
262
|
+
|
|
263
|
+
`createNode` 回调执行时没有预建的交互按钮,请通过 `icons` 定制图标,不要查询初始化时的箭头元素。按需加载由 demo 或业务层通过 `createNode` 创建独立请求按钮,并使用事件委托处理请求;请求按钮应使用与内置控件不同的行为选择器。加载后调用 `addAncestors()`、`addChildren()` 或 `addDescendants()` 加入真实节点,不需要关系元数据或新的加载回调选项。`getNodeState()` 只描述已加载的关系,不推断服务端尚未加载的数据。旧的关系属性和关系预处理方法不再支持。
|
|
264
|
+
|
|
258
265
|
### 选项
|
|
259
266
|
<table>
|
|
260
267
|
<thead>
|
|
@@ -269,10 +276,10 @@ var oc = new OrgChart({
|
|
|
269
276
|
<tbody>
|
|
270
277
|
<tr>
|
|
271
278
|
<td>data</td>
|
|
272
|
-
<td>
|
|
279
|
+
<td>object / array / HTMLUListElement</td>
|
|
273
280
|
<td>是</td>
|
|
274
281
|
<td></td>
|
|
275
|
-
<td
|
|
282
|
+
<td>数据源可以是 JSON 树对象、家谱分组数组或 HTML ul 元素。UL 数据会在内部规范化,后续修改选项时仍会保留编辑结果。</td>
|
|
276
283
|
</tr>
|
|
277
284
|
<tr>
|
|
278
285
|
<td>pan</td>
|
|
@@ -288,19 +295,26 @@ var oc = new OrgChart({
|
|
|
288
295
|
<td>false</td>
|
|
289
296
|
<td>启动本选项,用户可以通过鼠标滚轮或触摸板对组织结构图进行缩放。</td>
|
|
290
297
|
</tr>
|
|
298
|
+
<tr>
|
|
299
|
+
<td>minimap</td>
|
|
300
|
+
<td>boolean</td>
|
|
301
|
+
<td>否</td>
|
|
302
|
+
<td>false</td>
|
|
303
|
+
<td>显示小地图导航。拖动视口框可移动图表,在小地图上使用滚轮可缩放;即使 zoom 为 false,小地图自身的滚轮缩放仍然可用。</td>
|
|
304
|
+
</tr>
|
|
291
305
|
<tr>
|
|
292
306
|
<td>zoominLimit</td>
|
|
293
307
|
<td>number</td>
|
|
294
308
|
<td>否</td>
|
|
295
309
|
<td>7</td>
|
|
296
|
-
<td
|
|
310
|
+
<td>包含边界的最大缩放比例。缩放步长会限制到此边界。上下限必须为有限正数,且下限不能大于上限。</td>
|
|
297
311
|
</tr>
|
|
298
312
|
<tr>
|
|
299
313
|
<td>zoomoutLimit</td>
|
|
300
314
|
<td>number</td>
|
|
301
315
|
<td>否</td>
|
|
302
316
|
<td>0.5</td>
|
|
303
|
-
<td
|
|
317
|
+
<td>包含边界的最小缩放比例,不能大于 zoominLimit。无效的上下限会在替换图表前抛出 RangeError。</td>
|
|
304
318
|
</tr>
|
|
305
319
|
<tr>
|
|
306
320
|
<td>direction</td>
|
|
@@ -325,10 +339,10 @@ var oc = new OrgChart({
|
|
|
325
339
|
</tr>
|
|
326
340
|
<tr>
|
|
327
341
|
<td>visibleLevel</td>
|
|
328
|
-
<td
|
|
342
|
+
<td>非负整数或布尔值</td>
|
|
329
343
|
<td>否</td>
|
|
330
344
|
<td>999</td>
|
|
331
|
-
<td
|
|
345
|
+
<td>指定初始展开深度。true 使用默认深度(999);false 只显示第一层;0 隐藏所有初始节点。更深的分支可以随后展开。</td>
|
|
332
346
|
</tr>
|
|
333
347
|
<tr>
|
|
334
348
|
<td>nodeTitle</td>
|
|
@@ -337,13 +351,6 @@ var oc = new OrgChart({
|
|
|
337
351
|
<td>"name"</td>
|
|
338
352
|
<td>将默认节点结构中的标题部分关联到数据源中的一个属性</td>
|
|
339
353
|
</tr>
|
|
340
|
-
<tr>
|
|
341
|
-
<td>parentNodeSymbol</td>
|
|
342
|
-
<td>string</td>
|
|
343
|
-
<td>否</td>
|
|
344
|
-
<td>"oci-leader"</td>
|
|
345
|
-
<td>为所有父节点的icon标识指定CSS类名</td>
|
|
346
|
-
</tr>
|
|
347
354
|
<tr>
|
|
348
355
|
<td>nodeContent</td>
|
|
349
356
|
<td>string</td>
|
|
@@ -390,7 +397,7 @@ var oc = new OrgChart({
|
|
|
390
397
|
<td>exportFilename</td>
|
|
391
398
|
<td>string</td>
|
|
392
399
|
<td>否</td>
|
|
393
|
-
<td>"
|
|
400
|
+
<td>"OrgChart"</td>
|
|
394
401
|
<td>导出文件的文件名。</td>
|
|
395
402
|
</tr>
|
|
396
403
|
<tr>
|
|
@@ -400,6 +407,13 @@ var oc = new OrgChart({
|
|
|
400
407
|
<td>"png"</td>
|
|
401
408
|
<td>导出文件的扩展名。</td>
|
|
402
409
|
</tr>
|
|
410
|
+
<tr>
|
|
411
|
+
<td>exportScale</td>
|
|
412
|
+
<td>number</td>
|
|
413
|
+
<td>否</td>
|
|
414
|
+
<td>2</td>
|
|
415
|
+
<td>导出画布的分辨率倍数,PNG 和 PDF 均适用;PDF 页面保留图表的逻辑尺寸。非正数会回退为 1。</td>
|
|
416
|
+
</tr>
|
|
403
417
|
<tr>
|
|
404
418
|
<td>chartClass</td>
|
|
405
419
|
<td>string</td>
|
|
@@ -428,6 +442,35 @@ var oc = new OrgChart({
|
|
|
428
442
|
<td></td>
|
|
429
443
|
<td>组织结构图初始化完成后,该选项指定的回调函数被触发。该函数接受一个参数--"chart", 即初始化后的组织结构图元素。</td>
|
|
430
444
|
</tr>
|
|
445
|
+
<tr>
|
|
446
|
+
<td>icons</td>
|
|
447
|
+
<td>json</td>
|
|
448
|
+
<td>否</td>
|
|
449
|
+
<td></td>
|
|
450
|
+
<td>自定义图标的 CSS 类名。部分图标对象会逐字段与默认值合并,父节点图标使用 icons.parentNode 设置。
|
|
451
|
+
<pre>
|
|
452
|
+
<code>
|
|
453
|
+
'icons': {
|
|
454
|
+
'theme': 'fa-solid fa-sm',
|
|
455
|
+
'parentNode': 'fa-user-tie',
|
|
456
|
+
'expandToUp': 'fa-angles-up',
|
|
457
|
+
'collapseToDown': 'fa-angles-down',
|
|
458
|
+
'collapseToLeft': 'fa-angles-left',
|
|
459
|
+
'expandToRight': 'fa-angles-right',
|
|
460
|
+
'collapsed': 'fa-circle-plus',
|
|
461
|
+
'expanded': 'fa-circle-minus'
|
|
462
|
+
}
|
|
463
|
+
</code>
|
|
464
|
+
</pre>
|
|
465
|
+
</td>
|
|
466
|
+
</tr>
|
|
467
|
+
<tr>
|
|
468
|
+
<td>compact</td>
|
|
469
|
+
<td>布尔值或函数</td>
|
|
470
|
+
<td>否</td>
|
|
471
|
+
<td></td>
|
|
472
|
+
<td>true 会将所有分支设为紧凑布局;接收节点数据的回调可选择额外的紧凑分支。节点数据中显式设置的 compact 属性会保留。在适用的节点上,垂直或混合布局优先。</td>
|
|
473
|
+
</tr>
|
|
431
474
|
</tbody>
|
|
432
475
|
</table>
|
|
433
476
|
|
|
@@ -444,14 +487,14 @@ const oc = new OrgChart({ chartContainer: '#chartContainerId', data: datasource
|
|
|
444
487
|
| 调用 | 参数 | 返回值与调用行为 |
|
|
445
488
|
| --- | --- | --- |
|
|
446
489
|
| `oc.init(options)` | 部分选项对象;传入 `data` 可替换数据源。 | 重新构建图表并返回 `oc`。 |
|
|
447
|
-
| `oc.setOptions(options)`<br>`oc.setOptions(name, value)` |
|
|
490
|
+
| `oc.setOptions(options)`<br>`oc.setOptions(name, value)` | 部分选项对象,或选项名称及对应值。 | 原地更新导航与导出设置;数据、布局或节点渲染设置会重建图表;返回 `oc`。 |
|
|
448
491
|
| `oc.attachMinimap()`<br>`oc.detachMinimap()`<br>`oc.updateMinimap(forceRefresh)` | `forceRefresh` 可选;传入 `true` 会重绘节点预览。 | 创建、移除或刷新小地图。常规启用应使用 `setOptions('minimap', value)`。 |
|
|
449
492
|
| `oc.addAncestors(data, parentId)` | 祖先数据,以及接收原根节点的祖先节点 id。 | 插入祖先层级;无返回值。 |
|
|
450
493
|
| `oc.addDescendants(data, parent)` | 后代数据数组和已渲染的父 `.node`。 | 追加后代层级;无返回值。 |
|
|
451
494
|
| `oc.addParent(currentRoot, data)` | 已渲染的根 `.node` 和新父节点数据。 | 用新父节点包裹当前根;无返回值。 |
|
|
452
495
|
| `oc.addSiblings(node, data)`<br>`oc.addChildren(node, data)` | 已渲染的 `.node` 和兄弟节点或子节点数据数组。 | 增加渲染节点;无返回值。 |
|
|
453
496
|
| `oc.removeNodes(node)` | 要删除的已渲染 `.node`。 | 删除该节点及其后代;无返回值。 |
|
|
454
|
-
| `oc.getHierarchy(includeNodeData)` | 可选布尔值,默认 `false`。 |
|
|
497
|
+
| `oc.getHierarchy(includeNodeData)` | 可选布尔值,默认 `false`。 | 树数据返回层级对象,家谱数据返回分组数组;图表或必要节点 id 不可用时返回错误字符串。 |
|
|
455
498
|
| `oc.getNodeState(node, relation)` | 已渲染 `.node`;`relation` 为 `parent`、`children` 或 `siblings`。 | 返回 `{ exist, visible }`。 |
|
|
456
499
|
| `oc.getParent(node)` | 已渲染 `.node`。 | 返回父 `.node`,不存在时返回 `null`。 |
|
|
457
500
|
| `oc.getChildren(node)`<br>`oc.getSiblings(node)` | 已渲染 `.node`。 | 返回直接子节点或兄弟节点 `.node` 元素数组。 |
|
|
@@ -466,7 +509,7 @@ const oc = new OrgChart({ chartContainer: '#chartContainerId', data: datasource
|
|
|
466
509
|
当你想基于新的options或数据源刷新组织结构图时,这个方法就派上用场了。
|
|
467
510
|
|
|
468
511
|
#### setOptions(options) / setOptions(name, value)
|
|
469
|
-
无需重新构建图表即可更新 `pan`、`zoom
|
|
512
|
+
无需重新构建图表即可更新 `pan`、`zoom`、`minimap`、缩放上下限,以及导出的分辨率倍数、文件名和扩展名。其他选项会重建图表。可传入部分选项对象,或选项名称及对应值。后续 `init()` 调用会保留这些变更,图标默认值逐字段合并。重建后应重新查询节点元素。
|
|
470
513
|
|
|
471
514
|
#### attachMinimap() / detachMinimap()
|
|
472
515
|
创建或移除当前图表的小地图覆盖层。通常应使用 `setOptions('minimap', true|false)`,以保证选项状态和覆盖层保持同步。
|