pydartdiags 0.0.42__py3-none-any.whl → 0.5.0__py3-none-any.whl
This diff represents the content of publicly available package versions that have been released to one of the supported registries. The information contained in this diff is provided for informational purposes only and reflects changes between package versions as they appear in their respective public registries.
Potentially problematic release.
This version of pydartdiags might be problematic. Click here for more details.
- pydartdiags/matplots/__init__.py +0 -0
- pydartdiags/matplots/matplots.py +243 -0
- pydartdiags/obs_sequence/obs_sequence.py +712 -350
- pydartdiags/plots/plots.py +163 -133
- pydartdiags/stats/__init__.py +0 -0
- pydartdiags/stats/stats.py +323 -0
- pydartdiags-0.5.0.dist-info/METADATA +49 -0
- pydartdiags-0.5.0.dist-info/RECORD +14 -0
- {pydartdiags-0.0.42.dist-info → pydartdiags-0.5.0.dist-info}/WHEEL +1 -1
- pydartdiags-0.0.42.dist-info/METADATA +0 -404
- pydartdiags-0.0.42.dist-info/RECORD +0 -10
- {pydartdiags-0.0.42.dist-info → pydartdiags-0.5.0.dist-info}/LICENSE +0 -0
- {pydartdiags-0.0.42.dist-info → pydartdiags-0.5.0.dist-info}/top_level.txt +0 -0
|
@@ -0,0 +1,49 @@
|
|
|
1
|
+
Metadata-Version: 2.2
|
|
2
|
+
Name: pydartdiags
|
|
3
|
+
Version: 0.5.0
|
|
4
|
+
Summary: Observation Sequence Diagnostics for DART
|
|
5
|
+
Home-page: https://github.com/NCAR/pyDARTdiags.git
|
|
6
|
+
Author: Helen Kershaw
|
|
7
|
+
Author-email: Helen Kershaw <hkershaw@ucar.edu>
|
|
8
|
+
Project-URL: Homepage, https://github.com/NCAR/pyDARTdiags.git
|
|
9
|
+
Project-URL: Issues, https://github.com/NCAR/pyDARTdiags/issues
|
|
10
|
+
Project-URL: Documentation, https://ncar.github.io/pyDARTdiags
|
|
11
|
+
Classifier: Programming Language :: Python :: 3
|
|
12
|
+
Classifier: License :: OSI Approved :: Apache Software License
|
|
13
|
+
Classifier: Operating System :: OS Independent
|
|
14
|
+
Requires-Python: >=3.8
|
|
15
|
+
Description-Content-Type: text/markdown
|
|
16
|
+
License-File: LICENSE
|
|
17
|
+
Requires-Dist: pandas>=2.2.0
|
|
18
|
+
Requires-Dist: numpy>=1.26
|
|
19
|
+
Requires-Dist: plotly>=5.22.0
|
|
20
|
+
Requires-Dist: pyyaml>=6.0.2
|
|
21
|
+
Requires-Dist: matplotlib>=3.9.4
|
|
22
|
+
Dynamic: author
|
|
23
|
+
Dynamic: home-page
|
|
24
|
+
Dynamic: requires-python
|
|
25
|
+
|
|
26
|
+
[](https://opensource.org/licenses/Apache-2.0)
|
|
27
|
+
[](https://codecov.io/gh/NCAR/pyDARTdiags)
|
|
28
|
+
[](https://pypi.org/project/pydartdiags/)
|
|
29
|
+
[](https://github.com/psf/black)
|
|
30
|
+
|
|
31
|
+
# pyDARTdiags
|
|
32
|
+
|
|
33
|
+
pyDARTdiags is a Python library for observation space diagnostics for the Data Assimilation Research Testbed ([DART](https://github.com/NCAR/DART)).
|
|
34
|
+
|
|
35
|
+
pyDARTdiags is under initial development, so please use caution.
|
|
36
|
+
The MATLAB [observation space diagnostics](https://docs.dart.ucar.edu/en/latest/guide/matlab-observation-space.html) are available through [DART](https://github.com/NCAR/DART).
|
|
37
|
+
|
|
38
|
+
|
|
39
|
+
pyDARTdiags can be installed through pip: https://pypi.org/project/pydartdiags/
|
|
40
|
+
Documentation : https://ncar.github.io/pyDARTdiags/
|
|
41
|
+
|
|
42
|
+
## Contributing
|
|
43
|
+
Contributions are welcome! If you have a feature request, bug report, or a suggestion, please open an issue on our GitHub repository.
|
|
44
|
+
Please read our [Contributors Guide](https://github.com/NCAR/pyDARTdiags/blob/main/CONTRIBUTING.md) if you would like to contribute to
|
|
45
|
+
pyDARTdiags.
|
|
46
|
+
|
|
47
|
+
## License
|
|
48
|
+
|
|
49
|
+
pyDARTdiags is released under the Apache License 2.0. For more details, see the LICENSE file in the root directory of this source tree or visit [Apache License 2.0](https://www.apache.org/licenses/LICENSE-2.0).
|
|
@@ -0,0 +1,14 @@
|
|
|
1
|
+
pydartdiags/__init__.py,sha256=47DEQpj8HBSa-_TImW-5JCeuQeRkm5NMpJWZG3hSuFU,0
|
|
2
|
+
pydartdiags/matplots/__init__.py,sha256=47DEQpj8HBSa-_TImW-5JCeuQeRkm5NMpJWZG3hSuFU,0
|
|
3
|
+
pydartdiags/matplots/matplots.py,sha256=44MlD98gaQsrCT0mW6M9f0a2-clm3KEGrdYqkTUO0RI,7478
|
|
4
|
+
pydartdiags/obs_sequence/__init__.py,sha256=47DEQpj8HBSa-_TImW-5JCeuQeRkm5NMpJWZG3hSuFU,0
|
|
5
|
+
pydartdiags/obs_sequence/obs_sequence.py,sha256=kdPOWAqgiyuv6cTdhYx1u9Ru6zCKF0Wd--7-sM3m5F8,44527
|
|
6
|
+
pydartdiags/plots/__init__.py,sha256=47DEQpj8HBSa-_TImW-5JCeuQeRkm5NMpJWZG3hSuFU,0
|
|
7
|
+
pydartdiags/plots/plots.py,sha256=U7WQjE_qN-5a8-85D-PkkgILSFBzTJQ1mcGBa7l5DHI,6464
|
|
8
|
+
pydartdiags/stats/__init__.py,sha256=47DEQpj8HBSa-_TImW-5JCeuQeRkm5NMpJWZG3hSuFU,0
|
|
9
|
+
pydartdiags/stats/stats.py,sha256=tzjE6HBrw6s9Li0UlJ_sNMcGEU8loT_BA5SDZp-UTOc,12138
|
|
10
|
+
pydartdiags-0.5.0.dist-info/LICENSE,sha256=ROglds_Eg_ylXp-1MHmEawDqMw_UsCB4r9sk7z9PU9M,11377
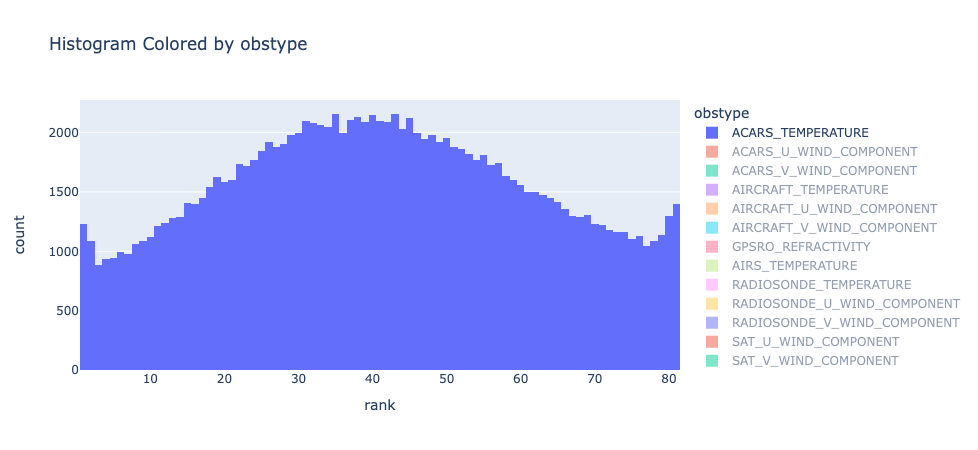
|
|
11
|
+
pydartdiags-0.5.0.dist-info/METADATA,sha256=F6znTR7qrj2qoGBYNojmWiaOqa9EAETgphV7i0HW0xc,2391
|
|
12
|
+
pydartdiags-0.5.0.dist-info/WHEEL,sha256=In9FTNxeP60KnTkGw7wk6mJPYd_dQSjEZmXdBdMCI-8,91
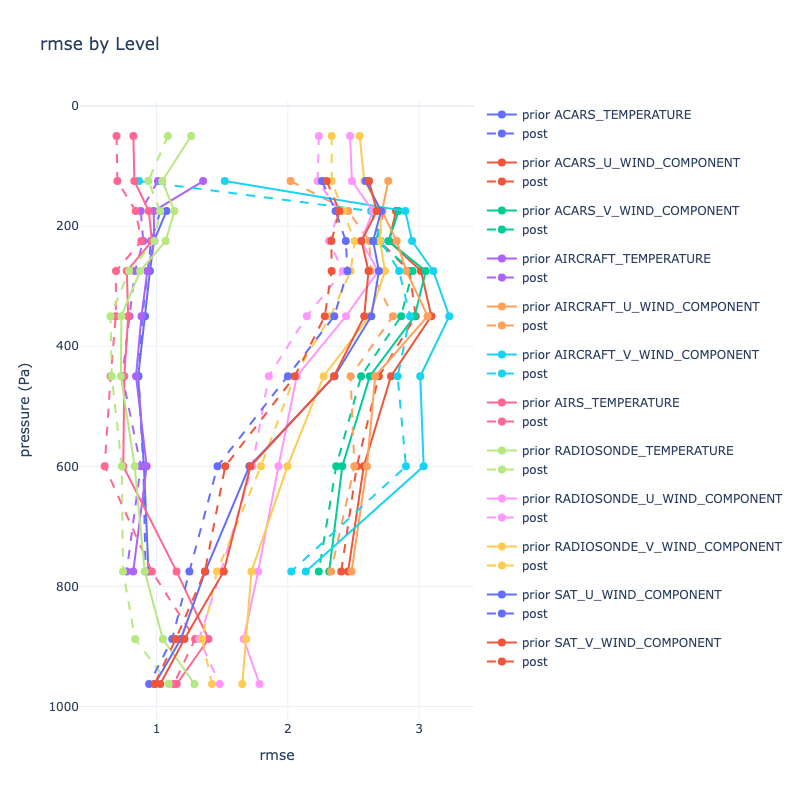
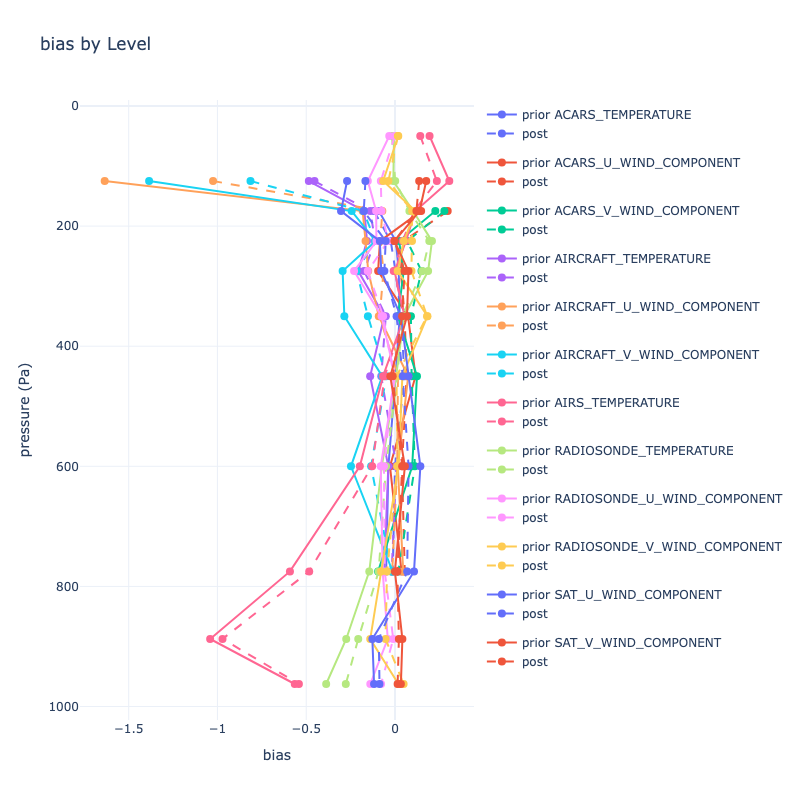
|
|
13
|
+
pydartdiags-0.5.0.dist-info/top_level.txt,sha256=LfMoPLnSd0VhhlWev1eeX9t6AzvyASOloag0LO_ppWg,12
|
|
14
|
+
pydartdiags-0.5.0.dist-info/RECORD,,
|
|
@@ -1,404 +0,0 @@
|
|
|
1
|
-
Metadata-Version: 2.1
|
|
2
|
-
Name: pydartdiags
|
|
3
|
-
Version: 0.0.42
|
|
4
|
-
Summary: Observation Sequence Diagnostics for DART
|
|
5
|
-
Home-page: https://github.com/NCAR/pyDARTdiags.git
|
|
6
|
-
Author: Helen Kershaw
|
|
7
|
-
Author-email: Helen Kershaw <hkershaw@ucar.edu>
|
|
8
|
-
Project-URL: Homepage, https://github.com/NCAR/pyDARTdiags.git
|
|
9
|
-
Project-URL: Issues, https://github.com/NCAR/pyDARTdiags/issues
|
|
10
|
-
Project-URL: Documentation, https://ncar.github.io/pyDARTdiags
|
|
11
|
-
Classifier: Programming Language :: Python :: 3
|
|
12
|
-
Classifier: License :: OSI Approved :: Apache Software License
|
|
13
|
-
Classifier: Operating System :: OS Independent
|
|
14
|
-
Requires-Python: >=3.8
|
|
15
|
-
Description-Content-Type: text/markdown
|
|
16
|
-
License-File: LICENSE
|
|
17
|
-
Requires-Dist: pandas>=2.2.0
|
|
18
|
-
Requires-Dist: numpy>=1.26
|
|
19
|
-
Requires-Dist: plotly>=5.22.0
|
|
20
|
-
Requires-Dist: pyyaml>=6.0.2
|
|
21
|
-
|
|
22
|
-
[](https://opensource.org/licenses/Apache-2.0)
|
|
23
|
-
[](https://codecov.io/gh/NCAR/pyDARTdiags)
|
|
24
|
-
[](https://pypi.org/project/pydartdiags/)
|
|
25
|
-
|
|
26
|
-
|
|
27
|
-
# pyDARTdiags
|
|
28
|
-
|
|
29
|
-
pyDARTdiags is a Python library for obsevation space diagnostics for the Data Assimilation Research Testbed ([DART](https://github.com/NCAR/DART)).
|
|
30
|
-
|
|
31
|
-
pyDARTdiags is under initial development, so please use caution.
|
|
32
|
-
The MATLAB [observation space diagnostics](https://docs.dart.ucar.edu/en/latest/guide/matlab-observation-space.html) are available through [DART](https://github.com/NCAR/DART).
|
|
33
|
-
|
|
34
|
-
|
|
35
|
-
pyDARTdiags can be installed through pip: https://pypi.org/project/pydartdiags/
|
|
36
|
-
Documenation : https://ncar.github.io/pyDARTdiags/
|
|
37
|
-
|
|
38
|
-
We recommend installing pydartdiags in a virtual enviroment:
|
|
39
|
-
|
|
40
|
-
|
|
41
|
-
```
|
|
42
|
-
python3 -m venv dartdiags
|
|
43
|
-
source dartdiags/bin/activate
|
|
44
|
-
pip install pydartdiags
|
|
45
|
-
```
|
|
46
|
-
|
|
47
|
-
## Example importing the obs\_sequence and plots modules
|
|
48
|
-
|
|
49
|
-
```python
|
|
50
|
-
from pydartdiags.obs_sequence import obs_sequence as obsq
|
|
51
|
-
from pydartdiags.plots import plots
|
|
52
|
-
```
|
|
53
|
-
|
|
54
|
-
## Examining the dataframe
|
|
55
|
-
|
|
56
|
-
```python
|
|
57
|
-
obs_seq = obsq.obs_sequence('obs_seq.final.ascii')
|
|
58
|
-
obs_seq.df.head()
|
|
59
|
-
```
|
|
60
|
-
|
|
61
|
-
<table border="1" class="dataframe">
|
|
62
|
-
<thead>
|
|
63
|
-
<tr style="text-align: right;">
|
|
64
|
-
<th></th>
|
|
65
|
-
<th>obs_num</th>
|
|
66
|
-
<th>observation</th>
|
|
67
|
-
<th>prior_ensemble_mean</th>
|
|
68
|
-
<th>prior_ensemble_spread</th>
|
|
69
|
-
<th>prior_ensemble_member_1</th>
|
|
70
|
-
<th>prior_ensemble_member_2</th>
|
|
71
|
-
<th>prior_ensemble_member_3</th>
|
|
72
|
-
<th>prior_ensemble_member_4</th>
|
|
73
|
-
<th>prior_ensemble_member_5</th>
|
|
74
|
-
<th>prior_ensemble_member_6</th>
|
|
75
|
-
<th>...</th>
|
|
76
|
-
<th>latitude</th>
|
|
77
|
-
<th>vertical</th>
|
|
78
|
-
<th>vert_unit</th>
|
|
79
|
-
<th>type</th>
|
|
80
|
-
<th>seconds</th>
|
|
81
|
-
<th>days</th>
|
|
82
|
-
<th>time</th>
|
|
83
|
-
<th>obs_err_var</th>
|
|
84
|
-
<th>bias</th>
|
|
85
|
-
<th>sq_err</th>
|
|
86
|
-
</tr>
|
|
87
|
-
</thead>
|
|
88
|
-
<tbody>
|
|
89
|
-
<tr>
|
|
90
|
-
<th>0</th>
|
|
91
|
-
<td>1</td>
|
|
92
|
-
<td>230.16</td>
|
|
93
|
-
<td>231.310652</td>
|
|
94
|
-
<td>0.405191</td>
|
|
95
|
-
<td>231.304725</td>
|
|
96
|
-
<td>231.562874</td>
|
|
97
|
-
<td>231.333915</td>
|
|
98
|
-
<td>231.297690</td>
|
|
99
|
-
<td>232.081416</td>
|
|
100
|
-
<td>231.051063</td>
|
|
101
|
-
<td>...</td>
|
|
102
|
-
<td>0.012188</td>
|
|
103
|
-
<td>23950.0</td>
|
|
104
|
-
<td>pressure (Pa)</td>
|
|
105
|
-
<td>ACARS_TEMPERATURE</td>
|
|
106
|
-
<td>75603</td>
|
|
107
|
-
<td>153005</td>
|
|
108
|
-
<td>2019-12-01 21:00:03</td>
|
|
109
|
-
<td>1.00</td>
|
|
110
|
-
<td>1.150652</td>
|
|
111
|
-
<td>1.324001</td>
|
|
112
|
-
</tr>
|
|
113
|
-
<tr>
|
|
114
|
-
<th>1</th>
|
|
115
|
-
<td>2</td>
|
|
116
|
-
<td>18.40</td>
|
|
117
|
-
<td>15.720527</td>
|
|
118
|
-
<td>0.630827</td>
|
|
119
|
-
<td>14.217207</td>
|
|
120
|
-
<td>15.558196</td>
|
|
121
|
-
<td>15.805599</td>
|
|
122
|
-
<td>16.594644</td>
|
|
123
|
-
<td>14.877743</td>
|
|
124
|
-
<td>16.334438</td>
|
|
125
|
-
<td>...</td>
|
|
126
|
-
<td>0.012188</td>
|
|
127
|
-
<td>23950.0</td>
|
|
128
|
-
<td>pressure (Pa)</td>
|
|
129
|
-
<td>ACARS_U_WIND_COMPONENT</td>
|
|
130
|
-
<td>75603</td>
|
|
131
|
-
<td>153005</td>
|
|
132
|
-
<td>2019-12-01 21:00:03</td>
|
|
133
|
-
<td>6.25</td>
|
|
134
|
-
<td>-2.679473</td>
|
|
135
|
-
<td>7.179578</td>
|
|
136
|
-
</tr>
|
|
137
|
-
<tr>
|
|
138
|
-
<th>2</th>
|
|
139
|
-
<td>3</td>
|
|
140
|
-
<td>1.60</td>
|
|
141
|
-
<td>-4.932073</td>
|
|
142
|
-
<td>0.825899</td>
|
|
143
|
-
<td>-5.270562</td>
|
|
144
|
-
<td>-5.955998</td>
|
|
145
|
-
<td>-4.209766</td>
|
|
146
|
-
<td>-5.105016</td>
|
|
147
|
-
<td>-4.669405</td>
|
|
148
|
-
<td>-4.365305</td>
|
|
149
|
-
<td>...</td>
|
|
150
|
-
<td>0.012188</td>
|
|
151
|
-
<td>23950.0</td>
|
|
152
|
-
<td>pressure (Pa)</td>
|
|
153
|
-
<td>ACARS_V_WIND_COMPONENT</td>
|
|
154
|
-
<td>75603</td>
|
|
155
|
-
<td>153005</td>
|
|
156
|
-
<td>2019-12-01 21:00:03</td>
|
|
157
|
-
<td>6.25</td>
|
|
158
|
-
<td>-6.532073</td>
|
|
159
|
-
<td>42.667980</td>
|
|
160
|
-
</tr>
|
|
161
|
-
<tr>
|
|
162
|
-
<th>3</th>
|
|
163
|
-
<td>4</td>
|
|
164
|
-
<td>264.16</td>
|
|
165
|
-
<td>264.060532</td>
|
|
166
|
-
<td>0.035584</td>
|
|
167
|
-
<td>264.107192</td>
|
|
168
|
-
<td>264.097270</td>
|
|
169
|
-
<td>264.073212</td>
|
|
170
|
-
<td>264.047718</td>
|
|
171
|
-
<td>264.074140</td>
|
|
172
|
-
<td>264.019895</td>
|
|
173
|
-
<td>...</td>
|
|
174
|
-
<td>0.010389</td>
|
|
175
|
-
<td>56260.0</td>
|
|
176
|
-
<td>pressure (Pa)</td>
|
|
177
|
-
<td>ACARS_TEMPERATURE</td>
|
|
178
|
-
<td>75603</td>
|
|
179
|
-
<td>153005</td>
|
|
180
|
-
<td>2019-12-01 21:00:03</td>
|
|
181
|
-
<td>1.00</td>
|
|
182
|
-
<td>-0.099468</td>
|
|
183
|
-
<td>0.009894</td>
|
|
184
|
-
</tr>
|
|
185
|
-
<tr>
|
|
186
|
-
<th>4</th>
|
|
187
|
-
<td>5</td>
|
|
188
|
-
<td>11.60</td>
|
|
189
|
-
<td>10.134115</td>
|
|
190
|
-
<td>0.063183</td>
|
|
191
|
-
<td>10.067956</td>
|
|
192
|
-
<td>10.078798</td>
|
|
193
|
-
<td>10.120263</td>
|
|
194
|
-
<td>10.084885</td>
|
|
195
|
-
<td>10.135112</td>
|
|
196
|
-
<td>10.140610</td>
|
|
197
|
-
<td>...</td>
|
|
198
|
-
<td>0.010389</td>
|
|
199
|
-
<td>56260.0</td>
|
|
200
|
-
<td>pressure (Pa)</td>
|
|
201
|
-
<td>ACARS_U_WIND_COMPONENT</td>
|
|
202
|
-
<td>75603</td>
|
|
203
|
-
<td>153005</td>
|
|
204
|
-
<td>2019-12-01 21:00:03</td>
|
|
205
|
-
<td>6.25</td>
|
|
206
|
-
<td>-1.465885</td>
|
|
207
|
-
<td>2.148818</td>
|
|
208
|
-
</tr>
|
|
209
|
-
</tbody>
|
|
210
|
-
</table>
|
|
211
|
-
<p>5 rows × 97 columns</p>
|
|
212
|
-
</div>
|
|
213
|
-
|
|
214
|
-
|
|
215
|
-
Find the numeber of assimilated (used) observations vs. possible observations by type
|
|
216
|
-
|
|
217
|
-
```python
|
|
218
|
-
obsq.possible_vs_used(obs_seq.df)
|
|
219
|
-
```
|
|
220
|
-
|
|
221
|
-
<table border="1" class="dataframe">
|
|
222
|
-
<thead>
|
|
223
|
-
<tr style="text-align: right;">
|
|
224
|
-
<th></th>
|
|
225
|
-
<th>type</th>
|
|
226
|
-
<th>possible</th>
|
|
227
|
-
<th>used</th>
|
|
228
|
-
</tr>
|
|
229
|
-
</thead>
|
|
230
|
-
<tbody>
|
|
231
|
-
<tr>
|
|
232
|
-
<th>0</th>
|
|
233
|
-
<td>ACARS_TEMPERATURE</td>
|
|
234
|
-
<td>175429</td>
|
|
235
|
-
<td>128040</td>
|
|
236
|
-
</tr>
|
|
237
|
-
<tr>
|
|
238
|
-
<th>1</th>
|
|
239
|
-
<td>ACARS_U_WIND_COMPONENT</td>
|
|
240
|
-
<td>176120</td>
|
|
241
|
-
<td>126946</td>
|
|
242
|
-
</tr>
|
|
243
|
-
<tr>
|
|
244
|
-
<th>2</th>
|
|
245
|
-
<td>ACARS_V_WIND_COMPONENT</td>
|
|
246
|
-
<td>176120</td>
|
|
247
|
-
<td>127834</td>
|
|
248
|
-
</tr>
|
|
249
|
-
<tr>
|
|
250
|
-
<th>3</th>
|
|
251
|
-
<td>AIRCRAFT_TEMPERATURE</td>
|
|
252
|
-
<td>21335</td>
|
|
253
|
-
<td>13663</td>
|
|
254
|
-
</tr>
|
|
255
|
-
<tr>
|
|
256
|
-
<th>4</th>
|
|
257
|
-
<td>AIRCRAFT_U_WIND_COMPONENT</td>
|
|
258
|
-
<td>21044</td>
|
|
259
|
-
<td>13694</td>
|
|
260
|
-
</tr>
|
|
261
|
-
<tr>
|
|
262
|
-
<th>5</th>
|
|
263
|
-
<td>AIRCRAFT_V_WIND_COMPONENT</td>
|
|
264
|
-
<td>21044</td>
|
|
265
|
-
<td>13642</td>
|
|
266
|
-
</tr>
|
|
267
|
-
<tr>
|
|
268
|
-
<th>6</th>
|
|
269
|
-
<td>AIRS_SPECIFIC_HUMIDITY</td>
|
|
270
|
-
<td>6781</td>
|
|
271
|
-
<td>0</td>
|
|
272
|
-
</tr>
|
|
273
|
-
<tr>
|
|
274
|
-
<th>7</th>
|
|
275
|
-
<td>AIRS_TEMPERATURE</td>
|
|
276
|
-
<td>19583</td>
|
|
277
|
-
<td>7901</td>
|
|
278
|
-
</tr>
|
|
279
|
-
<tr>
|
|
280
|
-
<th>8</th>
|
|
281
|
-
<td>GPSRO_REFRACTIVITY</td>
|
|
282
|
-
<td>81404</td>
|
|
283
|
-
<td>54626</td>
|
|
284
|
-
</tr>
|
|
285
|
-
<tr>
|
|
286
|
-
<th>9</th>
|
|
287
|
-
<td>LAND_SFC_ALTIMETER</td>
|
|
288
|
-
<td>21922</td>
|
|
289
|
-
<td>0</td>
|
|
290
|
-
</tr>
|
|
291
|
-
<tr>
|
|
292
|
-
<th>10</th>
|
|
293
|
-
<td>MARINE_SFC_ALTIMETER</td>
|
|
294
|
-
<td>9987</td>
|
|
295
|
-
<td>0</td>
|
|
296
|
-
</tr>
|
|
297
|
-
<tr>
|
|
298
|
-
<th>11</th>
|
|
299
|
-
<td>MARINE_SFC_SPECIFIC_HUMIDITY</td>
|
|
300
|
-
<td>4196</td>
|
|
301
|
-
<td>0</td>
|
|
302
|
-
</tr>
|
|
303
|
-
<tr>
|
|
304
|
-
<th>12</th>
|
|
305
|
-
<td>MARINE_SFC_TEMPERATURE</td>
|
|
306
|
-
<td>8646</td>
|
|
307
|
-
<td>0</td>
|
|
308
|
-
</tr>
|
|
309
|
-
<tr>
|
|
310
|
-
<th>13</th>
|
|
311
|
-
<td>MARINE_SFC_U_WIND_COMPONENT</td>
|
|
312
|
-
<td>8207</td>
|
|
313
|
-
<td>0</td>
|
|
314
|
-
</tr>
|
|
315
|
-
<tr>
|
|
316
|
-
<th>14</th>
|
|
317
|
-
<td>MARINE_SFC_V_WIND_COMPONENT</td>
|
|
318
|
-
<td>8207</td>
|
|
319
|
-
<td>0</td>
|
|
320
|
-
</tr>
|
|
321
|
-
<tr>
|
|
322
|
-
<th>15</th>
|
|
323
|
-
<td>RADIOSONDE_SPECIFIC_HUMIDITY</td>
|
|
324
|
-
<td>14272</td>
|
|
325
|
-
<td>0</td>
|
|
326
|
-
</tr>
|
|
327
|
-
<tr>
|
|
328
|
-
<th>16</th>
|
|
329
|
-
<td>RADIOSONDE_SURFACE_ALTIMETER</td>
|
|
330
|
-
<td>601</td>
|
|
331
|
-
<td>0</td>
|
|
332
|
-
</tr>
|
|
333
|
-
<tr>
|
|
334
|
-
<th>17</th>
|
|
335
|
-
<td>RADIOSONDE_TEMPERATURE</td>
|
|
336
|
-
<td>29275</td>
|
|
337
|
-
<td>22228</td>
|
|
338
|
-
</tr>
|
|
339
|
-
<tr>
|
|
340
|
-
<th>18</th>
|
|
341
|
-
<td>RADIOSONDE_U_WIND_COMPONENT</td>
|
|
342
|
-
<td>36214</td>
|
|
343
|
-
<td>27832</td>
|
|
344
|
-
</tr>
|
|
345
|
-
<tr>
|
|
346
|
-
<th>19</th>
|
|
347
|
-
<td>RADIOSONDE_V_WIND_COMPONENT</td>
|
|
348
|
-
<td>36214</td>
|
|
349
|
-
<td>27975</td>
|
|
350
|
-
</tr>
|
|
351
|
-
<tr>
|
|
352
|
-
<th>20</th>
|
|
353
|
-
<td>SAT_U_WIND_COMPONENT</td>
|
|
354
|
-
<td>107212</td>
|
|
355
|
-
<td>82507</td>
|
|
356
|
-
</tr>
|
|
357
|
-
<tr>
|
|
358
|
-
<th>21</th>
|
|
359
|
-
<td>SAT_V_WIND_COMPONENT</td>
|
|
360
|
-
<td>107212</td>
|
|
361
|
-
<td>82647</td>
|
|
362
|
-
</tr>
|
|
363
|
-
</tbody>
|
|
364
|
-
</table>
|
|
365
|
-
|
|
366
|
-
|
|
367
|
-
## Example plotting
|
|
368
|
-
|
|
369
|
-
### rank histogram
|
|
370
|
-
|
|
371
|
-
* Select only observations that were assimliated (QC === 0).
|
|
372
|
-
* plot the rank histogram
|
|
373
|
-
|
|
374
|
-
```python
|
|
375
|
-
df_qc0 = obsq.select_by_dart_qc(obs_seq.df, 0)
|
|
376
|
-
plots.plot_rank_histogram(df_qc0)
|
|
377
|
-
```
|
|
378
|
-
|
|
379
|
-
|
|
380
|
-
|
|
381
|
-
### plot profile of RMSE and Bias
|
|
382
|
-
|
|
383
|
-
* Chose levels
|
|
384
|
-
* Select only observations that were assimliated (QC === 0).
|
|
385
|
-
* plot the profiles
|
|
386
|
-
|
|
387
|
-
```python
|
|
388
|
-
hPalevels = [0.0, 100.0, 150.0, 200.0, 250.0, 300.0, 400.0, 500.0, 700, 850, 925, 1000]# float("inf")] # Pa?
|
|
389
|
-
plevels = [i * 100 for i in hPalevels]
|
|
390
|
-
|
|
391
|
-
df_qc0 = obsq.select_by_dart_qc(obs_seq.df, 0) # only qc 0
|
|
392
|
-
df_profile, figrmse, figbias = plots.plot_profile(df_qc0, plevels)
|
|
393
|
-
```
|
|
394
|
-
|
|
395
|
-
|
|
396
|
-
|
|
397
|
-
|
|
398
|
-
|
|
399
|
-
## Contributing
|
|
400
|
-
Contributions are welcome! If you have a feature request, bug report, or a suggestion, please open an issue on our GitHub repository.
|
|
401
|
-
|
|
402
|
-
## License
|
|
403
|
-
|
|
404
|
-
pyDARTdiags is released under the Apache License 2.0. For more details, see the LICENSE file in the root directory of this source tree or visit [Apache License 2.0](https://www.apache.org/licenses/LICENSE-2.0).
|
|
@@ -1,10 +0,0 @@
|
|
|
1
|
-
pydartdiags/__init__.py,sha256=47DEQpj8HBSa-_TImW-5JCeuQeRkm5NMpJWZG3hSuFU,0
|
|
2
|
-
pydartdiags/obs_sequence/__init__.py,sha256=47DEQpj8HBSa-_TImW-5JCeuQeRkm5NMpJWZG3hSuFU,0
|
|
3
|
-
pydartdiags/obs_sequence/obs_sequence.py,sha256=UBaNMJR3MOro47KyJMdgJ0p-aEqcrp817-SOtpFQ1bg,31511
|
|
4
|
-
pydartdiags/plots/__init__.py,sha256=47DEQpj8HBSa-_TImW-5JCeuQeRkm5NMpJWZG3hSuFU,0
|
|
5
|
-
pydartdiags/plots/plots.py,sha256=_vZFgQ9qrmtwE_HAP6_nx3pV4JHRdnYckZ5xUxUH4io,6753
|
|
6
|
-
pydartdiags-0.0.42.dist-info/LICENSE,sha256=ROglds_Eg_ylXp-1MHmEawDqMw_UsCB4r9sk7z9PU9M,11377
|
|
7
|
-
pydartdiags-0.0.42.dist-info/METADATA,sha256=oJe2bv1cjoIhlpJQF2tLIIGhS5zu5qJJzFYEZw9ffgQ,9857
|
|
8
|
-
pydartdiags-0.0.42.dist-info/WHEEL,sha256=GV9aMThwP_4oNCtvEC2ec3qUYutgWeAzklro_0m4WJQ,91
|
|
9
|
-
pydartdiags-0.0.42.dist-info/top_level.txt,sha256=LfMoPLnSd0VhhlWev1eeX9t6AzvyASOloag0LO_ppWg,12
|
|
10
|
-
pydartdiags-0.0.42.dist-info/RECORD,,
|
|
File without changes
|
|
File without changes
|