pydartdiags 0.0.42__py3-none-any.whl → 0.0.43__py3-none-any.whl
This diff represents the content of publicly available package versions that have been released to one of the supported registries. The information contained in this diff is provided for informational purposes only and reflects changes between package versions as they appear in their respective public registries.
Potentially problematic release.
This version of pydartdiags might be problematic. Click here for more details.
- pydartdiags/obs_sequence/obs_sequence.py +127 -63
- pydartdiags/plots/plots.py +210 -32
- pydartdiags-0.0.43.dist-info/METADATA +45 -0
- pydartdiags-0.0.43.dist-info/RECORD +10 -0
- {pydartdiags-0.0.42.dist-info → pydartdiags-0.0.43.dist-info}/WHEEL +1 -1
- pydartdiags-0.0.42.dist-info/METADATA +0 -404
- pydartdiags-0.0.42.dist-info/RECORD +0 -10
- {pydartdiags-0.0.42.dist-info → pydartdiags-0.0.43.dist-info}/LICENSE +0 -0
- {pydartdiags-0.0.42.dist-info → pydartdiags-0.0.43.dist-info}/top_level.txt +0 -0
|
@@ -5,6 +5,23 @@ import os
|
|
|
5
5
|
import yaml
|
|
6
6
|
import struct
|
|
7
7
|
|
|
8
|
+
def requires_assimilation_info(func):
|
|
9
|
+
def wrapper(self, *args, **kwargs):
|
|
10
|
+
if self.has_assimilation_info:
|
|
11
|
+
return func(self, *args, **kwargs)
|
|
12
|
+
else:
|
|
13
|
+
raise ValueError("Assimilation information is required to call this function.")
|
|
14
|
+
return wrapper
|
|
15
|
+
|
|
16
|
+
def requires_posterior_info(func):
|
|
17
|
+
def wrapper(self, *args, **kwargs):
|
|
18
|
+
if self.has_posterior_info:
|
|
19
|
+
return func(self, *args, **kwargs)
|
|
20
|
+
else:
|
|
21
|
+
raise ValueError("Posterior information is required to call this function.")
|
|
22
|
+
return wrapper
|
|
23
|
+
|
|
24
|
+
|
|
8
25
|
class obs_sequence:
|
|
9
26
|
"""Create an obs_sequence object from an ascii observation sequence file.
|
|
10
27
|
|
|
@@ -59,6 +76,8 @@ class obs_sequence:
|
|
|
59
76
|
|
|
60
77
|
def __init__(self, file, synonyms=None):
|
|
61
78
|
self.loc_mod = 'None'
|
|
79
|
+
self.has_assimilation_info = False
|
|
80
|
+
self.has_posterior = False
|
|
62
81
|
self.file = file
|
|
63
82
|
self.synonyms_for_obs = ['NCEP BUFR observation',
|
|
64
83
|
'AIRS observation',
|
|
@@ -72,6 +91,17 @@ class obs_sequence:
|
|
|
72
91
|
else:
|
|
73
92
|
self.synonyms_for_obs.append(synonyms)
|
|
74
93
|
|
|
94
|
+
if file is None:
|
|
95
|
+
# Early exit for testing purposes
|
|
96
|
+
self.df = pd.DataFrame()
|
|
97
|
+
self.types = {}
|
|
98
|
+
self.reverse_types = {}
|
|
99
|
+
self.copie_names = []
|
|
100
|
+
self.n_copies = 0
|
|
101
|
+
self.seq = []
|
|
102
|
+
self.all_obs = []
|
|
103
|
+
return
|
|
104
|
+
|
|
75
105
|
module_dir = os.path.dirname(__file__)
|
|
76
106
|
self.default_composite_types = os.path.join(module_dir,"composite_types.yaml")
|
|
77
107
|
|
|
@@ -103,11 +133,16 @@ class obs_sequence:
|
|
|
103
133
|
self.synonyms_for_obs = [synonym.replace(' ', '_') for synonym in self.synonyms_for_obs]
|
|
104
134
|
rename_dict = {old: 'observation' for old in self.synonyms_for_obs if old in self.df.columns}
|
|
105
135
|
self.df = self.df.rename(columns=rename_dict)
|
|
136
|
+
|
|
106
137
|
# calculate bias and sq_err is the obs_seq is an obs_seq.final
|
|
107
138
|
if 'prior_ensemble_mean'.casefold() in map(str.casefold, self.columns):
|
|
108
|
-
self.
|
|
109
|
-
self.df['
|
|
110
|
-
|
|
139
|
+
self.has_assimilation_info = True
|
|
140
|
+
self.df['prior_bias'] = (self.df['prior_ensemble_mean'] - self.df['observation'])
|
|
141
|
+
self.df['prior_sq_err'] = self.df['prior_bias']**2 # squared error
|
|
142
|
+
if 'posterior_ensemble_mean'.casefold() in map(str.casefold, self.columns):
|
|
143
|
+
self.has_posterior_info = True
|
|
144
|
+
self.df['posterior_bias'] = (self.df['posterior_ensemble_mean'] - self.df['observation'])
|
|
145
|
+
self.df['posterior_sq_err'] = self.df['posterior_bias']**2
|
|
111
146
|
|
|
112
147
|
def create_all_obs(self):
|
|
113
148
|
""" steps through the generator to create a
|
|
@@ -152,14 +187,38 @@ class obs_sequence:
|
|
|
152
187
|
data.append(self.types[type_value]) # observation type
|
|
153
188
|
|
|
154
189
|
# any observation specific obs def info is between here and the end of the list
|
|
190
|
+
# can be obs_def & external forward operator
|
|
191
|
+
metadata = obs[typeI+2:-2]
|
|
192
|
+
obs_def_metadata, external_metadata = self.split_metadata(metadata)
|
|
193
|
+
data.append(obs_def_metadata)
|
|
194
|
+
data.append(external_metadata)
|
|
195
|
+
|
|
155
196
|
time = obs[-2].split()
|
|
156
197
|
data.append(int(time[0])) # seconds
|
|
157
198
|
data.append(int(time[1])) # days
|
|
158
199
|
data.append(convert_dart_time(int(time[0]), int(time[1]))) # datetime # HK todo what is approprate for 1d models?
|
|
159
200
|
data.append(float(obs[-1])) # obs error variance ?convert to sd?
|
|
160
|
-
|
|
201
|
+
|
|
161
202
|
return data
|
|
162
203
|
|
|
204
|
+
@staticmethod
|
|
205
|
+
def split_metadata(metadata):
|
|
206
|
+
"""
|
|
207
|
+
Split the metadata list at the first occurrence of an element starting with 'externalF0'.
|
|
208
|
+
|
|
209
|
+
Args:
|
|
210
|
+
metadata (list of str): The metadata list to be split.
|
|
211
|
+
|
|
212
|
+
Returns:
|
|
213
|
+
tuple: Two sublists, the first containing elements before 'externalF0', and the second
|
|
214
|
+
containing 'externalF0' and all elements after it. If 'externalF0' is not found,
|
|
215
|
+
the first sublist contains the entire metadata list, and the second is empty.
|
|
216
|
+
"""
|
|
217
|
+
for i, item in enumerate(metadata):
|
|
218
|
+
if item.startswith('external_FO'):
|
|
219
|
+
return metadata[:i], metadata[i:]
|
|
220
|
+
return metadata, []
|
|
221
|
+
|
|
163
222
|
def list_to_obs(self, data):
|
|
164
223
|
obs = []
|
|
165
224
|
obs.append('OBS ' + str(data[0])) # obs_num lots of space
|
|
@@ -171,10 +230,16 @@ class obs_sequence:
|
|
|
171
230
|
obs.append(' '.join(map(str, data[self.n_copies+2:self.n_copies+5])) + ' ' + str(self.reversed_vert[data[self.n_copies+5]]) ) # location x, y, z, vert
|
|
172
231
|
obs.append('kind') # this is type of observation
|
|
173
232
|
obs.append(self.reverse_types[data[self.n_copies + 6]]) # observation type
|
|
233
|
+
# Convert metadata to a string and append
|
|
234
|
+
obs.extend(data[self.n_copies + 7]) # metadata
|
|
174
235
|
elif self.loc_mod == 'loc1d':
|
|
175
236
|
obs.append(data[self.n_copies+2]) # 1d location
|
|
176
237
|
obs.append('kind') # this is type of observation
|
|
177
238
|
obs.append(self.reverse_types[data[self.n_copies + 3]]) # observation type
|
|
239
|
+
# Convert metadata to a string and append
|
|
240
|
+
metadata = ' '.join(map(str, data[self.n_copies + 4:-4]))
|
|
241
|
+
if metadata:
|
|
242
|
+
obs.append(metadata) # metadata
|
|
178
243
|
obs.append(' '.join(map(str, data[-4:-2]))) # seconds, days
|
|
179
244
|
obs.append(data[-1]) # obs error variance
|
|
180
245
|
|
|
@@ -273,12 +338,70 @@ class obs_sequence:
|
|
|
273
338
|
elif self.loc_mod == 'loc1d':
|
|
274
339
|
heading.append('location')
|
|
275
340
|
heading.append('type')
|
|
341
|
+
heading.append('metadata')
|
|
342
|
+
heading.append('external_FO')
|
|
276
343
|
heading.append('seconds')
|
|
277
344
|
heading.append('days')
|
|
278
345
|
heading.append('time')
|
|
279
346
|
heading.append('obs_err_var')
|
|
280
347
|
return heading
|
|
281
348
|
|
|
349
|
+
@requires_assimilation_info
|
|
350
|
+
def select_by_dart_qc(self, dart_qc):
|
|
351
|
+
"""
|
|
352
|
+
Selects rows from a DataFrame based on the DART quality control flag.
|
|
353
|
+
|
|
354
|
+
Parameters:
|
|
355
|
+
df (DataFrame): A pandas DataFrame.
|
|
356
|
+
dart_qc (int): The DART quality control flag to select.
|
|
357
|
+
|
|
358
|
+
Returns:
|
|
359
|
+
DataFrame: A DataFrame containing only the rows with the specified DART quality control flag.
|
|
360
|
+
|
|
361
|
+
Raises:
|
|
362
|
+
ValueError: If the DART quality control flag is not present in the DataFrame.
|
|
363
|
+
"""
|
|
364
|
+
if dart_qc not in self.df['DART_quality_control'].unique():
|
|
365
|
+
raise ValueError(f"DART quality control flag '{dart_qc}' not found in DataFrame.")
|
|
366
|
+
else:
|
|
367
|
+
return self.df[self.df['DART_quality_control'] == dart_qc]
|
|
368
|
+
|
|
369
|
+
@requires_assimilation_info
|
|
370
|
+
def select_failed_qcs(self):
|
|
371
|
+
"""
|
|
372
|
+
Select rows from the DataFrame where the DART quality control flag is greater than 0.
|
|
373
|
+
|
|
374
|
+
Returns:
|
|
375
|
+
pandas.DataFrame: A DataFrame containing only the rows with a DART quality control flag greater than 0.
|
|
376
|
+
"""
|
|
377
|
+
return self.df[self.df['DART_quality_control'] > 0]
|
|
378
|
+
|
|
379
|
+
@requires_assimilation_info
|
|
380
|
+
def possible_vs_used(self):
|
|
381
|
+
"""
|
|
382
|
+
Calculates the count of possible vs. used observations by type.
|
|
383
|
+
|
|
384
|
+
This function takes a DataFrame containing observation data, including a 'type' column for the observation
|
|
385
|
+
type and an 'observation' column. The number of used observations ('used'), is the total number
|
|
386
|
+
minus the observations that failed quality control checks (as determined by the `select_failed_qcs` function).
|
|
387
|
+
The result is a DataFrame with each observation type, the count of possible observations, and the count of
|
|
388
|
+
used observations.
|
|
389
|
+
|
|
390
|
+
Returns:
|
|
391
|
+
pd.DataFrame: A DataFrame with three columns: 'type', 'possible', and 'used'. 'type' is the observation type,
|
|
392
|
+
'possible' is the count of all observations of that type, and 'used' is the count of observations of that type
|
|
393
|
+
that passed quality control checks.
|
|
394
|
+
"""
|
|
395
|
+
possible = self.df.groupby('type')['observation'].count()
|
|
396
|
+
possible.rename('possible', inplace=True)
|
|
397
|
+
|
|
398
|
+
failed_qcs = self.select_failed_qcs().groupby('type')['observation'].count()
|
|
399
|
+
used = possible - failed_qcs.reindex(possible.index, fill_value=0)
|
|
400
|
+
used.rename('used', inplace=True)
|
|
401
|
+
|
|
402
|
+
return pd.concat([possible, used], axis=1).reset_index()
|
|
403
|
+
|
|
404
|
+
|
|
282
405
|
@staticmethod
|
|
283
406
|
def is_binary(file):
|
|
284
407
|
"""Check if a file is binary file."""
|
|
@@ -659,65 +782,6 @@ def convert_dart_time(seconds, days):
|
|
|
659
782
|
"""
|
|
660
783
|
time = dt.datetime(1601,1,1) + dt.timedelta(days=days, seconds=seconds)
|
|
661
784
|
return time
|
|
662
|
-
|
|
663
|
-
def select_by_dart_qc(df, dart_qc):
|
|
664
|
-
"""
|
|
665
|
-
Selects rows from a DataFrame based on the DART quality control flag.
|
|
666
|
-
|
|
667
|
-
Parameters:
|
|
668
|
-
df (DataFrame): A pandas DataFrame.
|
|
669
|
-
dart_qc (int): The DART quality control flag to select.
|
|
670
|
-
|
|
671
|
-
Returns:
|
|
672
|
-
DataFrame: A DataFrame containing only the rows with the specified DART quality control flag.
|
|
673
|
-
|
|
674
|
-
Raises:
|
|
675
|
-
ValueError: If the DART quality control flag is not present in the DataFrame.
|
|
676
|
-
"""
|
|
677
|
-
if dart_qc not in df['DART_quality_control'].unique():
|
|
678
|
-
raise ValueError(f"DART quality control flag '{dart_qc}' not found in DataFrame.")
|
|
679
|
-
else:
|
|
680
|
-
return df[df['DART_quality_control'] == dart_qc]
|
|
681
|
-
|
|
682
|
-
def select_failed_qcs(df):
|
|
683
|
-
"""
|
|
684
|
-
Selects rows from a DataFrame where the DART quality control flag is greater than 0.
|
|
685
|
-
|
|
686
|
-
Parameters:
|
|
687
|
-
df (DataFrame): A pandas DataFrame.
|
|
688
|
-
|
|
689
|
-
Returns:
|
|
690
|
-
DataFrame: A DataFrame containing only the rows with a DART quality control flag greater than 0.
|
|
691
|
-
"""
|
|
692
|
-
return df[df['DART_quality_control'] > 0]
|
|
693
|
-
|
|
694
|
-
def possible_vs_used(df):
|
|
695
|
-
"""
|
|
696
|
-
Calculates the count of possible vs. used observations by type.
|
|
697
|
-
|
|
698
|
-
This function takes a DataFrame containing observation data, including a 'type' column for the observation
|
|
699
|
-
type and an 'observation' column. The number of used observations ('used'), is the total number
|
|
700
|
-
minus the observations that failed quality control checks (as determined by the `select_failed_qcs` function).
|
|
701
|
-
The result is a DataFrame with each observation type, the count of possible observations, and the count of
|
|
702
|
-
used observations.
|
|
703
|
-
|
|
704
|
-
Parameters:
|
|
705
|
-
df (pd.DataFrame): A DataFrame with at least two columns: 'type' for the observation type and 'observation'
|
|
706
|
-
for the observation data. It may also contain other columns required by the `select_failed_qcs` function
|
|
707
|
-
to determine failed quality control checks.
|
|
708
|
-
|
|
709
|
-
Returns:
|
|
710
|
-
pd.DataFrame: A DataFrame with three columns: 'type', 'possible', and 'used'. 'type' is the observation type,
|
|
711
|
-
'possible' is the count of all observations of that type, and 'used' is the count of observations of that type
|
|
712
|
-
that passed quality control checks.
|
|
713
|
-
|
|
714
|
-
"""
|
|
715
|
-
possible = df.groupby('type')['observation'].count()
|
|
716
|
-
possible.rename('possible', inplace=True)
|
|
717
|
-
used = df.groupby('type')['observation'].count() - select_failed_qcs(df).groupby('type')['observation'].count()
|
|
718
|
-
used.rename('used', inplace=True)
|
|
719
|
-
return pd.concat([possible, used], axis=1).reset_index()
|
|
720
|
-
|
|
721
785
|
|
|
722
786
|
def construct_composit(df_comp, composite, components):
|
|
723
787
|
"""
|
pydartdiags/plots/plots.py
CHANGED
|
@@ -1,6 +1,7 @@
|
|
|
1
1
|
|
|
2
2
|
import numpy as np
|
|
3
3
|
import plotly.express as px
|
|
4
|
+
import plotly.graph_objects as go
|
|
4
5
|
import pandas as pd
|
|
5
6
|
|
|
6
7
|
def plot_rank_histogram(df):
|
|
@@ -62,55 +63,208 @@ def calculate_rank(df):
|
|
|
62
63
|
|
|
63
64
|
return (rank, ens_size, result_df)
|
|
64
65
|
|
|
65
|
-
def plot_profile(df, levels):
|
|
66
|
+
def plot_profile(df, levels, verticalUnit = "pressure (Pa)"):
|
|
66
67
|
"""
|
|
67
|
-
Plots RMSE and
|
|
68
|
+
Plots RMSE, bias, and total spread profiles for different observation types across specified vertical levels.
|
|
68
69
|
|
|
69
70
|
This function takes a DataFrame containing observational data and model predictions, categorizes
|
|
70
|
-
the data into specified
|
|
71
|
-
observation type. It then plots
|
|
72
|
-
of
|
|
73
|
-
the vertical profile in the atmosphere correctly.
|
|
71
|
+
the data into specified vertical levels, and calculates the RMSE, bias and total spread for each level and
|
|
72
|
+
observation type. It then plots three line charts: one for RMSE, one for bias, one for total spread, as functions
|
|
73
|
+
of vertical level. The vertical levels are plotted on the y-axis in reversed order to represent
|
|
74
|
+
the vertical profile in the atmosphere correctly if the vertical units are pressure.
|
|
74
75
|
|
|
75
76
|
Parameters:
|
|
76
|
-
df (pd.DataFrame): The input DataFrame containing at least the 'vertical' column for
|
|
77
|
-
and other columns required by the `rmse_bias` function for calculating RMSE and
|
|
78
|
-
|
|
77
|
+
df (pd.DataFrame): The input DataFrame containing at least the 'vertical' column for vertical levels,
|
|
78
|
+
the vert_unit column, and other columns required by the `rmse_bias` function for calculating RMSE and
|
|
79
|
+
Bias.
|
|
80
|
+
levels (array-like): The bin edges for categorizing the 'vertical' column values into the desired
|
|
81
|
+
vertical levels.
|
|
82
|
+
verticalUnit (string) (optional): The vertical unit to be used. Only observations in df which have this
|
|
83
|
+
string in the vert_unit column will be plotted. Defaults to 'pressure (Pa)'.
|
|
79
84
|
|
|
80
85
|
Returns:
|
|
81
|
-
tuple: A tuple containing the DataFrame with RMSE and
|
|
82
|
-
|
|
83
|
-
and '
|
|
86
|
+
tuple: A tuple containing the DataFrame with RMSE, bias and total spread calculations,
|
|
87
|
+
The DataFrame includes a 'vlevels' column representing the categorized vertical levels
|
|
88
|
+
and 'midpoint' column representing the midpoint of each vertical level bin. And the three figures.
|
|
84
89
|
|
|
85
90
|
Raises:
|
|
86
91
|
ValueError: If there are missing values in the 'vertical' column of the input DataFrame.
|
|
92
|
+
ValueError: If none of the input obs have 'verticalUnit' in the 'vert_unit' column of the input DataFrame.
|
|
87
93
|
|
|
88
94
|
Note:
|
|
89
|
-
- The function modifies the input DataFrame by adding '
|
|
90
|
-
- The '
|
|
91
|
-
adjustment based on the specific requirements for
|
|
95
|
+
- The function modifies the input DataFrame by adding 'vlevels' and 'midpoint' columns.
|
|
96
|
+
- The 'midpoint' values are calculated as half the midpoint of each vertical level bin, which may need
|
|
97
|
+
adjustment based on the specific requirements for vertical level representation.
|
|
92
98
|
- The plots are generated using Plotly Express and are displayed inline. The y-axis of the plots is
|
|
93
|
-
reversed to align with standard atmospheric pressure level representation
|
|
99
|
+
reversed to align with standard atmospheric pressure level representation if the vertical units
|
|
100
|
+
are atmospheric pressure.
|
|
94
101
|
"""
|
|
95
102
|
|
|
96
103
|
pd.options.mode.copy_on_write = True
|
|
97
104
|
if df['vertical'].isnull().values.any(): # what about horizontal observations?
|
|
98
105
|
raise ValueError("Missing values in 'vertical' column.")
|
|
106
|
+
elif verticalUnit not in df['vert_unit'].values:
|
|
107
|
+
raise ValueError("No obs with expected vertical unit '"+verticalUnit+"'.")
|
|
99
108
|
else:
|
|
100
|
-
df
|
|
101
|
-
df.loc[:,'
|
|
109
|
+
df = df[df["vert_unit"].isin({verticalUnit})] # Subset to only rows with the correct vertical unit
|
|
110
|
+
df.loc[:,'vlevels'] = pd.cut(df['vertical'], levels)
|
|
111
|
+
if verticalUnit == "pressure (Pa)":
|
|
112
|
+
df.loc[:,'midpoint'] = df['vlevels'].apply(lambda x: x.mid / 100.) # HK todo units
|
|
113
|
+
else:
|
|
114
|
+
df.loc[:,'midpoint'] = df['vlevels'].apply(lambda x: x.mid)
|
|
102
115
|
|
|
103
|
-
|
|
104
|
-
|
|
105
|
-
|
|
106
|
-
|
|
116
|
+
# Calculations
|
|
117
|
+
df_profile_prior = rmse_bias_totalspread(df, phase='prior')
|
|
118
|
+
df_profile_posterior = None
|
|
119
|
+
if 'posterior_ensemble_mean' in df.columns:
|
|
120
|
+
df_profile_posterior = rmse_bias_totalspread(df, phase='posterior')
|
|
107
121
|
|
|
108
|
-
|
|
109
|
-
|
|
110
|
-
|
|
122
|
+
# Merge prior and posterior dataframes
|
|
123
|
+
if df_profile_posterior is not None:
|
|
124
|
+
df_profile = pd.merge(df_profile_prior, df_profile_posterior, on=['midpoint', 'type'], suffixes=('_prior', '_posterior'))
|
|
125
|
+
fig_rmse = plot_profile_prior_post(df_profile, 'rmse', verticalUnit)
|
|
126
|
+
fig_rmse.show()
|
|
127
|
+
fig_bias = plot_profile_prior_post(df_profile, 'bias', verticalUnit)
|
|
128
|
+
fig_bias.show()
|
|
129
|
+
fig_ts = plot_profile_prior_post(df_profile, 'totalspread', verticalUnit)
|
|
130
|
+
fig_ts.show()
|
|
131
|
+
else:
|
|
132
|
+
df_profile = df_profile_prior
|
|
133
|
+
fig_rmse = plot_profile_prior(df_profile, 'rmse', verticalUnit)
|
|
134
|
+
fig_rmse.show()
|
|
135
|
+
fig_bias = plot_profile_prior(df_profile, 'bias', verticalUnit)
|
|
136
|
+
fig_bias.show()
|
|
137
|
+
fig_ts = plot_profile_prior(df_profile, 'totalspread', verticalUnit)
|
|
138
|
+
fig_ts.show()
|
|
111
139
|
|
|
112
|
-
return df_profile, fig_rmse, fig_bias
|
|
140
|
+
return df_profile, fig_rmse, fig_ts, fig_bias
|
|
113
141
|
|
|
142
|
+
def plot_profile_prior_post(df_profile, stat, verticalUnit):
|
|
143
|
+
"""
|
|
144
|
+
Plots prior and posterior statistics by vertical level for different observation types.
|
|
145
|
+
|
|
146
|
+
Parameters:
|
|
147
|
+
df_profile (pd.DataFrame): DataFrame containing the prior and posterior statistics.
|
|
148
|
+
stat (str): The statistic to plot (e.g., 'rmse', 'bias', 'totalspread').
|
|
149
|
+
verticalUnit (str): The unit of the vertical axis (e.g., 'pressure (Pa)').
|
|
150
|
+
|
|
151
|
+
Returns:
|
|
152
|
+
plotly.graph_objects.Figure: The generated Plotly figure.
|
|
153
|
+
"""
|
|
154
|
+
# Reshape DataFrame to long format for easier plotting
|
|
155
|
+
df_long = pd.melt(
|
|
156
|
+
df_profile,
|
|
157
|
+
id_vars=["midpoint", "type"],
|
|
158
|
+
value_vars=["prior_"+stat, "posterior_"+stat],
|
|
159
|
+
var_name=stat+"_type",
|
|
160
|
+
value_name=stat+"_value"
|
|
161
|
+
)
|
|
162
|
+
|
|
163
|
+
# Define a color mapping for observation each type
|
|
164
|
+
unique_types = df_long["type"].unique()
|
|
165
|
+
colors = px.colors.qualitative.Plotly
|
|
166
|
+
color_mapping = {type_: colors[i % len(colors)] for i, type_ in enumerate(unique_types)}
|
|
167
|
+
|
|
168
|
+
# Create a mapping for line styles based on stat
|
|
169
|
+
line_styles = {"prior_"+stat: "solid", "posterior_"+stat: "dash"}
|
|
170
|
+
|
|
171
|
+
# Create the figure
|
|
172
|
+
fig_stat = go.Figure()
|
|
173
|
+
|
|
174
|
+
# Loop through each type and type to add traces
|
|
175
|
+
for t in df_long["type"].unique():
|
|
176
|
+
for stat_type, dash_style in line_styles.items():
|
|
177
|
+
# Filter the DataFrame for this type and stat
|
|
178
|
+
df_filtered = df_long[(df_long[stat+"_type"] == stat_type) & (df_long["type"] == t)]
|
|
179
|
+
|
|
180
|
+
# Add a trace
|
|
181
|
+
fig_stat.add_trace(go.Scatter(
|
|
182
|
+
x=df_filtered[stat+"_value"],
|
|
183
|
+
y=df_filtered["midpoint"],
|
|
184
|
+
mode='lines+markers',
|
|
185
|
+
name='prior '+t if stat_type == "prior_"+stat else 'post ', # Show legend for "prior_stat OBS TYPE" only
|
|
186
|
+
line=dict(dash=dash_style, color=color_mapping[t]), # Same color for all traces in group
|
|
187
|
+
marker=dict(size=8, color=color_mapping[t]),
|
|
188
|
+
legendgroup=t # Group traces by type
|
|
189
|
+
))
|
|
190
|
+
|
|
191
|
+
# Update layout
|
|
192
|
+
fig_stat.update_layout(
|
|
193
|
+
title= stat+' by Level',
|
|
194
|
+
xaxis_title=stat,
|
|
195
|
+
yaxis_title=verticalUnit,
|
|
196
|
+
width=800,
|
|
197
|
+
height=800,
|
|
198
|
+
template="plotly_white"
|
|
199
|
+
)
|
|
200
|
+
|
|
201
|
+
if verticalUnit == "pressure (Pa)":
|
|
202
|
+
fig_stat.update_yaxes(autorange="reversed")
|
|
203
|
+
|
|
204
|
+
return fig_stat
|
|
205
|
+
|
|
206
|
+
|
|
207
|
+
def plot_profile_prior(df_profile, stat, verticalUnit):
|
|
208
|
+
"""
|
|
209
|
+
Plots prior statistics by vertical level for different observation types.
|
|
210
|
+
|
|
211
|
+
Parameters:
|
|
212
|
+
df_profile (pd.DataFrame): DataFrame containing the prior statistics.
|
|
213
|
+
stat (str): The statistic to plot (e.g., 'rmse', 'bias', 'totalspread').
|
|
214
|
+
verticalUnit (str): The unit of the vertical axis (e.g., 'pressure (Pa)').
|
|
215
|
+
|
|
216
|
+
Returns:
|
|
217
|
+
plotly.graph_objects.Figure: The generated Plotly figure.
|
|
218
|
+
"""
|
|
219
|
+
# Reshape DataFrame to long format for easier plotting - not needed for prior only, but
|
|
220
|
+
# leaving it in for consistency with the plot_profile_prior_post function for now
|
|
221
|
+
df_long = pd.melt(
|
|
222
|
+
df_profile,
|
|
223
|
+
id_vars=["midpoint", "type"],
|
|
224
|
+
value_vars=["prior_"+stat],
|
|
225
|
+
var_name=stat+"_type",
|
|
226
|
+
value_name=stat+"_value"
|
|
227
|
+
)
|
|
228
|
+
|
|
229
|
+
# Define a color mapping for observation each type
|
|
230
|
+
unique_types = df_long["type"].unique()
|
|
231
|
+
colors = px.colors.qualitative.Plotly
|
|
232
|
+
color_mapping = {type_: colors[i % len(colors)] for i, type_ in enumerate(unique_types)}
|
|
233
|
+
|
|
234
|
+
# Create the figure
|
|
235
|
+
fig_stat = go.Figure()
|
|
236
|
+
|
|
237
|
+
# Loop through each type to add traces
|
|
238
|
+
for t in df_long["type"].unique():
|
|
239
|
+
# Filter the DataFrame for this type and stat
|
|
240
|
+
df_filtered = df_long[(df_long["type"] == t)]
|
|
241
|
+
|
|
242
|
+
# Add a trace
|
|
243
|
+
fig_stat.add_trace(go.Scatter(
|
|
244
|
+
x=df_filtered[stat+"_value"],
|
|
245
|
+
y=df_filtered["midpoint"],
|
|
246
|
+
mode='lines+markers',
|
|
247
|
+
name='prior ' + t,
|
|
248
|
+
line=dict(color=color_mapping[t]), # Same color for all traces in group
|
|
249
|
+
marker=dict(size=8, color=color_mapping[t]),
|
|
250
|
+
legendgroup=t # Group traces by type
|
|
251
|
+
))
|
|
252
|
+
|
|
253
|
+
# Update layout
|
|
254
|
+
fig_stat.update_layout(
|
|
255
|
+
title=stat + ' by Level',
|
|
256
|
+
xaxis_title=stat,
|
|
257
|
+
yaxis_title=verticalUnit,
|
|
258
|
+
width=800,
|
|
259
|
+
height=800,
|
|
260
|
+
template="plotly_white"
|
|
261
|
+
)
|
|
262
|
+
|
|
263
|
+
if verticalUnit == "pressure (Pa)":
|
|
264
|
+
fig_stat.update_yaxes(autorange="reversed")
|
|
265
|
+
|
|
266
|
+
return fig_stat
|
|
267
|
+
|
|
114
268
|
|
|
115
269
|
def mean_then_sqrt(x):
|
|
116
270
|
"""
|
|
@@ -130,12 +284,36 @@ def mean_then_sqrt(x):
|
|
|
130
284
|
|
|
131
285
|
return np.sqrt(np.mean(x))
|
|
132
286
|
|
|
133
|
-
def
|
|
134
|
-
|
|
135
|
-
|
|
136
|
-
|
|
137
|
-
|
|
287
|
+
def rmse_bias_totalspread(df, phase='prior'):
|
|
288
|
+
if phase == 'prior':
|
|
289
|
+
sq_err_column = 'prior_sq_err'
|
|
290
|
+
bias_column = 'prior_bias'
|
|
291
|
+
rmse_column = 'prior_rmse'
|
|
292
|
+
spread_column = 'prior_ensemble_spread'
|
|
293
|
+
totalspread_column = 'prior_totalspread'
|
|
294
|
+
elif phase == 'posterior':
|
|
295
|
+
sq_err_column = 'posterior_sq_err'
|
|
296
|
+
bias_column = 'posterior_bias'
|
|
297
|
+
rmse_column = 'posterior_rmse'
|
|
298
|
+
spread_column = 'posterior_ensemble_spread'
|
|
299
|
+
totalspread_column = 'posterior_totalspread'
|
|
300
|
+
else:
|
|
301
|
+
raise ValueError("Invalid phase. Must be 'prior' or 'posterior'.")
|
|
302
|
+
|
|
303
|
+
rmse_bias_ts_df = df.groupby(['midpoint', 'type'], observed=False).agg({
|
|
304
|
+
sq_err_column: mean_then_sqrt,
|
|
305
|
+
bias_column: 'mean',
|
|
306
|
+
spread_column: mean_then_sqrt,
|
|
307
|
+
'obs_err_var': mean_then_sqrt
|
|
308
|
+
}).reset_index()
|
|
138
309
|
|
|
310
|
+
# Add column for totalspread
|
|
311
|
+
rmse_bias_ts_df[totalspread_column] = np.sqrt(rmse_bias_ts_df[spread_column] + rmse_bias_ts_df['obs_err_var'])
|
|
312
|
+
|
|
313
|
+
# Rename square error to root mean square error
|
|
314
|
+
rmse_bias_ts_df.rename(columns={sq_err_column: rmse_column}, inplace=True)
|
|
315
|
+
|
|
316
|
+
return rmse_bias_ts_df
|
|
139
317
|
|
|
140
318
|
def rmse_bias_by_obs_type(df, obs_type):
|
|
141
319
|
"""
|
|
@@ -155,7 +333,7 @@ def rmse_bias_by_obs_type(df, obs_type):
|
|
|
155
333
|
raise ValueError(f"Observation type '{obs_type}' not found in DataFrame.")
|
|
156
334
|
else:
|
|
157
335
|
obs_type_df = df[df['type'] == obs_type]
|
|
158
|
-
obs_type_agg = obs_type_df.groupby('
|
|
336
|
+
obs_type_agg = obs_type_df.groupby('vlevels', observed=False).agg({'sq_err':mean_then_sqrt, 'bias':'mean'}).reset_index()
|
|
159
337
|
obs_type_agg.rename(columns={'sq_err':'rmse'}, inplace=True)
|
|
160
338
|
return obs_type_agg
|
|
161
339
|
|
|
@@ -0,0 +1,45 @@
|
|
|
1
|
+
Metadata-Version: 2.1
|
|
2
|
+
Name: pydartdiags
|
|
3
|
+
Version: 0.0.43
|
|
4
|
+
Summary: Observation Sequence Diagnostics for DART
|
|
5
|
+
Home-page: https://github.com/NCAR/pyDARTdiags.git
|
|
6
|
+
Author: Helen Kershaw
|
|
7
|
+
Author-email: Helen Kershaw <hkershaw@ucar.edu>
|
|
8
|
+
Project-URL: Homepage, https://github.com/NCAR/pyDARTdiags.git
|
|
9
|
+
Project-URL: Issues, https://github.com/NCAR/pyDARTdiags/issues
|
|
10
|
+
Project-URL: Documentation, https://ncar.github.io/pyDARTdiags
|
|
11
|
+
Classifier: Programming Language :: Python :: 3
|
|
12
|
+
Classifier: License :: OSI Approved :: Apache Software License
|
|
13
|
+
Classifier: Operating System :: OS Independent
|
|
14
|
+
Requires-Python: >=3.8
|
|
15
|
+
Description-Content-Type: text/markdown
|
|
16
|
+
License-File: LICENSE
|
|
17
|
+
Requires-Dist: pandas>=2.2.0
|
|
18
|
+
Requires-Dist: numpy>=1.26
|
|
19
|
+
Requires-Dist: plotly>=5.22.0
|
|
20
|
+
Requires-Dist: pyyaml>=6.0.2
|
|
21
|
+
|
|
22
|
+
[](https://opensource.org/licenses/Apache-2.0)
|
|
23
|
+
[](https://codecov.io/gh/NCAR/pyDARTdiags)
|
|
24
|
+
[](https://pypi.org/project/pydartdiags/)
|
|
25
|
+
|
|
26
|
+
|
|
27
|
+
# pyDARTdiags
|
|
28
|
+
|
|
29
|
+
pyDARTdiags is a Python library for obsevation space diagnostics for the Data Assimilation Research Testbed ([DART](https://github.com/NCAR/DART)).
|
|
30
|
+
|
|
31
|
+
pyDARTdiags is under initial development, so please use caution.
|
|
32
|
+
The MATLAB [observation space diagnostics](https://docs.dart.ucar.edu/en/latest/guide/matlab-observation-space.html) are available through [DART](https://github.com/NCAR/DART).
|
|
33
|
+
|
|
34
|
+
|
|
35
|
+
pyDARTdiags can be installed through pip: https://pypi.org/project/pydartdiags/
|
|
36
|
+
Documenation : https://ncar.github.io/pyDARTdiags/
|
|
37
|
+
|
|
38
|
+
## Contributing
|
|
39
|
+
Contributions are welcome! If you have a feature request, bug report, or a suggestion, please open an issue on our GitHub repository.
|
|
40
|
+
Please read our [Contributors Guide](https://github.com/NCAR/pyDARTdiags/blob/main/CONTRIBUTING.md) if you would like to contribute to
|
|
41
|
+
pyDARTdiags.
|
|
42
|
+
|
|
43
|
+
## License
|
|
44
|
+
|
|
45
|
+
pyDARTdiags is released under the Apache License 2.0. For more details, see the LICENSE file in the root directory of this source tree or visit [Apache License 2.0](https://www.apache.org/licenses/LICENSE-2.0).
|
|
@@ -0,0 +1,10 @@
|
|
|
1
|
+
pydartdiags/__init__.py,sha256=47DEQpj8HBSa-_TImW-5JCeuQeRkm5NMpJWZG3hSuFU,0
|
|
2
|
+
pydartdiags/obs_sequence/__init__.py,sha256=47DEQpj8HBSa-_TImW-5JCeuQeRkm5NMpJWZG3hSuFU,0
|
|
3
|
+
pydartdiags/obs_sequence/obs_sequence.py,sha256=2pddiJ6VRFkaDizYq8HvGUpC4rw7TTV14XjmemjqCNg,34187
|
|
4
|
+
pydartdiags/plots/__init__.py,sha256=47DEQpj8HBSa-_TImW-5JCeuQeRkm5NMpJWZG3hSuFU,0
|
|
5
|
+
pydartdiags/plots/plots.py,sha256=UecLgWauO9L_EaGhEVxW3IuKcSU95uRA2mptsxh4-0E,13901
|
|
6
|
+
pydartdiags-0.0.43.dist-info/LICENSE,sha256=ROglds_Eg_ylXp-1MHmEawDqMw_UsCB4r9sk7z9PU9M,11377
|
|
7
|
+
pydartdiags-0.0.43.dist-info/METADATA,sha256=udwmddMTrqFpyj0tjOffWVf2xbTI_3IwQCS4ZVvnnuU,2185
|
|
8
|
+
pydartdiags-0.0.43.dist-info/WHEEL,sha256=A3WOREP4zgxI0fKrHUG8DC8013e3dK3n7a6HDbcEIwE,91
|
|
9
|
+
pydartdiags-0.0.43.dist-info/top_level.txt,sha256=LfMoPLnSd0VhhlWev1eeX9t6AzvyASOloag0LO_ppWg,12
|
|
10
|
+
pydartdiags-0.0.43.dist-info/RECORD,,
|
|
@@ -1,404 +0,0 @@
|
|
|
1
|
-
Metadata-Version: 2.1
|
|
2
|
-
Name: pydartdiags
|
|
3
|
-
Version: 0.0.42
|
|
4
|
-
Summary: Observation Sequence Diagnostics for DART
|
|
5
|
-
Home-page: https://github.com/NCAR/pyDARTdiags.git
|
|
6
|
-
Author: Helen Kershaw
|
|
7
|
-
Author-email: Helen Kershaw <hkershaw@ucar.edu>
|
|
8
|
-
Project-URL: Homepage, https://github.com/NCAR/pyDARTdiags.git
|
|
9
|
-
Project-URL: Issues, https://github.com/NCAR/pyDARTdiags/issues
|
|
10
|
-
Project-URL: Documentation, https://ncar.github.io/pyDARTdiags
|
|
11
|
-
Classifier: Programming Language :: Python :: 3
|
|
12
|
-
Classifier: License :: OSI Approved :: Apache Software License
|
|
13
|
-
Classifier: Operating System :: OS Independent
|
|
14
|
-
Requires-Python: >=3.8
|
|
15
|
-
Description-Content-Type: text/markdown
|
|
16
|
-
License-File: LICENSE
|
|
17
|
-
Requires-Dist: pandas>=2.2.0
|
|
18
|
-
Requires-Dist: numpy>=1.26
|
|
19
|
-
Requires-Dist: plotly>=5.22.0
|
|
20
|
-
Requires-Dist: pyyaml>=6.0.2
|
|
21
|
-
|
|
22
|
-
[](https://opensource.org/licenses/Apache-2.0)
|
|
23
|
-
[](https://codecov.io/gh/NCAR/pyDARTdiags)
|
|
24
|
-
[](https://pypi.org/project/pydartdiags/)
|
|
25
|
-
|
|
26
|
-
|
|
27
|
-
# pyDARTdiags
|
|
28
|
-
|
|
29
|
-
pyDARTdiags is a Python library for obsevation space diagnostics for the Data Assimilation Research Testbed ([DART](https://github.com/NCAR/DART)).
|
|
30
|
-
|
|
31
|
-
pyDARTdiags is under initial development, so please use caution.
|
|
32
|
-
The MATLAB [observation space diagnostics](https://docs.dart.ucar.edu/en/latest/guide/matlab-observation-space.html) are available through [DART](https://github.com/NCAR/DART).
|
|
33
|
-
|
|
34
|
-
|
|
35
|
-
pyDARTdiags can be installed through pip: https://pypi.org/project/pydartdiags/
|
|
36
|
-
Documenation : https://ncar.github.io/pyDARTdiags/
|
|
37
|
-
|
|
38
|
-
We recommend installing pydartdiags in a virtual enviroment:
|
|
39
|
-
|
|
40
|
-
|
|
41
|
-
```
|
|
42
|
-
python3 -m venv dartdiags
|
|
43
|
-
source dartdiags/bin/activate
|
|
44
|
-
pip install pydartdiags
|
|
45
|
-
```
|
|
46
|
-
|
|
47
|
-
## Example importing the obs\_sequence and plots modules
|
|
48
|
-
|
|
49
|
-
```python
|
|
50
|
-
from pydartdiags.obs_sequence import obs_sequence as obsq
|
|
51
|
-
from pydartdiags.plots import plots
|
|
52
|
-
```
|
|
53
|
-
|
|
54
|
-
## Examining the dataframe
|
|
55
|
-
|
|
56
|
-
```python
|
|
57
|
-
obs_seq = obsq.obs_sequence('obs_seq.final.ascii')
|
|
58
|
-
obs_seq.df.head()
|
|
59
|
-
```
|
|
60
|
-
|
|
61
|
-
<table border="1" class="dataframe">
|
|
62
|
-
<thead>
|
|
63
|
-
<tr style="text-align: right;">
|
|
64
|
-
<th></th>
|
|
65
|
-
<th>obs_num</th>
|
|
66
|
-
<th>observation</th>
|
|
67
|
-
<th>prior_ensemble_mean</th>
|
|
68
|
-
<th>prior_ensemble_spread</th>
|
|
69
|
-
<th>prior_ensemble_member_1</th>
|
|
70
|
-
<th>prior_ensemble_member_2</th>
|
|
71
|
-
<th>prior_ensemble_member_3</th>
|
|
72
|
-
<th>prior_ensemble_member_4</th>
|
|
73
|
-
<th>prior_ensemble_member_5</th>
|
|
74
|
-
<th>prior_ensemble_member_6</th>
|
|
75
|
-
<th>...</th>
|
|
76
|
-
<th>latitude</th>
|
|
77
|
-
<th>vertical</th>
|
|
78
|
-
<th>vert_unit</th>
|
|
79
|
-
<th>type</th>
|
|
80
|
-
<th>seconds</th>
|
|
81
|
-
<th>days</th>
|
|
82
|
-
<th>time</th>
|
|
83
|
-
<th>obs_err_var</th>
|
|
84
|
-
<th>bias</th>
|
|
85
|
-
<th>sq_err</th>
|
|
86
|
-
</tr>
|
|
87
|
-
</thead>
|
|
88
|
-
<tbody>
|
|
89
|
-
<tr>
|
|
90
|
-
<th>0</th>
|
|
91
|
-
<td>1</td>
|
|
92
|
-
<td>230.16</td>
|
|
93
|
-
<td>231.310652</td>
|
|
94
|
-
<td>0.405191</td>
|
|
95
|
-
<td>231.304725</td>
|
|
96
|
-
<td>231.562874</td>
|
|
97
|
-
<td>231.333915</td>
|
|
98
|
-
<td>231.297690</td>
|
|
99
|
-
<td>232.081416</td>
|
|
100
|
-
<td>231.051063</td>
|
|
101
|
-
<td>...</td>
|
|
102
|
-
<td>0.012188</td>
|
|
103
|
-
<td>23950.0</td>
|
|
104
|
-
<td>pressure (Pa)</td>
|
|
105
|
-
<td>ACARS_TEMPERATURE</td>
|
|
106
|
-
<td>75603</td>
|
|
107
|
-
<td>153005</td>
|
|
108
|
-
<td>2019-12-01 21:00:03</td>
|
|
109
|
-
<td>1.00</td>
|
|
110
|
-
<td>1.150652</td>
|
|
111
|
-
<td>1.324001</td>
|
|
112
|
-
</tr>
|
|
113
|
-
<tr>
|
|
114
|
-
<th>1</th>
|
|
115
|
-
<td>2</td>
|
|
116
|
-
<td>18.40</td>
|
|
117
|
-
<td>15.720527</td>
|
|
118
|
-
<td>0.630827</td>
|
|
119
|
-
<td>14.217207</td>
|
|
120
|
-
<td>15.558196</td>
|
|
121
|
-
<td>15.805599</td>
|
|
122
|
-
<td>16.594644</td>
|
|
123
|
-
<td>14.877743</td>
|
|
124
|
-
<td>16.334438</td>
|
|
125
|
-
<td>...</td>
|
|
126
|
-
<td>0.012188</td>
|
|
127
|
-
<td>23950.0</td>
|
|
128
|
-
<td>pressure (Pa)</td>
|
|
129
|
-
<td>ACARS_U_WIND_COMPONENT</td>
|
|
130
|
-
<td>75603</td>
|
|
131
|
-
<td>153005</td>
|
|
132
|
-
<td>2019-12-01 21:00:03</td>
|
|
133
|
-
<td>6.25</td>
|
|
134
|
-
<td>-2.679473</td>
|
|
135
|
-
<td>7.179578</td>
|
|
136
|
-
</tr>
|
|
137
|
-
<tr>
|
|
138
|
-
<th>2</th>
|
|
139
|
-
<td>3</td>
|
|
140
|
-
<td>1.60</td>
|
|
141
|
-
<td>-4.932073</td>
|
|
142
|
-
<td>0.825899</td>
|
|
143
|
-
<td>-5.270562</td>
|
|
144
|
-
<td>-5.955998</td>
|
|
145
|
-
<td>-4.209766</td>
|
|
146
|
-
<td>-5.105016</td>
|
|
147
|
-
<td>-4.669405</td>
|
|
148
|
-
<td>-4.365305</td>
|
|
149
|
-
<td>...</td>
|
|
150
|
-
<td>0.012188</td>
|
|
151
|
-
<td>23950.0</td>
|
|
152
|
-
<td>pressure (Pa)</td>
|
|
153
|
-
<td>ACARS_V_WIND_COMPONENT</td>
|
|
154
|
-
<td>75603</td>
|
|
155
|
-
<td>153005</td>
|
|
156
|
-
<td>2019-12-01 21:00:03</td>
|
|
157
|
-
<td>6.25</td>
|
|
158
|
-
<td>-6.532073</td>
|
|
159
|
-
<td>42.667980</td>
|
|
160
|
-
</tr>
|
|
161
|
-
<tr>
|
|
162
|
-
<th>3</th>
|
|
163
|
-
<td>4</td>
|
|
164
|
-
<td>264.16</td>
|
|
165
|
-
<td>264.060532</td>
|
|
166
|
-
<td>0.035584</td>
|
|
167
|
-
<td>264.107192</td>
|
|
168
|
-
<td>264.097270</td>
|
|
169
|
-
<td>264.073212</td>
|
|
170
|
-
<td>264.047718</td>
|
|
171
|
-
<td>264.074140</td>
|
|
172
|
-
<td>264.019895</td>
|
|
173
|
-
<td>...</td>
|
|
174
|
-
<td>0.010389</td>
|
|
175
|
-
<td>56260.0</td>
|
|
176
|
-
<td>pressure (Pa)</td>
|
|
177
|
-
<td>ACARS_TEMPERATURE</td>
|
|
178
|
-
<td>75603</td>
|
|
179
|
-
<td>153005</td>
|
|
180
|
-
<td>2019-12-01 21:00:03</td>
|
|
181
|
-
<td>1.00</td>
|
|
182
|
-
<td>-0.099468</td>
|
|
183
|
-
<td>0.009894</td>
|
|
184
|
-
</tr>
|
|
185
|
-
<tr>
|
|
186
|
-
<th>4</th>
|
|
187
|
-
<td>5</td>
|
|
188
|
-
<td>11.60</td>
|
|
189
|
-
<td>10.134115</td>
|
|
190
|
-
<td>0.063183</td>
|
|
191
|
-
<td>10.067956</td>
|
|
192
|
-
<td>10.078798</td>
|
|
193
|
-
<td>10.120263</td>
|
|
194
|
-
<td>10.084885</td>
|
|
195
|
-
<td>10.135112</td>
|
|
196
|
-
<td>10.140610</td>
|
|
197
|
-
<td>...</td>
|
|
198
|
-
<td>0.010389</td>
|
|
199
|
-
<td>56260.0</td>
|
|
200
|
-
<td>pressure (Pa)</td>
|
|
201
|
-
<td>ACARS_U_WIND_COMPONENT</td>
|
|
202
|
-
<td>75603</td>
|
|
203
|
-
<td>153005</td>
|
|
204
|
-
<td>2019-12-01 21:00:03</td>
|
|
205
|
-
<td>6.25</td>
|
|
206
|
-
<td>-1.465885</td>
|
|
207
|
-
<td>2.148818</td>
|
|
208
|
-
</tr>
|
|
209
|
-
</tbody>
|
|
210
|
-
</table>
|
|
211
|
-
<p>5 rows × 97 columns</p>
|
|
212
|
-
</div>
|
|
213
|
-
|
|
214
|
-
|
|
215
|
-
Find the numeber of assimilated (used) observations vs. possible observations by type
|
|
216
|
-
|
|
217
|
-
```python
|
|
218
|
-
obsq.possible_vs_used(obs_seq.df)
|
|
219
|
-
```
|
|
220
|
-
|
|
221
|
-
<table border="1" class="dataframe">
|
|
222
|
-
<thead>
|
|
223
|
-
<tr style="text-align: right;">
|
|
224
|
-
<th></th>
|
|
225
|
-
<th>type</th>
|
|
226
|
-
<th>possible</th>
|
|
227
|
-
<th>used</th>
|
|
228
|
-
</tr>
|
|
229
|
-
</thead>
|
|
230
|
-
<tbody>
|
|
231
|
-
<tr>
|
|
232
|
-
<th>0</th>
|
|
233
|
-
<td>ACARS_TEMPERATURE</td>
|
|
234
|
-
<td>175429</td>
|
|
235
|
-
<td>128040</td>
|
|
236
|
-
</tr>
|
|
237
|
-
<tr>
|
|
238
|
-
<th>1</th>
|
|
239
|
-
<td>ACARS_U_WIND_COMPONENT</td>
|
|
240
|
-
<td>176120</td>
|
|
241
|
-
<td>126946</td>
|
|
242
|
-
</tr>
|
|
243
|
-
<tr>
|
|
244
|
-
<th>2</th>
|
|
245
|
-
<td>ACARS_V_WIND_COMPONENT</td>
|
|
246
|
-
<td>176120</td>
|
|
247
|
-
<td>127834</td>
|
|
248
|
-
</tr>
|
|
249
|
-
<tr>
|
|
250
|
-
<th>3</th>
|
|
251
|
-
<td>AIRCRAFT_TEMPERATURE</td>
|
|
252
|
-
<td>21335</td>
|
|
253
|
-
<td>13663</td>
|
|
254
|
-
</tr>
|
|
255
|
-
<tr>
|
|
256
|
-
<th>4</th>
|
|
257
|
-
<td>AIRCRAFT_U_WIND_COMPONENT</td>
|
|
258
|
-
<td>21044</td>
|
|
259
|
-
<td>13694</td>
|
|
260
|
-
</tr>
|
|
261
|
-
<tr>
|
|
262
|
-
<th>5</th>
|
|
263
|
-
<td>AIRCRAFT_V_WIND_COMPONENT</td>
|
|
264
|
-
<td>21044</td>
|
|
265
|
-
<td>13642</td>
|
|
266
|
-
</tr>
|
|
267
|
-
<tr>
|
|
268
|
-
<th>6</th>
|
|
269
|
-
<td>AIRS_SPECIFIC_HUMIDITY</td>
|
|
270
|
-
<td>6781</td>
|
|
271
|
-
<td>0</td>
|
|
272
|
-
</tr>
|
|
273
|
-
<tr>
|
|
274
|
-
<th>7</th>
|
|
275
|
-
<td>AIRS_TEMPERATURE</td>
|
|
276
|
-
<td>19583</td>
|
|
277
|
-
<td>7901</td>
|
|
278
|
-
</tr>
|
|
279
|
-
<tr>
|
|
280
|
-
<th>8</th>
|
|
281
|
-
<td>GPSRO_REFRACTIVITY</td>
|
|
282
|
-
<td>81404</td>
|
|
283
|
-
<td>54626</td>
|
|
284
|
-
</tr>
|
|
285
|
-
<tr>
|
|
286
|
-
<th>9</th>
|
|
287
|
-
<td>LAND_SFC_ALTIMETER</td>
|
|
288
|
-
<td>21922</td>
|
|
289
|
-
<td>0</td>
|
|
290
|
-
</tr>
|
|
291
|
-
<tr>
|
|
292
|
-
<th>10</th>
|
|
293
|
-
<td>MARINE_SFC_ALTIMETER</td>
|
|
294
|
-
<td>9987</td>
|
|
295
|
-
<td>0</td>
|
|
296
|
-
</tr>
|
|
297
|
-
<tr>
|
|
298
|
-
<th>11</th>
|
|
299
|
-
<td>MARINE_SFC_SPECIFIC_HUMIDITY</td>
|
|
300
|
-
<td>4196</td>
|
|
301
|
-
<td>0</td>
|
|
302
|
-
</tr>
|
|
303
|
-
<tr>
|
|
304
|
-
<th>12</th>
|
|
305
|
-
<td>MARINE_SFC_TEMPERATURE</td>
|
|
306
|
-
<td>8646</td>
|
|
307
|
-
<td>0</td>
|
|
308
|
-
</tr>
|
|
309
|
-
<tr>
|
|
310
|
-
<th>13</th>
|
|
311
|
-
<td>MARINE_SFC_U_WIND_COMPONENT</td>
|
|
312
|
-
<td>8207</td>
|
|
313
|
-
<td>0</td>
|
|
314
|
-
</tr>
|
|
315
|
-
<tr>
|
|
316
|
-
<th>14</th>
|
|
317
|
-
<td>MARINE_SFC_V_WIND_COMPONENT</td>
|
|
318
|
-
<td>8207</td>
|
|
319
|
-
<td>0</td>
|
|
320
|
-
</tr>
|
|
321
|
-
<tr>
|
|
322
|
-
<th>15</th>
|
|
323
|
-
<td>RADIOSONDE_SPECIFIC_HUMIDITY</td>
|
|
324
|
-
<td>14272</td>
|
|
325
|
-
<td>0</td>
|
|
326
|
-
</tr>
|
|
327
|
-
<tr>
|
|
328
|
-
<th>16</th>
|
|
329
|
-
<td>RADIOSONDE_SURFACE_ALTIMETER</td>
|
|
330
|
-
<td>601</td>
|
|
331
|
-
<td>0</td>
|
|
332
|
-
</tr>
|
|
333
|
-
<tr>
|
|
334
|
-
<th>17</th>
|
|
335
|
-
<td>RADIOSONDE_TEMPERATURE</td>
|
|
336
|
-
<td>29275</td>
|
|
337
|
-
<td>22228</td>
|
|
338
|
-
</tr>
|
|
339
|
-
<tr>
|
|
340
|
-
<th>18</th>
|
|
341
|
-
<td>RADIOSONDE_U_WIND_COMPONENT</td>
|
|
342
|
-
<td>36214</td>
|
|
343
|
-
<td>27832</td>
|
|
344
|
-
</tr>
|
|
345
|
-
<tr>
|
|
346
|
-
<th>19</th>
|
|
347
|
-
<td>RADIOSONDE_V_WIND_COMPONENT</td>
|
|
348
|
-
<td>36214</td>
|
|
349
|
-
<td>27975</td>
|
|
350
|
-
</tr>
|
|
351
|
-
<tr>
|
|
352
|
-
<th>20</th>
|
|
353
|
-
<td>SAT_U_WIND_COMPONENT</td>
|
|
354
|
-
<td>107212</td>
|
|
355
|
-
<td>82507</td>
|
|
356
|
-
</tr>
|
|
357
|
-
<tr>
|
|
358
|
-
<th>21</th>
|
|
359
|
-
<td>SAT_V_WIND_COMPONENT</td>
|
|
360
|
-
<td>107212</td>
|
|
361
|
-
<td>82647</td>
|
|
362
|
-
</tr>
|
|
363
|
-
</tbody>
|
|
364
|
-
</table>
|
|
365
|
-
|
|
366
|
-
|
|
367
|
-
## Example plotting
|
|
368
|
-
|
|
369
|
-
### rank histogram
|
|
370
|
-
|
|
371
|
-
* Select only observations that were assimliated (QC === 0).
|
|
372
|
-
* plot the rank histogram
|
|
373
|
-
|
|
374
|
-
```python
|
|
375
|
-
df_qc0 = obsq.select_by_dart_qc(obs_seq.df, 0)
|
|
376
|
-
plots.plot_rank_histogram(df_qc0)
|
|
377
|
-
```
|
|
378
|
-
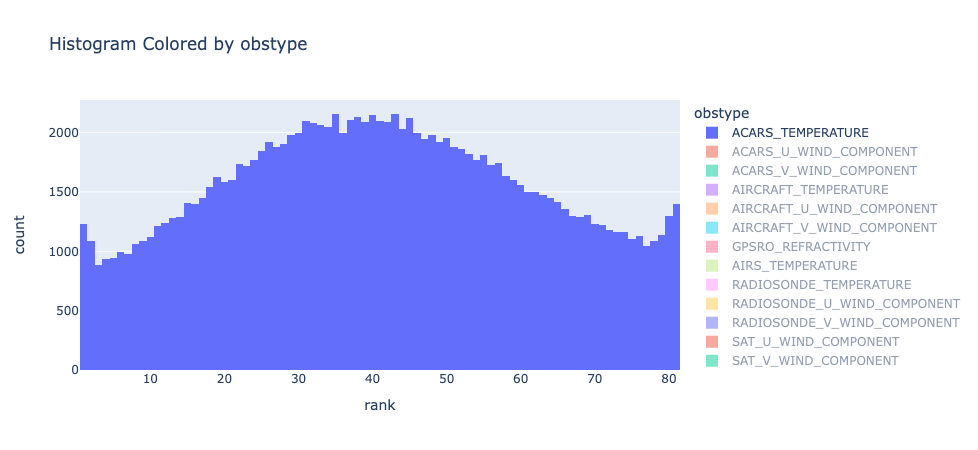
|
|
379
|
-
|
|
380
|
-
|
|
381
|
-
### plot profile of RMSE and Bias
|
|
382
|
-
|
|
383
|
-
* Chose levels
|
|
384
|
-
* Select only observations that were assimliated (QC === 0).
|
|
385
|
-
* plot the profiles
|
|
386
|
-
|
|
387
|
-
```python
|
|
388
|
-
hPalevels = [0.0, 100.0, 150.0, 200.0, 250.0, 300.0, 400.0, 500.0, 700, 850, 925, 1000]# float("inf")] # Pa?
|
|
389
|
-
plevels = [i * 100 for i in hPalevels]
|
|
390
|
-
|
|
391
|
-
df_qc0 = obsq.select_by_dart_qc(obs_seq.df, 0) # only qc 0
|
|
392
|
-
df_profile, figrmse, figbias = plots.plot_profile(df_qc0, plevels)
|
|
393
|
-
```
|
|
394
|
-
|
|
395
|
-
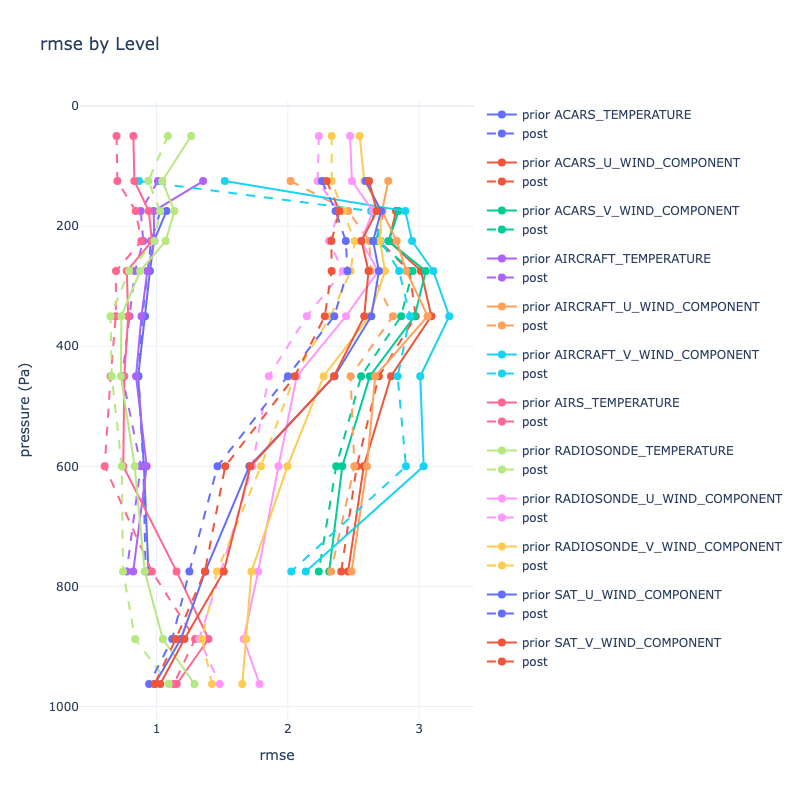
|
|
396
|
-
|
|
397
|
-
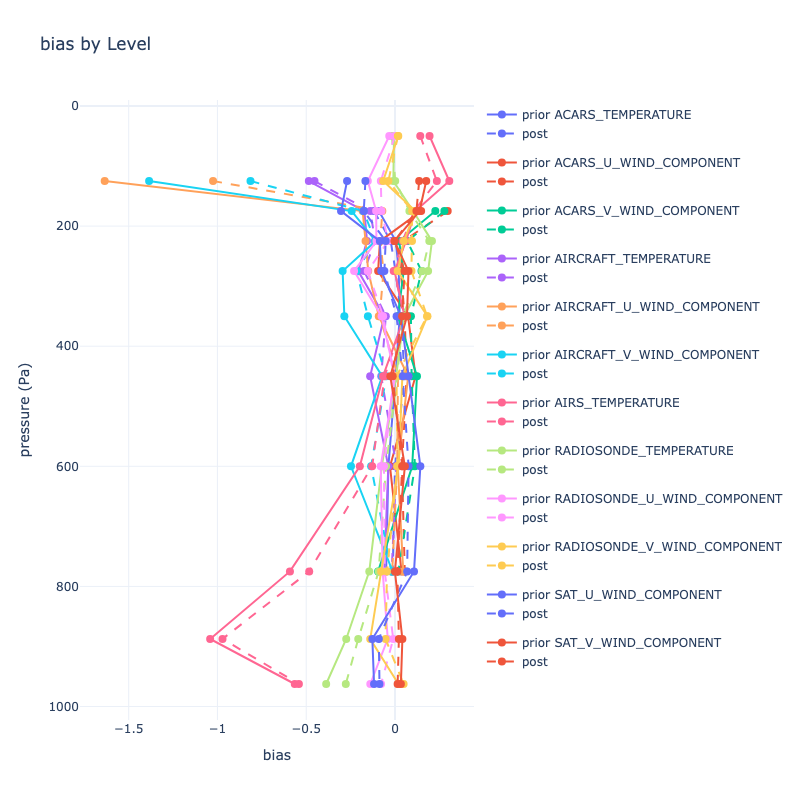
|
|
398
|
-
|
|
399
|
-
## Contributing
|
|
400
|
-
Contributions are welcome! If you have a feature request, bug report, or a suggestion, please open an issue on our GitHub repository.
|
|
401
|
-
|
|
402
|
-
## License
|
|
403
|
-
|
|
404
|
-
pyDARTdiags is released under the Apache License 2.0. For more details, see the LICENSE file in the root directory of this source tree or visit [Apache License 2.0](https://www.apache.org/licenses/LICENSE-2.0).
|
|
@@ -1,10 +0,0 @@
|
|
|
1
|
-
pydartdiags/__init__.py,sha256=47DEQpj8HBSa-_TImW-5JCeuQeRkm5NMpJWZG3hSuFU,0
|
|
2
|
-
pydartdiags/obs_sequence/__init__.py,sha256=47DEQpj8HBSa-_TImW-5JCeuQeRkm5NMpJWZG3hSuFU,0
|
|
3
|
-
pydartdiags/obs_sequence/obs_sequence.py,sha256=UBaNMJR3MOro47KyJMdgJ0p-aEqcrp817-SOtpFQ1bg,31511
|
|
4
|
-
pydartdiags/plots/__init__.py,sha256=47DEQpj8HBSa-_TImW-5JCeuQeRkm5NMpJWZG3hSuFU,0
|
|
5
|
-
pydartdiags/plots/plots.py,sha256=_vZFgQ9qrmtwE_HAP6_nx3pV4JHRdnYckZ5xUxUH4io,6753
|
|
6
|
-
pydartdiags-0.0.42.dist-info/LICENSE,sha256=ROglds_Eg_ylXp-1MHmEawDqMw_UsCB4r9sk7z9PU9M,11377
|
|
7
|
-
pydartdiags-0.0.42.dist-info/METADATA,sha256=oJe2bv1cjoIhlpJQF2tLIIGhS5zu5qJJzFYEZw9ffgQ,9857
|
|
8
|
-
pydartdiags-0.0.42.dist-info/WHEEL,sha256=GV9aMThwP_4oNCtvEC2ec3qUYutgWeAzklro_0m4WJQ,91
|
|
9
|
-
pydartdiags-0.0.42.dist-info/top_level.txt,sha256=LfMoPLnSd0VhhlWev1eeX9t6AzvyASOloag0LO_ppWg,12
|
|
10
|
-
pydartdiags-0.0.42.dist-info/RECORD,,
|
|
File without changes
|
|
File without changes
|