pyFlightPlotter 0.3.1__py3-none-any.whl
This diff represents the content of publicly available package versions that have been released to one of the supported registries. The information contained in this diff is provided for informational purposes only and reflects changes between package versions as they appear in their respective public registries.
- pyFlightPlotter/__init__.py +22 -0
- pyFlightPlotter/core.py +958 -0
- pyFlightPlotter/crafts.py +55 -0
- pyFlightPlotter/cursor.py +107 -0
- pyFlightPlotter/style.py +25 -0
- pyflightplotter-0.3.1.dist-info/METADATA +181 -0
- pyflightplotter-0.3.1.dist-info/RECORD +10 -0
- pyflightplotter-0.3.1.dist-info/WHEEL +5 -0
- pyflightplotter-0.3.1.dist-info/licenses/LICENSE +674 -0
- pyflightplotter-0.3.1.dist-info/top_level.txt +1 -0
|
@@ -0,0 +1,55 @@
|
|
|
1
|
+
import numpy as np
|
|
2
|
+
|
|
3
|
+
from .core import Craft3D
|
|
4
|
+
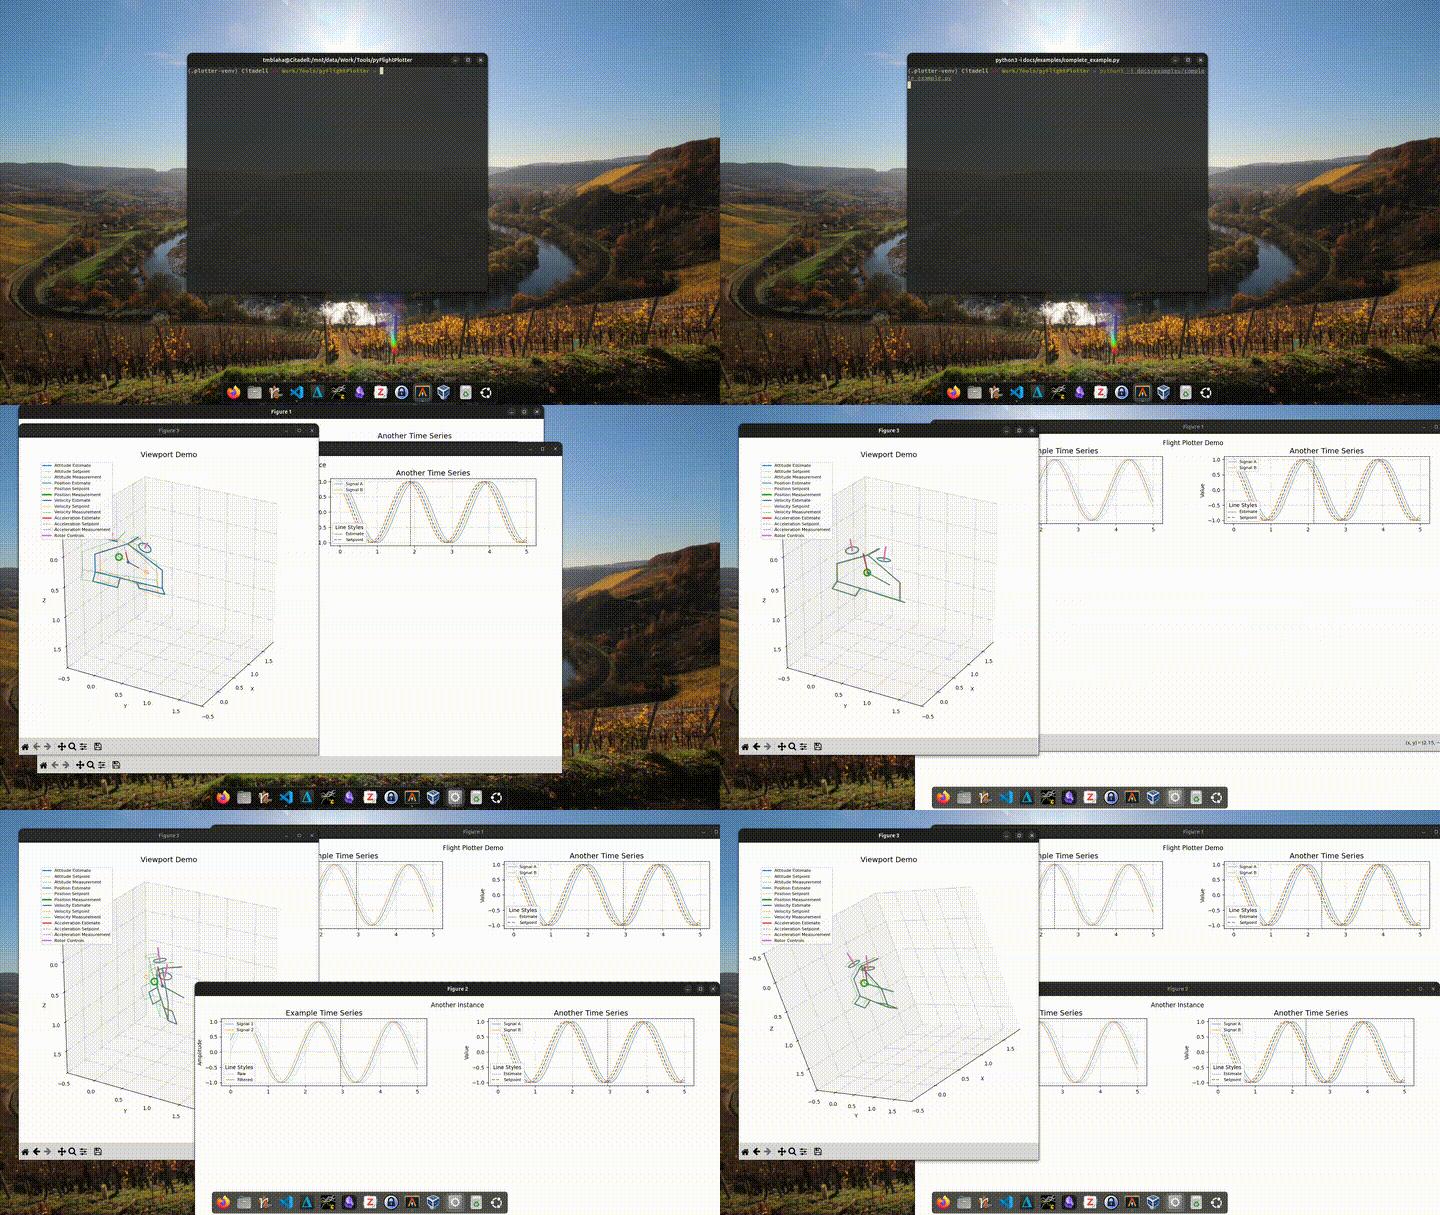
|
|
5
|
+
class Quadrotor(Craft3D):
|
|
6
|
+
def __init__(self, l=0.2, R=0.1):
|
|
7
|
+
body = np.array([
|
|
8
|
+
[ l, -l/4, 0.],
|
|
9
|
+
[ l, +l/4, 0.],
|
|
10
|
+
[ l+l/4, 0, 0.],
|
|
11
|
+
[ l, -l/4, 0.],
|
|
12
|
+
])
|
|
13
|
+
geometry = [body]
|
|
14
|
+
super().__init__(body_geometry=geometry)
|
|
15
|
+
|
|
16
|
+
arms = np.array([
|
|
17
|
+
[ -l, +l, 0.],
|
|
18
|
+
[ +l, +l, 0.],
|
|
19
|
+
[ -l, -l, 0.],
|
|
20
|
+
[ +l, -l, 0.],
|
|
21
|
+
])
|
|
22
|
+
|
|
23
|
+
for arm in arms:
|
|
24
|
+
self.addRotor(xyz=arm, axis=[0, 0, -1], R=R)
|
|
25
|
+
|
|
26
|
+
class Tailsitter(Craft3D):
|
|
27
|
+
def __init__(self, l=0.3, R=0.1):
|
|
28
|
+
body = np.array([
|
|
29
|
+
[ 0, 2*l, l],
|
|
30
|
+
[ 0, 2*l, 0.],
|
|
31
|
+
[ 0, 0., -1*l],
|
|
32
|
+
[ l, 0., -1*l],
|
|
33
|
+
[ 0, 0., -1*l],
|
|
34
|
+
[ 0, -2*l, 0.],
|
|
35
|
+
[ 0, -2*l, l],
|
|
36
|
+
[ 0, 2*l, l],
|
|
37
|
+
])
|
|
38
|
+
geometry = [body]
|
|
39
|
+
super().__init__(body_geometry=geometry)
|
|
40
|
+
|
|
41
|
+
self.addRotor(xyz=[0, -l, -l], axis=[0, 0, -1], R=R)
|
|
42
|
+
self.addRotor(xyz=[0, +l, -l], axis=[0, 0, -1], R=R)
|
|
43
|
+
|
|
44
|
+
surface = np.array([
|
|
45
|
+
[0, -2.*l, 1.0*l],
|
|
46
|
+
[0, -2.*l, 1.5*l],
|
|
47
|
+
[0, -0.5*l, 1.5*l],
|
|
48
|
+
[0, -0.5*l, 1.0*l],
|
|
49
|
+
])
|
|
50
|
+
self.addSurface(
|
|
51
|
+
tilt_xyz=[0., 0., 1.*l], tilt_axis=[0., +1., 0.], geometry=[surface]
|
|
52
|
+
)
|
|
53
|
+
self.addSurface(
|
|
54
|
+
tilt_xyz=[0., 0., 1.*l], tilt_axis=[0., +1., 0.], geometry=[surface*np.array([1., -1., 1.])]
|
|
55
|
+
)
|
|
@@ -0,0 +1,107 @@
|
|
|
1
|
+
|
|
2
|
+
from matplotlib.backend_bases import MouseEvent
|
|
3
|
+
import matplotlib.pyplot as plt
|
|
4
|
+
from time import sleep
|
|
5
|
+
|
|
6
|
+
class BlittedCursor(object):
|
|
7
|
+
def __init__(self, axes, sharex=True):
|
|
8
|
+
self.axes = axes
|
|
9
|
+
self.backgrounds = []
|
|
10
|
+
self.cursors = []
|
|
11
|
+
|
|
12
|
+
ax0 = self.axes[0]
|
|
13
|
+
self.playing = False
|
|
14
|
+
self.x = 0
|
|
15
|
+
|
|
16
|
+
for i, ax in enumerate(self.axes):
|
|
17
|
+
if i > 0 and sharex:
|
|
18
|
+
ax.sharex(ax0)
|
|
19
|
+
|
|
20
|
+
lines = ax.get_lines()
|
|
21
|
+
if lines:
|
|
22
|
+
min_x = min(min(line.get_xdata()) for line in lines)
|
|
23
|
+
self.cursors.append(ax.axvline(x=min_x,
|
|
24
|
+
color='black',
|
|
25
|
+
linestyle='--',
|
|
26
|
+
lw=0.8,
|
|
27
|
+
visible=False))
|
|
28
|
+
else:
|
|
29
|
+
self.cursors.append(None)
|
|
30
|
+
|
|
31
|
+
# get unique canvasses by iterating over axes
|
|
32
|
+
# this is necessary to avoid multiple connections to the same canvas
|
|
33
|
+
self.canvasses = [self.axes[0].figure.canvas]
|
|
34
|
+
for ax in self.axes[1:]:
|
|
35
|
+
if ax.figure.canvas is not self.canvasses:
|
|
36
|
+
self.canvasses.append(ax.figure.canvas)
|
|
37
|
+
|
|
38
|
+
for canvas in self.canvasses:
|
|
39
|
+
# connect the canvas to the draw and motion events
|
|
40
|
+
canvas.mpl_connect('draw_event', self._on_draw)
|
|
41
|
+
canvas.mpl_connect('motion_notify_event', self._on_mouse_move)
|
|
42
|
+
canvas.mpl_connect('key_press_event', self._on_key_press)
|
|
43
|
+
|
|
44
|
+
self.timer = self.axes[0].figure.canvas.new_timer(interval=50)
|
|
45
|
+
self.timer.add_callback(self._on_timer)
|
|
46
|
+
|
|
47
|
+
def _on_draw(self, event):
|
|
48
|
+
self.backgrounds.clear()
|
|
49
|
+
for ax in self.axes:
|
|
50
|
+
canvas = ax.figure.canvas
|
|
51
|
+
self.backgrounds.append(canvas.copy_from_bbox(ax.bbox))
|
|
52
|
+
|
|
53
|
+
def _on_mouse_move(self, event):
|
|
54
|
+
if event.xdata is None or not self.backgrounds:
|
|
55
|
+
return
|
|
56
|
+
|
|
57
|
+
self.x = event.xdata
|
|
58
|
+
|
|
59
|
+
for ax, line, bg in zip(self.axes, self.cursors, self.backgrounds):
|
|
60
|
+
canvas = ax.figure.canvas
|
|
61
|
+
canvas.restore_region(bg)
|
|
62
|
+
if line is not None:
|
|
63
|
+
line.set_xdata([event.xdata])
|
|
64
|
+
line.set_visible(True)
|
|
65
|
+
ax.draw_artist(line)
|
|
66
|
+
canvas.blit(ax.bbox)
|
|
67
|
+
|
|
68
|
+
def _on_timer(self):
|
|
69
|
+
|
|
70
|
+
# generate mouse event to canvas, so that all children get updated
|
|
71
|
+
from matplotlib.backend_bases import MouseEvent
|
|
72
|
+
|
|
73
|
+
self.x += 0.02
|
|
74
|
+
canvas = self.axes[0].figure.canvas
|
|
75
|
+
event = MouseEvent(
|
|
76
|
+
name="motion_notify_event",
|
|
77
|
+
canvas=canvas,
|
|
78
|
+
x=self.x, # pixel coordinates
|
|
79
|
+
y=0,
|
|
80
|
+
button=None,
|
|
81
|
+
key=None,
|
|
82
|
+
step=0,
|
|
83
|
+
dblclick=False,
|
|
84
|
+
guiEvent=None
|
|
85
|
+
)
|
|
86
|
+
event.xdata = self.x # data coordinates
|
|
87
|
+
canvas.callbacks.process(
|
|
88
|
+
"motion_notify_event", event
|
|
89
|
+
)
|
|
90
|
+
|
|
91
|
+
|
|
92
|
+
def _on_key_press(self, event):
|
|
93
|
+
"""Callback function to update the viewport on key press
|
|
94
|
+
|
|
95
|
+
Args:
|
|
96
|
+
event (matplotlib.backend_bases.KeyEvent): key event
|
|
97
|
+
|
|
98
|
+
Returns:
|
|
99
|
+
None
|
|
100
|
+
"""
|
|
101
|
+
if event.key == ' ':
|
|
102
|
+
if self.playing:
|
|
103
|
+
self.playing = False
|
|
104
|
+
self.timer.stop()
|
|
105
|
+
else:
|
|
106
|
+
self.playing = True
|
|
107
|
+
self.timer.start()
|
pyFlightPlotter/style.py
ADDED
|
@@ -0,0 +1,25 @@
|
|
|
1
|
+
from matplotlib import pyplot as plt
|
|
2
|
+
|
|
3
|
+
local_rc = plt.rcParams.copy()
|
|
4
|
+
local_rc.update({
|
|
5
|
+
# "text.usetex": True,
|
|
6
|
+
# "font.family": "Helvetica",
|
|
7
|
+
"font.family": "sans-serif",
|
|
8
|
+
"font.size": 10,
|
|
9
|
+
"axes.grid": True,
|
|
10
|
+
"axes.grid.which": 'both',
|
|
11
|
+
"grid.linestyle": '--',
|
|
12
|
+
"grid.alpha": 0.7,
|
|
13
|
+
"axes.labelsize": 10,
|
|
14
|
+
"axes.titlesize": 14,
|
|
15
|
+
"xtick.labelsize": 10,
|
|
16
|
+
"ytick.labelsize": 10,
|
|
17
|
+
"legend.loc": 'upper left',
|
|
18
|
+
"legend.fontsize": 8,
|
|
19
|
+
'figure.subplot.bottom': 0.06,
|
|
20
|
+
'figure.subplot.left': 0.05,
|
|
21
|
+
'figure.subplot.right': 0.95,
|
|
22
|
+
'figure.subplot.top': 0.925,
|
|
23
|
+
'figure.subplot.wspace': 0.3,
|
|
24
|
+
'figure.subplot.hspace': 0.433,
|
|
25
|
+
})
|
|
@@ -0,0 +1,181 @@
|
|
|
1
|
+
Metadata-Version: 2.4
|
|
2
|
+
Name: pyFlightPlotter
|
|
3
|
+
Version: 0.3.1
|
|
4
|
+
Summary: Interactive, synchronized 2D time-series and 3D attitude/position plotting for flight logs
|
|
5
|
+
Author-email: Till Blaha <t.m.blaha@tudelft.nl>
|
|
6
|
+
License-Expression: GPL-3.0-or-later
|
|
7
|
+
Project-URL: Homepage, https://github.com/tudelft/pyFlightPlotter
|
|
8
|
+
Project-URL: Repository, https://github.com/tudelft/pyFlightPlotter
|
|
9
|
+
Project-URL: Issues, https://github.com/tudelft/pyFlightPlotter/issues
|
|
10
|
+
Keywords: flight data,log analysis,drone,UAV,quaternion,matplotlib,visualization
|
|
11
|
+
Classifier: Development Status :: 4 - Beta
|
|
12
|
+
Classifier: Intended Audience :: Science/Research
|
|
13
|
+
Classifier: Intended Audience :: Developers
|
|
14
|
+
Classifier: Operating System :: OS Independent
|
|
15
|
+
Classifier: Programming Language :: Python :: 3
|
|
16
|
+
Classifier: Programming Language :: Python :: 3 :: Only
|
|
17
|
+
Classifier: Topic :: Scientific/Engineering :: Visualization
|
|
18
|
+
Classifier: Framework :: Matplotlib
|
|
19
|
+
Requires-Python: >=3.10
|
|
20
|
+
Description-Content-Type: text/markdown
|
|
21
|
+
License-File: LICENSE
|
|
22
|
+
Requires-Dist: numpy>=1.24
|
|
23
|
+
Requires-Dist: scipy>=1.10
|
|
24
|
+
Requires-Dist: matplotlib>=3.7
|
|
25
|
+
Provides-Extra: video
|
|
26
|
+
Requires-Dist: opencv-python; extra == "video"
|
|
27
|
+
Dynamic: license-file
|
|
28
|
+
|
|
29
|
+
# pyFlightPlotter
|
|
30
|
+
|
|
31
|
+
[](https://pypi.org/project/pyFlightPlotter/)
|
|
32
|
+
[](https://pypi.org/project/pyFlightPlotter/)
|
|
33
|
+
[](https://github.com/tudelft/pyFlightPlotter/blob/main/LICENSE)
|
|
34
|
+
|
|
35
|
+
Interactive, configurable and three-dimensional flight data plotting, with little boilerplate.
|
|
36
|
+
|
|
37
|
+
Hover over a time-series plot and every connected window follows along: the cursor moves in sync in all
|
|
38
|
+
time-series axes, and a 3D viewport shows the vehicle's attitude, position, velocity, acceleration and
|
|
39
|
+
actuator state at that moment. You can also sync an onboard or external video to the log.
|
|
40
|
+
|
|
41
|
+
|
|
42
|
+
|
|
43
|
+
## Features
|
|
44
|
+
|
|
45
|
+
- **3D viewport** showing estimates, setpoints and measurements of
|
|
46
|
+
- attitude (quaternions)
|
|
47
|
+
- position, velocity and acceleration
|
|
48
|
+
- rotor force commands
|
|
49
|
+
- control surface deflections
|
|
50
|
+
- **Time-series plotting** in a configurable grid layout. `_plot_timeseries()` takes several line styles
|
|
51
|
+
(light / solid / dashed / true value) and keeps colours consistent across series.
|
|
52
|
+
- **A synchronized vertical cursor** across all time-series axes, even when they're spread over several
|
|
53
|
+
figures. The 3D viewport updates on mouse hover.
|
|
54
|
+
- **Playback**: press <kbd>Space</kbd> to play or pause the log in real time.
|
|
55
|
+
- **Video sync** (`VideoViewport`): show an MP4 next to the log, with an adjustable time offset.
|
|
56
|
+
- **Craft builder**: the `Craft3D` class has `addRotor` and `addSurface` methods to define a vehicle quickly.
|
|
57
|
+
- single-axis surface tilt
|
|
58
|
+
- dual-axis rotor tilt
|
|
59
|
+
- presets included: `Quadrotor`, `Tailsitter`
|
|
60
|
+
|
|
61
|
+
## Installation
|
|
62
|
+
|
|
63
|
+
```sh
|
|
64
|
+
pip install pyFlightPlotter
|
|
65
|
+
```
|
|
66
|
+
|
|
67
|
+
With video support (`VideoViewport`, which needs OpenCV):
|
|
68
|
+
|
|
69
|
+
```sh
|
|
70
|
+
pip install "pyFlightPlotter[video]"
|
|
71
|
+
```
|
|
72
|
+
|
|
73
|
+
The latest development version from GitHub:
|
|
74
|
+
|
|
75
|
+
```sh
|
|
76
|
+
pip install "pyFlightPlotter @ git+https://github.com/tudelft/pyFlightPlotter"
|
|
77
|
+
```
|
|
78
|
+
|
|
79
|
+
Requires Python 3.10 or newer. The dependencies are `numpy`, `scipy` and `matplotlib`. You also need an
|
|
80
|
+
interactive matplotlib backend (e.g. QtAgg or TkAgg).
|
|
81
|
+
|
|
82
|
+
## Usage
|
|
83
|
+
|
|
84
|
+
You build a plotter by subclassing `FlightPlotterBase` and implementing `_populate()`, where you add the
|
|
85
|
+
subplots you want. `BlittedCursor` adds the synchronized cursor, and `connect_viewport()` links a 3D
|
|
86
|
+
`Viewport` (or a `VideoViewport`) to the mouse.
|
|
87
|
+
|
|
88
|
+
A minimal example ([`docs/examples/minimal_example.py`](https://github.com/tudelft/pyFlightPlotter/blob/main/docs/examples/minimal_example.py)):
|
|
89
|
+
|
|
90
|
+
```python
|
|
91
|
+
import numpy as np
|
|
92
|
+
|
|
93
|
+
from pyFlightPlotter import FlightPlotterBase, BlittedCursor, Viewport, Quadrotor
|
|
94
|
+
|
|
95
|
+
class FlightPlotterMinimalExample(FlightPlotterBase):
|
|
96
|
+
def __init__(self, time, data):
|
|
97
|
+
self.data = data
|
|
98
|
+
super().__init__(time, name="MWE")
|
|
99
|
+
self.define_layout(nrows=1, ncols=1)
|
|
100
|
+
self.plot()
|
|
101
|
+
|
|
102
|
+
def _populate(self):
|
|
103
|
+
self._plot_timeseries(
|
|
104
|
+
self.fig.add_subplot(self.gs[0, 0]),
|
|
105
|
+
light=None,
|
|
106
|
+
solid=[self.data[2], self.data[3]],
|
|
107
|
+
dashed=[self.data[0], self.data[1]],
|
|
108
|
+
series_labels=["Signal 1", "Signal 2"],
|
|
109
|
+
style_labels=[None, "Estimated", "Setpoint"],
|
|
110
|
+
title="Example Time Series",
|
|
111
|
+
ylabel="Amplitude",
|
|
112
|
+
)
|
|
113
|
+
|
|
114
|
+
if __name__ == "__main__":
|
|
115
|
+
t = np.linspace(0, 2, 101)
|
|
116
|
+
data = [
|
|
117
|
+
np.sin(2*np.pi*0.5*t), np.sin(2*np.pi*0.5*t + 0.2),
|
|
118
|
+
np.cos(2*np.pi*0.5*t + 0.4), np.cos(2*np.pi*0.5*t + 0.6),
|
|
119
|
+
]
|
|
120
|
+
|
|
121
|
+
fp = FlightPlotterMinimalExample(t, data)
|
|
122
|
+
bc = BlittedCursor(fp.all_axes, sharex=True)
|
|
123
|
+
|
|
124
|
+
vp = Viewport(craft=Quadrotor(),
|
|
125
|
+
time=np.array([0., 1., 2.]),
|
|
126
|
+
att=np.array([[1., 0., 0., 0.], [0.7, 0., 0., 0.7], [0., 0., 0., 1.]]),
|
|
127
|
+
# ... many more data can be passed here, but attitude is required
|
|
128
|
+
interpolation="linear",
|
|
129
|
+
follow=False,
|
|
130
|
+
title="Viewport Example",
|
|
131
|
+
)
|
|
132
|
+
|
|
133
|
+
# connect mouse hover
|
|
134
|
+
fp.connect_viewport(vp)
|
|
135
|
+
```
|
|
136
|
+
|
|
137
|
+
Run it with `python -i` so the windows stay open.
|
|
138
|
+
|
|
139
|
+
For a full example with several figures, a tailsitter, and position/velocity/actuator data, see
|
|
140
|
+
[`docs/examples/complete_example.py`](https://github.com/tudelft/pyFlightPlotter/blob/main/docs/examples/complete_example.py).
|
|
141
|
+
For an example of hooking pyFlightPlotter into your own log-data structure, see
|
|
142
|
+
[indiflight](https://github.com/tudelft/indiflight/blob/global_rls/support/LogAnalysis/indiflightPlotter.py).
|
|
143
|
+
|
|
144
|
+
### Video synchronization
|
|
145
|
+
|
|
146
|
+
```python
|
|
147
|
+
from pyFlightPlotter import VideoViewport
|
|
148
|
+
|
|
149
|
+
vv = VideoViewport(time=t, mp4_path="flight.mp4", offset_s=0.0)
|
|
150
|
+
fp.connect_viewport(vv)
|
|
151
|
+
```
|
|
152
|
+
|
|
153
|
+
The video time is `data_time + offset`. You can set the offset with the slider or text box in the video
|
|
154
|
+
window, or step one frame at a time with the arrow keys. You can also load a file from inside the window.
|
|
155
|
+
|
|
156
|
+
### Controls
|
|
157
|
+
|
|
158
|
+
| Input | Action |
|
|
159
|
+
|---|---|
|
|
160
|
+
| Mouse hover over a time-series axis | Move the cursor; all connected viewports update |
|
|
161
|
+
| <kbd>Space</kbd> | Play / pause real-time playback |
|
|
162
|
+
| <kbd>←</kbd> / <kbd>→</kbd> (video window) | Shift the video offset by one frame |
|
|
163
|
+
|
|
164
|
+
### Conventions
|
|
165
|
+
|
|
166
|
+
Quaternions are scalar-first: `[w, x, y, z]`. Arrays are expected with time along the first axis, e.g.
|
|
167
|
+
`Nx4` for attitude and `Nx3` for position, velocity and acceleration. See the `Viewport` docstring for all
|
|
168
|
+
supported inputs.
|
|
169
|
+
|
|
170
|
+
## Development
|
|
171
|
+
|
|
172
|
+
```sh
|
|
173
|
+
git clone https://github.com/tudelft/pyFlightPlotter
|
|
174
|
+
cd pyFlightPlotter
|
|
175
|
+
pip install -e ".[video]"
|
|
176
|
+
python -i docs/examples/complete_example.py
|
|
177
|
+
```
|
|
178
|
+
|
|
179
|
+
## License
|
|
180
|
+
|
|
181
|
+
GPL-3.0-or-later. See [LICENSE](https://github.com/tudelft/pyFlightPlotter/blob/main/LICENSE).
|
|
@@ -0,0 +1,10 @@
|
|
|
1
|
+
pyFlightPlotter/__init__.py,sha256=Gq4Qu7E6F25fmDFhoLKBvGjDr8RtFvFUOTg38TT69IM,574
|
|
2
|
+
pyFlightPlotter/core.py,sha256=N-yhz-U-KAQrVtwIv4qh-0rGTPW4Psrrzpp9wW5fO5c,40218
|
|
3
|
+
pyFlightPlotter/crafts.py,sha256=xL2k5ohu4CPbf3ZsWAwdPqfZNh4IbQkhxATpgoyHMIU,1604
|
|
4
|
+
pyFlightPlotter/cursor.py,sha256=TvenyFDVUvNMFlFz-NQ9Bng8f90nCibRSDRj6YZIcRI,3467
|
|
5
|
+
pyFlightPlotter/style.py,sha256=SjsRglz_U91Oq0QnJccr3dfDvjD19KzrcHMqvissivM,677
|
|
6
|
+
pyflightplotter-0.3.1.dist-info/licenses/LICENSE,sha256=OXLcl0T2SZ8Pmy2_dmlvKuetivmyPd5m1q-Gyd-zaYY,35149
|
|
7
|
+
pyflightplotter-0.3.1.dist-info/METADATA,sha256=ff2Zaeom9ez6tkam_Ht3leS6eTw0Bp5xbPj_Y4RrrLw,7029
|
|
8
|
+
pyflightplotter-0.3.1.dist-info/WHEEL,sha256=mOdXR9C3wMVov7cSY8PY-XCzo3SmmWCHvGQr5csJoao,91
|
|
9
|
+
pyflightplotter-0.3.1.dist-info/top_level.txt,sha256=mIR6Po0K39Gzf-hMDp-VJVznog_ZmNxbcEa1WeYWDec,16
|
|
10
|
+
pyflightplotter-0.3.1.dist-info/RECORD,,
|