plotform 0.1.0__py3-none-any.whl
This diff represents the content of publicly available package versions that have been released to one of the supported registries. The information contained in this diff is provided for informational purposes only and reflects changes between package versions as they appear in their respective public registries.
- plotform/__init__.py +53 -0
- plotform/api.py +47 -0
- plotform/assets/fonts/PlotformMono-OFL.txt +93 -0
- plotform/assets/fonts/PlotformMono-Regular.ttf +0 -0
- plotform/assets/fonts/PlotformMono-TRADEMARKS.md +17 -0
- plotform/assets/fonts/PlotformSans-OFL.txt +93 -0
- plotform/assets/fonts/PlotformSans-Rounded.ttf +0 -0
- plotform/assets/fonts/PlotformSans-TRADEMARKS.md +17 -0
- plotform/assets/fonts/README.md +30 -0
- plotform/colorbar_utils.py +75 -0
- plotform/fonts.py +56 -0
- plotform/legend_utils.py +199 -0
- plotform/palette.py +103 -0
- plotform/rounded.py +519 -0
- plotform/theme.py +168 -0
- plotform/three_d.py +40 -0
- plotform-0.1.0.dist-info/METADATA +267 -0
- plotform-0.1.0.dist-info/RECORD +21 -0
- plotform-0.1.0.dist-info/WHEEL +5 -0
- plotform-0.1.0.dist-info/licenses/LICENSE +24 -0
- plotform-0.1.0.dist-info/top_level.txt +1 -0
plotform/three_d.py
ADDED
|
@@ -0,0 +1,40 @@
|
|
|
1
|
+
"""Minimal styling for Matplotlib's mplot3d axes."""
|
|
2
|
+
|
|
3
|
+
from __future__ import annotations
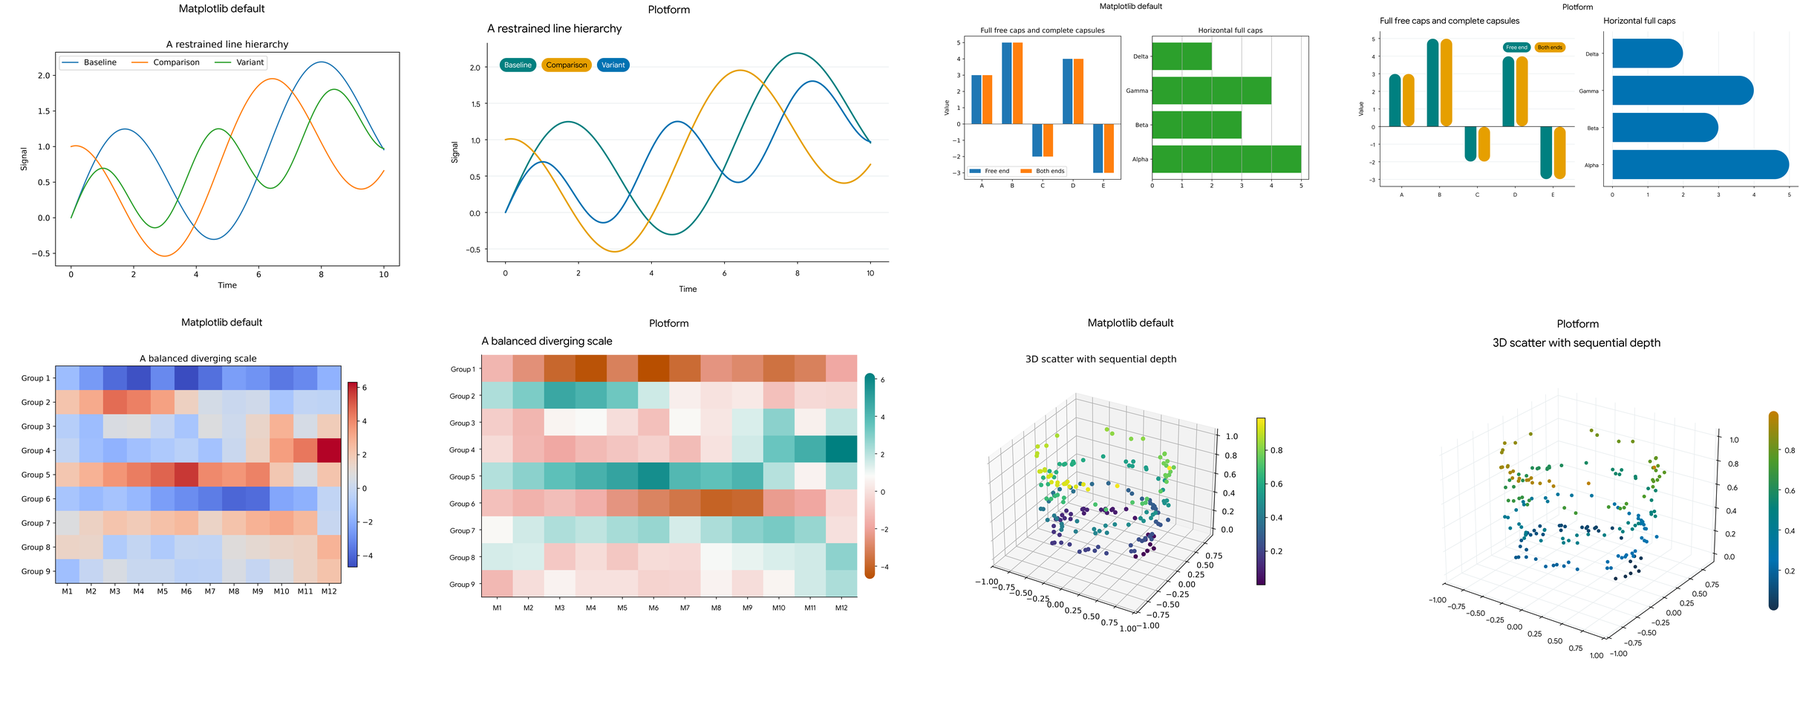
|
|
4
|
+
|
|
5
|
+
from .palette import AXIS, GRID, INK, MUTED, MUTED_AXIS, WHITE
|
|
6
|
+
|
|
7
|
+
|
|
8
|
+
def style_3d(
|
|
9
|
+
ax,
|
|
10
|
+
*,
|
|
11
|
+
grid: bool = True,
|
|
12
|
+
transparent_panes: bool = True,
|
|
13
|
+
elev: float = 25,
|
|
14
|
+
azim: float = -55,
|
|
15
|
+
gray_decorations: bool = False,
|
|
16
|
+
):
|
|
17
|
+
"""Apply the theme's pane, grid, tick, and viewing-angle defaults to 3D axes.
|
|
18
|
+
|
|
19
|
+
Matplotlib does not expose these options through the normal 2D rcParams.
|
|
20
|
+
Call this after creating an axes with ``projection='3d'``.
|
|
21
|
+
"""
|
|
22
|
+
ax.set_facecolor(WHITE)
|
|
23
|
+
ax.view_init(elev=elev, azim=azim)
|
|
24
|
+
ax.grid(grid)
|
|
25
|
+
axis_color = MUTED_AXIS if gray_decorations else AXIS
|
|
26
|
+
label_color = MUTED if gray_decorations else INK
|
|
27
|
+
|
|
28
|
+
for axis in (ax.xaxis, ax.yaxis, ax.zaxis):
|
|
29
|
+
if transparent_panes:
|
|
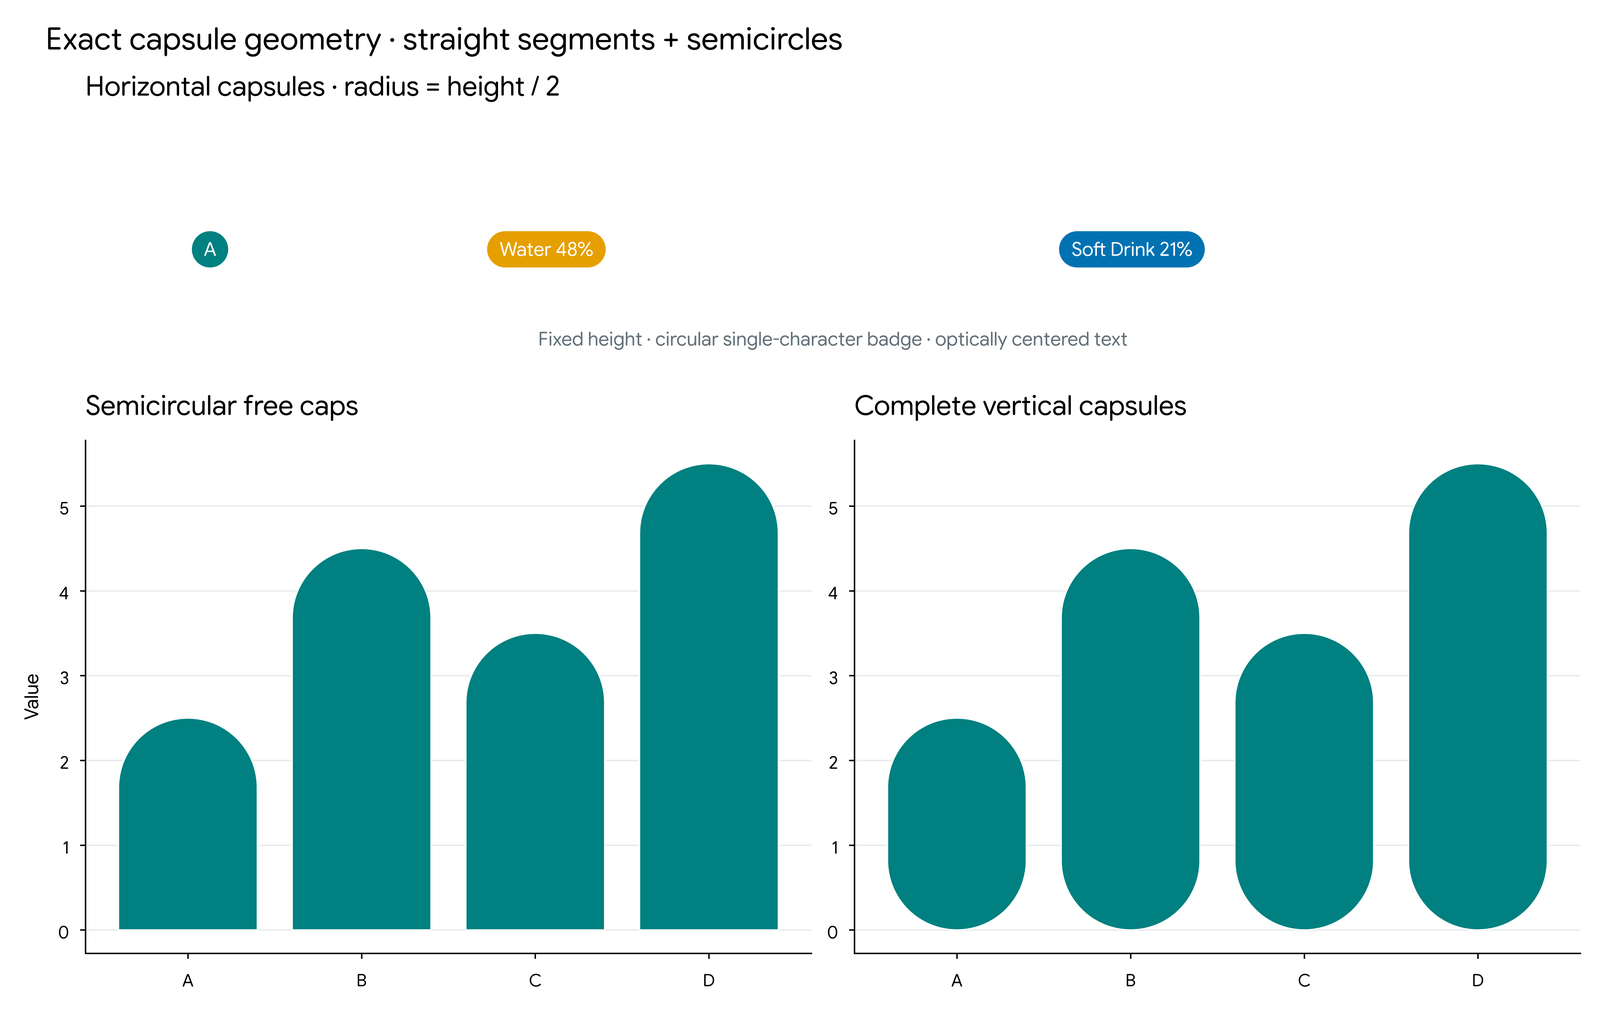
30
|
+
axis.set_pane_color((1.0, 1.0, 1.0, 0.0))
|
|
31
|
+
else:
|
|
32
|
+
axis.set_pane_color(WHITE)
|
|
33
|
+
axis._axinfo["grid"].update(color=GRID, linewidth=0.7)
|
|
34
|
+
axis._axinfo["axisline"].update(color=axis_color, linewidth=0.8)
|
|
35
|
+
|
|
36
|
+
ax.tick_params(axis="both", colors=label_color, labelcolor=label_color, width=0.8, pad=4)
|
|
37
|
+
return ax
|
|
38
|
+
|
|
39
|
+
|
|
40
|
+
__all__ = ["style_3d"]
|
|
@@ -0,0 +1,267 @@
|
|
|
1
|
+
Metadata-Version: 2.4
|
|
2
|
+
Name: plotform
|
|
3
|
+
Version: 0.1.0
|
|
4
|
+
Summary: A minimalist Matplotlib theme and plotting toolkit with customizable palettes, capsule-shaped chart elements, and bundled fonts.
|
|
5
|
+
Author: Econ01
|
|
6
|
+
License-Expression: MIT
|
|
7
|
+
Project-URL: Homepage, https://github.com/Econ01/plotform
|
|
8
|
+
Project-URL: Repository, https://github.com/Econ01/plotform
|
|
9
|
+
Project-URL: Issues, https://github.com/Econ01/plotform/issues
|
|
10
|
+
Project-URL: Changelog, https://github.com/Econ01/plotform/blob/main/CHANGELOG.md
|
|
11
|
+
Keywords: matplotlib,plotting,visualization,theme,capsule,publication
|
|
12
|
+
Classifier: Development Status :: 3 - Alpha
|
|
13
|
+
Classifier: Intended Audience :: Developers
|
|
14
|
+
Classifier: Intended Audience :: Science/Research
|
|
15
|
+
Classifier: Operating System :: OS Independent
|
|
16
|
+
Classifier: Programming Language :: Python :: 3
|
|
17
|
+
Classifier: Programming Language :: Python :: 3.10
|
|
18
|
+
Classifier: Programming Language :: Python :: 3.11
|
|
19
|
+
Classifier: Programming Language :: Python :: 3.12
|
|
20
|
+
Classifier: Programming Language :: Python :: 3.13
|
|
21
|
+
Classifier: Topic :: Scientific/Engineering :: Visualization
|
|
22
|
+
Requires-Python: >=3.10
|
|
23
|
+
Description-Content-Type: text/markdown
|
|
24
|
+
License-File: LICENSE
|
|
25
|
+
Requires-Dist: matplotlib>=3.8
|
|
26
|
+
Requires-Dist: numpy>=1.24
|
|
27
|
+
Provides-Extra: dev
|
|
28
|
+
Requires-Dist: build>=1.2; extra == "dev"
|
|
29
|
+
Requires-Dist: fonttools>=4.50; extra == "dev"
|
|
30
|
+
Requires-Dist: pillow>=9; extra == "dev"
|
|
31
|
+
Requires-Dist: pytest>=8; extra == "dev"
|
|
32
|
+
Requires-Dist: ruff>=0.6; extra == "dev"
|
|
33
|
+
Requires-Dist: tomli>=2; python_version < "3.11" and extra == "dev"
|
|
34
|
+
Dynamic: license-file
|
|
35
|
+
|
|
36
|
+
# Plotform
|
|
37
|
+
|
|
38
|
+
[](https://github.com/Econ01/plotform/actions/workflows/ci.yml)
|
|
39
|
+
[](https://pypi.org/project/plotform/)
|
|
40
|
+
[](https://pypi.org/project/plotform/)
|
|
41
|
+
[](LICENSE)
|
|
42
|
+
|
|
43
|
+
**A minimalist Matplotlib theme and plotting toolkit with customizable palettes, capsule-shaped chart elements, and bundled fonts.**
|
|
44
|
+
|
|
45
|
+
Plotform combines a vivid, minimalist visual style with native-style helpers for pill legends, circularly rounded bars, capsule annotations, vertical capsule colorbars, and clean 3D plots. Fonts are bundled, so system font installation is not required.
|
|
46
|
+
|
|
47
|
+
[](https://github.com/Econ01/plotform/tree/main/examples)
|
|
48
|
+
|
|
49
|
+
## Requirements
|
|
50
|
+
|
|
51
|
+
- Python 3.10 or newer
|
|
52
|
+
- Matplotlib 3.8 or newer
|
|
53
|
+
- NumPy 1.24 or newer
|
|
54
|
+
|
|
55
|
+
## Installation
|
|
56
|
+
|
|
57
|
+
```bash
|
|
58
|
+
python -m pip install plotform
|
|
59
|
+
```
|
|
60
|
+
|
|
61
|
+
For development from a source checkout:
|
|
62
|
+
|
|
63
|
+
```bash
|
|
64
|
+
python -m pip install -e ".[dev]"
|
|
65
|
+
```
|
|
66
|
+
|
|
67
|
+
## Quick start
|
|
68
|
+
|
|
69
|
+
```python
|
|
70
|
+
import matplotlib.pyplot as plt
|
|
71
|
+
import plotform as tm
|
|
72
|
+
|
|
73
|
+
tm.apply_theme()
|
|
74
|
+
|
|
75
|
+
fig, ax = plt.subplots()
|
|
76
|
+
ax.plot([1, 2, 3], [2, 4, 3], label="Example")
|
|
77
|
+
ax.set(title="A minimalist chart", xlabel="Time", ylabel="Signal")
|
|
78
|
+
tm.legend(ax)
|
|
79
|
+
|
|
80
|
+
fig.savefig("chart.png", dpi=800)
|
|
81
|
+
fig.savefig("chart.pdf")
|
|
82
|
+
```
|
|
83
|
+
|
|
84
|
+
`apply_theme()` resets Matplotlib's style before applying Plotform and changes process-global settings. Call it once before creating figures. To preserve and later restore another style, use the scoped form:
|
|
85
|
+
|
|
86
|
+
```python
|
|
87
|
+
with tm.theme():
|
|
88
|
+
fig, ax = plt.subplots()
|
|
89
|
+
ax.plot([1, 2, 3], [2, 4, 3], label="Example")
|
|
90
|
+
tm.legend(ax)
|
|
91
|
+
fig.savefig("chart.png")
|
|
92
|
+
# Previous rcParams are restored here.
|
|
93
|
+
```
|
|
94
|
+
|
|
95
|
+
## Plain Matplotlib, without Plotform
|
|
96
|
+
|
|
97
|
+
Scripts that must run without the package do not need a compatibility layer. Use native Matplotlib directly:
|
|
98
|
+
|
|
99
|
+
```python
|
|
100
|
+
import matplotlib.pyplot as plt
|
|
101
|
+
|
|
102
|
+
fig, ax = plt.subplots()
|
|
103
|
+
ax.bar([0, 1, 2], [3, 5, 4], label="Example")
|
|
104
|
+
ax.legend()
|
|
105
|
+
fig.savefig("plot.png")
|
|
106
|
+
```
|
|
107
|
+
|
|
108
|
+
`examples/native_matplotlib.py` is a complete instructor-friendly example. Plotform is an opt-in enhancement, not a requirement for these scripts.
|
|
109
|
+
|
|
110
|
+
## Native-style helpers
|
|
111
|
+
|
|
112
|
+
| Helper | Purpose |
|
|
113
|
+
| --- | --- |
|
|
114
|
+
| `tm.legend(ax)` | Solid or soft pill legends with adaptive text contrast |
|
|
115
|
+
| `tm.bar(x, height, ax=ax)` | Vertical bars with circular caps |
|
|
116
|
+
| `tm.barh(y, width, ax=ax)` | Horizontal bars with circular caps |
|
|
117
|
+
| `tm.colorbar(image, ax=ax)` | Vertical capsule colorbar with external ticks |
|
|
118
|
+
| `tm.annotate(text, xy, ax=ax)` | Exact capsule annotation |
|
|
119
|
+
| `tm.style_3d(ax)` | Minimal 3D panes, grids, ticks, and viewing angle |
|
|
120
|
+
|
|
121
|
+
`legend()` uses the current axes when `ax` is omitted. `colorbar()` uses the current figure and axes. Advanced geometry remains available through `plotform.rounded`; font utilities remain available through `plotform.fonts`.
|
|
122
|
+
|
|
123
|
+
## Fonts
|
|
124
|
+
|
|
125
|
+
- **Plotform Sans**, derived from Google Sans Flex with `ROND=100` and default weight 400.
|
|
126
|
+
- **Plotform Mono**, derived from Google Sans Code at its default weight.
|
|
127
|
+
- DejaVu fallbacks for mathematical notation and missing glyphs.
|
|
128
|
+
|
|
129
|
+
The package registers its bundled fonts directly with Matplotlib. No operating-system installation or cache clearing is needed. Font licenses and attribution are included under `src/plotform/assets/fonts/`.
|
|
130
|
+
|
|
131
|
+
## Colors
|
|
132
|
+
|
|
133
|
+
The default vivid categorical cycle is:
|
|
134
|
+
|
|
135
|
+
| Order | Color | Hex |
|
|
136
|
+
| --- | --- | --- |
|
|
137
|
+
| 1 | Teal | `#008080` |
|
|
138
|
+
| 2 | Amber | `#E69F00` |
|
|
139
|
+
| 3 | Blue | `#0072B2` |
|
|
140
|
+
| 4 | Coral/vermillion | `#D55E00` |
|
|
141
|
+
| 5 | Purple | `#6A51A3` |
|
|
142
|
+
| 6 | Green | `#4C9A2A` |
|
|
143
|
+
| 7 | Rose | `#CC79A7` |
|
|
144
|
+
| 8 | Dark slate | `#4B5563` |
|
|
145
|
+
|
|
146
|
+
Extend the cycle deterministically:
|
|
147
|
+
|
|
148
|
+
```python
|
|
149
|
+
tm.apply_theme(n_colors=14)
|
|
150
|
+
colors = tm.get_palette(14)
|
|
151
|
+
```
|
|
152
|
+
|
|
153
|
+
Axes, labels, and ticks are black by default while grids remain light. For muted-gray decorations:
|
|
154
|
+
|
|
155
|
+
```python
|
|
156
|
+
tm.apply_theme(gray_decorations=True)
|
|
157
|
+
```
|
|
158
|
+
|
|
159
|
+
Three continuous colormaps are registered:
|
|
160
|
+
|
|
161
|
+
```python
|
|
162
|
+
ax.imshow(values, cmap=tm.SCALAR_CMAP) # Full-range scalar default
|
|
163
|
+
ax.imshow(values, cmap=tm.DIVERGING_CMAP) # Signed/diverging data
|
|
164
|
+
ax.imshow(values, cmap=tm.SEQUENTIAL_CMAP) # Optional pale brand-teal map
|
|
165
|
+
```
|
|
166
|
+
|
|
167
|
+
`SCALAR_CMAP` follows navy → blue → teal → green → amber, avoiding near-white endpoints. Use fully opaque scalar markers and `depthshade=False` for mplot3d scatter plots. Use `shade=True` for `bar3d` to preserve face lighting.
|
|
168
|
+
|
|
169
|
+
## Pill legends
|
|
170
|
+
|
|
171
|
+
Solid category-color fills use adaptive white or black text, targeting at least 4.5:1 contrast. Marker and line handles are explicitly hidden so they cannot overlap labels.
|
|
172
|
+
|
|
173
|
+
```python
|
|
174
|
+
tm.legend(ax, ncols=3)
|
|
175
|
+
```
|
|
176
|
+
|
|
177
|
+
For auxiliary uncertainty regions, use an explicitly tinted entry:
|
|
178
|
+
|
|
179
|
+
```python
|
|
180
|
+
tm.legend(ax, styles={"95% interval": "soft"})
|
|
181
|
+
```
|
|
182
|
+
|
|
183
|
+
For dense plots, place the legend outside or add a white group capsule:
|
|
184
|
+
|
|
185
|
+
```python
|
|
186
|
+
tm.legend(ax, outside=True)
|
|
187
|
+
tm.legend(ax, backdrop=True, backdrop_alpha=0.88)
|
|
188
|
+
```
|
|
189
|
+
|
|
190
|
+
## Rounded bars and annotations
|
|
191
|
+
|
|
192
|
+
```python
|
|
193
|
+
import numpy as np
|
|
194
|
+
|
|
195
|
+
x = np.arange(4)
|
|
196
|
+
|
|
197
|
+
# Exact semicircular cap with a square baseline.
|
|
198
|
+
tm.bar(x, [3, 5, -2, 4], radius="full", ends="free", ax=ax)
|
|
199
|
+
|
|
200
|
+
# Complete vertical capsule.
|
|
201
|
+
tm.bar(x, [3, 5, -2, 4], radius="full", ends="both", ax=ax)
|
|
202
|
+
|
|
203
|
+
# Clamp bars too short for an exact full capsule.
|
|
204
|
+
tm.bar(x, [3, 5, -2, 4], radius="fit", ends="both", ax=ax)
|
|
205
|
+
|
|
206
|
+
# Numeric circular corner radius.
|
|
207
|
+
tm.bar(x, [3, 5, -2, 4], radius=0.16, ax=ax)
|
|
208
|
+
```
|
|
209
|
+
|
|
210
|
+
Exact full mode raises a clear error when the display geometry cannot contain the requested semicircle. Use `radius="fit"` to opt into clamping instead.
|
|
211
|
+
|
|
212
|
+
Annotations use exact stadium geometry:
|
|
213
|
+
|
|
214
|
+
```python
|
|
215
|
+
tm.annotate("New", (0.15, 0.85), ax=ax, transform=ax.transAxes)
|
|
216
|
+
```
|
|
217
|
+
|
|
218
|
+
`plotform.rounded` also exposes `capsule_path`, `CapsuleBox`, and separate squircle primitives for advanced use.
|
|
219
|
+
|
|
220
|
+
[](https://github.com/Econ01/plotform/blob/main/examples/geometry_check.py)
|
|
221
|
+
|
|
222
|
+
## Capsule colorbars
|
|
223
|
+
|
|
224
|
+
```python
|
|
225
|
+
image = ax.imshow(values, cmap=tm.SCALAR_CMAP)
|
|
226
|
+
colorbar = tm.colorbar(image, ax=ax)
|
|
227
|
+
```
|
|
228
|
+
|
|
229
|
+
The visible gradient is clipped to an exact vertical capsule in display space. Ticks and labels remain outside. Image, contour, streamplot, scatter, and surface mappables are supported. Standard rectangular `fig.colorbar()` output remains available.
|
|
230
|
+
|
|
231
|
+
## 3D plots
|
|
232
|
+
|
|
233
|
+
```python
|
|
234
|
+
fig = plt.figure()
|
|
235
|
+
ax = fig.add_subplot(projection="3d")
|
|
236
|
+
tm.style_3d(ax)
|
|
237
|
+
ax.plot_surface(xx, yy, zz, cmap=tm.DIVERGING_CMAP, shade=True)
|
|
238
|
+
```
|
|
239
|
+
|
|
240
|
+
`style_3d()` clears panes and applies consistent grids, ticks, and viewing geometry. Pass `gray_decorations=True` for muted decorations.
|
|
241
|
+
|
|
242
|
+
## Visual showcase
|
|
243
|
+
|
|
244
|
+
```bash
|
|
245
|
+
python examples/showcase.py
|
|
246
|
+
python examples/geometry_check.py
|
|
247
|
+
```
|
|
248
|
+
|
|
249
|
+
The showcase creates 27 default-versus-Plotform comparisons at 800 DPI, lightweight previews, selected PDF/SVG exports, and a contact sheet under `artifacts/showcase/`. The geometry script creates exact capsule reference boards under `artifacts/`.
|
|
250
|
+
|
|
251
|
+
[View the complete 27-chart contact sheet](https://github.com/Econ01/plotform/blob/main/docs/images/contact-sheet.png) or regenerate the documentation images with `python tools/make_doc_images.py`.
|
|
252
|
+
|
|
253
|
+
## Development
|
|
254
|
+
|
|
255
|
+
```bash
|
|
256
|
+
python -m pip install -e ".[dev]"
|
|
257
|
+
pytest
|
|
258
|
+
ruff check .
|
|
259
|
+
ruff format --check .
|
|
260
|
+
python -m build
|
|
261
|
+
```
|
|
262
|
+
|
|
263
|
+
See `CHANGELOG.md` for release history and `docs/RELEASING.md` for the GitHub, TestPyPI, and PyPI release process.
|
|
264
|
+
|
|
265
|
+
## License
|
|
266
|
+
|
|
267
|
+
Code is MIT licensed. Bundled font software remains under the SIL Open Font License; see the font asset notices for details.
|
|
@@ -0,0 +1,21 @@
|
|
|
1
|
+
plotform/__init__.py,sha256=i4nQUfib-fgCxmsK-nU4L8JPf6RjxX1YzBEAmyQYEaU,967
|
|
2
|
+
plotform/api.py,sha256=UaQcmYA8eAp43reXUmSyXxSIpZXrtOtXfs-rldCd21M,1390
|
|
3
|
+
plotform/colorbar_utils.py,sha256=gTB-X_3nn_tjl1ZvSP-4xwuw_SjUyatP95aunwFrTAY,2323
|
|
4
|
+
plotform/fonts.py,sha256=KRknHc7Y-kCimhdWqlvK5MK0MrTLelyxutkU7bkLNM8,1821
|
|
5
|
+
plotform/legend_utils.py,sha256=oFdvbJeD5f_SqhVSxe_3sEEV9vi8GnwN3pOzaknUuPw,6748
|
|
6
|
+
plotform/palette.py,sha256=92ceATHZa1N4Ae4aVidR7eGlFoqHV0HdF4OLrMS7loM,3210
|
|
7
|
+
plotform/rounded.py,sha256=6Lf_IJM3DoDMfLkDfmbbz1oZENTzRQ5NdIToCWLgqd0,15917
|
|
8
|
+
plotform/theme.py,sha256=15LVcgvG63xYIS0GGQucEbutHUk3pXHI3ouPTe9xsKk,5761
|
|
9
|
+
plotform/three_d.py,sha256=GeEutJ4X3Qdhr5bvZahVi-UmpD3mCEVWXQL9xMjzKT0,1210
|
|
10
|
+
plotform/assets/fonts/PlotformMono-OFL.txt,sha256=_49PvE8accfUxkgcSNwrIcQ_jcFYclNmZ_7kXBXSCSg,4396
|
|
11
|
+
plotform/assets/fonts/PlotformMono-Regular.ttf,sha256=RewGQyko36BxZl2oFhHOPGRR4NeyI13cqIxa3rlXQx4,54728
|
|
12
|
+
plotform/assets/fonts/PlotformMono-TRADEMARKS.md,sha256=2cYnyWiDe0oUgZUVMnHKaemNS8dQsEHg2Yuns3axz1A,1478
|
|
13
|
+
plotform/assets/fonts/PlotformSans-OFL.txt,sha256=_BPWn2PjbShLbjg9TRRj2K1ATwqgZeV8-WElLVEGMTc,4488
|
|
14
|
+
plotform/assets/fonts/PlotformSans-Rounded.ttf,sha256=B-gp5oa3a7mtZqrgziLCJ7pLxfnFDlyGmt-V_07h3B0,135908
|
|
15
|
+
plotform/assets/fonts/PlotformSans-TRADEMARKS.md,sha256=XK04HAgo22VvMqeHoe_3bbMwPHTsT5Rmiun8KHP_5C8,1585
|
|
16
|
+
plotform/assets/fonts/README.md,sha256=NJGqx8G7iyZHb1qzJNPMVrdOjOwJoD7iGZnnI4sOKAA,1477
|
|
17
|
+
plotform-0.1.0.dist-info/licenses/LICENSE,sha256=CyF9C-jwz6-vCay6i5Ogbx5FcVFBsojgk0KC5E62b_o,1213
|
|
18
|
+
plotform-0.1.0.dist-info/METADATA,sha256=Aj9_88e1tY2SSfGWi-bhjnZW9CA2pO0jEtlRjVkmTXs,9410
|
|
19
|
+
plotform-0.1.0.dist-info/WHEEL,sha256=mOdXR9C3wMVov7cSY8PY-XCzo3SmmWCHvGQr5csJoao,91
|
|
20
|
+
plotform-0.1.0.dist-info/top_level.txt,sha256=AbbFIaqd-8jLb_RtYmaTRXjqZXmskJGnOM9aBVlABZM,9
|
|
21
|
+
plotform-0.1.0.dist-info/RECORD,,
|
|
@@ -0,0 +1,24 @@
|
|
|
1
|
+
MIT License
|
|
2
|
+
|
|
3
|
+
Copyright (c) 2026 Econ01
|
|
4
|
+
|
|
5
|
+
Permission is hereby granted, free of charge, to any person obtaining a copy
|
|
6
|
+
of this software and associated documentation files (the "Software"), to deal
|
|
7
|
+
in the Software without restriction, including without limitation the rights
|
|
8
|
+
to use, copy, modify, merge, publish, distribute, sublicense, and/or sell
|
|
9
|
+
copies of the Software, and to permit persons to whom the Software is
|
|
10
|
+
furnished to do so, subject to the following conditions:
|
|
11
|
+
|
|
12
|
+
The above copyright notice and this permission notice shall be included in all
|
|
13
|
+
copies or substantial portions of the Software.
|
|
14
|
+
|
|
15
|
+
THE SOFTWARE IS PROVIDED "AS IS", WITHOUT WARRANTY OF ANY KIND, EXPRESS OR
|
|
16
|
+
IMPLIED, INCLUDING BUT NOT LIMITED TO THE WARRANTIES OF MERCHANTABILITY,
|
|
17
|
+
FITNESS FOR A PARTICULAR PURPOSE AND NONINFRINGEMENT. IN NO EVENT SHALL THE
|
|
18
|
+
AUTHORS OR COPYRIGHT HOLDERS BE LIABLE FOR ANY CLAIM, DAMAGES OR OTHER
|
|
19
|
+
LIABILITY, WHETHER IN AN ACTION OF CONTRACT, TORT OR OTHERWISE, ARISING FROM,
|
|
20
|
+
OUT OF OR IN CONNECTION WITH THE SOFTWARE OR THE USE OR OTHER DEALINGS IN THE
|
|
21
|
+
SOFTWARE.
|
|
22
|
+
|
|
23
|
+
Bundled font software is licensed separately under the SIL Open Font License.
|
|
24
|
+
See src/plotform/assets/fonts/ for the font licenses and attributions.
|
|
@@ -0,0 +1 @@
|
|
|
1
|
+
plotform
|