pingerplot 1.6.0__py3-none-any.whl
This diff represents the content of publicly available package versions that have been released to one of the supported registries. The information contained in this diff is provided for informational purposes only and reflects changes between package versions as they appear in their respective public registries.
- pingerplot/__init__.py +8 -0
- pingerplot/__main__.py +5 -0
- pingerplot/appicon.py +144 -0
- pingerplot/compare.py +257 -0
- pingerplot/ed25519.py +145 -0
- pingerplot/geoip.py +337 -0
- pingerplot/gfx.py +203 -0
- pingerplot/gui.py +1792 -0
- pingerplot/gui_charts.py +409 -0
- pingerplot/gui_history.py +684 -0
- pingerplot/gui_hopinfo.py +125 -0
- pingerplot/gui_recording.py +176 -0
- pingerplot/gui_settings.py +322 -0
- pingerplot/gui_updates.py +270 -0
- pingerplot/gui_widgets.py +248 -0
- pingerplot/headless.py +661 -0
- pingerplot/history.py +823 -0
- pingerplot/icmp.py +305 -0
- pingerplot/icmp_posix.py +456 -0
- pingerplot/investigate.py +205 -0
- pingerplot/launch.py +37 -0
- pingerplot/locating.py +248 -0
- pingerplot/model.py +410 -0
- pingerplot/monitor.py +1404 -0
- pingerplot/places.py +259 -0
- pingerplot/routes.py +112 -0
- pingerplot/selfcheck.py +97 -0
- pingerplot/selftest.py +76 -0
- pingerplot/settings.py +98 -0
- pingerplot/tcpudp.py +479 -0
- pingerplot/theme.py +576 -0
- pingerplot/tkthreads.py +68 -0
- pingerplot/tray.py +373 -0
- pingerplot/trouble.py +129 -0
- pingerplot/update_key.py +8 -0
- pingerplot/updater.py +499 -0
- pingerplot/winplatform.py +366 -0
- pingerplot/worldmap.py +141 -0
- pingerplot/xdg.py +198 -0
- pingerplot-1.6.0.dist-info/METADATA +583 -0
- pingerplot-1.6.0.dist-info/RECORD +45 -0
- pingerplot-1.6.0.dist-info/WHEEL +5 -0
- pingerplot-1.6.0.dist-info/entry_points.txt +5 -0
- pingerplot-1.6.0.dist-info/licenses/LICENSE +21 -0
- pingerplot-1.6.0.dist-info/top_level.txt +1 -0
|
@@ -0,0 +1,583 @@
|
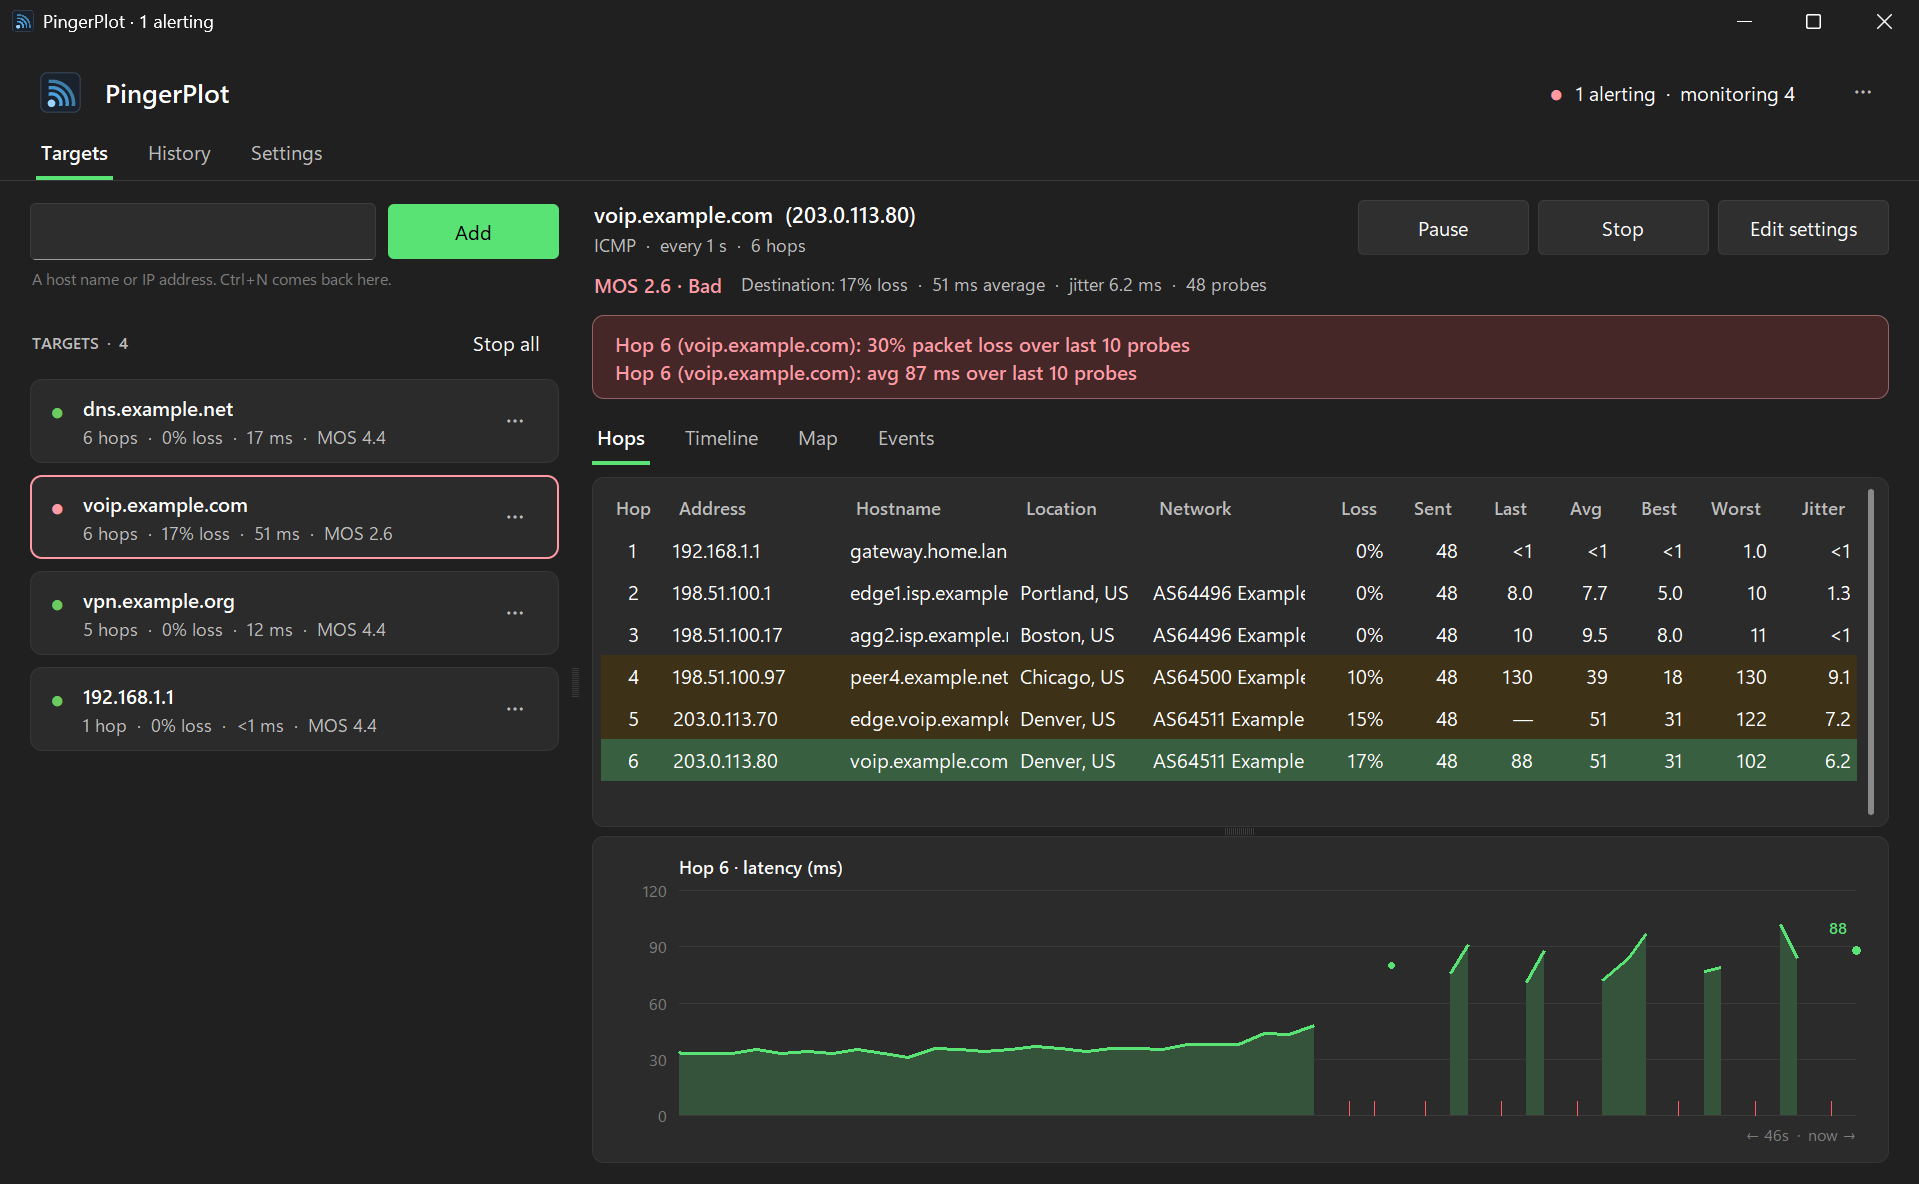
|
|
1
|
+
Metadata-Version: 2.4
|
|
2
|
+
Name: pingerplot
|
|
3
|
+
Version: 1.6.0
|
|
4
|
+
Summary: A continuous-traceroute network path monitor (MTR-style) with a Tkinter GUI: per-hop latency, loss, jitter and MOS over time.
|
|
5
|
+
Author: James Cupps
|
|
6
|
+
License: MIT
|
|
7
|
+
Project-URL: Homepage, https://github.com/jamesccupps/PingerPlot
|
|
8
|
+
Project-URL: Source, https://github.com/jamesccupps/PingerPlot
|
|
9
|
+
Project-URL: Issues, https://github.com/jamesccupps/PingerPlot/issues
|
|
10
|
+
Keywords: traceroute,ping,mtr,network,latency,packet-loss,monitor,icmp,mos,dscp,windows
|
|
11
|
+
Classifier: Development Status :: 5 - Production/Stable
|
|
12
|
+
Classifier: Environment :: Win32 (MS Windows)
|
|
13
|
+
Classifier: Environment :: X11 Applications
|
|
14
|
+
Classifier: Intended Audience :: System Administrators
|
|
15
|
+
Classifier: Intended Audience :: Information Technology
|
|
16
|
+
Classifier: License :: OSI Approved :: MIT License
|
|
17
|
+
Classifier: Operating System :: Microsoft :: Windows
|
|
18
|
+
Classifier: Operating System :: POSIX :: Linux
|
|
19
|
+
Classifier: Operating System :: MacOS :: MacOS X
|
|
20
|
+
Classifier: Programming Language :: Python :: 3
|
|
21
|
+
Classifier: Topic :: System :: Networking :: Monitoring
|
|
22
|
+
Requires-Python: >=3.10
|
|
23
|
+
Description-Content-Type: text/markdown
|
|
24
|
+
License-File: LICENSE
|
|
25
|
+
Provides-Extra: dev
|
|
26
|
+
Requires-Dist: pytest; extra == "dev"
|
|
27
|
+
Dynamic: license-file
|
|
28
|
+
|
|
29
|
+
# PingerPlot
|
|
30
|
+
|
|
31
|
+
[](https://github.com/jamesccupps/PingerPlot/releases/latest)
|
|
32
|
+
[](https://github.com/jamesccupps/PingerPlot/actions/workflows/ci.yml)
|
|
33
|
+
[](https://github.com/jamesccupps/PingerPlot/blob/v1.6.0/LICENSE)
|
|
34
|
+
|
|
35
|
+
Shows you *where* along a network path a connection goes wrong. Like `mtr` or WinMTR, PingerPlot finds every
|
|
36
|
+
router between you and a target and then keeps probing all of them, so loss, latency, jitter and a voice-quality
|
|
37
|
+
score build up per hop over minutes or days. A problem that starts at your gateway, your ISP's first hop, a peering
|
|
38
|
+
point or the destination shows up at that hop and every hop after it. It runs in the notification area, alerts you
|
|
39
|
+
when the destination degrades, and needs no administrator rights for ICMP.
|
|
40
|
+
|
|
41
|
+
**[⬇ Download for Windows](https://github.com/jamesccupps/PingerPlot/releases/latest/download/PingerPlot-Setup.exe)**
|
|
42
|
+
(`PingerPlot-Setup.exe`, Windows 10 or 11, 64-bit) ·
|
|
43
|
+
[Portable zip](https://github.com/jamesccupps/PingerPlot/releases/latest/download/PingerPlot-win64.zip) ·
|
|
44
|
+
[All releases](https://github.com/jamesccupps/PingerPlot/releases) ·
|
|
45
|
+
[Linux](https://github.com/jamesccupps/PingerPlot/blob/v1.6.0/README.md#linux) ·
|
|
46
|
+
[Website](https://jamesccupps.github.io/PingerPlot/)
|
|
47
|
+
|
|
48
|
+
|
|
49
|
+
|
|
50
|
+
<sub>Demo mode: simulated paths with documentation addresses.</sub>
|
|
51
|
+
|
|
52
|
+
- **Every hop, all the time.** Each round is a full traceroute, so every hop gets current, average, best and worst
|
|
53
|
+
latency, jitter and loss over time, not a single snapshot.
|
|
54
|
+
- **The path over time.** The Timeline draws every hop on one time axis: a latency step shows up as the row where
|
|
55
|
+
the bars get tall, and stays tall for every hop after it.
|
|
56
|
+
- **Alerts that mean something.** Sustained loss, latency or a poor MOS at the *destination*, over a window you
|
|
57
|
+
choose, never a router in the middle that just deprioritizes ICMP. A banner, a sound, a Windows notification and
|
|
58
|
+
an optional webhook (Slack, Teams, ntfy, Home Assistant…).
|
|
59
|
+
- **Route changes, live.** A hop whose router changes, or a path that grows or shrinks, goes into the Events list.
|
|
60
|
+
- **Many targets at once,** each with its own settings, each a card with its hop count, loss, latency and MOS.
|
|
61
|
+
- **MOS**, the ITU-T E-model's 1 to 5 voice-quality score, for the destination: one number for "is this path good
|
|
62
|
+
enough for a call".
|
|
63
|
+
- **ICMP, TCP and UDP probes**, DSCP marking (measure the path as voice or video traffic) and a fixed source address
|
|
64
|
+
on a multi-homed PC.
|
|
65
|
+
- **Runs in the background.** Closing the window keeps every target monitored from the notification area; *Start
|
|
66
|
+
with Windows* puts it there when you sign in.
|
|
67
|
+
- **Keeps a record.** Every probe to a size-capped CSV per target, sessions you can save, reopen and compare with
|
|
68
|
+
a later run, and a CSV export of the hop table.
|
|
69
|
+
- **Signed downloads and updates.** The installer and the programs are code-signed by James Cupps. It checks
|
|
70
|
+
GitHub once a day and installs a new version with one click, only if the download carries the release signature
|
|
71
|
+
built into the app.
|
|
72
|
+
- **A headless runner** for a server or Task Scheduler, with a one-shot report mode for tickets.
|
|
73
|
+
- **Looks at home on Windows 11**, light or dark, following Windows, sharp at any display scale. Pure Python
|
|
74
|
+
standard library, no third-party dependencies.
|
|
75
|
+
|
|
76
|
+
## Install
|
|
77
|
+
|
|
78
|
+
**Installer (recommended):** download
|
|
79
|
+
[`PingerPlot-Setup.exe`](https://github.com/jamesccupps/PingerPlot/releases/latest/download/PingerPlot-Setup.exe)
|
|
80
|
+
and run it.
|
|
81
|
+
|
|
82
|
+
- It installs for your Windows user only, with no admin prompt, into `%LOCALAPPDATA%\Programs\PingerPlot`.
|
|
83
|
+
- It adds a Start menu shortcut (and a desktop one if you tick it) and appears in **Settings → Apps** for
|
|
84
|
+
uninstalling.
|
|
85
|
+
- The installer and the app are code-signed by **James Cupps**. If SmartScreen warns about a new release,
|
|
86
|
+
**More info** shows that publisher. Each release lists the SHA-256 of every file in `SHA256SUMS.txt`.
|
|
87
|
+
|
|
88
|
+
**Portable:** download
|
|
89
|
+
[`PingerPlot-win64.zip`](https://github.com/jamesccupps/PingerPlot/releases/latest/download/PingerPlot-win64.zip)
|
|
90
|
+
and unzip it somewhere of your own, e.g. a USB stick or `%LOCALAPPDATA%\Programs`. It keeps its settings in its own
|
|
91
|
+
folder (that's what the `portable.txt` beside it does), and updates itself in place. Avoid `C:\Program Files`,
|
|
92
|
+
which it can't write to.
|
|
93
|
+
|
|
94
|
+
**Install with Scoop:** if you use [Scoop](https://scoop.sh) (its site has the one-line install if you don't):
|
|
95
|
+
|
|
96
|
+
```powershell
|
|
97
|
+
scoop bucket add jamesccupps https://github.com/jamesccupps/scoop-bucket
|
|
98
|
+
scoop install jamesccupps/pingerplot
|
|
99
|
+
```
|
|
100
|
+
|
|
101
|
+
It installs the portable zip with a Start menu shortcut, keeps its settings in `%APPDATA%\PingerPlot`, and puts
|
|
102
|
+
`pingerplot-headless` on your PATH. `scoop update pingerplot` updates it.
|
|
103
|
+
|
|
104
|
+
**Linux:** see [Linux](https://github.com/jamesccupps/PingerPlot/blob/v1.6.0/README.md#linux) below: one `pipx` command.
|
|
105
|
+
|
|
106
|
+
**From source** (Windows, Linux, macOS): Python 3.10 or newer, nothing to `pip install`.
|
|
107
|
+
`git clone https://github.com/jamesccupps/PingerPlot`, then `python main.py`, or on Windows double-click
|
|
108
|
+
`PingerPlot.vbs` (no console window). See [Running from source](https://github.com/jamesccupps/PingerPlot/blob/v1.6.0/README.md#running-from-source) for shortcuts and an elevated
|
|
109
|
+
logon task.
|
|
110
|
+
|
|
111
|
+
> **About antivirus warnings.** Some antivirus engines flag PyInstaller programs heuristically, and this one is a
|
|
112
|
+
> worse-than-average case: it calls into `iphlpapi` through `ctypes`, can open raw capture sockets and maps network
|
|
113
|
+
> paths, which is a fair description of both a diagnostic tool and something you wouldn't want running unasked. The
|
|
114
|
+
> files are built by CI from the tagged commit, signed, and tested before they're published. If you'd rather not
|
|
115
|
+
> run a downloaded program at all, run it from source: it's the same program.
|
|
116
|
+
|
|
117
|
+
### Linux
|
|
118
|
+
|
|
119
|
+
PingerPlot runs on Linux from Python, with nothing to compile and no dependencies beyond Tk. It needs Python 3.10
|
|
120
|
+
or newer and Tk, which most distributions package separately:
|
|
121
|
+
|
|
122
|
+
| Distribution | Tk |
|
|
123
|
+
|---|---|
|
|
124
|
+
| Debian, Ubuntu, Mint | `sudo apt install python3-tk` |
|
|
125
|
+
| Fedora, RHEL | `sudo dnf install python3-tkinter` |
|
|
126
|
+
| Arch, Manjaro | `sudo pacman -S tk` |
|
|
127
|
+
| openSUSE | `sudo zypper install python3-tk` |
|
|
128
|
+
|
|
129
|
+
Then, with [pipx](https://pipx.pypa.io/) (`sudo apt install pipx` on Debian and Ubuntu, `sudo dnf install pipx` on
|
|
130
|
+
Fedora, `sudo pacman -S python-pipx` on Arch), install it for your user and start it:
|
|
131
|
+
|
|
132
|
+
```bash
|
|
133
|
+
pipx install git+https://github.com/jamesccupps/PingerPlot
|
|
134
|
+
pingerplot
|
|
135
|
+
```
|
|
136
|
+
|
|
137
|
+
In **Settings**, turn on **Show in the applications menu** to add it, with its icon, to your desktop's menu and
|
|
138
|
+
search, and **Start when you sign in** if you want it monitoring from sign-in. To update: `pipx reinstall
|
|
139
|
+
pingerplot` (the app checks once a day and says when there's a new version). To remove it, see
|
|
140
|
+
[Uninstalling](https://github.com/jamesccupps/PingerPlot/blob/v1.6.0/README.md#uninstalling). Or skip pipx: `git clone` and `python3 main.py` works the same.
|
|
141
|
+
|
|
142
|
+
ICMP needs no root: it uses the kernel's unprivileged ICMP sockets, which most systemd-based distributions allow
|
|
143
|
+
by default. If PingerPlot says the ICMP backend is unavailable, it names the one `sysctl` to run.
|
|
144
|
+
|
|
145
|
+
What's different from Windows:
|
|
146
|
+
|
|
147
|
+
- There's no notification-area icon (Tk has no way to make one without extra packages), so closing the window
|
|
148
|
+
quits. *Start when you sign in* opens it minimized instead.
|
|
149
|
+
- Alerts notify through `notify-send` (libnotify, on nearly every desktop) and ring Tk's bell (the desktop's
|
|
150
|
+
alert sound, where it has one). Clicking a notification doesn't open the target.
|
|
151
|
+
- *Match the system* follows the desktop's light or dark setting (GNOME, KDE Plasma and others, through the
|
|
152
|
+
freedesktop settings portal).
|
|
153
|
+
- Full TCP and UDP traceroute is Windows-only for now: it relies on a Windows raw-capture feature. ICMP, and TCP to
|
|
154
|
+
the destination (*Destination only*), work everywhere.
|
|
155
|
+
- The headless runner is `pingerplot-headless`.
|
|
156
|
+
|
|
157
|
+
CI starts the app on Ubuntu on every push: the window's self-test, a probe of loopback, the pipx install, and
|
|
158
|
+
`desktop-file-validate` on its menu and autostart entries.
|
|
159
|
+
|
|
160
|
+
## Use
|
|
161
|
+
|
|
162
|
+
1. Type a host name or IP address in the box at the top left (your gateway, `8.8.8.8`, a server you care about)
|
|
163
|
+
and press **Add**. Add as many as you like; each gets a card.
|
|
164
|
+
2. Click a card to see that target: its status and MOS, then four views.
|
|
165
|
+
- **Hops**: the table (address, hostname, location, network, loss, sent, last, average, best, worst, jitter),
|
|
166
|
+
rows amber or red on loss or high latency, over a latency graph. Click a row to graph that hop; until you do,
|
|
167
|
+
it follows the destination. Right-click a hop for **Details…**: where it is by its name and by the IP
|
|
168
|
+
database (each says which), whose network it's on, and every router seen at that hop in the last day.
|
|
169
|
+
- **Timeline**: every hop stacked on one time axis.
|
|
170
|
+
- **Map**: the path on a map, zoomed to fit, each router placed by its name when that names a city and by
|
|
171
|
+
the IP database otherwise (see [privacy](https://github.com/jamesccupps/PingerPlot/blob/v1.6.0/README.md#updates-and-privacy)), unless its round trip shows the database
|
|
172
|
+
is wrong: a reply can't come from farther away than light in fiber travels in the time, so 1.1.1.1
|
|
173
|
+
answering in 3 ms isn't in Brisbane. A router answering as fast as the one beside it, placed by its name,
|
|
174
|
+
but put hundreds of kilometers from it is doubted too. Such a router is left off, and Details says why. The target's other
|
|
175
|
+
routes from the last day are dashed underneath. Below it, **where the trouble is**: each place on the path, the delay it adds
|
|
176
|
+
and the loss that starts there and carries to the destination (loss that stops at a router is that router
|
|
177
|
+
ignoring pings, and isn't counted), with a one-line verdict.
|
|
178
|
+
- **Events**: route changes, alerts raised and cleared, warnings.
|
|
179
|
+
3. **Pause**, **Stop** and **Edit settings** are at the top right. Editing a target's settings restarts it with
|
|
180
|
+
them.
|
|
181
|
+
|
|
182
|
+
- **⋯** on a card, or a right-click, has *Edit settings…*, *Pause*/*Resume*, *Stop*/*Start* and *Remove*.
|
|
183
|
+
Right-click a hop for its details, or to copy its address, hostname or row. Ctrl+N goes back to the box.
|
|
184
|
+
- **Settings** holds the defaults for new targets (probing, alerts, logging and webhooks) and the app's own
|
|
185
|
+
options: theme, resuming your targets at start, Start with Windows, the notification area, notifications and
|
|
186
|
+
updates.
|
|
187
|
+
- **⋯** at the top right: export the hop table as CSV, save a session, open one, compare with a saved one, check
|
|
188
|
+
for updates, report a problem.
|
|
189
|
+
- The tray icon is gray when nothing is monitored and gets a red badge while a target is alerting. Click it to open
|
|
190
|
+
the window; right-click for *Stop all*, *Start with Windows* and *Quit*.
|
|
191
|
+
|
|
192
|
+
## Reading the results
|
|
193
|
+
|
|
194
|
+
- **Loss at a hop in the middle while the destination stays clean is normal.** Many routers rate-limit or ignore
|
|
195
|
+
the "TTL exceeded" messages they're asked to generate. Only loss that carries through to the destination (the
|
|
196
|
+
last row) is a problem on the path.
|
|
197
|
+
- A latency *step* that appears at one hop and stays in every hop after it is where the delay comes in.
|
|
198
|
+
- Sub-millisecond hops show as `<1`: the Windows ICMP API reports whole milliseconds.
|
|
199
|
+
- **Jitter** is the average change in RTT from one reply to the next (lost probes skipped): what a jitter buffer
|
|
200
|
+
has to absorb, and what the MOS formula expects. A path that steps from a steady 20 ms to a steady 60 ms has a
|
|
201
|
+
latency change, not jitter. (Before 1.3.3 this column was the standard deviation of RTT, which counted that step as
|
|
202
|
+
jitter for as long as it sat in the window.)
|
|
203
|
+
- **MOS** runs from 1 to 5: 4.3 and up is excellent, under 3.6 is poor for a call.
|
|
204
|
+
|
|
205
|
+
## Alerts
|
|
206
|
+
|
|
207
|
+
**Settings → Alerts** (or a target's **Edit settings**): packet loss at or above X %, average latency at or above
|
|
208
|
+
Y ms, MOS at or below Z, over the last N probes. The window is what makes it "sustained": a single spike won't trip
|
|
209
|
+
a 20-probe window. `0` turns a check off. An alert raises when it crosses the threshold and clears by itself when it
|
|
210
|
+
recovers; both go into Events, the banner, a notification (**Settings → Show a notification for alerts**), the
|
|
211
|
+
optional sound and the webhook.
|
|
212
|
+
|
|
213
|
+
Alerts judge the destination only, the one hop whose numbers aren't muddied by routers deprioritizing ICMP, and
|
|
214
|
+
only once it has answered, so a target that simply blocks ICMP never false-alarms. The window counts only probes
|
|
215
|
+
since the destination took its current hop number: after a reroute, a hop's history can belong to a router that
|
|
216
|
+
held that TTL in the meantime, and its rate-limited "TTL exceeded" replies aren't the destination's loss. The hop
|
|
217
|
+
table still shows per-TTL statistics across responders, as `mtr` does.
|
|
218
|
+
|
|
219
|
+
**Webhook** (**Settings → Logging and webhooks**): an `https://` or `http://` address gets a JSON POST when an alert
|
|
220
|
+
raises or clears. A delivery that fails is a warning in Events naming only the host, never the full address
|
|
221
|
+
(Slack, Teams and ntfy put the secret in the path).
|
|
222
|
+
|
|
223
|
+
## Probe modes
|
|
224
|
+
|
|
225
|
+
ICMP goes through the Windows IP Helper API (`IcmpSendEcho`), the same call `ping.exe` and `tracert.exe` use, which
|
|
226
|
+
is why it needs no administrator rights. The others:
|
|
227
|
+
|
|
228
|
+
| Mode | Needs admin? | Use it for |
|
|
229
|
+
|---|---|---|
|
|
230
|
+
| **ICMP** | No | The default. Full traceroute and monitoring. |
|
|
231
|
+
| **TCP, destination only** | No | "Is this service up, and how fast?": a TCP handshake to a port (443, 3389, a device's web page). No per-hop trace. |
|
|
232
|
+
| **TCP / UDP, full traceroute** | **Yes** | A per-hop trace where ICMP is blocked or deprioritized. Probes go out on a normal socket with `IP_TTL`; routers' "TTL exceeded" replies are captured on a raw `SIO_RCVALL` socket, which needs elevation: **⋯ → Restart as administrator** (also in the tray menu, Settings, and on a target that needs it). Windows asks first, naming the publisher; your targets carry on. |
|
|
233
|
+
|
|
234
|
+
Without admin, a full TCP/UDP traceroute is refused with a message rather than showing misleading all-timeout hops.
|
|
235
|
+
Every probe goes to the port you set, TCP and UDP alike, so the trace follows the path that port's traffic takes.
|
|
236
|
+
An *open* UDP port stays silent and reads as a timeout, so prefer TCP for a definitive "the service is up".
|
|
237
|
+
|
|
238
|
+
> **TCP reply timeout.** Windows doesn't hand a connecting socket the RST the moment it arrives: it finishes
|
|
239
|
+
> retransmitting the SYN first, about 2 s. Below that a *closed* port is indistinguishable from an unreachable
|
|
240
|
+
> host, which is the wrong answer in the commonest case of all ("the service is down but the box is fine"). TCP
|
|
241
|
+
> mode therefore waits at least 3000 ms and says so in Events. `TCP_MAXRT` doesn't help: it replaces
|
|
242
|
+
> `WSAECONNREFUSED` with `WSAETIMEDOUT` and destroys the very distinction the probe exists to draw.
|
|
243
|
+
|
|
244
|
+
**ICMP for watching, TCP for checking.** For a target you leave running, use ICMP:
|
|
245
|
+
|
|
246
|
+
- **Path mixing.** A TCP traceroute sends each hop from its own socket, so each hop leaves from its own source
|
|
247
|
+
port. Routers that spread traffic over parallel links (ECMP) pick the link from the addresses and ports, so
|
|
248
|
+
neighboring hops can take different links and the hop list can join two paths into one. Paris traceroute
|
|
249
|
+
prevents that by keeping every hop's ports the same, which takes raw TCP sends, and Windows forbids those.
|
|
250
|
+
- **ICMP is steadier, not immune.** ICMP mode uses one identifier for a whole round. Each probe's sequence number
|
|
251
|
+
still changes the checksum some balancers hash, but a new port per hop splits far more often.
|
|
252
|
+
- **It can look like an attack.** TCP mode sends a SYN to the target's port for every hop of every round. Intrusion
|
|
253
|
+
detection that ignores the TTL can take that for a SYN flood.
|
|
254
|
+
|
|
255
|
+
Use TCP to check a particular service, or to trace a path that blocks ICMP.
|
|
256
|
+
|
|
257
|
+
### DSCP and source address
|
|
258
|
+
|
|
259
|
+
**DSCP** (Settings → Probing) marks each probe with a DiffServ code point, so a path with QoS can be measured as the
|
|
260
|
+
class you care about rather than as best-effort: 46 is EF (voice), 34 AF41 (video), 26 AF31 (signalling), 0 best
|
|
261
|
+
effort. The low two bits of the ToS byte are ECN and are never touched.
|
|
262
|
+
|
|
263
|
+
> ICMP mode marks through the IP Helper API and is the mode to use for this. Windows **silently ignores** `IP_TOS` on
|
|
264
|
+
> an ordinary socket unless the `DisableUserTOSSetting` registry value is cleared, so a TCP/UDP run may go out
|
|
265
|
+
> unmarked while `setsockopt` reports success: confirm with a capture before drawing a conclusion from one. That
|
|
266
|
+
> the byte reaches the wire hasn't been verified here; every code point is accepted without error, which is a
|
|
267
|
+
> weaker claim.
|
|
268
|
+
|
|
269
|
+
**Source address** (Settings → Probing) pins the outgoing interface on a multi-homed PC, to ask what a path looks
|
|
270
|
+
like *from a particular VLAN*. An address the PC doesn't have is refused at start, in every mode, and one that
|
|
271
|
+
disappears mid-run makes each probe report `ERROR_INVALID_NETNAME` rather than silently falling back to the default
|
|
272
|
+
route. A silent fallback is the dangerous outcome: the numbers look fine and describe a path you didn't ask about.
|
|
273
|
+
|
|
274
|
+
Both are recorded in the status line, the report header, the CSV export header and the saved session: a marked or
|
|
275
|
+
pinned run measured something different from a plain one.
|
|
276
|
+
|
|
277
|
+
## History
|
|
278
|
+
|
|
279
|
+
Everything PingerPlot measures is kept, with nothing to set up: every probe and the router that answered it,
|
|
280
|
+
per-minute loss, latency and jitter for each hop and router, every event (alerts, reroutes, DNS moves, warnings),
|
|
281
|
+
and which route each target was on, when. It goes into one SQLite database on this computer (see
|
|
282
|
+
[Where it keeps things](https://github.com/jamesccupps/PingerPlot/blob/v1.6.0/README.md#where-it-keeps-things)), shared by the window and the headless runner.
|
|
283
|
+
|
|
284
|
+
- **Reroutes, not noise.** A hop whose router changes and stays changed for 3 rounds is a reroute: one event that
|
|
285
|
+
names the hops that moved. A hop that takes turns between routers (load balancing over parallel links) is noted
|
|
286
|
+
once and not reported again. A route that comes back is recognized as the one seen before.
|
|
287
|
+
- **A name that moves is followed.** A target given by name is looked up again every 5 minutes. If the address
|
|
288
|
+
being probed is no longer among the answers (a service sending you to another front end, say), that's an event,
|
|
289
|
+
and PingerPlot traces the route to the new address. Round-robin DNS that only rotates the order isn't a move.
|
|
290
|
+
- **Settings → Recording**: turn it off, choose how long to keep probes (7 days), minute summaries and events (a
|
|
291
|
+
year), and a size limit (1 GB; past it the oldest probes go first). **What to record** picks which parts are kept.
|
|
292
|
+
**Open folder** shows the file; **Clear history** empties it. Changes apply at once, to running targets too.
|
|
293
|
+
- **Robust.** Writes happen on their own thread, so probing never waits on the disk, and a crash loses at most the
|
|
294
|
+
last second. A damaged file is set aside and a new one started; a full disk or a folder that can't be written is a
|
|
295
|
+
warning in the target's Events. The webhook address is never written to it.
|
|
296
|
+
|
|
297
|
+
**The History page** (next to Targets) shows what a target did over a span of time: the last hour to the last year,
|
|
298
|
+
stepped back and forth with **Earlier** and **Later**, or opened from a target's right-click menu (**Show history**).
|
|
299
|
+
|
|
300
|
+
- A chart of the destination's latency and loss, with the route in use drawn as a numbered color band above it
|
|
301
|
+
and reroutes and alerts marked. Hovering reads out the moment under the pointer.
|
|
302
|
+
- **Routes**: each route taken in the range, how long and what share of the time, and the destination's latency
|
|
303
|
+
and loss while on it, so the bad path stands out.
|
|
304
|
+
- **Hops**: every router that answered at each hop and how it did, so "which router?" has an answer. Pick a hop
|
|
305
|
+
to graph it instead of the destination.
|
|
306
|
+
- **Events**: alerts, reroutes, DNS moves, warnings and notes, filtered by kind and searched.
|
|
307
|
+
- **Export…**: the range's events, minute summaries or every probe, as CSV.
|
|
308
|
+
|
|
309
|
+
The file is plain SQLite (tables `runs`, `probes`, `minutes`, `events`, `routes`, `segments`), so any SQLite tool
|
|
310
|
+
can open it too.
|
|
311
|
+
|
|
312
|
+
## Sessions, logs and comparing runs
|
|
313
|
+
|
|
314
|
+
- **Probe log** (Settings → Logging and webhooks): every probe of every round to CSV, with a round number, so "did
|
|
315
|
+
every hop spike in the same round?" is a one-line filter. Each target writes its own file (`probe.csv` becomes
|
|
316
|
+
`probe_<target>.csv`), capped at 25 MB with one backup, so a run of weeks can't fill the disk. A rollover that
|
|
317
|
+
fails (the file is open in Excel) is reported and retried, not silently repeated.
|
|
318
|
+
- **⋯ → Save session… / Open a saved session…**: the whole run as JSON, every sample included, to look at later.
|
|
319
|
+
- **⋯ → Compare with a saved session…** diffs the live path against one you saved earlier, per hop. A hop whose
|
|
320
|
+
router changed is **rerouted**, with no latency difference: subtracting one router's latency from another's isn't
|
|
321
|
+
a number that means anything.
|
|
322
|
+
- **⋯ → Export hops as CSV…**: the hop table with the destination's MOS, under a header recording the interval,
|
|
323
|
+
timeout, probe mode, packet size, sample count and time window, so two exports can be compared rather than
|
|
324
|
+
guessed at.
|
|
325
|
+
|
|
326
|
+
## Updates and privacy
|
|
327
|
+
|
|
328
|
+
PingerPlot sends probes to the targets you add and nowhere else, and reads nothing on your network beyond the
|
|
329
|
+
replies. It talks to three other places:
|
|
330
|
+
|
|
331
|
+
- Your DNS server, for each hop's hostname (**Settings → Look up hostnames**), and every 5 minutes for a target you
|
|
332
|
+
gave by name, to notice when it moves.
|
|
333
|
+
- [ipwho.is](https://ipwho.is), for where each public router is and whose network it's on (the Location and
|
|
334
|
+
Network columns, Details, History and the map): each public hop's address only, the destination's included,
|
|
335
|
+
never a private, LAN or carrier-NAT one. Each router is asked about once a month (answers are kept in `lookups.json`), one at a time,
|
|
336
|
+
at most 500 a day. **Settings → Look up where routers are** turns it off; then only the **Map** asks, while
|
|
337
|
+
it's open. A router's city is also read from its name (`chcgil`, `dfw01`, `Dallas1`), which sends nothing.
|
|
338
|
+
- GitHub, once a day, for this project's `latest.json` (installed, portable and pipx copies, never a git
|
|
339
|
+
checkout; turn it off in **Settings → Updates**). Nothing is downloaded until you click **Install**; a pipx copy
|
|
340
|
+
is only told to run `pipx reinstall pingerplot`. An installed copy then runs the new installer
|
|
341
|
+
silently and restarts; a portable copy swaps its program files in place and restarts, and puts everything back
|
|
342
|
+
if that fails. Your targets resume either way. Running as administrator, it says a new version is out but
|
|
343
|
+
doesn't install it: start PingerPlot normally to install (the download waits in your own temp folder, where
|
|
344
|
+
any program running as you could swap it before it ran elevated).
|
|
345
|
+
|
|
346
|
+
Plus the webhook address, if you set one. The history stays on this computer. It sends nothing about you or your
|
|
347
|
+
PC anywhere. **⋯ → Report a
|
|
348
|
+
problem…** opens a GitHub issue form with the version filled in, which you edit and send yourself.
|
|
349
|
+
|
|
350
|
+
## Where it keeps things
|
|
351
|
+
|
|
352
|
+
- `%APPDATA%\PingerPlot\` holds `settings.json` (your targets, each with its settings, and the app's options),
|
|
353
|
+
`update.log`, the history in `history\history.sqlite3`, and `lookups.json` (where routers are, kept a month).
|
|
354
|
+
On Linux and macOS it's `$XDG_CONFIG_HOME/PingerPlot`, usually `~/.config/PingerPlot`.
|
|
355
|
+
- A portable copy keeps them beside `PingerPlot.exe` instead. Delete `portable.txt` to make it use `%APPDATA%`.
|
|
356
|
+
- On Linux, the menu and sign-in entries are `~/.local/share/applications/pingerplot.desktop` and
|
|
357
|
+
`~/.config/autostart/pingerplot.desktop`, and the icon they use is in `~/.cache/PingerPlot`.
|
|
358
|
+
- Probe logs and saved sessions go wherever you put them.
|
|
359
|
+
|
|
360
|
+
## Headless runner
|
|
361
|
+
|
|
362
|
+
For unattended monitoring on a box with no desktop session: the same engine without the window, each target
|
|
363
|
+
logging to its own size-capped CSV. `pingerplot-headless.exe` is beside `PingerPlot.exe` in either kind of install;
|
|
364
|
+
from source it's `python -m pingerplot.headless`.
|
|
365
|
+
|
|
366
|
+
```
|
|
367
|
+
pingerplot-headless.exe --init monitor.json # write a starter config, then edit it
|
|
368
|
+
pingerplot-headless.exe monitor.json # run it (Ctrl+C to stop)
|
|
369
|
+
pingerplot-headless.exe --version
|
|
370
|
+
```
|
|
371
|
+
|
|
372
|
+
The config is JSON: an optional `status_interval` (seconds between status lines; `0` is silent), a `defaults`
|
|
373
|
+
block, and a `targets` list where each entry may override any default:
|
|
374
|
+
|
|
375
|
+
```json
|
|
376
|
+
{
|
|
377
|
+
"status_interval": 60,
|
|
378
|
+
"defaults": { "interval": 2.5, "alert_loss_pct": 20, "alert_latency_ms": 250 },
|
|
379
|
+
"targets": [
|
|
380
|
+
{ "target": "dns.example.net", "log_path": "logs/dns.csv" },
|
|
381
|
+
{ "target": "192.168.1.1", "log_path": "logs/gateway.csv", "final_hop_only": true,
|
|
382
|
+
"webhook_url": "https://hooks.example/abc" }
|
|
383
|
+
]
|
|
384
|
+
}
|
|
385
|
+
```
|
|
386
|
+
|
|
387
|
+
Relative `log_path`s resolve next to the config file, and the folder is created if it's missing. A `log_path` in
|
|
388
|
+
`defaults` would put every target in one file; when several targets resolve to the same path, each gets its own
|
|
389
|
+
`<name>_<target>.csv` instead (and the runner says so). To run it at sign-in or boot, point a **Task Scheduler**
|
|
390
|
+
task at `pingerplot-headless.exe C:\path\to\monitor.json` (or `pythonw.exe -m pingerplot.headless …` from source).
|
|
391
|
+
Besides the status lines, it prints every event as it happens: alerts raised and cleared, route changes, and
|
|
392
|
+
warnings such as a probe log it couldn't open or a webhook that wasn't delivered.
|
|
393
|
+
|
|
394
|
+
It records into the same [history](https://github.com/jamesccupps/PingerPlot/blob/v1.6.0/README.md#history) as the window, so the window shows what it measured. A `recording`
|
|
395
|
+
object in the config changes that: `"recording": {"enabled": false}` turns it off, and `probe_days`,
|
|
396
|
+
`summary_days`, `event_days` and `max_mb` set how much is kept, as in Settings → Recording.
|
|
397
|
+
|
|
398
|
+
A target whose name doesn't resolve at start, the normal case for a task that runs at boot before DNS is up, is
|
|
399
|
+
**restarted automatically**, the delay backing off from 30 s to 5 minutes while it keeps failing. Restarts are
|
|
400
|
+
logged and shown in the status lines.
|
|
401
|
+
|
|
402
|
+
### One-shot reports
|
|
403
|
+
|
|
404
|
+
For a ticket, a scheduled check, or a before/after around a change: collect a fixed number of rounds, print a
|
|
405
|
+
table, and exit.
|
|
406
|
+
|
|
407
|
+
```
|
|
408
|
+
pingerplot-headless.exe monitor.json --report 20
|
|
409
|
+
pingerplot-headless.exe monitor.json --report 20 --report-csv out.csv
|
|
410
|
+
pingerplot-headless.exe monitor.json --report 20 --baseline last-week.json
|
|
411
|
+
```
|
|
412
|
+
|
|
413
|
+
The exit status is `0` only if every target reached its destination, so a scheduled job can branch on it without
|
|
414
|
+
parsing the output. The table names the probe mode, interval, timeout and any DSCP or source binding. `--baseline`
|
|
415
|
+
diffs against a session saved in the window (**⋯ → Save session…**), which turns "what does this path look like" into
|
|
416
|
+
"is it worse than it was":
|
|
417
|
+
|
|
418
|
+
```
|
|
419
|
+
example.net: now vs last-week
|
|
420
|
+
route 3 -> 4 hops; 1 hop rerouted; 1 worse
|
|
421
|
+
Hop Address Loss% +/- Avg ms +/- Verdict
|
|
422
|
+
--------------------------------------------------------------------------
|
|
423
|
+
1 192.168.1.1 0.0 +0.0 1.2 +0.0 same
|
|
424
|
+
2 203.0.113.14 0.0 +0.0 18.4 +16.9 worse
|
|
425
|
+
3 203.0.113.71 12.5 9.7 rerouted 203.0.113.9 -> 203.0.113.71
|
|
426
|
+
4 198.51.100.20 0.0 9.9 new
|
|
427
|
+
```
|
|
428
|
+
|
|
429
|
+
## Platform
|
|
430
|
+
|
|
431
|
+
**Windows 10 and 11: tested**, and the only platform with a download. The ICMP backend (`icmp.py`) uses the Win32
|
|
432
|
+
IP Helper API, so it needs no admin rights and no capture driver.
|
|
433
|
+
|
|
434
|
+
**Linux: tested in CI** (see [Linux](https://github.com/jamesccupps/PingerPlot/blob/v1.6.0/README.md#linux) for installing it). **macOS: implemented, untested on a Mac.** Both run
|
|
435
|
+
from source. `icmp_posix.py` uses
|
|
436
|
+
unprivileged `SOCK_DGRAM`/`IPPROTO_ICMP` sockets, the same technique `mtr` uses, and `icmp.ping()` dispatches to it,
|
|
437
|
+
so the engine, window and headless runner don't know which backend answered.
|
|
438
|
+
|
|
439
|
+
A traceroute on POSIX takes two mechanisms where Windows takes one. The echo reply arrives on the socket; the
|
|
440
|
+
router's "TTL exceeded" does **not**, because on Linux it's an *error* about the datagram we sent rather than a
|
|
441
|
+
message addressed to us, and it goes to the socket's error queue (`IP_RECVERR` + `recvmsg(MSG_ERRQUEUE)`). macOS
|
|
442
|
+
has neither and delivers it as an ordinary readable message. Both paths are implemented.
|
|
443
|
+
|
|
444
|
+
On Linux each reply is timed by the kernel (`SO_TIMESTAMPNS` on the echo reply and on the error-queue message), not
|
|
445
|
+
by Python reading the clock after `recv` returns: a probe thread has to win the GIL back first, so anything else
|
|
446
|
+
busy in the process (a Timeline redraw holds it for tens of milliseconds) would otherwise be reported as network
|
|
447
|
+
latency and feed the alerts and MOS. macOS, and the TCP/UDP modes everywhere, still time in user space. macOS also
|
|
448
|
+
makes no promise that a socket only sees replies to its own echoes, so every reply is matched to its probe by
|
|
449
|
+
sequence number (and a router's error by the echo header it quotes back).
|
|
450
|
+
|
|
451
|
+
On Linux the unprivileged socket is gated by a sysctl. If PingerPlot reports the backend unavailable, it names
|
|
452
|
+
this:
|
|
453
|
+
|
|
454
|
+
```bash
|
|
455
|
+
sudo sysctl -w net.ipv4.ping_group_range="0 2147483647"
|
|
456
|
+
```
|
|
457
|
+
|
|
458
|
+
Honest status: packet building, error-queue decoding, reply matching and status mapping are unit-tested on every
|
|
459
|
+
platform. On the Linux CI runners the live socket path runs on every push (echo replies from loopback, a TTL-1 probe
|
|
460
|
+
answered by the runner's real first hop, and the kernel-timestamp timing under a busy Python thread), and CI fails
|
|
461
|
+
if those tests would skip. An external review for 1.3.3 reported a correct trace, and correct reroute detection,
|
|
462
|
+
across a four-router network-namespace lab. It hasn't yet run across a long real-world path on physical hardware,
|
|
463
|
+
and nothing has run on macOS. Smoke-test it before trusting a trace:
|
|
464
|
+
|
|
465
|
+
```bash
|
|
466
|
+
python -m pingerplot.selftest 8.8.8.8
|
|
467
|
+
```
|
|
468
|
+
|
|
469
|
+
Bug reports from a real Linux or macOS box are very welcome.
|
|
470
|
+
|
|
471
|
+
## Running from source
|
|
472
|
+
|
|
473
|
+
| | |
|
|
474
|
+
|---|---|
|
|
475
|
+
| `PingerPlot.vbs` | Double-click launch, no console window. |
|
|
476
|
+
| `Setup.cmd` | A menu: launch, launch elevated, make shortcuts, remove the old elevated logon task, status. |
|
|
477
|
+
| `python main.py` | From a terminal, which stays open to show errors. |
|
|
478
|
+
|
|
479
|
+
```powershell
|
|
480
|
+
.\launch.ps1 -CreateShortcuts # Desktop and Start menu shortcuts
|
|
481
|
+
.\launch.ps1 -Elevated # start it as administrator (UAC asks), for full TCP/UDP traceroute
|
|
482
|
+
.\launch.ps1 -UninstallAutostart # remove the elevated logon task an older copy set up
|
|
483
|
+
.\launch.ps1 -Status
|
|
484
|
+
```
|
|
485
|
+
|
|
486
|
+
The app's own **Start with Windows** starts it unelevated at sign-in, which is all ICMP and TCP to the destination
|
|
487
|
+
need. For full TCP/UDP traceroute, start it elevated when you need it: `-Elevated`, or right-click a shortcut and
|
|
488
|
+
choose **Run as administrator**. Both run the Python the `py` launcher resolves to now, found unelevated, with `-E -s`
|
|
489
|
+
(so a per-user `PYTHONPATH` and user site-packages don't run elevated), and the UAC prompt names that Python. An
|
|
490
|
+
elevated copy takes no log path from `settings.json`, which any program running as you can edit; set one in that
|
|
491
|
+
session if you want the probes logged.
|
|
492
|
+
|
|
493
|
+
> **The elevated logon task (`-InstallAutostart`) is retired** as of 1.4.3. It started PingerPlot as administrator at
|
|
494
|
+
> every sign-in with no prompt, and a program running unelevated as you could steer it: register a Python under
|
|
495
|
+
> HKCU for the `py` launcher to pick, or edit `settings.json` so the elevated app wrote files where it chose. If an
|
|
496
|
+
> older copy set one up, `.\launch.ps1 -UninstallAutostart` (or Setup.cmd option 4) removes it.
|
|
497
|
+
|
|
498
|
+
`pip install .` also registers `pingerplot` and `pingerplot-headless` commands.
|
|
499
|
+
|
|
500
|
+
## Troubleshooting
|
|
501
|
+
|
|
502
|
+
| What you see | Fix |
|
|
503
|
+
|---|---|
|
|
504
|
+
| Loss at a hop in the middle | Usually normal: that router rate-limits the replies it generates. Only loss that reaches the destination row is a problem. |
|
|
505
|
+
| "Full TCP/UDP traceroute needs Administrator" | Click **Restart as administrator** beside it (or ⋯ → Restart as administrator), or use ICMP, or TCP with **Destination only**. From source, `launch.ps1 -Elevated`. |
|
|
506
|
+
| "Full TCP/UDP traceroute is Windows-only for now" (Linux, macOS) | Use ICMP, or TCP with **Destination only**. |
|
|
507
|
+
| "PingerPlot's window needs Tk" (Linux) | Install the package it names for your distribution (see [Linux](https://github.com/jamesccupps/PingerPlot/blob/v1.6.0/README.md#linux)). |
|
|
508
|
+
| A target shows "Cannot resolve" | DNS for that name failed. The window doesn't retry by itself: **⋯ → Start** on its card once the network is up. (The headless runner retries.) |
|
|
509
|
+
| No notification for an alert | **Settings → Show a notification for alerts**, then Windows' *Settings → System → Notifications* for PingerPlot, and Do not disturb. |
|
|
510
|
+
| The window is gone | It's in the notification area: click the tray icon. Starting PingerPlot again also brings it back. |
|
|
511
|
+
| "Windows protected your PC" | **More info** should show the publisher, James Cupps, then **Run anyway**. |
|
|
512
|
+
| "The probe log couldn't roll over" in Events | The CSV is open in another program, usually Excel. It keeps appending and tries again a minute later. |
|
|
513
|
+
| The update didn't install | Details are in `update.log` in the settings folder. The previous version keeps running; the release page always has the full installer. |
|
|
514
|
+
| "ICMP backend unavailable" on Linux | `sudo sysctl -w net.ipv4.ping_group_range="0 2147483647"` (see [Platform](https://github.com/jamesccupps/PingerPlot/blob/v1.6.0/README.md#platform)). |
|
|
515
|
+
|
|
516
|
+
## Uninstalling
|
|
517
|
+
|
|
518
|
+
- **Installed:** quit PingerPlot (right-click its icon in the notification area → **Quit**), then **Settings → Apps →
|
|
519
|
+
Installed apps → PingerPlot → Uninstall**. That removes the program, its shortcuts and its Start with Windows
|
|
520
|
+
entry. Your settings and history stay in `%APPDATA%\PingerPlot`, so a reinstall picks up your targets; delete that folder if
|
|
521
|
+
you don't need them.
|
|
522
|
+
- **Portable:** turn off **Start with Windows** in Settings *first*, then quit and delete the folder. The folder holds
|
|
523
|
+
the settings too. Start with Windows is a registry entry, not a file in the folder, so deleting the folder first
|
|
524
|
+
leaves Windows trying to start a missing program at every sign-in. If that happened, delete the `PingerPlot` value
|
|
525
|
+
under `HKCU\Software\Microsoft\Windows\CurrentVersion\Run`.
|
|
526
|
+
- **Scoop:** turn off **Start with Windows** first, then `scoop uninstall pingerplot`. Your settings stay in
|
|
527
|
+
`%APPDATA%\PingerPlot`.
|
|
528
|
+
- **From source:** turn off Start with Windows, then delete the clone and `%APPDATA%\PingerPlot`. If an older copy set
|
|
529
|
+
up the elevated logon task, `.\launch.ps1 -UninstallAutostart` removes it.
|
|
530
|
+
- **Linux:** turn off **Show in the applications menu** and **Start when you sign in** in Settings (that removes both
|
|
531
|
+
`.desktop` files), then `pipx uninstall pingerplot`. Delete `~/.config/PingerPlot` (settings) and
|
|
532
|
+
`~/.cache/PingerPlot` (the icon) if you don't need them.
|
|
533
|
+
|
|
534
|
+
A download that was interrupted can leave a `PingerPlot-update-<version>` folder in `%TEMP%`. The next update removes
|
|
535
|
+
it, or delete it yourself.
|
|
536
|
+
|
|
537
|
+
## How it works
|
|
538
|
+
|
|
539
|
+
Route discovery walks the IP TTL upward and reads the "TTL exceeded" replies, the standard traceroute primitive.
|
|
540
|
+
On Windows, ICMP is sent through the IP Helper API (`IcmpSendEcho` in `iphlpapi.dll`, `IcmpSendEcho2Ex` with a
|
|
541
|
+
source address) via `ctypes`. That API runs in user space, so unlike raw-socket tools it needs **no administrator
|
|
542
|
+
rights and no packet-capture driver**. The TTL is set per probe through `IP_OPTION_INFORMATION`, and a router that
|
|
543
|
+
drops the packet answers with `IP_TTL_EXPIRED_TRANSIT` and its own address: that's the whole trick.
|
|
544
|
+
|
|
545
|
+
Each round probes every hop at once on a small thread pool, so a round takes about one timeout rather than the sum.
|
|
546
|
+
Statistics are kept per TTL in a ring buffer; the window reads immutable snapshots every 700 ms and redraws a
|
|
547
|
+
graph only when its data changed. Every round is a full traceroute, so a hop whose responding address changes is a
|
|
548
|
+
reroute, and a path that grows or shrinks is seen within a round. MOS is a simplified ITU-T G.107 E-model from the
|
|
549
|
+
destination's latency, jitter and loss. IPv4 only.
|
|
550
|
+
|
|
551
|
+
## Building and development
|
|
552
|
+
|
|
553
|
+
```
|
|
554
|
+
python -m pytest # ~40 s, offline; the GUI too (xvfb-run -a on Linux)
|
|
555
|
+
python scripts/demo.py # the real app against a pretend network
|
|
556
|
+
python -m pip install --require-hashes --only-binary=:all: -r packaging/requirements-build.txt
|
|
557
|
+
python packaging/build_windows.py # dist\: the program folder, the zip, and with Inno Setup 6 the installer
|
|
558
|
+
```
|
|
559
|
+
|
|
560
|
+
The pure logic (statistics, address encoding, status handling, MOS, the alert state machine, ICMP error decoding,
|
|
561
|
+
baseline comparison) is covered on every platform; the Win32 calls are guarded behind `sys.platform`. The TCP/UDP
|
|
562
|
+
round loops run against a mock router (`tests/mock_router.py`): a loopback socket standing in for the capture
|
|
563
|
+
socket, fed router-shaped ICMP errors, so `select()`, `recvfrom()` and the timeouts are the real code paths. The
|
|
564
|
+
window is tested against the real `App`, with `%APPDATA%` redirected first so a test can never touch a real target
|
|
565
|
+
list. The updater is tested against releases in a temporary folder, its Ed25519 code against RFC 8032's vectors.
|
|
566
|
+
|
|
567
|
+
CI runs the suite on Windows and Linux for Python 3.10 to 3.13 (on Linux a live POSIX test that would skip is a
|
|
568
|
+
failure), then builds the Windows release files, runs the built app's self-test, installs, self-tests and uninstalls
|
|
569
|
+
the installer, and has a copy update itself to the build. A version tag (`v1.4.0`) builds, tests, signs and
|
|
570
|
+
publishes the release. The release workflow's build job is read-only, only a job that installs nothing holds the
|
|
571
|
+
signing key, and only one that runs nothing but `gh` can publish; every action is pinned by commit SHA and the
|
|
572
|
+
build tools by hash, all enforced by tests. [CLAUDE.md](https://github.com/jamesccupps/PingerPlot/blob/v1.6.0/CLAUDE.md) has the architecture, the release process and
|
|
573
|
+
what was learned along the way; [ROADMAP.md](https://github.com/jamesccupps/PingerPlot/blob/v1.6.0/ROADMAP.md) what's planned; [CONTRIBUTING.md](https://github.com/jamesccupps/PingerPlot/blob/v1.6.0/CONTRIBUTING.md) how to
|
|
574
|
+
help.
|
|
575
|
+
|
|
576
|
+
## License
|
|
577
|
+
|
|
578
|
+
MIT: see [LICENSE](https://github.com/jamesccupps/PingerPlot/blob/v1.6.0/LICENSE). The libraries inside the Windows build are listed, with their licenses, in
|
|
579
|
+
[THIRD-PARTY-NOTICES.md](https://github.com/jamesccupps/PingerPlot/blob/v1.6.0/THIRD-PARTY-NOTICES.md).
|
|
580
|
+
|
|
581
|
+
PingerPlot is an independent hobby project, not affiliated with or endorsed by any commercial network-monitoring
|
|
582
|
+
product. It is a **read-only diagnostic**: it sends probes and reads replies, and never writes to or reconfigures
|
|
583
|
+
anything on the network.
|
|
@@ -0,0 +1,45 @@
|
|
|
1
|
+
pingerplot/__init__.py,sha256=uVzAzRPKTDMrOv6XqIkBn1I-CooptVAGSuDy88O0JvE,325
|
|
2
|
+
pingerplot/__main__.py,sha256=JEOqjDtkst-n1KDh-Bab_3PEuyAbMB1I0Y-mhVlUiRY,133
|
|
3
|
+
pingerplot/appicon.py,sha256=d4berZ1IGkfFwPKYSRxvDYTZxnT5k2mH6AwG4axMhOA,5930
|
|
4
|
+
pingerplot/compare.py,sha256=vGAh0gc9OayKaP9YWfPK_zjl7l6t4KNVAsAJgsISt9Y,9729
|
|
5
|
+
pingerplot/ed25519.py,sha256=utsVKHuuwf0tM_L8X6BUZGZXfT2aJxRg21NmJ6ZaxRg,4791
|
|
6
|
+
pingerplot/geoip.py,sha256=xV7hnVBU_ovPIDmYkqvjNVDCqnmOBMLfOnZj5bKM0k4,14325
|
|
7
|
+
pingerplot/gfx.py,sha256=rpe1x5_EGeKrO6RWBNSHweCMp4foNlYDlGXyihuiA90,6800
|
|
8
|
+
pingerplot/gui.py,sha256=vxiE0ReST7WbIbCKXt42TV6IMJHOmBrojB0KbuXaaeI,87256
|
|
9
|
+
pingerplot/gui_charts.py,sha256=BvgwzqW0-VTfTM2E1zgno_j-A4ZqT4NpZs-FxTFVIQY,17361
|
|
10
|
+
pingerplot/gui_history.py,sha256=c_mz_S5P1ZjNUOql0ayhMYIhtu3M6L3s0_7zMK6lniI,32250
|
|
11
|
+
pingerplot/gui_hopinfo.py,sha256=2IqGpXFwIz6c4xtTEO_gH3SETg1t6XuwWpBK3foCL_o,6004
|
|
12
|
+
pingerplot/gui_recording.py,sha256=11vfcghj0HJlFEgVAH0kQpnN5XZDb-PE7iJ5DxHV9Fc,7160
|
|
13
|
+
pingerplot/gui_settings.py,sha256=i4AxsBkLAlIeRKvGxFuKngzdNv_8DZD13ytzvNY4hBo,15511
|
|
14
|
+
pingerplot/gui_updates.py,sha256=FKi8vf61rzPIiEH4mCKf3LrJbc8uIPRUa9Tf-JFNO-c,12089
|
|
15
|
+
pingerplot/gui_widgets.py,sha256=V6MS9RZkrNCaxmvffxIqlpMOMX2iE-3nTTeHc-KTjcI,10851
|
|
16
|
+
pingerplot/headless.py,sha256=5JM0-ZZtkRPzPR6l0FMeuKojuA4OlXzKojcST_urZJk,28537
|
|
17
|
+
pingerplot/history.py,sha256=lpUBS3ci1Y-3D6q7pgGTERdSs6x55womw43RyCrAfe4,37696
|
|
18
|
+
pingerplot/icmp.py,sha256=jp3Dfj64CYGRw391bkbycJqInspn_qXvOgzIYMIj49I,11442
|
|
19
|
+
pingerplot/icmp_posix.py,sha256=R63jprscRHeD8qbkmHO23C42-9qUHLqsRpd-aDtbwS0,19054
|
|
20
|
+
pingerplot/investigate.py,sha256=qcZbp8c5qmyMXE8wORTMkjHFOHsErRXTvT5Hp1szkUg,8557
|
|
21
|
+
pingerplot/launch.py,sha256=uX3AjqMKX-JOEumkEN5_YI1AYuydILhBg2_J59e-LXA,1368
|
|
22
|
+
pingerplot/locating.py,sha256=2Y8uMrWgfjZ8Jc_u4Z7xc56RviDMQPwiutsoDMvKbLs,11041
|
|
23
|
+
pingerplot/model.py,sha256=vHIx89cNP7MU0ZB5HHYDZ92RAJCLh1CLh-xgeeOPCUw,16136
|
|
24
|
+
pingerplot/monitor.py,sha256=RUJVouJm-gA9XdAqK64sh90e6hNqWIH_3OQjH2h8LfE,66303
|
|
25
|
+
pingerplot/places.py,sha256=POMZiGmPGvX-eXZPoIYgOReR8wHekVLHmuodw0Wb4ck,16551
|
|
26
|
+
pingerplot/routes.py,sha256=Y02IvDqFeWm1v_KuHL4ywWGKwuLd-hUpRNt63QBLeGM,5049
|
|
27
|
+
pingerplot/selfcheck.py,sha256=Tv4Oq2EIRbcZ6OZOCWqMS_-CPJqcMNvJloRLq0Ce0r0,3712
|
|
28
|
+
pingerplot/selftest.py,sha256=NPF7GCWSoJhuvf0E7ElufgEb6pYZ_KmXYt9hThCkEPQ,2367
|
|
29
|
+
pingerplot/settings.py,sha256=OUr6bkSFaInHSV7X1zw3KB9LEz-6QfPECBks0idAHOI,3639
|
|
30
|
+
pingerplot/tcpudp.py,sha256=eQuVVgugVLiV8Z7wlIMM-xaarodrQR0fj5JceM0QK3A,20022
|
|
31
|
+
pingerplot/theme.py,sha256=HOyVPT_giQJ9TdH3kLTw5n2m3v6NNKjdyESH0oiSOm0,30578
|
|
32
|
+
pingerplot/tkthreads.py,sha256=hofouS_iEbJM2QnuxfSLQtV31aBvBXcY8QHMOgsT5rg,2392
|
|
33
|
+
pingerplot/tray.py,sha256=Ja5Sro60_SRIelm0fQxBg7nCHrXZ4tyHnM2u25bhk7g,16329
|
|
34
|
+
pingerplot/trouble.py,sha256=qxGv1Etp2pY3fDXpkR-2nWhJmHge_wcOuWARGKqGrns,5506
|
|
35
|
+
pingerplot/update_key.py,sha256=wUF_Amv_MPnJ0oEXck_4t3Qa2P6vXXsFJI0P11-4Q_c,348
|
|
36
|
+
pingerplot/updater.py,sha256=2Yemnwf6mc0cNagiIjJY74WWydfme6Se4vfVMqnxPP4,20161
|
|
37
|
+
pingerplot/winplatform.py,sha256=Y4Cf4QAutH1REUq0zh5PdZC89x1lfqCyaQFXRZPgdQ0,14636
|
|
38
|
+
pingerplot/worldmap.py,sha256=wwoiHL1owcogemNPg-zFIPSqR81QNP5eEEUnKGG2w68,67857
|
|
39
|
+
pingerplot/xdg.py,sha256=fxMZVwcBv5WNplDbkdEJXOZgUBccn4aEFOTDZY9RBCU,6977
|
|
40
|
+
pingerplot-1.6.0.dist-info/licenses/LICENSE,sha256=oKzyQnO0wb497L_sJtdicwAo9y-kHVvnjX1YpegkPjU,1068
|
|
41
|
+
pingerplot-1.6.0.dist-info/METADATA,sha256=-lhL7Lk7qHZSOAl5s1DhHOLojZDn5_x2IKNPOXjdvb0,40449
|
|
42
|
+
pingerplot-1.6.0.dist-info/WHEEL,sha256=mOdXR9C3wMVov7cSY8PY-XCzo3SmmWCHvGQr5csJoao,91
|
|
43
|
+
pingerplot-1.6.0.dist-info/entry_points.txt,sha256=rjnWPTAUYrB20z5FZ9Jglf8NGRtvUq0gBhIGgKmlgr0,116
|
|
44
|
+
pingerplot-1.6.0.dist-info/top_level.txt,sha256=oBKqZLM3o421eC2q8FSIHN9jCmI2h1g_URoLS_YTax0,11
|
|
45
|
+
pingerplot-1.6.0.dist-info/RECORD,,
|