pgalign 1.1.0__py3-none-any.whl
This diff represents the content of publicly available package versions that have been released to one of the supported registries. The information contained in this diff is provided for informational purposes only and reflects changes between package versions as they appear in their respective public registries.
- pgalign/AnnDataMALDI.py +476 -0
- pgalign/PeakCalling.py +282 -0
- pgalign/__init__.py +87 -0
- pgalign/cli.py +84 -0
- pgalign/data/mouse_pancreas_toy.npz +0 -0
- pgalign/datasets.py +39 -0
- pgalign/pipeline.py +153 -0
- pgalign/readers.py +130 -0
- pgalign/util.py +135 -0
- pgalign-1.1.0.dist-info/METADATA +318 -0
- pgalign-1.1.0.dist-info/RECORD +15 -0
- pgalign-1.1.0.dist-info/WHEEL +5 -0
- pgalign-1.1.0.dist-info/entry_points.txt +2 -0
- pgalign-1.1.0.dist-info/licenses/LICENSE +21 -0
- pgalign-1.1.0.dist-info/top_level.txt +1 -0
pgalign/readers.py
ADDED
|
@@ -0,0 +1,130 @@
|
|
|
1
|
+
"""Readers that turn MSI exports into AnnData objects for :func:`pgalign.align`, and .h5ad I/O."""
|
|
2
|
+
|
|
3
|
+
import math
|
|
4
|
+
|
|
5
|
+
import numpy as np
|
|
6
|
+
import pandas as pd
|
|
7
|
+
import scanpy as sc
|
|
8
|
+
|
|
9
|
+
from .util import gridding
|
|
10
|
+
|
|
11
|
+
|
|
12
|
+
def read_imzml(path, increment=None, mz_range=None, epsilon=0.025):
|
|
13
|
+
"""Read an imzML file into an AnnData that ``pg.align`` accepts.
|
|
14
|
+
|
|
15
|
+
In continuous mode every spectrum shares one m/z axis, which is used as it is.
|
|
16
|
+
In processed mode each spectrum carries its own m/z values, so ``increment`` is
|
|
17
|
+
required and every spectrum is put on a common grid with ``gridding``
|
|
18
|
+
(Nadaraya-Watson smoothing with bandwidth ``epsilon``), as the manuscript's
|
|
19
|
+
simulation study did with ``increment=0.25``. Passing ``increment`` grids the
|
|
20
|
+
spectra in either mode. Requires pyimzML: ``pip install "pgalign[imzml]"``.
|
|
21
|
+
|
|
22
|
+
:param path: the ``.imzML`` file; its ``.ibd`` file must sit beside it.
|
|
23
|
+
:param increment: grid spacing in m/z. Required when the spectra do not share
|
|
24
|
+
one m/z axis.
|
|
25
|
+
:param mz_range: ``(start, end)`` of the grid, end excluded. Defaults to one
|
|
26
|
+
below the floor of the smallest m/z in the file and one above the ceiling
|
|
27
|
+
of the largest, as in ``gridding``.
|
|
28
|
+
:param epsilon: bandwidth of the gridding kernel. Defaults to 0.025.
|
|
29
|
+
:return: an ``anndata.AnnData`` with the m/z values in ``var["m/z"]`` and the
|
|
30
|
+
pixel coordinates in ``obs`` (``x``, ``y``, ``z``).
|
|
31
|
+
"""
|
|
32
|
+
try:
|
|
33
|
+
from pyimzml.ImzMLParser import ImzMLParser
|
|
34
|
+
except ImportError as err:
|
|
35
|
+
raise ImportError('read_imzml needs pyimzML: pip install "pgalign[imzml]"') from err
|
|
36
|
+
parser = ImzMLParser(path)
|
|
37
|
+
spectra = [parser.getspectrum(i) for i in range(len(parser.coordinates))]
|
|
38
|
+
if increment is None:
|
|
39
|
+
mz = np.asarray(spectra[0][0], dtype=float)
|
|
40
|
+
if not all(np.array_equal(mzs, mz) for mzs, _ in spectra):
|
|
41
|
+
raise ValueError(
|
|
42
|
+
f"the spectra in {path} do not share one m/z axis (processed imzML); "
|
|
43
|
+
"pass increment= to grid them, for example increment=0.25 as in the "
|
|
44
|
+
"manuscript's simulation study"
|
|
45
|
+
)
|
|
46
|
+
X = np.vstack([np.asarray(intensities, dtype=float) for _, intensities in spectra])
|
|
47
|
+
else:
|
|
48
|
+
observed = [mzs for mzs, _ in spectra if len(mzs)]
|
|
49
|
+
lo, hi = min(m.min() for m in observed), max(m.max() for m in observed)
|
|
50
|
+
if mz_range is None:
|
|
51
|
+
mz_range = (math.floor(lo) - 1, math.ceil(hi) + 1)
|
|
52
|
+
elif mz_range[0] > hi or mz_range[1] <= lo:
|
|
53
|
+
raise ValueError(
|
|
54
|
+
f"no m/z value in {path} falls inside mz_range {tuple(mz_range)}; "
|
|
55
|
+
f"the file covers {lo:g} to {hi:g}"
|
|
56
|
+
)
|
|
57
|
+
grids = [gridding(np.asarray(mzs, dtype=float), np.asarray(intensities, dtype=float),
|
|
58
|
+
start=mz_range[0], end=mz_range[1], increment=increment, epsilon=epsilon)
|
|
59
|
+
for mzs, intensities in spectra]
|
|
60
|
+
mz = grids[0][0]
|
|
61
|
+
X = np.vstack([grid[1] for grid in grids])
|
|
62
|
+
var = pd.DataFrame({"m/z": mz}, index=[str(v) for v in mz])
|
|
63
|
+
obs = pd.DataFrame(np.asarray(parser.coordinates)[:, :3], columns=["x", "y", "z"],
|
|
64
|
+
index=[f"s{i}" for i in range(len(spectra))])
|
|
65
|
+
return sc.AnnData(X=X, var=var, obs=obs)
|
|
66
|
+
|
|
67
|
+
|
|
68
|
+
def write_h5ad(adata, path):
|
|
69
|
+
"""Write an AnnData to ``.h5ad``, storing ``var["m/z"]`` as ``var["mz"]``.
|
|
70
|
+
|
|
71
|
+
anndata 0.13 refuses to write a column whose name contains a slash, so the m/z
|
|
72
|
+
values are stored under ``mz``; :func:`read_h5ad` restores them. The object
|
|
73
|
+
passed in is not modified, and its data are written without being copied.
|
|
74
|
+
|
|
75
|
+
:param adata: the ``anndata.AnnData`` to write, for example ``res.aligned``.
|
|
76
|
+
:param path: the ``.h5ad`` file to write.
|
|
77
|
+
"""
|
|
78
|
+
if "m/z" in adata.var.columns and "mz" in adata.var.columns:
|
|
79
|
+
raise ValueError("var has both an 'm/z' and an 'mz' column; drop one before writing")
|
|
80
|
+
out = sc.AnnData(
|
|
81
|
+
X=adata.X, obs=adata.obs, var=adata.var.rename(columns={"m/z": "mz"}),
|
|
82
|
+
uns=dict(adata.uns), obsm=dict(adata.obsm), varm=dict(adata.varm),
|
|
83
|
+
layers=dict(adata.layers), obsp=dict(adata.obsp), varp=dict(adata.varp),
|
|
84
|
+
)
|
|
85
|
+
out.write_h5ad(path)
|
|
86
|
+
|
|
87
|
+
|
|
88
|
+
def read_h5ad(path):
|
|
89
|
+
"""Read an ``.h5ad`` file written by :func:`write_h5ad` or by older anndata.
|
|
90
|
+
|
|
91
|
+
Restores ``var["mz"]`` to ``var["m/z"]`` when the file has no ``m/z`` column;
|
|
92
|
+
files that store ``m/z`` itself are read as they are.
|
|
93
|
+
|
|
94
|
+
:param path: the ``.h5ad`` file to read.
|
|
95
|
+
:return: an ``anndata.AnnData`` with the m/z values in ``var["m/z"]``.
|
|
96
|
+
"""
|
|
97
|
+
adata = sc.read_h5ad(path)
|
|
98
|
+
if "m/z" not in adata.var.columns and "mz" in adata.var.columns:
|
|
99
|
+
adata.var = adata.var.rename(columns={"mz": "m/z"})
|
|
100
|
+
return adata
|
|
101
|
+
|
|
102
|
+
|
|
103
|
+
def read_scils_csv(spectra_csv, spots_csv=None, sep=";"):
|
|
104
|
+
"""Read a SCiLS Lab CSV export into an AnnData that ``pg.align`` accepts.
|
|
105
|
+
|
|
106
|
+
The spectra file holds one row per spot: the spot name in the first column,
|
|
107
|
+
then one intensity column per m/z value, with the m/z values as the column
|
|
108
|
+
headers. The optional spots file (``Region Spots.csv``) holds one row per spot,
|
|
109
|
+
in the same order, with its index and x and y coordinates; its columns are
|
|
110
|
+
copied into ``obs`` unchanged.
|
|
111
|
+
|
|
112
|
+
:param spectra_csv: path of the spectra export (``... - All Spectra.csv``).
|
|
113
|
+
:param spots_csv: path of the spot coordinates (``... - Region Spots.csv``).
|
|
114
|
+
:param sep: the field separator. Defaults to ``";"``, as SCiLS writes it.
|
|
115
|
+
:return: an ``anndata.AnnData`` with the m/z values in ``var["m/z"]``.
|
|
116
|
+
"""
|
|
117
|
+
spectra = pd.read_csv(spectra_csv, sep=sep)
|
|
118
|
+
labels = list(spectra.columns[1:])
|
|
119
|
+
var = pd.DataFrame({"m/z": np.asarray(labels, dtype=float)}, index=labels)
|
|
120
|
+
obs = pd.DataFrame(index=spectra.iloc[:, 0].astype(str).to_numpy())
|
|
121
|
+
if spots_csv is not None:
|
|
122
|
+
spots = pd.read_csv(spots_csv, sep=sep)
|
|
123
|
+
if len(spots) != len(spectra):
|
|
124
|
+
raise ValueError(
|
|
125
|
+
f"{spots_csv} has {len(spots)} spots but {spectra_csv} has {len(spectra)} spectra"
|
|
126
|
+
)
|
|
127
|
+
for column in spots.columns:
|
|
128
|
+
obs[column] = spots[column].to_numpy()
|
|
129
|
+
X = spectra.iloc[:, 1:].to_numpy(dtype=float)
|
|
130
|
+
return sc.AnnData(X=X, var=var, obs=obs)
|
pgalign/util.py
ADDED
|
@@ -0,0 +1,135 @@
|
|
|
1
|
+
"""Utility helpers used by PGAlign's peak-calling and alignment routines."""
|
|
2
|
+
|
|
3
|
+
import logging
|
|
4
|
+
import math
|
|
5
|
+
|
|
6
|
+
import numpy as np
|
|
7
|
+
import pandas as pd
|
|
8
|
+
import scanpy as sc
|
|
9
|
+
|
|
10
|
+
logger = logging.getLogger(__name__)
|
|
11
|
+
|
|
12
|
+
|
|
13
|
+
def prefilter_cells(adata, min_counts=None, max_counts=None, min_genes=200, max_genes=None):
|
|
14
|
+
if min_genes is None and min_counts is None and max_genes is None and max_counts is None:
|
|
15
|
+
raise ValueError('Provide one of min_counts, min_genes, max_counts or max_genes.')
|
|
16
|
+
id_tmp = np.asarray([True] * adata.shape[0], dtype=bool)
|
|
17
|
+
id_tmp = np.logical_and(id_tmp, sc.pp.filter_cells(adata.X, min_genes=min_genes)[0]) if min_genes is not None else id_tmp
|
|
18
|
+
id_tmp = np.logical_and(id_tmp, sc.pp.filter_cells(adata.X, max_genes=max_genes)[0]) if max_genes is not None else id_tmp
|
|
19
|
+
id_tmp = np.logical_and(id_tmp, sc.pp.filter_cells(adata.X, min_counts=min_counts)[0]) if min_counts is not None else id_tmp
|
|
20
|
+
id_tmp = np.logical_and(id_tmp, sc.pp.filter_cells(adata.X, max_counts=max_counts)[0]) if max_counts is not None else id_tmp
|
|
21
|
+
adata._inplace_subset_obs(id_tmp)
|
|
22
|
+
adata.raw = sc.pp.log1p(adata, copy=True)
|
|
23
|
+
logger.debug("adata.raw.var_names.is_unique = %s", adata.raw.var_names.is_unique)
|
|
24
|
+
|
|
25
|
+
|
|
26
|
+
def prefilter_genes(adata, min_counts=None, max_counts=None, min_cells=10, max_cells=None):
|
|
27
|
+
if min_cells is None and min_counts is None and max_cells is None and max_counts is None:
|
|
28
|
+
raise ValueError('Provide one of min_counts, min_genes, max_counts or max_genes.')
|
|
29
|
+
id_tmp = np.asarray([True] * adata.shape[1], dtype=bool)
|
|
30
|
+
id_tmp = np.logical_and(id_tmp, sc.pp.filter_genes(adata.X, min_cells=min_cells)[0]) if min_cells is not None else id_tmp
|
|
31
|
+
id_tmp = np.logical_and(id_tmp, sc.pp.filter_genes(adata.X, max_cells=max_cells)[0]) if max_cells is not None else id_tmp
|
|
32
|
+
id_tmp = np.logical_and(id_tmp, sc.pp.filter_genes(adata.X, min_counts=min_counts)[0]) if min_counts is not None else id_tmp
|
|
33
|
+
id_tmp = np.logical_and(id_tmp, sc.pp.filter_genes(adata.X, max_counts=max_counts)[0]) if max_counts is not None else id_tmp
|
|
34
|
+
adata._inplace_subset_var(id_tmp)
|
|
35
|
+
|
|
36
|
+
|
|
37
|
+
def prefilter_specialgenes(adata, Gene1Pattern="ERCC", Gene2Pattern="MT-"):
|
|
38
|
+
id_tmp1 = np.asarray([not str(name).startswith(Gene1Pattern) for name in adata.var_names], dtype=bool)
|
|
39
|
+
id_tmp2 = np.asarray([not str(name).startswith(Gene2Pattern) for name in adata.var_names], dtype=bool)
|
|
40
|
+
id_tmp = np.logical_and(id_tmp1, id_tmp2)
|
|
41
|
+
adata._inplace_subset_var(id_tmp)
|
|
42
|
+
|
|
43
|
+
|
|
44
|
+
def save_clusterresults(cluster, filepath):
|
|
45
|
+
rangetxt = np.zeros((len(cluster), 2))
|
|
46
|
+
for i, points in enumerate(cluster):
|
|
47
|
+
rangetxt[i, 0] = points[0]
|
|
48
|
+
rangetxt[i, 1] = points[-1]
|
|
49
|
+
np.savetxt("{filepath}.csv".format(filepath=filepath), rangetxt, delimiter=",")
|
|
50
|
+
|
|
51
|
+
|
|
52
|
+
def rotate(l, n):
|
|
53
|
+
return l[n:] + l[:n]
|
|
54
|
+
|
|
55
|
+
|
|
56
|
+
def group_range(cluster):
|
|
57
|
+
lows = np.array([i[0] for i in cluster])
|
|
58
|
+
ups = np.array([i[-1] for i in cluster])
|
|
59
|
+
return [lows, ups]
|
|
60
|
+
|
|
61
|
+
|
|
62
|
+
def in_range_lookup(mzvalues, cluster, expand=True):
|
|
63
|
+
lows, ups = group_range(cluster)
|
|
64
|
+
TFlist = [np.any((lows <= x) & (x <= ups)) for x in mzvalues]
|
|
65
|
+
if expand:
|
|
66
|
+
TFlistr = rotate(TFlist, 1)
|
|
67
|
+
TFlistl = rotate(TFlist, -1)
|
|
68
|
+
newTFlist = [any((mz1, mz2, mz3)) for (mz1, mz2, mz3) in zip(TFlist, TFlistr, TFlistl)]
|
|
69
|
+
else:
|
|
70
|
+
newTFlist = TFlist
|
|
71
|
+
return newTFlist
|
|
72
|
+
|
|
73
|
+
|
|
74
|
+
def comp_clusters(TFlist, mzvalues):
|
|
75
|
+
clusters = []
|
|
76
|
+
curr_cluster = []
|
|
77
|
+
for i, curr_point in enumerate(TFlist):
|
|
78
|
+
if curr_point:
|
|
79
|
+
curr_cluster.append(mzvalues[i])
|
|
80
|
+
else:
|
|
81
|
+
if curr_cluster:
|
|
82
|
+
clusters.append(curr_cluster)
|
|
83
|
+
curr_cluster = []
|
|
84
|
+
return clusters
|
|
85
|
+
|
|
86
|
+
|
|
87
|
+
def find_nearest(array, value):
|
|
88
|
+
"""Index of the element in ``array`` closest to ``value``."""
|
|
89
|
+
nearest_idx = np.where(abs(array - value) == abs(array - value).min())[0]
|
|
90
|
+
return nearest_idx[0]
|
|
91
|
+
|
|
92
|
+
|
|
93
|
+
def get_unk_comp_clusters(ref_clusters, mzvalues):
|
|
94
|
+
clusters = []
|
|
95
|
+
mzvalues_array = np.array(mzvalues)
|
|
96
|
+
mzvalues_array_float = np.asarray(mzvalues_array, dtype=np.float64, order='C')
|
|
97
|
+
for i, curr_cluster in enumerate(ref_clusters):
|
|
98
|
+
ref_ini_point = curr_cluster[0]
|
|
99
|
+
indexnearest_unk = find_nearest(mzvalues_array_float, float(ref_ini_point))
|
|
100
|
+
if ((indexnearest_unk + len(curr_cluster)) <= len(mzvalues)):
|
|
101
|
+
clusters.append(mzvalues[range(indexnearest_unk, indexnearest_unk + len(curr_cluster))])
|
|
102
|
+
curr_cluster = []
|
|
103
|
+
return clusters
|
|
104
|
+
|
|
105
|
+
|
|
106
|
+
def spectrum_save(mz, intensity, name):
|
|
107
|
+
originaltable = pd.DataFrame(np.array(mz))
|
|
108
|
+
originaltable = originaltable.rename(columns={0: "mz"})
|
|
109
|
+
originaltable["intensity"] = intensity
|
|
110
|
+
originaltable.to_csv("{name}.csv".format(name=name))
|
|
111
|
+
|
|
112
|
+
|
|
113
|
+
def GKernal(x0, x, y, sig=1.):
|
|
114
|
+
"""Gaussian kernel smoother evaluated at ``x0``."""
|
|
115
|
+
ax = x - x0
|
|
116
|
+
Kernal = np.exp(-0.5 * np.square(ax) / np.square(sig))
|
|
117
|
+
Weighted = Kernal * y
|
|
118
|
+
return np.sum(Weighted) / np.sum(Kernal)
|
|
119
|
+
|
|
120
|
+
|
|
121
|
+
def gridding(mz, intensity, start=None, end=None, increment=0.125, epsilon=0.025):
|
|
122
|
+
"""Re-grid an irregular m/z axis onto a uniform grid with Nadaraya-Watson smoothing."""
|
|
123
|
+
if start is None:
|
|
124
|
+
start = math.floor(np.min(mz)) - 1
|
|
125
|
+
if end is None:
|
|
126
|
+
end = math.ceil(np.max(mz)) + 1
|
|
127
|
+
target_grid = np.arange(start, end, increment)
|
|
128
|
+
intensity_out = np.zeros(target_grid.shape[0])
|
|
129
|
+
for i in range(target_grid.shape[0]):
|
|
130
|
+
calculation = GKernal(target_grid[i], mz, intensity, sig=epsilon)
|
|
131
|
+
if calculation == calculation:
|
|
132
|
+
intensity_out[i] = calculation
|
|
133
|
+
else:
|
|
134
|
+
intensity_out[i] = 0
|
|
135
|
+
return [target_grid, intensity_out]
|
|
@@ -0,0 +1,318 @@
|
|
|
1
|
+
Metadata-Version: 2.4
|
|
2
|
+
Name: pgalign
|
|
3
|
+
Version: 1.1.0
|
|
4
|
+
Summary: PGAlign: peak group alignment of mass spectrometry data for imaging and spatial metabolomics.
|
|
5
|
+
Author: Anji Deng, Yuyang Zhang
|
|
6
|
+
Author-email: Qihuang Zhang <qihuang.zhang@mcgill.ca>
|
|
7
|
+
Maintainer-email: Qihuang Zhang <qihuang.zhang@mcgill.ca>
|
|
8
|
+
License-Expression: MIT
|
|
9
|
+
Project-URL: Homepage, https://stagill.github.io/PGAlign/
|
|
10
|
+
Project-URL: Documentation, https://stagill.github.io/PGAlign/
|
|
11
|
+
Project-URL: Repository, https://github.com/StaGill/PGAlign
|
|
12
|
+
Project-URL: Issues, https://github.com/StaGill/PGAlign/issues
|
|
13
|
+
Keywords: MALDI,mass spectrometry,spatial metabolomics,alignment,imaging,bioinformatics
|
|
14
|
+
Classifier: Development Status :: 4 - Beta
|
|
15
|
+
Classifier: Intended Audience :: Science/Research
|
|
16
|
+
Classifier: Operating System :: OS Independent
|
|
17
|
+
Classifier: Programming Language :: Python :: 3
|
|
18
|
+
Classifier: Programming Language :: Python :: 3.9
|
|
19
|
+
Classifier: Programming Language :: Python :: 3.10
|
|
20
|
+
Classifier: Programming Language :: Python :: 3.11
|
|
21
|
+
Classifier: Programming Language :: Python :: 3.12
|
|
22
|
+
Classifier: Programming Language :: Python :: 3.13
|
|
23
|
+
Classifier: Programming Language :: Python :: 3.14
|
|
24
|
+
Classifier: Topic :: Scientific/Engineering :: Bio-Informatics
|
|
25
|
+
Requires-Python: >=3.9
|
|
26
|
+
Description-Content-Type: text/markdown
|
|
27
|
+
License-File: LICENSE
|
|
28
|
+
Requires-Dist: numpy>=1.20
|
|
29
|
+
Requires-Dist: scipy>=1.7
|
|
30
|
+
Requires-Dist: pandas>=1.3
|
|
31
|
+
Requires-Dist: scanpy>=1.9.2
|
|
32
|
+
Requires-Dist: anndata>=0.8
|
|
33
|
+
Requires-Dist: tqdm
|
|
34
|
+
Provides-Extra: test
|
|
35
|
+
Requires-Dist: pytest>=7.0; extra == "test"
|
|
36
|
+
Provides-Extra: imzml
|
|
37
|
+
Requires-Dist: pyimzML>=1.5; extra == "imzml"
|
|
38
|
+
Dynamic: license-file
|
|
39
|
+
|
|
40
|
+
<p align="center">
|
|
41
|
+
<picture>
|
|
42
|
+
<source media="(prefers-color-scheme: dark)" srcset="https://raw.githubusercontent.com/StaGill/PGAlign/main/images/pgalign_logo_dark.svg">
|
|
43
|
+
<img src="https://raw.githubusercontent.com/StaGill/PGAlign/main/images/pgalign_logo.svg" alt="PGAlign" width="420">
|
|
44
|
+
</picture>
|
|
45
|
+
</p>
|
|
46
|
+
|
|
47
|
+
<p align="center">
|
|
48
|
+
<a href="https://github.com/StaGill/PGAlign/actions/workflows/tests.yml"><img src="https://github.com/StaGill/PGAlign/actions/workflows/tests.yml/badge.svg?branch=main" alt="tests"></a>
|
|
49
|
+
<a href="https://stagill.github.io/PGAlign/"><img src="https://github.com/StaGill/PGAlign/actions/workflows/docs.yml/badge.svg?branch=main" alt="docs"></a>
|
|
50
|
+
<a href="https://github.com/StaGill/PGAlign/releases"><img src="https://img.shields.io/github/v/release/StaGill/PGAlign" alt="release"></a>
|
|
51
|
+
<a href="https://github.com/StaGill/PGAlign/blob/main/LICENSE"><img src="https://img.shields.io/github/license/StaGill/PGAlign" alt="license"></a>
|
|
52
|
+
</p>
|
|
53
|
+
|
|
54
|
+
**PGAlign (Peak-Group Alignment of mass spectrometry data)** is a peak-group-based
|
|
55
|
+
algorithm for aligning mass spectrometry (MS) spectra onto a common m/z grid.
|
|
56
|
+
It is designed for imaging and spatial metabolomics data such as MALDI-MS,
|
|
57
|
+
where spectra from different runs or tissues often exhibit small m/z shifts
|
|
58
|
+
that prevent direct comparison.
|
|
59
|
+
|
|
60
|
+
Anji Deng, Yuyang Zhang, and Qihuang Zhang\*
|
|
61
|
+
McGill University (corresponding author: <qihuang.zhang@mcgill.ca>)
|
|
62
|
+
|
|
63
|
+
**Documentation:** <https://stagill.github.io/PGAlign/>
|
|
64
|
+
|
|
65
|
+
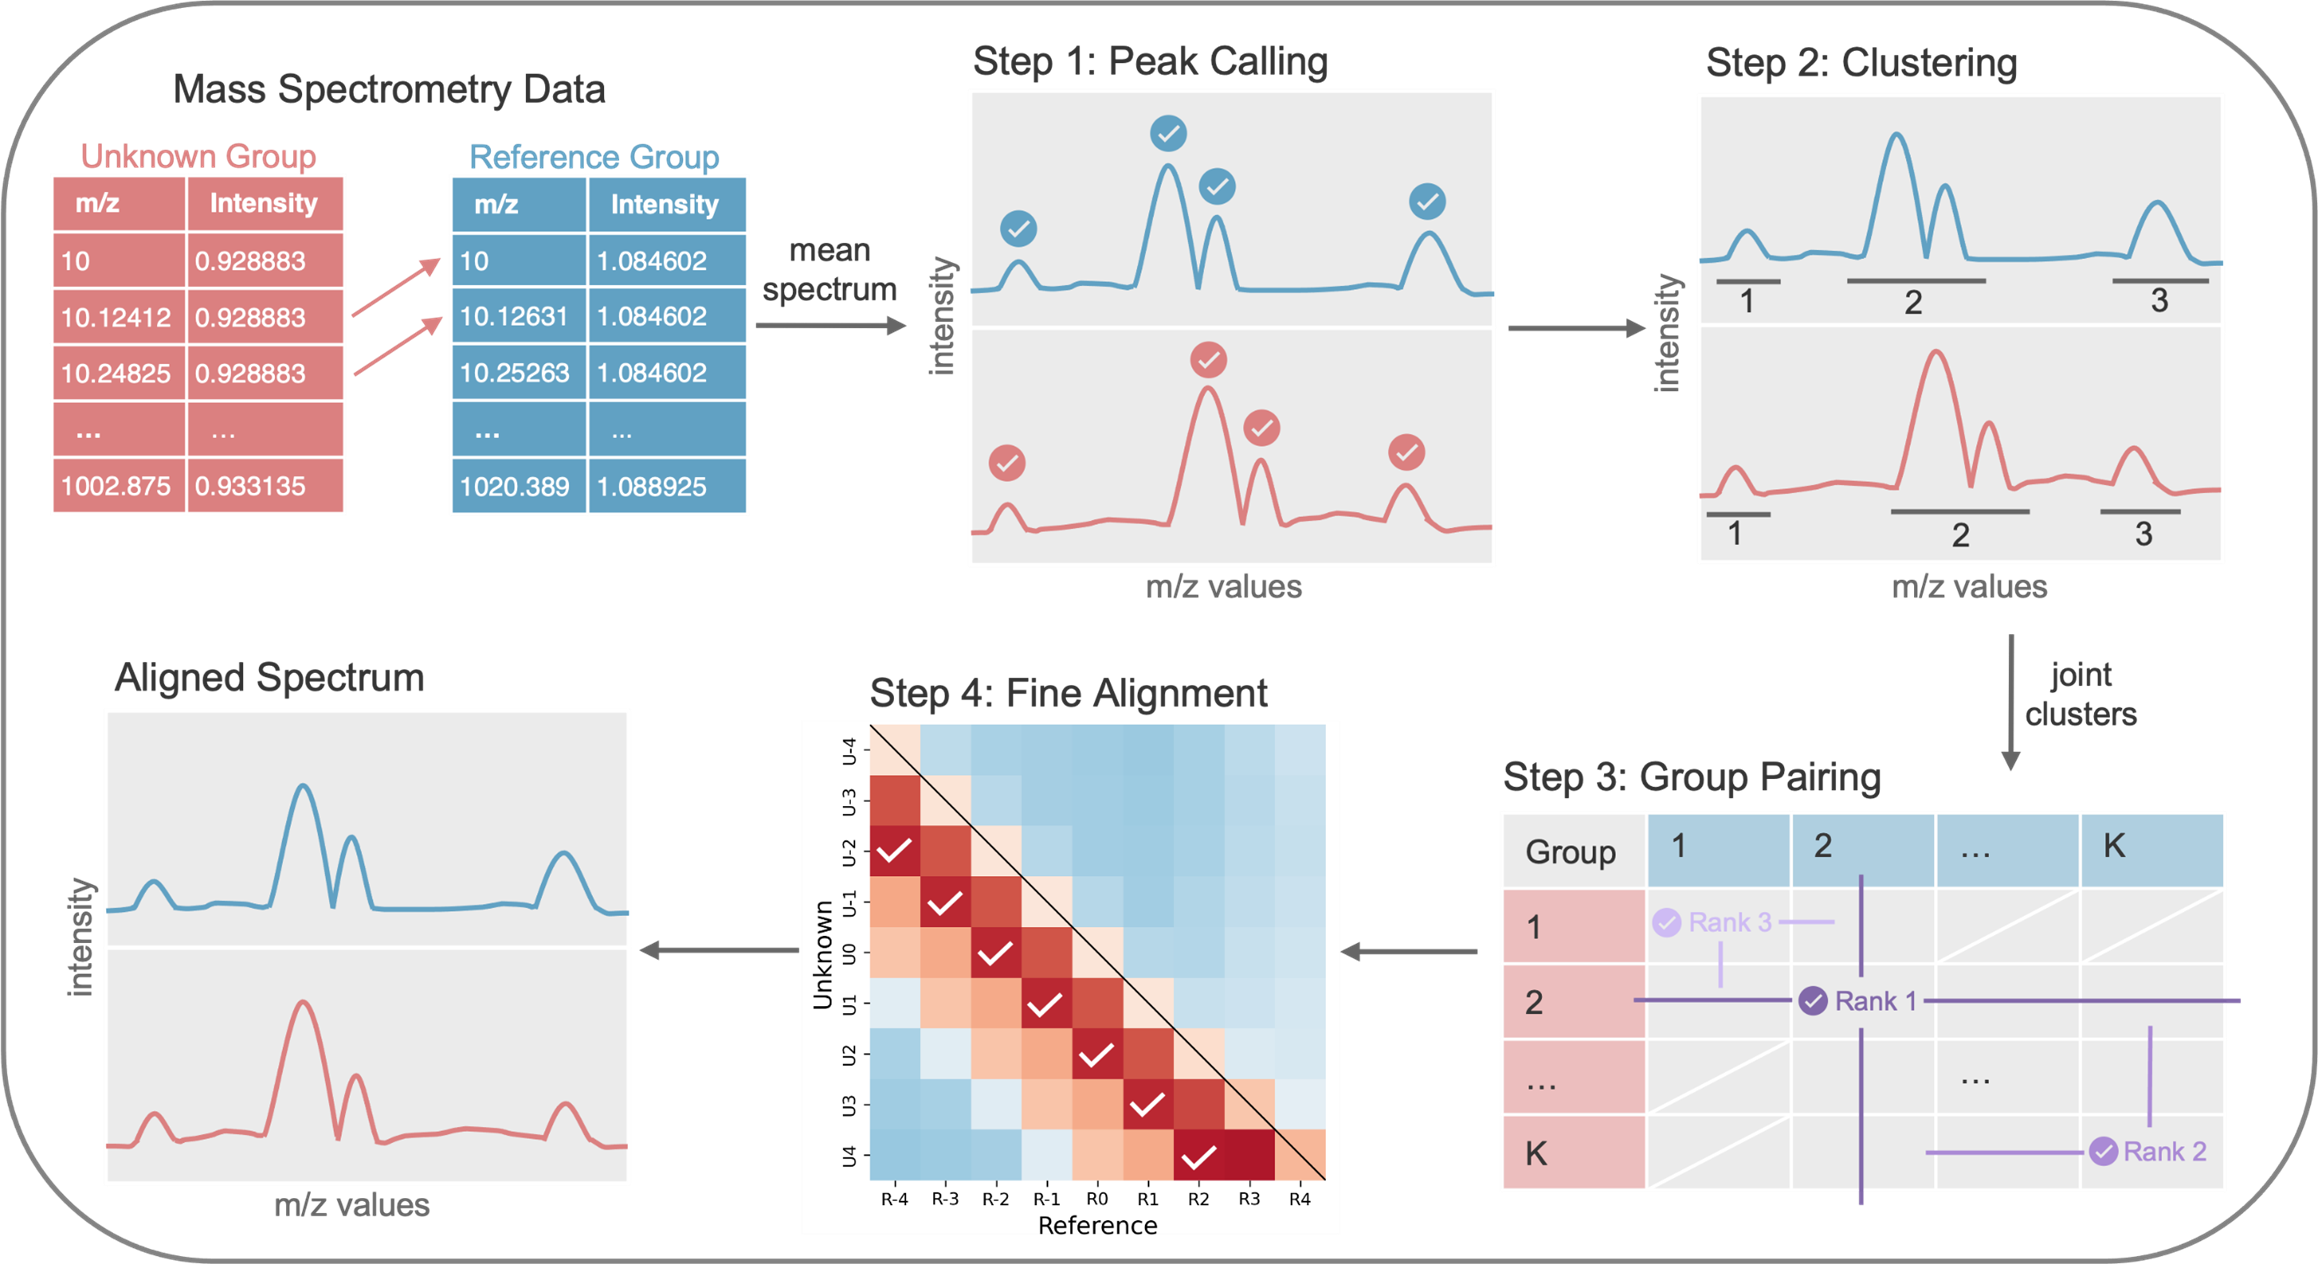
|
|
66
|
+
|
|
67
|
+
By aligning an "unknown" spectrum (or dataset) to a reference while *forcing*
|
|
68
|
+
matched spectra to share the same m/z values, PGAlign enables downstream
|
|
69
|
+
analyses such as:
|
|
70
|
+
|
|
71
|
+
- joint spatial segmentation across tissues or time points
|
|
72
|
+
- classification using combined datasets
|
|
73
|
+
- other multi-sample analyses that require a common m/z grid
|
|
74
|
+
|
|
75
|
+
This repository contains the reference Python implementation accompanying the
|
|
76
|
+
PGAlign manuscript (Deng, Zhang & Zhang, 2026; under peer review).
|
|
77
|
+
|
|
78
|
+
---
|
|
79
|
+
|
|
80
|
+
## Repository layout
|
|
81
|
+
|
|
82
|
+
- `pgalign/`: Core Python implementation of PGAlign (alignment and peak-group functions).
|
|
83
|
+
- `CodeInPaper/`: Scripts that reproduce the figures and results in the manuscript. See `CodeInPaper/README.md`.
|
|
84
|
+
- `Tutorial_PGAlign.ipynb`: A Jupyter notebook that walks through aligning two MALDI datasets (e.g., Week 2 and Week 5 macrophage samples) and preparing them for joint segmentation.
|
|
85
|
+
- `tests/`: Smoke tests (`pytest`).
|
|
86
|
+
- `CITATION.cff`: Citation metadata.
|
|
87
|
+
- `LICENSE`: MIT license.
|
|
88
|
+
|
|
89
|
+
---
|
|
90
|
+
|
|
91
|
+
## Installation
|
|
92
|
+
|
|
93
|
+
```bash
|
|
94
|
+
pip install pgalign # or "pgalign[imzml]" to read imzML files
|
|
95
|
+
```
|
|
96
|
+
|
|
97
|
+
To work from the source, clone the repository and install it with `pip`:
|
|
98
|
+
|
|
99
|
+
```bash
|
|
100
|
+
git clone https://github.com/StaGill/PGAlign.git
|
|
101
|
+
cd PGAlign
|
|
102
|
+
pip install -e .
|
|
103
|
+
```
|
|
104
|
+
|
|
105
|
+
The package's importable name is `pgalign`:
|
|
106
|
+
|
|
107
|
+
```python
|
|
108
|
+
import pgalign as pg
|
|
109
|
+
print(pg.__version__)
|
|
110
|
+
```
|
|
111
|
+
|
|
112
|
+
---
|
|
113
|
+
|
|
114
|
+
## API at a glance
|
|
115
|
+
|
|
116
|
+
The four-step pipeline in the paper maps to the following public methods:
|
|
117
|
+
|
|
118
|
+
| Step | Manuscript section | Object · method |
|
|
119
|
+
|-----:|-----------------------------|---------------------------------------------------|
|
|
120
|
+
| 1 | Peak Calling | `PeakCalling.peak_calling(threshold=0.9)` |
|
|
121
|
+
| 2 | Peak Grouping | `PeakCalling.peak_grouping(percentile=0.9)` |
|
|
122
|
+
| 3 | Peak Group Pairing | `AnnDataMALDI.peak_group_pairing(criteria=0)` |
|
|
123
|
+
| 4 | Fine Alignment Assessment | `AnnDataMALDI.fine_alignment_assessment(threshold=0.2)` |
|
|
124
|
+
|
|
125
|
+
Similarity is measured with Pearson's correlation; Step 3 uses a sliding
|
|
126
|
+
window of +/- 4 grid points (see Methods of the paper). `pg.align(unk, ref)`
|
|
127
|
+
runs all four steps in one call (see Quick start).
|
|
128
|
+
|
|
129
|
+
The pre-2026 method names (`callpeak`, `grouppeaks`, `greedy_match`,
|
|
130
|
+
`fine_align`) are kept as deprecated aliases and emit `DeprecationWarning`.
|
|
131
|
+
|
|
132
|
+
---
|
|
133
|
+
|
|
134
|
+
## Toy data
|
|
135
|
+
|
|
136
|
+
A 120-spectrum / 601-m/z-bin slice of the public mouse pancreas dataset
|
|
137
|
+
(Prade et al., 2020, Zenodo 10.5281/zenodo.3607915, CC BY 4.0) ships with the
|
|
138
|
+
package for tutorials and tests:
|
|
139
|
+
|
|
140
|
+
```python
|
|
141
|
+
import pgalign as pg
|
|
142
|
+
unk, ref = pg.datasets.load_mouse_pancreas_toy()
|
|
143
|
+
```
|
|
144
|
+
|
|
145
|
+
The "unknown" spectrum has a planted +2-bin rigid shift relative to the
|
|
146
|
+
reference, so PGAlign should recover a shift of about +2 m/z bins.
|
|
147
|
+
|
|
148
|
+
---
|
|
149
|
+
|
|
150
|
+
## Reading your data
|
|
151
|
+
|
|
152
|
+
```python
|
|
153
|
+
unk = pg.read_imzml("unknown.imzML", increment=0.25) # pip install "pgalign[imzml]"
|
|
154
|
+
ref = pg.read_imzml("reference.imzML", increment=0.25)
|
|
155
|
+
```
|
|
156
|
+
|
|
157
|
+
`pg.read_imzml` reads continuous imzML as it is and puts processed imzML, where
|
|
158
|
+
each spectrum carries its own m/z values, on a common grid. `pg.read_scils_csv`
|
|
159
|
+
reads SCiLS Lab CSV exports, and `pg.read_h5ad` reads `.h5ad` files. Each gives an
|
|
160
|
+
`AnnData` with the m/z values in `var["m/z"]`, ready for `pg.align`. Save results
|
|
161
|
+
with `pg.write_h5ad(res.aligned, "aligned.h5ad")`: anndata 0.13 and later cannot write a column named `m/z`, so `pg.write_h5ad` stores
|
|
162
|
+
it as `mz` and `pg.read_h5ad` restores it.
|
|
163
|
+
|
|
164
|
+
---
|
|
165
|
+
|
|
166
|
+
## Command line
|
|
167
|
+
|
|
168
|
+
```bash
|
|
169
|
+
pgalign align unknown.imzML reference.imzML -o aligned.h5ad --increment 0.25
|
|
170
|
+
```
|
|
171
|
+
|
|
172
|
+
This prints the summary line and writes the aligned unknown spectra to
|
|
173
|
+
`aligned.h5ad`, the reference on the same bins to `aligned_reference.h5ad`, and
|
|
174
|
+
the two tables to `aligned_shifts.csv` and `aligned_ambiguity.csv`; read the
|
|
175
|
+
`.h5ad` files back with `pg.read_h5ad`. Inputs can be
|
|
176
|
+
`.imzML`, `.h5ad` or SCiLS `.csv` exports. `pgalign align --help` lists the
|
|
177
|
+
options, which mirror those of `pg.align`.
|
|
178
|
+
|
|
179
|
+
---
|
|
180
|
+
|
|
181
|
+
## Quick start
|
|
182
|
+
|
|
183
|
+
```python
|
|
184
|
+
import pgalign as pg
|
|
185
|
+
|
|
186
|
+
unk, ref = pg.datasets.load_mouse_pancreas_toy() # or your own two AnnData objects
|
|
187
|
+
res = pg.align(unk, ref)
|
|
188
|
+
print(res.summary()) # 7 groups paired, 7 shifted, 0 flagged at tau = 0.1
|
|
189
|
+
aligned = res.aligned # the unknown spectra on the reference m/z grid
|
|
190
|
+
```
|
|
191
|
+
|
|
192
|
+
`pg.align` normalizes each spectrum, runs the four steps with the manuscript's
|
|
193
|
+
defaults and returns the aligned dataset with two tables: `res.shifts`, one row
|
|
194
|
+
per paired peak group with its offset, and `res.ambiguity`, the diagnostic
|
|
195
|
+
described under [Flagging ambiguous alignments](https://github.com/StaGill/PGAlign#flagging-ambiguous-alignments).
|
|
196
|
+
By default it calls peaks on the three-point moving average described in the
|
|
197
|
+
Methods; pass `smooth=False` for the peak caller used in the simulation study
|
|
198
|
+
and the canine sarcoma analysis. The inputs are not modified.
|
|
199
|
+
|
|
200
|
+
### Step by step
|
|
201
|
+
|
|
202
|
+
The notebooks under `CodeInPaper/` run the pipeline one step at a time, and
|
|
203
|
+
`Tutorial_PGAlign.ipynb` gives a worked example. The basic workflow is:
|
|
204
|
+
|
|
205
|
+
1. Load two MALDI datasets (e.g., two time points or two tissues) with optional spatial coordinates.
|
|
206
|
+
2. Wrap them as `AnnData` objects (via `scanpy` / `anndata`).
|
|
207
|
+
3. Normalize intensities per spectrum.
|
|
208
|
+
4. Run the four PGAlign steps.
|
|
209
|
+
5. Extract the aligned spectra for joint downstream analyses (e.g., PCA + Harmony + clustering).
|
|
210
|
+
|
|
211
|
+
```python
|
|
212
|
+
import scanpy as sc
|
|
213
|
+
import pgalign as pg
|
|
214
|
+
|
|
215
|
+
# X = spectra, var = m/z table, obs = coordinates (see Tutorial_PGAlign.ipynb)
|
|
216
|
+
MALDIdataAnn1 = ... # unknown spectrum
|
|
217
|
+
MALDIdataAnn2 = ... # reference spectrum
|
|
218
|
+
|
|
219
|
+
# Per-spectrum normalisation
|
|
220
|
+
sc.pp.normalize_per_cell(MALDIdataAnn1)
|
|
221
|
+
sc.pp.normalize_per_cell(MALDIdataAnn2)
|
|
222
|
+
|
|
223
|
+
# Step 1 + Step 2: peak calling and peak grouping
|
|
224
|
+
PeakGroup = pg.PeakCalling(MALDIdataAnn1, MALDIdataAnn2) # pg.align uses pg.PeakCallingmv by default
|
|
225
|
+
PeakGroup.peak_calling(threshold=0.9)
|
|
226
|
+
PeakGroup.peak_grouping(percentile=0.9)
|
|
227
|
+
|
|
228
|
+
# Step 3: peak group pairing
|
|
229
|
+
ExactAlign = pg.AnnDataMALDI(MALDIdataAnn1, MALDIdataAnn2)
|
|
230
|
+
ExactAlign.get_corr_peakgroup_refined(PeakGroup.jointcluster)
|
|
231
|
+
ExactAlign.peak_group_pairing(criteria=0)
|
|
232
|
+
|
|
233
|
+
# Step 4: fine alignment assessment
|
|
234
|
+
ExactAlign.fine_alignment_assessment(threshold=0.2, ignore=True)
|
|
235
|
+
ExactAlign.summarize()
|
|
236
|
+
|
|
237
|
+
# The aligned dataset: the unknown spectra on the reference m/z grid
|
|
238
|
+
MALDIdataAnn1_aligned = pg.PGmzalign(ExactAlign).getAnnSim()
|
|
239
|
+
```
|
|
240
|
+
|
|
241
|
+
`getAnnSim()` returns the unknown spectra as an `AnnData` whose `var["m/z"]`
|
|
242
|
+
are the reference's m/z values, so it can be analysed jointly with the
|
|
243
|
+
reference. Despite the method's name, nothing is simulated. The result is cut
|
|
244
|
+
to the shorter of the two m/z axes, so it can lack a few bins at the top of the
|
|
245
|
+
range.
|
|
246
|
+
|
|
247
|
+
Please refer to `Tutorial_PGAlign.ipynb` for a fully worked example with real
|
|
248
|
+
data and plots.
|
|
249
|
+
|
|
250
|
+
### Flagging ambiguous alignments
|
|
251
|
+
|
|
252
|
+
A shifted peak group always has one alternative: staying at its original
|
|
253
|
+
position. After Step 4, `flag_ambiguous_alignments` flags a shifted group when
|
|
254
|
+
staying scores within `delta` (default 0.1) of the chosen alignment, using the
|
|
255
|
+
pairing similarity for groups matched to a different reference group and the
|
|
256
|
+
zero-offset diagonal for groups moved by a non-zero offset. Flagged groups are
|
|
257
|
+
reported with both scores, so you can inspect them before downstream analysis.
|
|
258
|
+
|
|
259
|
+
```python
|
|
260
|
+
ExactAlign.fine_alignment_assessment(threshold=0.2, ignore=True)
|
|
261
|
+
table = ExactAlign.flag_ambiguous_alignments(delta=0.1)
|
|
262
|
+
print(table[table["flagged"]])
|
|
263
|
+
print(f"{table['flagged'].sum()} of {len(table)} shifted groups flagged")
|
|
264
|
+
print(table.groupby("rule")["flagged"].agg(["sum", "size"]))
|
|
265
|
+
```
|
|
266
|
+
|
|
267
|
+
The `rule` column says which comparison a row was assessed by: `"group"` for
|
|
268
|
+
a group paired with a different reference group, `"offset"` for a group
|
|
269
|
+
paired at its own position but moved by a non-zero offset.
|
|
270
|
+
|
|
271
|
+
---
|
|
272
|
+
|
|
273
|
+
## Reproducing results from the manuscript
|
|
274
|
+
|
|
275
|
+
Release v1.0.1 is the version that accompanies the manuscript. Later releases
|
|
276
|
+
may change the results, so install that version to reproduce them:
|
|
277
|
+
|
|
278
|
+
```bash
|
|
279
|
+
pip install "git+https://github.com/StaGill/PGAlign@v1.0.1"
|
|
280
|
+
```
|
|
281
|
+
|
|
282
|
+
The notebooks under `CodeInPaper/` reproduce the main analyses; run them from a
|
|
283
|
+
checkout of the same release (`git checkout v1.0.1`). Each subfolder has its
|
|
284
|
+
own `README.md` with dataset access instructions:
|
|
285
|
+
|
|
286
|
+
- **Simulation study (mouse pancreas MALDI)**: alignment error under
|
|
287
|
+
controlled peak shifts and noise. See `CodeInPaper/MousePancreate.ipynb`.
|
|
288
|
+
- **Macrophage metabolomics (atherosclerosis regression)**: aligns Week 5
|
|
289
|
+
MALDI spectra to Week 2 and performs joint spatial segmentation. See
|
|
290
|
+
`CodeInPaper/Maaike/`.
|
|
291
|
+
- **Canine sarcoma classification**: aligns cancer tissue spectra to normal
|
|
292
|
+
tissue and assesses classification performance before/after alignment. See
|
|
293
|
+
`CodeInPaper/Sarcomas/`.
|
|
294
|
+
|
|
295
|
+
**Data sources:**
|
|
296
|
+
|
|
297
|
+
- Mouse pancreas MALDI: <https://doi.org/10.5281/zenodo.3607915>
|
|
298
|
+
- Atherosclerosis regression MALDI: mean spectra on Zenodo (<https://zenodo.org/records/20533948>); the per-spot
|
|
299
|
+
spectra that the notebooks read are available from the data owners upon reasonable request.
|
|
300
|
+
- Canine sarcoma MALDI: ProteomeXchange PRIDE accession `PXD010990` (<https://proteomecentral.proteomexchange.org/cgi/GetDataset?ID=PXD010990>).
|
|
301
|
+
|
|
302
|
+
---
|
|
303
|
+
|
|
304
|
+
## Citation
|
|
305
|
+
|
|
306
|
+
The PGAlign manuscript is currently under peer review. If you use PGAlign in
|
|
307
|
+
your research, please cite this repository (see `CITATION.cff`, which GitHub
|
|
308
|
+
renders as a "Cite this repository" button) and contact the corresponding
|
|
309
|
+
author for the latest preprint:
|
|
310
|
+
|
|
311
|
+
> Deng A, Zhang Y, Zhang Q. *PGAlign: peak group alignment of mass spectrometry data*.
|
|
312
|
+
> Under review at the *Journal of Proteome Research*, 2026.
|
|
313
|
+
|
|
314
|
+
---
|
|
315
|
+
|
|
316
|
+
## License
|
|
317
|
+
|
|
318
|
+
MIT (see `LICENSE`).
|
|
@@ -0,0 +1,15 @@
|
|
|
1
|
+
pgalign/AnnDataMALDI.py,sha256=N5hwiB_8_IvuaQ9zpyhC7pfQkL8ZFIZhxr5LXSDtkvU,24072
|
|
2
|
+
pgalign/PeakCalling.py,sha256=7JHcmmzz7q92cr9YsrMvpEafONPAApO1eiW2CwWVTP8,10821
|
|
3
|
+
pgalign/__init__.py,sha256=0lDCwdEkQUgomwM-H5EIA0IS0no2D7WPScOR_160aIc,1936
|
|
4
|
+
pgalign/cli.py,sha256=pjA6jHd5L1s4Ivixc19oBT3oAPyPPQbpCYa2vKscHQ4,3891
|
|
5
|
+
pgalign/datasets.py,sha256=jP2WSjrbGhKi947lc_ngbd3Qmtky2vC2ghwZN9D0kb4,1503
|
|
6
|
+
pgalign/pipeline.py,sha256=g3xqDD_-WVLRDydeeZpZrojnd5vzZWLJuqt25MxNF1A,7329
|
|
7
|
+
pgalign/readers.py,sha256=bN1QxcttERIMbNGc2KBiaJvUrdf6cXnKlt2Ox5Ui6YE,6274
|
|
8
|
+
pgalign/util.py,sha256=K9Cw2CrOfiNL5gXM9dmxFpPFGiAiRHYy1IF93lp8Px8,5657
|
|
9
|
+
pgalign/data/mouse_pancreas_toy.npz,sha256=tNEPPLjNFqMQ3UiPJCJbS2ubRQIJrRCEdVfEmYyqKVk,236722
|
|
10
|
+
pgalign-1.1.0.dist-info/licenses/LICENSE,sha256=SpAkCKdPBNgXyKpG5AH7RmQ3AwOXjQ2xHC4FIA8gP10,1070
|
|
11
|
+
pgalign-1.1.0.dist-info/METADATA,sha256=Eo1VxipFpksCzbhHB4JSxCOU_-QdIQcD0UXSfOfGTac,12909
|
|
12
|
+
pgalign-1.1.0.dist-info/WHEEL,sha256=YVMoNqKzERt-wjUZwJ33xBGAwnFl-4cqbYkTtWa4itE,91
|
|
13
|
+
pgalign-1.1.0.dist-info/entry_points.txt,sha256=TWdzHsbYH-svOS5ZOlDPBaEIZjn03NXxpWW4Rm9X8ho,45
|
|
14
|
+
pgalign-1.1.0.dist-info/top_level.txt,sha256=qGfhDsHZvQMAjnA44gyEEEirL1d0SZH3TKDuorxdtpM,8
|
|
15
|
+
pgalign-1.1.0.dist-info/RECORD,,
|
|
@@ -0,0 +1,21 @@
|
|
|
1
|
+
MIT License
|
|
2
|
+
|
|
3
|
+
Copyright (c) 2023 Qihuang Zhang
|
|
4
|
+
|
|
5
|
+
Permission is hereby granted, free of charge, to any person obtaining a copy
|
|
6
|
+
of this software and associated documentation files (the "Software"), to deal
|
|
7
|
+
in the Software without restriction, including without limitation the rights
|
|
8
|
+
to use, copy, modify, merge, publish, distribute, sublicense, and/or sell
|
|
9
|
+
copies of the Software, and to permit persons to whom the Software is
|
|
10
|
+
furnished to do so, subject to the following conditions:
|
|
11
|
+
|
|
12
|
+
The above copyright notice and this permission notice shall be included in all
|
|
13
|
+
copies or substantial portions of the Software.
|
|
14
|
+
|
|
15
|
+
THE SOFTWARE IS PROVIDED "AS IS", WITHOUT WARRANTY OF ANY KIND, EXPRESS OR
|
|
16
|
+
IMPLIED, INCLUDING BUT NOT LIMITED TO THE WARRANTIES OF MERCHANTABILITY,
|
|
17
|
+
FITNESS FOR A PARTICULAR PURPOSE AND NONINFRINGEMENT. IN NO EVENT SHALL THE
|
|
18
|
+
AUTHORS OR COPYRIGHT HOLDERS BE LIABLE FOR ANY CLAIM, DAMAGES OR OTHER
|
|
19
|
+
LIABILITY, WHETHER IN AN ACTION OF CONTRACT, TORT OR OTHERWISE, ARISING FROM,
|
|
20
|
+
OUT OF OR IN CONNECTION WITH THE SOFTWARE OR THE USE OR OTHER DEALINGS IN THE
|
|
21
|
+
SOFTWARE.
|
|
@@ -0,0 +1 @@
|
|
|
1
|
+
pgalign
|