hons 0.1.0__py3-none-any.whl
This diff represents the content of publicly available package versions that have been released to one of the supported registries. The information contained in this diff is provided for informational purposes only and reflects changes between package versions as they appear in their respective public registries.
- hons-0.1.0.dist-info/METADATA +112 -0
- hons-0.1.0.dist-info/RECORD +6 -0
- hons-0.1.0.dist-info/WHEEL +5 -0
- hons-0.1.0.dist-info/licenses/LICENSE +21 -0
- hons-0.1.0.dist-info/top_level.txt +1 -0
- hons.py +284 -0
|
@@ -0,0 +1,112 @@
|
|
|
1
|
+
Metadata-Version: 2.4
|
|
2
|
+
Name: hons
|
|
3
|
+
Version: 0.1.0
|
|
4
|
+
Summary: Select network thresholds using persistent homology.
|
|
5
|
+
Author-email: "Russell J. Funk" <rfunk@umn.edu>
|
|
6
|
+
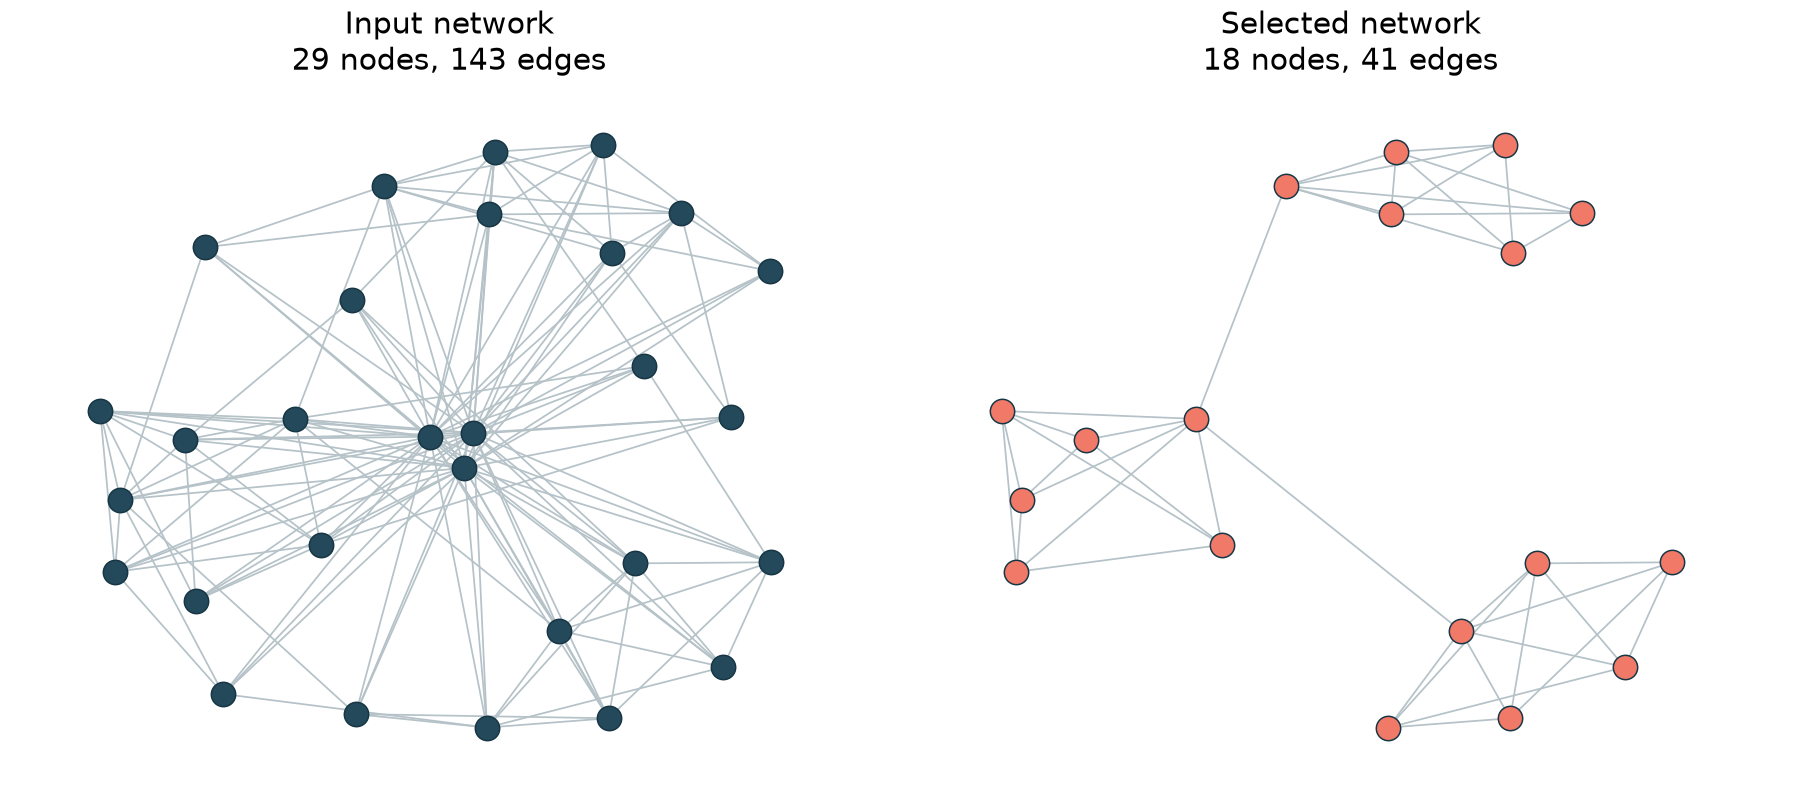
License-Expression: MIT
|
|
7
|
+
Project-URL: Source, https://github.com/rfunklab/hons
|
|
8
|
+
Project-URL: Issues, https://github.com/rfunklab/hons/issues
|
|
9
|
+
Keywords: persistent homology,network thresholding,topological data analysis
|
|
10
|
+
Classifier: Intended Audience :: Science/Research
|
|
11
|
+
Classifier: Topic :: Scientific/Engineering
|
|
12
|
+
Classifier: Programming Language :: Python :: 3.11
|
|
13
|
+
Classifier: Programming Language :: Python :: 3.12
|
|
14
|
+
Classifier: Programming Language :: Python :: 3.13
|
|
15
|
+
Requires-Python: <3.14,>=3.11
|
|
16
|
+
Description-Content-Type: text/markdown
|
|
17
|
+
License-File: LICENSE
|
|
18
|
+
Requires-Dist: numpy<3,>=1.26.4
|
|
19
|
+
Requires-Dist: pandas<4,>=2.1.4
|
|
20
|
+
Requires-Dist: gudhi<3.12,>=3.10.1
|
|
21
|
+
Requires-Dist: networkx<4,>=3.2
|
|
22
|
+
Provides-Extra: plot
|
|
23
|
+
Requires-Dist: matplotlib<4,>=3.8; extra == "plot"
|
|
24
|
+
Dynamic: license-file
|
|
25
|
+
|
|
26
|
+
# Higher-order network selection
|
|
27
|
+
|
|
28
|
+
<img src="https://raw.githubusercontent.com/rfunklab/hons/a763c0b43e692ad65491f555a7ab080b6846567b/docs/hons_logo.png" alt="HONS logo" width="300">
|
|
29
|
+
|
|
30
|
+
Network thresholding helps researchers extract interpretable structure from dense relational data by removing nodes or edges according to their properties. Choosing the cutoffs is harder: a ground-truth network is rarely available, thresholds are often selected by trial and error, and small changes can produce substantially different networks. Criteria based on individual nodes or edges can also overlook connections that contribute to higher-order structure.
|
|
31
|
+
|
|
32
|
+
**HONS selects thresholds for numerical node attributes or edge weights using the network's cycles and cavities.** These features depend on how groups of connections fit together, beyond counts of nodes, edges or triangles. HONS uses persistent homology to measure those features across a grid of candidate thresholds and selects the network whose topological representation changes least under nearby threshold changes. Minimum feature-count constraints let researchers specify how many cycles and cavities candidate networks must contain.
|
|
33
|
+
|
|
34
|
+
## Install
|
|
35
|
+
|
|
36
|
+
Use Python 3.11–3.13:
|
|
37
|
+
|
|
38
|
+
```sh
|
|
39
|
+
pip install hons
|
|
40
|
+
```
|
|
41
|
+
|
|
42
|
+
For plotting, run `pip install "hons[plot]"`.
|
|
43
|
+
|
|
44
|
+
## NetworkX example
|
|
45
|
+
|
|
46
|
+
The main demo starts with a generated NetworkX graph containing three connected structures and extra connections. Each node has an assigned numerical `weight` to threshold, and each edge has an entry value called `filtration`. In an application, you would supply a measured node or edge attribute, such as frequency or contact duration:
|
|
47
|
+
|
|
48
|
+
```python
|
|
49
|
+
import hons
|
|
50
|
+
|
|
51
|
+
network = hons.example_network()
|
|
52
|
+
selected = hons.threshold(
|
|
53
|
+
network,
|
|
54
|
+
node_attribute="weight",
|
|
55
|
+
lower=[0, 1, 2, 3, 4],
|
|
56
|
+
upper=[4, 5, 6, 7, 9],
|
|
57
|
+
filtration_range=(0, 1),
|
|
58
|
+
constraints=(50, 25),
|
|
59
|
+
)
|
|
60
|
+
|
|
61
|
+
print(network.number_of_nodes(), network.number_of_edges()) # 29 143
|
|
62
|
+
print(selected.number_of_nodes(), selected.number_of_edges()) # 18 41
|
|
63
|
+
```
|
|
64
|
+
|
|
65
|
+
|
|
66
|
+
|
|
67
|
+
Both objects are ordinary NetworkX graphs. The input remains unchanged, and the selected graph retains its node and edge attributes in their original units. Run `python examples/network_demo.py` from a source checkout to recreate the plot.
|
|
68
|
+
|
|
69
|
+
The example selects nodes with `weight` between **4 and 7**, inclusive. The selected network has five positive-lifetime H1 features and three H2 features across its filtration. H1 features describe cycles; H2 features describe cavities. `constraints=(50, 25)` requires their counts to reach at least the 50th and 25th percentiles, respectively, among selectable candidate networks.
|
|
70
|
+
|
|
71
|
+
## Choose candidate thresholds
|
|
72
|
+
|
|
73
|
+
The `lower` and `upper` arrays define the search grid in the units of the attribute you want to threshold. The numbers above are choices for this small example. Choose bounds that cover the plausible cutoffs for your network; explicit lists, `numpy.linspace` and `numpy.geomspace` are all suitable ways to construct a grid. Grid range and spacing affect which settings are compared and which setting can be selected.
|
|
74
|
+
|
|
75
|
+
Supply increasing arrays with at least two lower bounds and one upper bound. HONS evaluates every lower/upper combination. The smallest lower bound supplies a neighboring value for the score and is excluded from selection. Bounds are inclusive. A lower bound above its paired upper bound removes all nodes in node-filtering mode or all edges in edge-filtering mode.
|
|
76
|
+
|
|
77
|
+
Use `node_attribute="name"` to select an induced subgraph, or `edge_attribute="name"` to filter edges while preserving all nodes. The input must be a simple, undirected NetworkX graph. HONS returns `None` when no candidate meets both feature-count constraints.
|
|
78
|
+
|
|
79
|
+
## Specify the filtration
|
|
80
|
+
|
|
81
|
+
A filtration describes the order in which connections enter the topology calculation. Each edge needs a finite numerical entry value: a time, a distance or another quantity appropriate to your application. Smaller values enter earlier. All vertices are present at the start, and a clique enters when its last edge enters. The attribute used to remove nodes or edges and the entry values used for persistence have separate roles.
|
|
82
|
+
|
|
83
|
+
HONS accepts entry values in their original units and converts them internally to 0–1 for the persistence images. By default, the conversion uses the minimum and maximum edge values in the full input graph. Every candidate uses that same range. Set `filtration_range=(start, stop)` when you have a known observation window or want to use a fixed range across multiple input graphs. For example, use `filtration="first_seen", filtration_range=(1920, 2021)` for edges dated by first appearance. The demo explicitly uses its generating interval, `(0, 1)`.
|
|
84
|
+
|
|
85
|
+
The fixed image grid and Gaussian width apply to this normalized scale. A change of units, with the range changed accordingly, preserves the calculation. A different definition of entry order can change the result. For a strength-based filtration in which stronger edges should enter earlier, use negative strength as the entry value. A zero-width normalization range maps entry values to zero. An empty input graph defaults to a 0–1 range.
|
|
86
|
+
|
|
87
|
+
## Example application: scientific concepts
|
|
88
|
+
|
|
89
|
+
The paper applies HONS to concepts that co-occur in scientific articles. In this application, nodes represent concepts, document frequency supplies the attribute to threshold, and an edge's first co-occurrence year supplies its entry value. `examples/concept_network.py` shows how to prepare generated article–concept records as an ordinary NetworkX graph and pass that graph to HONS. This example uses a fixed observation window across candidates. The paper's empirical analysis dates each retained network from its earliest retained concept; the replication repository preserves that preparation in the saved diagrams.
|
|
90
|
+
|
|
91
|
+
| Example | Purpose | Command from a source checkout |
|
|
92
|
+
| --- | --- | --- |
|
|
93
|
+
| `network_demo.py` | Select from an existing graph and draw the before/after comparison. | `python examples/network_demo.py` |
|
|
94
|
+
| `concept_network.py` | Prepare article–concept records for the same general API. | `python examples/concept_network.py` |
|
|
95
|
+
|
|
96
|
+
The separate [hons-replication](https://github.com/rfunklab/hons-replication) repository reproduces calculations from the paper's saved persistence diagrams and demonstrates edge-weight thresholding on an open workplace contact network.
|
|
97
|
+
|
|
98
|
+
## Inspect the calculation
|
|
99
|
+
|
|
100
|
+
Set `return_details=True` to return `(selected, details)`. `details["grid"]` contains thresholds, network sizes, feature counts and scores; `details["filtration_range"]` records the range used for normalization. The dictionary also includes normalized persistence diagrams, image vectors and near-ties. The selected graph's `graph["hons"]` attribute records its bounds, score and feature counts.
|
|
101
|
+
|
|
102
|
+
The calculation uses H1 and H2 persistence images, a 20 × 20 sampling grid per dimension, Gaussian standard deviation 0.1, lifetime weights and coefficients in Z/11Z. Essential features are included in selection; infinite deaths become 1.00001 for imaging. Neighboring image distances are divided by their parameter separations, averaged in each direction and combined by the Euclidean norm. Dense graphs can be expensive because computing H2 requires clique expansion through tetrahedra.
|
|
103
|
+
|
|
104
|
+
For an existing grid of persistence diagrams, use `rho`, `objective` and `select` directly. Diagrams are pandas DataFrames with `dimension`, `birth` and `death` columns and must use a common normalized scale. Dictionary keys are `(upper_index, lower_index)`. The `persistence` helper accepts node identifiers and an edge-to-entry-value mapping; supply common `start` and `stop` bounds when comparing multiple networks. Exact minima follow sorted cell order, with near-ties reported within an absolute score tolerance of 1e-12.
|
|
105
|
+
|
|
106
|
+
Run the tests from a source checkout with `python -m unittest discover -s tests`.
|
|
107
|
+
|
|
108
|
+
## Paper and license
|
|
109
|
+
|
|
110
|
+
Adam Schroeder, Russell Funk, Jingyi Guan, Taylor Okonek and Lori Ziegelmeier. *Higher-Order Network Structure Inference: A Topological Approach to Network Selection*.
|
|
111
|
+
|
|
112
|
+
The MIT [license](LICENSE) applies to this repository's code, documentation and original assets. Contact Russell Funk at rfunk@umn.edu.
|
|
@@ -0,0 +1,6 @@
|
|
|
1
|
+
hons.py,sha256=7BD_hDK28MPiSHTtniIZOn6z4OHaNf62g0keg4s4utk,13454
|
|
2
|
+
hons-0.1.0.dist-info/licenses/LICENSE,sha256=4a42iuzERfJoaw2iKICy_Z41zigGNKnesZ96aWHP_7o,1072
|
|
3
|
+
hons-0.1.0.dist-info/METADATA,sha256=UvfEcf5wMX6828biIxz9bjsueb82KXkDeu7OWe0np38,9386
|
|
4
|
+
hons-0.1.0.dist-info/WHEEL,sha256=YVMoNqKzERt-wjUZwJ33xBGAwnFl-4cqbYkTtWa4itE,91
|
|
5
|
+
hons-0.1.0.dist-info/top_level.txt,sha256=83Bc8RaXitenSIh1V54pLPSo-OzEPScrwoNvbd16K_0,5
|
|
6
|
+
hons-0.1.0.dist-info/RECORD,,
|
|
@@ -0,0 +1,21 @@
|
|
|
1
|
+
MIT License
|
|
2
|
+
|
|
3
|
+
Copyright (c) 2026 Russell J. Funk
|
|
4
|
+
|
|
5
|
+
Permission is hereby granted, free of charge, to any person obtaining a copy
|
|
6
|
+
of this software and associated documentation files (the "Software"), to deal
|
|
7
|
+
in the Software without restriction, including without limitation the rights
|
|
8
|
+
to use, copy, modify, merge, publish, distribute, sublicense, and/or sell
|
|
9
|
+
copies of the Software, and to permit persons to whom the Software is
|
|
10
|
+
furnished to do so, subject to the following conditions:
|
|
11
|
+
|
|
12
|
+
The above copyright notice and this permission notice shall be included in all
|
|
13
|
+
copies or substantial portions of the Software.
|
|
14
|
+
|
|
15
|
+
THE SOFTWARE IS PROVIDED "AS IS", WITHOUT WARRANTY OF ANY KIND, EXPRESS OR
|
|
16
|
+
IMPLIED, INCLUDING BUT NOT LIMITED TO THE WARRANTIES OF MERCHANTABILITY,
|
|
17
|
+
FITNESS FOR A PARTICULAR PURPOSE AND NONINFRINGEMENT. IN NO EVENT SHALL THE
|
|
18
|
+
AUTHORS OR COPYRIGHT HOLDERS BE LIABLE FOR ANY CLAIM, DAMAGES OR OTHER
|
|
19
|
+
LIABILITY, WHETHER IN AN ACTION OF CONTRACT, TORT OR OTHERWISE, ARISING FROM,
|
|
20
|
+
OUT OF OR IN CONNECTION WITH THE SOFTWARE OR THE USE OR OTHER DEALINGS IN THE
|
|
21
|
+
SOFTWARE.
|
|
@@ -0,0 +1 @@
|
|
|
1
|
+
hons
|
hons.py
ADDED
|
@@ -0,0 +1,284 @@
|
|
|
1
|
+
"""Select network thresholds using persistent homology."""
|
|
2
|
+
from __future__ import annotations
|
|
3
|
+
|
|
4
|
+
import itertools
|
|
5
|
+
|
|
6
|
+
import numpy as np
|
|
7
|
+
import pandas as pd
|
|
8
|
+
|
|
9
|
+
# shared persistence-image settings
|
|
10
|
+
RES = 20
|
|
11
|
+
SIGMA = 0.1
|
|
12
|
+
INF_REPLACEMENT = 1.00001
|
|
13
|
+
IM_RANGE = [0.0, 1.0, 0.0, INF_REPLACEMENT]
|
|
14
|
+
|
|
15
|
+
|
|
16
|
+
def _filtration_bounds(values, limits=None):
|
|
17
|
+
"""Resolve one finite range covering all supplied edge entry values."""
|
|
18
|
+
values = np.asarray(list(values), dtype=float)
|
|
19
|
+
if not np.isfinite(values).all():
|
|
20
|
+
raise ValueError("Filtration values must be finite.")
|
|
21
|
+
if limits is None:
|
|
22
|
+
return (float(values.min()), float(values.max())) if len(values) else (0.0, 1.0)
|
|
23
|
+
limits = np.asarray(limits, dtype=float)
|
|
24
|
+
if limits.shape != (2,) or not np.isfinite(limits).all() or limits[1] < limits[0]:
|
|
25
|
+
raise ValueError("filtration_range must contain two finite bounds with start <= stop.")
|
|
26
|
+
start, stop = map(float, limits)
|
|
27
|
+
if np.any(values < start) or np.any(values > stop):
|
|
28
|
+
raise ValueError("Filtration values must fall within filtration_range.")
|
|
29
|
+
return start, stop
|
|
30
|
+
|
|
31
|
+
|
|
32
|
+
def persistence(nodes, edges, start=None, stop=None, max_dim=2) -> pd.DataFrame:
|
|
33
|
+
"""Compute positive-lifetime intervals through max_dim over Z/11Z.
|
|
34
|
+
|
|
35
|
+
edges maps node pairs to numerical entry values. Normalize the supplied
|
|
36
|
+
start/stop range to [0, 1], or infer bounds from the edge values when both
|
|
37
|
+
are omitted. Use the same bounds when comparing multiple networks.
|
|
38
|
+
All vertices enter at normalized zero. A constant range maps to zero.
|
|
39
|
+
Clique expansion supplies higher simplices; infinite deaths remain infinite.
|
|
40
|
+
"""
|
|
41
|
+
import gudhi
|
|
42
|
+
if (start is None) != (stop is None):
|
|
43
|
+
raise ValueError("Supply both start and stop, or omit both.")
|
|
44
|
+
start, stop = _filtration_bounds(edges.values(), None if start is None else (start, stop))
|
|
45
|
+
idx = {c: k for k, c in enumerate(nodes)}
|
|
46
|
+
if len(idx) != len(nodes):
|
|
47
|
+
raise ValueError("Node identifiers must be unique.")
|
|
48
|
+
st = gudhi.SimplexTree()
|
|
49
|
+
for k in range(len(nodes)):
|
|
50
|
+
st.insert([k], 0.0)
|
|
51
|
+
span = stop - start
|
|
52
|
+
for (a, b), value in edges.items():
|
|
53
|
+
value = float(value)
|
|
54
|
+
if not np.isfinite(span):
|
|
55
|
+
entry = (value / 2 - start / 2) / (stop / 2 - start / 2)
|
|
56
|
+
else:
|
|
57
|
+
entry = (value - start) / span if span else 0.0
|
|
58
|
+
if not np.isfinite(entry):
|
|
59
|
+
raise ValueError("Normalized filtration values must be finite.")
|
|
60
|
+
st.insert([idx[a], idx[b]], entry)
|
|
61
|
+
st.expansion(max_dim + 1)
|
|
62
|
+
# include the top dimension when it is one of the requested dimensions
|
|
63
|
+
st.compute_persistence(homology_coeff_field=11, min_persistence=0,
|
|
64
|
+
persistence_dim_max=st.dimension() <= max_dim)
|
|
65
|
+
rows = []
|
|
66
|
+
for d in range(max_dim + 1):
|
|
67
|
+
for birth, death in st.persistence_intervals_in_dimension(d):
|
|
68
|
+
rows.append((d, birth, death))
|
|
69
|
+
return pd.DataFrame(rows, columns=["dimension", "birth", "death"])
|
|
70
|
+
|
|
71
|
+
|
|
72
|
+
def lifetimes(h: pd.DataFrame, dim: int) -> np.ndarray:
|
|
73
|
+
"""Copy birth/death pairs, replacing infinite deaths by 1.00001 for imaging."""
|
|
74
|
+
d = h.loc[h["dimension"] == dim, ["birth", "death"]].to_numpy(dtype=float).copy()
|
|
75
|
+
if len(d) == 0:
|
|
76
|
+
return np.empty((0, 2))
|
|
77
|
+
d[:, 1][np.isinf(d[:, 1])] = INF_REPLACEMENT
|
|
78
|
+
return d
|
|
79
|
+
|
|
80
|
+
|
|
81
|
+
def image(bd: np.ndarray) -> np.ndarray:
|
|
82
|
+
"""Sample the lifetime-weighted Gaussian image on the fixed 20 by 20 grid.
|
|
83
|
+
|
|
84
|
+
Input rows are birth/death pairs with finite deaths. The output uses
|
|
85
|
+
y-major order and contains 400 values; an empty diagram gives zeros.
|
|
86
|
+
"""
|
|
87
|
+
bd = np.asarray(bd, dtype=float)
|
|
88
|
+
if bd.size == 0:
|
|
89
|
+
return np.zeros(RES * RES)
|
|
90
|
+
if (bd.ndim != 2 or bd.shape[1] != 2 or not np.isfinite(bd).all()
|
|
91
|
+
or np.any(bd[:, 1] < bd[:, 0])):
|
|
92
|
+
raise ValueError("Supply finite birth/death pairs with death >= birth.")
|
|
93
|
+
b, d = bd[:, 0], bd[:, 1]
|
|
94
|
+
pts = np.column_stack([b, d - b])
|
|
95
|
+
w = d - b
|
|
96
|
+
xs = np.linspace(IM_RANGE[0], IM_RANGE[1], RES)
|
|
97
|
+
ys = np.linspace(IM_RANGE[2], IM_RANGE[3], RES)
|
|
98
|
+
out = np.zeros((RES, RES))
|
|
99
|
+
step = 20000
|
|
100
|
+
for s in range(0, len(pts), step): # chunked: bounded memory
|
|
101
|
+
P, W = pts[s:s + step], w[s:s + step]
|
|
102
|
+
X = P[:, 0][:, None, None] - xs[None, None, :]
|
|
103
|
+
Y = P[:, 1][:, None, None] - ys[None, :, None]
|
|
104
|
+
K = np.exp(-(X ** 2 + Y ** 2) / (2 * SIGMA ** 2)) / (2 * np.pi * SIGMA ** 2)
|
|
105
|
+
out += np.tensordot(W, K, 1)
|
|
106
|
+
return out.flatten()
|
|
107
|
+
|
|
108
|
+
|
|
109
|
+
def rho(h: pd.DataFrame) -> np.ndarray:
|
|
110
|
+
"""Concatenate the H1 and H2 persistence images into an 800-value vector."""
|
|
111
|
+
return np.concatenate([image(lifetimes(h, 1)), image(lifetimes(h, 2))])
|
|
112
|
+
|
|
113
|
+
|
|
114
|
+
def objective(rho_by_cell: dict, lowers: np.ndarray, uppers: np.ndarray) -> dict:
|
|
115
|
+
"""Score neighboring image differences per unit of threshold change.
|
|
116
|
+
|
|
117
|
+
Keys are (upper_index, lower_index). Threshold arrays must be strictly
|
|
118
|
+
increasing, and rho_by_cell must contain every grid cell. The first lower
|
|
119
|
+
column supplies neighbors but cannot be selected. Directional means are
|
|
120
|
+
combined using the Euclidean norm.
|
|
121
|
+
"""
|
|
122
|
+
lowers, uppers = np.asarray(lowers, float), np.asarray(uppers, float)
|
|
123
|
+
if any(a.ndim != 1 or not np.isfinite(a).all() or np.any(np.diff(a) <= 0)
|
|
124
|
+
for a in (lowers, uppers)) or len(lowers) < 2 or len(uppers) < 1:
|
|
125
|
+
raise ValueError("Use increasing finite thresholds, with >=2 lower and >=1 upper values.")
|
|
126
|
+
n_i, n_j = len(uppers), len(lowers)
|
|
127
|
+
if set(rho_by_cell) != {(i, j) for i in range(n_i) for j in range(n_j)}:
|
|
128
|
+
raise ValueError("Images must contain the complete threshold grid.")
|
|
129
|
+
vectors = [np.asarray(v, float) for v in rho_by_cell.values()]
|
|
130
|
+
if any(v.ndim != 1 or v.shape != vectors[0].shape or not np.isfinite(v).all()
|
|
131
|
+
for v in vectors):
|
|
132
|
+
raise ValueError("Images must be finite vectors of equal length.")
|
|
133
|
+
def dist(a, b):
|
|
134
|
+
return float(np.linalg.norm(rho_by_cell[a] - rho_by_cell[b], ord=2))
|
|
135
|
+
out = {}
|
|
136
|
+
for i in range(n_i):
|
|
137
|
+
for j in range(1, n_j):
|
|
138
|
+
if (i, j) not in rho_by_cell:
|
|
139
|
+
continue
|
|
140
|
+
terms_l = [dist((i, j), (i, j - 1)) / abs(lowers[j] - lowers[j - 1])]
|
|
141
|
+
if j + 1 < n_j and (i, j + 1) in rho_by_cell:
|
|
142
|
+
terms_l.append(dist((i, j), (i, j + 1)) / abs(lowers[j + 1] - lowers[j]))
|
|
143
|
+
terms_u = []
|
|
144
|
+
if i - 1 >= 0 and (i - 1, j) in rho_by_cell:
|
|
145
|
+
terms_u.append(dist((i, j), (i - 1, j)) / abs(uppers[i] - uppers[i - 1]))
|
|
146
|
+
if i + 1 < n_i and (i + 1, j) in rho_by_cell:
|
|
147
|
+
terms_u.append(dist((i, j), (i + 1, j)) / abs(uppers[i + 1] - uppers[i]))
|
|
148
|
+
gl = sum(terms_l) / len(terms_l)
|
|
149
|
+
gu = sum(terms_u) / len(terms_u) if terms_u else 0.0
|
|
150
|
+
out[(i, j)] = float(np.linalg.norm([gl, gu], ord=2))
|
|
151
|
+
return out
|
|
152
|
+
|
|
153
|
+
|
|
154
|
+
def select(mag: dict, f1: dict, f2: dict, delta1: float, delta2: float):
|
|
155
|
+
"""Minimize the score subject to H1/H2 count-percentile constraints.
|
|
156
|
+
|
|
157
|
+
Percentiles range from 0 to 100 and use all selectable cells. Return the
|
|
158
|
+
minimum's cell and the cells within absolute score tolerance 1e-12 of it.
|
|
159
|
+
Exact minima use sorted cell order; an infeasible setting returns (None, []).
|
|
160
|
+
"""
|
|
161
|
+
keys = sorted(mag)
|
|
162
|
+
if not keys:
|
|
163
|
+
raise ValueError("Supply at least one selectable cell.")
|
|
164
|
+
F1 = np.array([f1[k] for k in keys], float)
|
|
165
|
+
F2 = np.array([f2[k] for k in keys], float)
|
|
166
|
+
W = np.array([mag[k] for k in keys], float)
|
|
167
|
+
if not np.isfinite([F1, F2, W]).all() or np.any(F1 < 0) or np.any(F2 < 0):
|
|
168
|
+
raise ValueError("Scores and counts must be finite; counts must be nonnegative.")
|
|
169
|
+
d1, d2 = np.percentile(F1, delta1), np.percentile(F2, delta2)
|
|
170
|
+
feas = (F1 >= d1) & (F2 >= d2)
|
|
171
|
+
if not feas.any():
|
|
172
|
+
return None, []
|
|
173
|
+
Wm = np.where(feas, W, np.inf)
|
|
174
|
+
best = Wm.min()
|
|
175
|
+
ties = [keys[t] for t in np.flatnonzero(np.isclose(Wm, best, rtol=0, atol=1e-12))]
|
|
176
|
+
return keys[int(np.argmin(Wm))], ties
|
|
177
|
+
|
|
178
|
+
|
|
179
|
+
def threshold(graph, *, lower, upper, node_attribute=None, edge_attribute=None,
|
|
180
|
+
filtration="filtration", filtration_range=None,
|
|
181
|
+
constraints=(50, 25), return_details=False):
|
|
182
|
+
"""Select and return a thresholded NetworkX graph.
|
|
183
|
+
|
|
184
|
+
Choose one scalar node or edge attribute for the inclusive threshold band.
|
|
185
|
+
Edge entry values may use any finite numerical range. Normalize once using
|
|
186
|
+
filtration_range or the full input graph's observed range. Every candidate
|
|
187
|
+
uses those same bounds; all vertices enter at normalized zero.
|
|
188
|
+
The input graph is unchanged. Infeasible constraints return None.
|
|
189
|
+
With return_details=True, return (network, details), including the grid,
|
|
190
|
+
persistence diagrams and images used in the calculation.
|
|
191
|
+
"""
|
|
192
|
+
import networkx as nx
|
|
193
|
+
if not isinstance(graph, nx.Graph) or graph.is_directed() or graph.is_multigraph():
|
|
194
|
+
raise ValueError("Supply a simple undirected NetworkX graph.")
|
|
195
|
+
if nx.number_of_selfloops(graph):
|
|
196
|
+
raise ValueError("Self-loops are not supported.")
|
|
197
|
+
if (node_attribute is None) == (edge_attribute is None):
|
|
198
|
+
raise ValueError("Choose exactly one node_attribute or edge_attribute.")
|
|
199
|
+
lower, upper = np.asarray(lower, float), np.asarray(upper, float)
|
|
200
|
+
if (lower.ndim != 1 or upper.ndim != 1 or len(lower) < 2 or len(upper) < 1
|
|
201
|
+
or not np.isfinite(lower).all() or not np.isfinite(upper).all()
|
|
202
|
+
or np.any(np.diff(lower) <= 0) or np.any(np.diff(upper) <= 0)):
|
|
203
|
+
raise ValueError("Supply increasing finite lower and upper arrays (at least 2 and 1 values).")
|
|
204
|
+
if len(constraints) != 2 or not np.isfinite(constraints).all() or any(
|
|
205
|
+
p < 0 or p > 100 for p in constraints):
|
|
206
|
+
raise ValueError("Supply two constraint percentiles between 0 and 100.")
|
|
207
|
+
attribute = node_attribute or edge_attribute
|
|
208
|
+
records = graph.nodes(data=True) if node_attribute else graph.edges(data=True)
|
|
209
|
+
for *_, data in records:
|
|
210
|
+
if attribute not in data or not np.isfinite(data[attribute]):
|
|
211
|
+
raise ValueError(f"Every selected element needs a finite {attribute!r} attribute.")
|
|
212
|
+
for _, _, data in graph.edges(data=True):
|
|
213
|
+
if filtration not in data:
|
|
214
|
+
raise ValueError(f"Every edge needs a {filtration!r} filtration value.")
|
|
215
|
+
limits = _filtration_bounds((d[filtration] for _, _, d in graph.edges(data=True)),
|
|
216
|
+
filtration_range)
|
|
217
|
+
|
|
218
|
+
def candidate(lo, hi):
|
|
219
|
+
if node_attribute:
|
|
220
|
+
return graph.subgraph(n for n, d in graph.nodes(data=True)
|
|
221
|
+
if lo <= d[attribute] <= hi).copy()
|
|
222
|
+
result = graph.copy()
|
|
223
|
+
result.remove_edges_from((a, b) for a, b, d in graph.edges(data=True)
|
|
224
|
+
if not lo <= d[attribute] <= hi)
|
|
225
|
+
return result
|
|
226
|
+
|
|
227
|
+
images, diagrams, h1, h2, rows = {}, {}, {}, {}, []
|
|
228
|
+
for i, hi in enumerate(upper):
|
|
229
|
+
for j, lo in enumerate(lower):
|
|
230
|
+
cell = (i, j)
|
|
231
|
+
network = candidate(lo, hi)
|
|
232
|
+
edges = {(a, b): d[filtration] for a, b, d in network.edges(data=True)}
|
|
233
|
+
diagram = persistence(list(network), edges, *limits)
|
|
234
|
+
diagrams[cell], images[cell] = diagram, rho(diagram)
|
|
235
|
+
h1[cell] = int((diagram.dimension == 1).sum())
|
|
236
|
+
h2[cell] = int((diagram.dimension == 2).sum())
|
|
237
|
+
rows.append({"upper_index": i, "lower_index": j, "lower": lo, "upper": hi,
|
|
238
|
+
"nodes": len(network), "edges": network.number_of_edges(),
|
|
239
|
+
"H1": h1[cell], "H2": h2[cell]})
|
|
240
|
+
scores = objective(images, lower, upper)
|
|
241
|
+
cell, ties = select(scores, h1, h2, *constraints)
|
|
242
|
+
for row in rows:
|
|
243
|
+
key = (row["upper_index"], row["lower_index"])
|
|
244
|
+
row.update(selectable=key in scores, score=scores.get(key, np.nan))
|
|
245
|
+
network = None if cell is None else candidate(lower[cell[1]], upper[cell[0]])
|
|
246
|
+
if network is not None:
|
|
247
|
+
network.graph["hons"] = {"lower": float(lower[cell[1]]), "upper": float(upper[cell[0]]),
|
|
248
|
+
"score": scores[cell], "H1": h1[cell], "H2": h2[cell]}
|
|
249
|
+
if return_details:
|
|
250
|
+
return network, {"cell": cell, "ties": ties, "grid": pd.DataFrame(rows),
|
|
251
|
+
"images": images, "diagrams": diagrams, "scores": scores,
|
|
252
|
+
"H1": h1, "H2": h2, "lower": lower, "upper": upper,
|
|
253
|
+
"filtration_range": limits}
|
|
254
|
+
return network
|
|
255
|
+
|
|
256
|
+
|
|
257
|
+
def example_network(seed=7):
|
|
258
|
+
"""Create a small NetworkX example with cycles, cavities and extra connections.
|
|
259
|
+
|
|
260
|
+
Node 'weight' is the threshold attribute; edge 'filtration' gives entry
|
|
261
|
+
values in [0, 1]. All observations are generated, with no empirical records.
|
|
262
|
+
"""
|
|
263
|
+
import networkx as nx
|
|
264
|
+
rng = np.random.default_rng(seed)
|
|
265
|
+
graph = nx.Graph()
|
|
266
|
+
for block in range(3):
|
|
267
|
+
base = 6 * block
|
|
268
|
+
for i in range(6):
|
|
269
|
+
graph.add_node(base + i, weight=float([4, 5, 6, 4, 5, 6][i]))
|
|
270
|
+
for a, b in itertools.combinations(range(6), 2):
|
|
271
|
+
if a // 2 != b // 2:
|
|
272
|
+
graph.add_edge(base + a, base + b, filtration=float(rng.uniform(.05, .35)))
|
|
273
|
+
graph.add_edge(base, base + 1, filtration=.8)
|
|
274
|
+
for a, b in [(0, 6), (6, 12)]:
|
|
275
|
+
graph.add_edge(a, b, filtration=.4)
|
|
276
|
+
for i in range(18, 26):
|
|
277
|
+
graph.add_node(i, weight=float(rng.choice([.5, 1.5, 2.5])))
|
|
278
|
+
for target in rng.choice(18, size=3, replace=False):
|
|
279
|
+
graph.add_edge(i, int(target), filtration=float(rng.uniform(.4, .7)))
|
|
280
|
+
for i in range(26, 29):
|
|
281
|
+
graph.add_node(i, weight=9.0)
|
|
282
|
+
for target in range(26):
|
|
283
|
+
graph.add_edge(i, target, filtration=float(rng.uniform(.85, 1)))
|
|
284
|
+
return graph
|