hiplot-plus 0.1.0__py3-none-any.whl
This diff represents the content of publicly available package versions that have been released to one of the supported registries. The information contained in this diff is provided for informational purposes only and reflects changes between package versions as they appear in their respective public registries.
- hiplot/__init__.py +38 -0
- hiplot/__main__.py +10 -0
- hiplot/compress.py +70 -0
- hiplot/csvvalues.py +83 -0
- hiplot/experiment.py +637 -0
- hiplot/fetchers.py +322 -0
- hiplot/fetchers_demo.py +459 -0
- hiplot/ipython.py +217 -0
- hiplot/pkginfo.py +15 -0
- hiplot/py.typed +0 -0
- hiplot/render.py +141 -0
- hiplot/server.py +76 -0
- hiplot/static/built/hiplot.bundle.js +1224 -0
- hiplot/static/built/streamlit_component/hiplot_streamlit.bundle.js +1220 -0
- hiplot/static/built/streamlit_component/index.html +16 -0
- hiplot/static/icon.png +0 -0
- hiplot/streamlit_helpers.py +127 -0
- hiplot/templates/index.html +68 -0
- hiplot_plus-0.1.0.dist-info/METADATA +197 -0
- hiplot_plus-0.1.0.dist-info/RECORD +24 -0
- hiplot_plus-0.1.0.dist-info/WHEEL +4 -0
- hiplot_plus-0.1.0.dist-info/entry_points.txt +4 -0
- hiplot_plus-0.1.0.dist-info/licenses/LICENSE +21 -0
- hiplot_plus-0.1.0.dist-info/licenses/NOTICE +207 -0
|
@@ -0,0 +1,16 @@
|
|
|
1
|
+
<!doctype html>
|
|
2
|
+
<html lang="en">
|
|
3
|
+
<head>
|
|
4
|
+
<meta charset="utf-8" />
|
|
5
|
+
<meta name="viewport" content="width=device-width, initial-scale=1" />
|
|
6
|
+
<meta name="theme-color" content="#000000" />
|
|
7
|
+
<meta name="description" content="Streamlit Component" />
|
|
8
|
+
<title>Streamlit Component</title>
|
|
9
|
+
</head>
|
|
10
|
+
<body>
|
|
11
|
+
<noscript>You need to enable JavaScript to run this app.</noscript>
|
|
12
|
+
<div id="root"></div>
|
|
13
|
+
|
|
14
|
+
<script src="hiplot_streamlit.bundle.js" type="text/javascript"></script>
|
|
15
|
+
</body>
|
|
16
|
+
</html>
|
hiplot/static/icon.png
ADDED
|
Binary file
|
|
@@ -0,0 +1,127 @@
|
|
|
1
|
+
# Copyright (c) Facebook, Inc. and its affiliates.
|
|
2
|
+
# This source code is licensed under the MIT license found in the
|
|
3
|
+
# LICENSE file in the root directory of this source tree.
|
|
4
|
+
|
|
5
|
+
import json
|
|
6
|
+
import typing as tp
|
|
7
|
+
import uuid
|
|
8
|
+
import warnings
|
|
9
|
+
from pathlib import Path
|
|
10
|
+
|
|
11
|
+
from .experiment import Experiment, _is_running_ipython
|
|
12
|
+
|
|
13
|
+
|
|
14
|
+
class _StreamlitHelpers:
|
|
15
|
+
component: tp.Callable[..., tp.Any] | None = None
|
|
16
|
+
|
|
17
|
+
@staticmethod
|
|
18
|
+
def is_running_within_streamlit() -> bool:
|
|
19
|
+
try:
|
|
20
|
+
from streamlit import runtime
|
|
21
|
+
except ImportError:
|
|
22
|
+
return False
|
|
23
|
+
return bool(runtime.exists())
|
|
24
|
+
|
|
25
|
+
@classmethod
|
|
26
|
+
def create_component(cls) -> tp.Callable[..., tp.Any]:
|
|
27
|
+
if cls.component is not None:
|
|
28
|
+
return cls.component
|
|
29
|
+
try:
|
|
30
|
+
from streamlit import runtime
|
|
31
|
+
except ImportError as e:
|
|
32
|
+
raise ImportError(
|
|
33
|
+
"Streamlit is required for Streamlit support. Install it with: pip install hiplot-plus[streamlit]"
|
|
34
|
+
) from e
|
|
35
|
+
try:
|
|
36
|
+
import streamlit.components.v1 as components
|
|
37
|
+
except ModuleNotFoundError as e:
|
|
38
|
+
import streamlit as st
|
|
39
|
+
|
|
40
|
+
raise RuntimeError(f"""Your streamlit version ({st.__version__}) is too old and does not support components.
|
|
41
|
+
Please update streamlit with `pip install -U streamlit`""") from e
|
|
42
|
+
assert runtime.exists()
|
|
43
|
+
|
|
44
|
+
built_path = (Path(__file__).parent / "static" / "built" / "streamlit_component").resolve()
|
|
45
|
+
assert (built_path / "index.html").is_file(), f"""HiPlot component does not appear to exist in {built_path}
|
|
46
|
+
If you did not install hiplot using official channels (pip, conda...), maybe you forgot to build javascript files?
|
|
47
|
+
See https://poipoi300.github.io/hiplot/contributing.html#building-javascript-bundle
|
|
48
|
+
"""
|
|
49
|
+
component: tp.Callable[..., tp.Any] = components.declare_component("hiplot", path=str(built_path))
|
|
50
|
+
cls.component = component
|
|
51
|
+
return component
|
|
52
|
+
|
|
53
|
+
|
|
54
|
+
class ExperimentStreamlitComponent:
|
|
55
|
+
def __init__(self, experiment: Experiment, key: str | None, ret: str | list[str] | None) -> None:
|
|
56
|
+
if key is None:
|
|
57
|
+
warnings.warn(
|
|
58
|
+
r"""Creating a HiPlot component with key=None will make refreshes slower.
|
|
59
|
+
Please use `experiment.to_streamlit(..., key=\"some_unique_key\")`""",
|
|
60
|
+
stacklevel=3,
|
|
61
|
+
)
|
|
62
|
+
key = f"hiplot_autogen_{uuid.uuid4()!s}"
|
|
63
|
+
self._exp_json = json.dumps(experiment._payload(), allow_nan=False)
|
|
64
|
+
self._key = key
|
|
65
|
+
self._ret = ret
|
|
66
|
+
self._js_default_ret = tuple(self.get_default_return_for(experiment, ret=r) for r in self.js_ret_spec)
|
|
67
|
+
|
|
68
|
+
@property
|
|
69
|
+
def js_ret_spec(self) -> list[str]:
|
|
70
|
+
if self._ret is None:
|
|
71
|
+
return []
|
|
72
|
+
if isinstance(self._ret, str):
|
|
73
|
+
return [self._ret]
|
|
74
|
+
assert isinstance(self._ret, (tuple, list)), (
|
|
75
|
+
"HiPlot: Invalid return type specification. Should be `None`, a string, a list or a tuple."
|
|
76
|
+
)
|
|
77
|
+
return list(self._ret)
|
|
78
|
+
|
|
79
|
+
@classmethod
|
|
80
|
+
def get_default_return(cls, experiment: Experiment, ret: str | list[str] | None) -> tp.Any:
|
|
81
|
+
if ret is None:
|
|
82
|
+
return None
|
|
83
|
+
if isinstance(ret, str):
|
|
84
|
+
return cls.get_default_return_for(experiment, ret)
|
|
85
|
+
assert isinstance(ret, (tuple, list)), (
|
|
86
|
+
"HiPlot: Invalid return type specification. Should be `None`, a string, a list or a tuple."
|
|
87
|
+
)
|
|
88
|
+
return tuple(cls.get_default_return(experiment, r) for r in ret)
|
|
89
|
+
|
|
90
|
+
@staticmethod
|
|
91
|
+
def get_default_return_for(experiment: Experiment, ret: str) -> tp.Any:
|
|
92
|
+
if ret == "brush_extents":
|
|
93
|
+
return ()
|
|
94
|
+
if ret in ["selected_uids", "filtered_uids"]:
|
|
95
|
+
return tuple(dp.uid for dp in experiment.datapoints)
|
|
96
|
+
raise RuntimeError(f'HiPlot: Unknown return type "{ret}"')
|
|
97
|
+
|
|
98
|
+
def display(self) -> tp.Any:
|
|
99
|
+
if not _StreamlitHelpers.is_running_within_streamlit():
|
|
100
|
+
if _is_running_ipython():
|
|
101
|
+
raise RuntimeError(r"""`experiment.display_st` can only be called in a streamlit script.
|
|
102
|
+
It appears that you are trying to create a HiPlot visualization in ipython:
|
|
103
|
+
you should use `display` instead of `display_st`""")
|
|
104
|
+
raise RuntimeError(r"""`experiment.display_st` can only be called in a streamlit script.
|
|
105
|
+
To render an experiment to HTML, use `experiment.to_html(file_name)` or `html_page = experiment.to_html()`""")
|
|
106
|
+
|
|
107
|
+
component = _StreamlitHelpers.create_component()
|
|
108
|
+
|
|
109
|
+
js_ret = component(experiment=self._exp_json, ret=self.js_ret_spec, key=self._key)
|
|
110
|
+
|
|
111
|
+
if js_ret is None:
|
|
112
|
+
js_ret = self._js_default_ret
|
|
113
|
+
assert len(self._js_default_ret) == len(js_ret), (
|
|
114
|
+
f"JS returned {len(js_ret)} fields, expected {len(self._js_default_ret)} (ret={self._ret})"
|
|
115
|
+
)
|
|
116
|
+
|
|
117
|
+
for idx in range(len(self.js_ret_spec)):
|
|
118
|
+
if js_ret[idx] is not None:
|
|
119
|
+
continue
|
|
120
|
+
# Use default value
|
|
121
|
+
js_ret = self._js_default_ret[idx]
|
|
122
|
+
|
|
123
|
+
if not js_ret:
|
|
124
|
+
return None
|
|
125
|
+
if isinstance(self._ret, str):
|
|
126
|
+
return js_ret[0]
|
|
127
|
+
return js_ret
|
|
@@ -0,0 +1,68 @@
|
|
|
1
|
+
<!doctype html>
|
|
2
|
+
<html>
|
|
3
|
+
<head>
|
|
4
|
+
<meta http-equiv="Content-Type" content="text/html;charset=utf-8" />
|
|
5
|
+
<title>HiPlot</title>
|
|
6
|
+
<link rel="icon" href="static/icon.png" />
|
|
7
|
+
<style>
|
|
8
|
+
/*
|
|
9
|
+
* Only when HiPlot is the whole page: a notebook embeds this markup in its
|
|
10
|
+
* own body, where these selectors match nothing. The HiPlot theme fills
|
|
11
|
+
* the viewport; until it renders, the page follows the system theme.
|
|
12
|
+
*/
|
|
13
|
+
body:has(> .hiplot-page) {
|
|
14
|
+
margin: 0;
|
|
15
|
+
}
|
|
16
|
+
body > .hiplot-page {
|
|
17
|
+
display: flex;
|
|
18
|
+
flex-direction: column;
|
|
19
|
+
min-height: 100vh;
|
|
20
|
+
}
|
|
21
|
+
body > .hiplot-page > * {
|
|
22
|
+
flex: 1 0 auto;
|
|
23
|
+
}
|
|
24
|
+
@media (prefers-color-scheme: dark) {
|
|
25
|
+
body:has(> .hiplot-page) {
|
|
26
|
+
background: #15181c;
|
|
27
|
+
color: #e4e7eb;
|
|
28
|
+
}
|
|
29
|
+
}
|
|
30
|
+
</style>
|
|
31
|
+
</head>
|
|
32
|
+
<body>
|
|
33
|
+
<div id="hiplot_element_id" class="hiplot-page">
|
|
34
|
+
<div style="text-align: center">Loading HiPlot...</div>
|
|
35
|
+
<noscript> HiPlot needs JavaScript to run </noscript>
|
|
36
|
+
</div>
|
|
37
|
+
|
|
38
|
+
<!--HIPLOT_DATA-->
|
|
39
|
+
<script src="static/built/hiplot.bundle.js" type="text/javascript">
|
|
40
|
+
/*BUNDLE_FILE*/
|
|
41
|
+
</script>
|
|
42
|
+
<script type="text/javascript">
|
|
43
|
+
function _hiplot_setup() {
|
|
44
|
+
if (typeof hiplot == "undefined") {
|
|
45
|
+
console.info("waiting for HiPlot bundle to be loaded...");
|
|
46
|
+
setTimeout(_hiplot_setup, 1000);
|
|
47
|
+
return;
|
|
48
|
+
}
|
|
49
|
+
var options = {};
|
|
50
|
+
var _sp = new URLSearchParams(location.search);
|
|
51
|
+
var _provider = _sp.get("provider");
|
|
52
|
+
if (_provider) {
|
|
53
|
+
options.dataProviderName = _provider;
|
|
54
|
+
}
|
|
55
|
+
/*ON_LOAD_SCRIPT_INJECT*/
|
|
56
|
+
var hiplot_instance = hiplot.render(document.getElementById("hiplot_element_id"), options);
|
|
57
|
+
Object.assign(window, { hiplot_last_instance: hiplot_instance }); // For debugging
|
|
58
|
+
/*AFTER_SETUP_SCRIPT_INJECT*/
|
|
59
|
+
}
|
|
60
|
+
if (document.readyState == "loading") {
|
|
61
|
+
document.addEventListener("DOMContentLoaded", _hiplot_setup);
|
|
62
|
+
} else {
|
|
63
|
+
// Either "complete" or "interactive"
|
|
64
|
+
_hiplot_setup();
|
|
65
|
+
}
|
|
66
|
+
</script>
|
|
67
|
+
</body>
|
|
68
|
+
</html>
|
|
@@ -0,0 +1,197 @@
|
|
|
1
|
+
Metadata-Version: 2.5
|
|
2
|
+
Name: hiplot-plus
|
|
3
|
+
Version: 0.1.0
|
|
4
|
+
Summary: High dimensional Interactive Plotting tool
|
|
5
|
+
Project-URL: Homepage, https://github.com/poipoi300/hiplot
|
|
6
|
+
Project-URL: Documentation, https://poipoi300.github.io/hiplot/
|
|
7
|
+
Project-URL: Repository, https://github.com/poipoi300/hiplot
|
|
8
|
+
Author: Facebook AI Research, mathematicalmichael @ Mind the Math, LLC
|
|
9
|
+
License-Expression: MIT
|
|
10
|
+
License-File: LICENSE
|
|
11
|
+
License-File: NOTICE
|
|
12
|
+
Classifier: Development Status :: 4 - Beta
|
|
13
|
+
Classifier: Intended Audience :: Developers
|
|
14
|
+
Classifier: Intended Audience :: Science/Research
|
|
15
|
+
Classifier: Operating System :: OS Independent
|
|
16
|
+
Classifier: Programming Language :: Python :: 3
|
|
17
|
+
Classifier: Programming Language :: Python :: 3.12
|
|
18
|
+
Classifier: Programming Language :: Python :: 3.13
|
|
19
|
+
Classifier: Programming Language :: Python :: 3.14
|
|
20
|
+
Classifier: Programming Language :: Python :: 3.15
|
|
21
|
+
Classifier: Topic :: Scientific/Engineering :: Visualization
|
|
22
|
+
Requires-Python: >=3.12
|
|
23
|
+
Requires-Dist: beautifulsoup4
|
|
24
|
+
Requires-Dist: jinja2>=3.1.6
|
|
25
|
+
Provides-Extra: all
|
|
26
|
+
Requires-Dist: flask; extra == 'all'
|
|
27
|
+
Requires-Dist: flask-compress; extra == 'all'
|
|
28
|
+
Requires-Dist: ipykernel; extra == 'all'
|
|
29
|
+
Requires-Dist: ipython>=7.0.1; extra == 'all'
|
|
30
|
+
Requires-Dist: streamlit>=0.63; extra == 'all'
|
|
31
|
+
Provides-Extra: notebook
|
|
32
|
+
Requires-Dist: ipykernel; extra == 'notebook'
|
|
33
|
+
Requires-Dist: ipython>=7.0.1; extra == 'notebook'
|
|
34
|
+
Provides-Extra: server
|
|
35
|
+
Requires-Dist: flask; extra == 'server'
|
|
36
|
+
Requires-Dist: flask-compress; extra == 'server'
|
|
37
|
+
Provides-Extra: streamlit
|
|
38
|
+
Requires-Dist: streamlit>=0.63; extra == 'streamlit'
|
|
39
|
+
Description-Content-Type: text/markdown
|
|
40
|
+
|
|
41
|
+
# HiPlot - High dimensional Interactive Plotting
|
|
42
|
+
|
|
43
|
+
## About this fork
|
|
44
|
+
|
|
45
|
+
Thanks to [Facebook Research](https://github.com/facebookresearch/hiplot) for creating HiPlot, and to [Mind the Math](https://github.com/mindthemath/hiplot) for keeping it alive after the original was archived. This fork builds on their work; it is not affiliated with either.
|
|
46
|
+
|
|
47
|
+
What changed:
|
|
48
|
+
|
|
49
|
+
- **Rendering:** WebGL2 density lines with exact anti-aliasing and colors mapped by value, with a choice of what overlapping lines show (mean, lowest or highest). 100,000 rows by 30 columns stay interactive.
|
|
50
|
+
- **Parallel plot:** several brushes per axis, value tags on brushes, axes that face the color gradient (high colors at the top), horizontal scrolling with middle-click autoscroll, spline lines and a searchable Columns menu.
|
|
51
|
+
- **Scatter plots:** XY, one-axis and 3D panels with lasso selection, a shared axis picker and correlation and regression fits.
|
|
52
|
+
- **Table:** multi-level sorting, column filters and aligned numbers.
|
|
53
|
+
- **Look:** a redesigned light and dark theme, colorblind-safe palettes and a color legend.
|
|
54
|
+
- **Data:** compact columnar transfer, NaN, inf and missing-value spellings read as such, numeric uids.
|
|
55
|
+
- **Example:** a real GPU hyperparameter search in [examples/hptuning](examples/hptuning), with trials stored as Parquet.
|
|
56
|
+
- **Engineering:** Python 3.12 to 3.15, ruff and mypy --strict, TypeScript strict and Biome, Playwright browser tests, and commit and push gates requiring 90% coverage of changed lines across all suites.
|
|
57
|
+
|
|
58
|
+
|
|
59
|
+

|
|
60
|
+
|
|
61
|
+
[](https://github.com/poipoi300/hiplot/actions/workflows/ci.yml)
|
|
62
|
+
[](https://github.com/poipoi300/hiplot/actions/workflows/release.yml)
|
|
63
|
+
[](https://opensource.org/licenses/MIT)
|
|
64
|
+
[](https://pypi.python.org/pypi/hiplot-plus/)
|
|
65
|
+
[](https://pypi.python.org/pypi/hiplot-plus/)
|
|
66
|
+
[](https://colab.research.google.com/github/poipoi300/hiplot/blob/main/examples/HiPlotColabExample.ipynb)
|
|
67
|
+
|
|
68
|
+
> **Community-maintained fork**: This is a community-maintained fork of [Facebook Research's HiPlot](https://github.com/facebookresearch/hiplot), which has been archived. We aim to keep the project alive with bug fixes, security updates, and new features.
|
|
69
|
+
|
|
70
|
+
HiPlot is a lightweight interactive visualization tool to help AI researchers discover correlations and patterns in high-dimensional data using parallel plots and other graphical ways to represent information.
|
|
71
|
+
|
|
72
|
+
### [Try a demo now with sweep data](https://poipoi300.github.io/hiplot/_static/demo/ml1.csv.html) or [upload your CSV](https://poipoi300.github.io/hiplot/_static/hiplot_upload.html) or [](https://colab.research.google.com/github/poipoi300/hiplot/blob/main/examples/HiPlotColabExample.ipynb)
|
|
73
|
+
|
|
74
|
+
There are several modes to HiPlot:
|
|
75
|
+
|
|
76
|
+
- As a web-server (if your data is a CSV for instance)
|
|
77
|
+
- In a jupyter notebook (to visualize python data), or in [Streamlit apps](https://poipoi300.github.io/hiplot/tuto_streamlit.html)
|
|
78
|
+
- In CLI to render standalone HTML
|
|
79
|
+
|
|
80
|
+
## Quick Start
|
|
81
|
+
|
|
82
|
+
```bash
|
|
83
|
+
# Render a CSV to interactive HTML (no install needed)
|
|
84
|
+
uvx hiplot-plus data.csv > output.html
|
|
85
|
+
|
|
86
|
+
# Or start an interactive server
|
|
87
|
+
uvx --from 'hiplot-plus[server]' hiplot --port 8765
|
|
88
|
+
```
|
|
89
|
+
|
|
90
|
+
## Installation
|
|
91
|
+
|
|
92
|
+
```bash
|
|
93
|
+
# Core package (HTML export, CLI rendering)
|
|
94
|
+
pip install hiplot-plus
|
|
95
|
+
|
|
96
|
+
# With Jupyter notebook support
|
|
97
|
+
pip install hiplot-plus[notebook]
|
|
98
|
+
|
|
99
|
+
# With web server support (hiplot command)
|
|
100
|
+
pip install hiplot-plus[server]
|
|
101
|
+
|
|
102
|
+
# With Streamlit support
|
|
103
|
+
pip install hiplot-plus[streamlit]
|
|
104
|
+
|
|
105
|
+
# Everything
|
|
106
|
+
pip install hiplot-plus[all]
|
|
107
|
+
```
|
|
108
|
+
|
|
109
|
+
If you have a Jupyter notebook, you can get started with something as simple as:
|
|
110
|
+
|
|
111
|
+
```python
|
|
112
|
+
import hiplot as hip
|
|
113
|
+
|
|
114
|
+
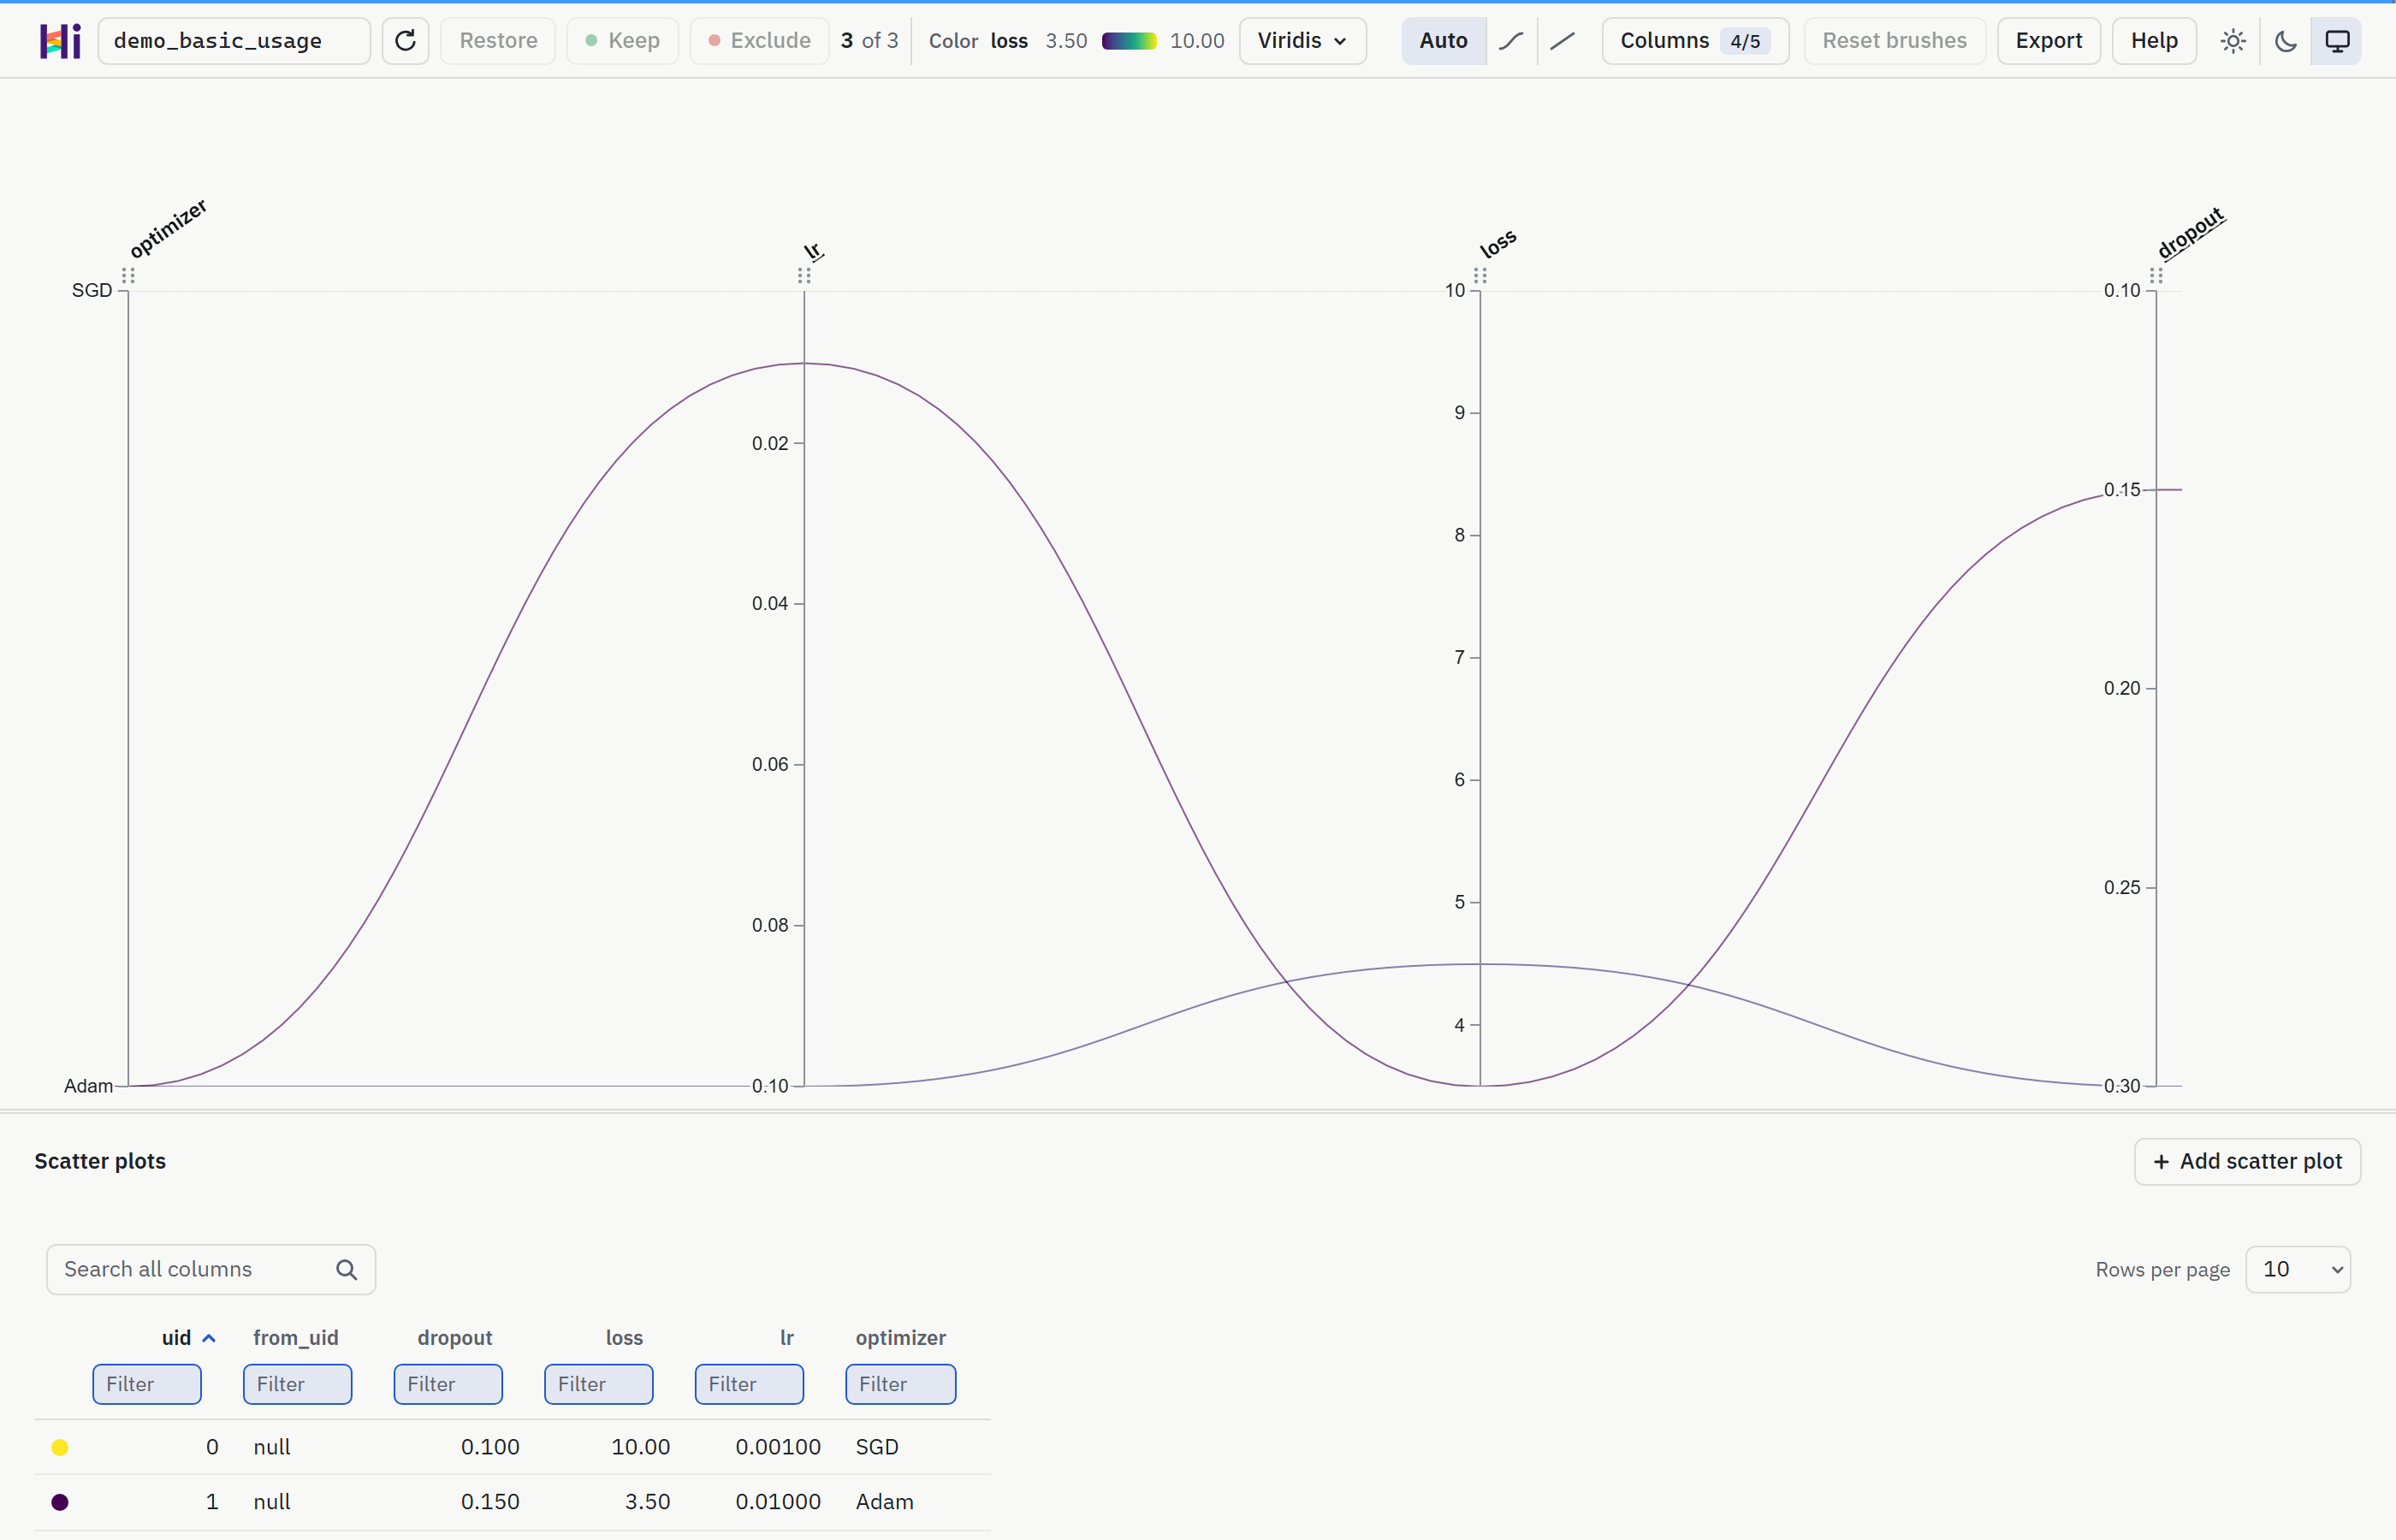
data = [
|
|
115
|
+
{"dropout": 0.1, "lr": 0.001, "loss": 10.0, "optimizer": "SGD"},
|
|
116
|
+
{"dropout": 0.15, "lr": 0.01, "loss": 3.5, "optimizer": "Adam"},
|
|
117
|
+
{"dropout": 0.3, "lr": 0.1, "loss": 4.5, "optimizer": "Adam"},
|
|
118
|
+
]
|
|
119
|
+
exp = hip.Experiment.from_iterable(data)
|
|
120
|
+
exp.colorby = "loss"
|
|
121
|
+
exp.display()
|
|
122
|
+
```
|
|
123
|
+
|
|
124
|
+
### [See the live result](https://poipoi300.github.io/hiplot/_static/demo/demo_basic_usage.html)
|
|
125
|
+
|
|
126
|
+
|
|
127
|
+
|
|
128
|
+
## Links
|
|
129
|
+
|
|
130
|
+
- Repository: https://github.com/poipoi300/hiplot
|
|
131
|
+
- Documentation: https://poipoi300.github.io/hiplot/
|
|
132
|
+
- PyPI package: https://pypi.org/project/hiplot-plus/
|
|
133
|
+
- Examples: https://github.com/poipoi300/hiplot/tree/main/examples
|
|
134
|
+
- Original blog post: https://ai.facebook.com/blog/hiplot-high-dimensional-interactive-plots-made-easy/
|
|
135
|
+
|
|
136
|
+
## Development
|
|
137
|
+
|
|
138
|
+
HiPlot is Python 3.12+ (built with [uv](https://docs.astral.sh/uv/)) plus a
|
|
139
|
+
TypeScript frontend (React, d3, built with [Bun](https://bun.sh) and Vite).
|
|
140
|
+
Contributor rules, including for coding agents, are in [AGENTS.md](AGENTS.md).
|
|
141
|
+
|
|
142
|
+
```bash
|
|
143
|
+
bun install && uv sync # dependencies
|
|
144
|
+
bun run build # JavaScript bundles into hiplot/static/built/
|
|
145
|
+
uv run pre-commit install -t pre-commit -t pre-push # quality gates, once
|
|
146
|
+
uv run --extra server hiplot --port 8765 # dev server (load `demo`)
|
|
147
|
+
```
|
|
148
|
+
|
|
149
|
+
| Task | Command |
|
|
150
|
+
|---|---|
|
|
151
|
+
| Python tests | `uv run pytest` |
|
|
152
|
+
| Frontend unit tests | `bun test` |
|
|
153
|
+
| End-to-end tests (Playwright) | `bun run test:js` |
|
|
154
|
+
| Format and lint | `uv run ruff format . && uv run ruff check .` · `bun run biome check --write .` |
|
|
155
|
+
| Type checks | `uv run mypy .` · `bun run typecheck` |
|
|
156
|
+
| Every commit gate | `uv run pre-commit run --all-files` |
|
|
157
|
+
| Tests + 90% diff coverage (push gate) | `bash tools/stack_coverage_gate.sh` |
|
|
158
|
+
| Rendering benchmark | `bash bench/run.sh` (results in [docs/PERFORMANCE.md](docs/PERFORMANCE.md)) |
|
|
159
|
+
| Docs | `uv run --no-default-groups --group docs sphinx-build -b html docs docs/_build/html` |
|
|
160
|
+
| Package | `bun run build && uv build` (or `./build.sh`, which also emits the npm types) |
|
|
161
|
+
|
|
162
|
+
Commits run the fast gates (hygiene, ruff, mypy --strict, Biome, tsc
|
|
163
|
+
--strict); pushes run pytest, `bun test` and Playwright under coverage and
|
|
164
|
+
require 90% coverage of changed lines across all suites. Playwright and the
|
|
165
|
+
combined coverage gate run locally and before pushes only. Hosted CI runs
|
|
166
|
+
lint, types, Python and Bun unit tests, builds, Python 3.12 to 3.15, Windows,
|
|
167
|
+
package installs and the docs build.
|
|
168
|
+
|
|
169
|
+
**Output directories:** `hiplot/static/built/` (bundles shipped in the
|
|
170
|
+
wheel), `dist/` (wheel and sdist), `npm-dist/` (npm package).
|
|
171
|
+
|
|
172
|
+
## Citing
|
|
173
|
+
|
|
174
|
+
```bibtex
|
|
175
|
+
@misc{hiplot,
|
|
176
|
+
author = {Haziza, D. and Rapin, J. and Synnaeve, G.},
|
|
177
|
+
title = {{Hiplot, interactive high-dimensionality plots}},
|
|
178
|
+
year = {2020},
|
|
179
|
+
publisher = {GitHub},
|
|
180
|
+
journal = {GitHub repository},
|
|
181
|
+
howpublished = {\url{https://github.com/facebookresearch/hiplot}},
|
|
182
|
+
}
|
|
183
|
+
```
|
|
184
|
+
|
|
185
|
+
## Credits
|
|
186
|
+
|
|
187
|
+
Inspired by and based on code from [Kai Chang](http://bl.ocks.org/syntagmatic/3150059), [Mike Bostock](http://bl.ocks.org/1341021) and [Jason Davies](http://bl.ocks.org/1341281).
|
|
188
|
+
|
|
189
|
+
External contributors (_please add your name when you submit your first pull request_):
|
|
190
|
+
|
|
191
|
+
- [louismartin](https://github.com/louismartin)
|
|
192
|
+
- [GoldenCorgi](https://github.com/GoldenCorgi)
|
|
193
|
+
- [callistachang](https://github.com/callistachang)
|
|
194
|
+
|
|
195
|
+
## License
|
|
196
|
+
|
|
197
|
+
HiPlot is [MIT](LICENSE) licensed, as found in the [LICENSE](LICENSE) file.
|
|
@@ -0,0 +1,24 @@
|
|
|
1
|
+
hiplot/__init__.py,sha256=5AY97SbCpTuip_Svp21JB3EI8b7amNRgbXw654oPXMo,952
|
|
2
|
+
hiplot/__main__.py,sha256=FAkGchVzZEBymfIhYWSvZTR1xQmEH1-PGjukAm85CrI,328
|
|
3
|
+
hiplot/compress.py,sha256=cAYvA2k6G_1jHL70a_-IbDBzDu3eZJV_FW0NJ8-DrL0,2696
|
|
4
|
+
hiplot/csvvalues.py,sha256=6JEyLElLXgc-sJ643gkcZS2HQJUA2oJ1on8BG5ICkI8,3101
|
|
5
|
+
hiplot/experiment.py,sha256=-B7HCa6qncYlygz8yto0OnbZwkD0WRH4xJr5Bjmw-X8,24848
|
|
6
|
+
hiplot/fetchers.py,sha256=Rp3kHL-qZ8ax47v0mydZi6i1MFUcWqjz0PtWjLrE7R8,11733
|
|
7
|
+
hiplot/fetchers_demo.py,sha256=xCY0aGAUiUHJLCXziM2J9ayhtNJKWIsVA1Id7cHXdVM,15492
|
|
8
|
+
hiplot/ipython.py,sha256=XHjvYTZnRBPgX_k3ZG-psv07zePoi17rzIaIS40zCXg,7541
|
|
9
|
+
hiplot/pkginfo.py,sha256=pxIL3DkxWNoJKYdph60MHN1HwhTgvqi0TLNPzvPDP9I,564
|
|
10
|
+
hiplot/py.typed,sha256=47DEQpj8HBSa-_TImW-5JCeuQeRkm5NMpJWZG3hSuFU,0
|
|
11
|
+
hiplot/render.py,sha256=eg_7RPio8aJo_UOF-OPUo388dbYyzIy886RU1QrLwfw,4778
|
|
12
|
+
hiplot/server.py,sha256=8SI0XcJ4jJDLjlqV7KxXosIChvkzKwDesBiKYs41mXA,2752
|
|
13
|
+
hiplot/streamlit_helpers.py,sha256=lPhFE90uKZQtrkwA96iNCjkNJne8ap-hPeWaZMgvBW0,5167
|
|
14
|
+
hiplot/static/icon.png,sha256=hSllX0zW4r-6Cn8nqfiG9WbkGFU0HE3fTQyjBLg0dXE,21466
|
|
15
|
+
hiplot/static/built/hiplot.bundle.js,sha256=_cgf_Q1CDZCHiSUAaPGUJQaR6YJGB_a1HYrrI9oVpBs,1666348
|
|
16
|
+
hiplot/static/built/streamlit_component/hiplot_streamlit.bundle.js,sha256=OEvNp_BT3DCK18YKy66CczBw2pw0QeQofG2zDoAEqxo,1605435
|
|
17
|
+
hiplot/static/built/streamlit_component/index.html,sha256=Er4-G5w4l1xsRrBRu6IQCdewvivUQRrj1ejBQEeuEwQ,511
|
|
18
|
+
hiplot/templates/index.html,sha256=Im6F_ydcTMs2eMbk5bIB7CsgpEVMzD_KafmkLEtpPlg,2168
|
|
19
|
+
hiplot_plus-0.1.0.dist-info/METADATA,sha256=dqoBK2X0r946lM38JRrThKTdA2GWmN50Ty6ZI72oFro,9268
|
|
20
|
+
hiplot_plus-0.1.0.dist-info/WHEEL,sha256=2iZrJkDIkeDh0k9SikKMqFuRP-ua6mb4Ir1AsER4BEw,87
|
|
21
|
+
hiplot_plus-0.1.0.dist-info/entry_points.txt,sha256=gcP76M2oHsjL1sqJBDkBXWMhNQI-FgrkSTtPtMxrHbE,153
|
|
22
|
+
hiplot_plus-0.1.0.dist-info/licenses/LICENSE,sha256=UkEte8fOQVfqYou6rLiCngqcs8WPV_mRdhJryM8r_IU,1086
|
|
23
|
+
hiplot_plus-0.1.0.dist-info/licenses/NOTICE,sha256=BgJexxrr6wJp6w2Sh51mRAiLn1ymNC5o6F5KrnUV8Do,11609
|
|
24
|
+
hiplot_plus-0.1.0.dist-info/RECORD,,
|
|
@@ -0,0 +1,21 @@
|
|
|
1
|
+
MIT License
|
|
2
|
+
|
|
3
|
+
Copyright (c) Facebook, Inc. and its affiliates.
|
|
4
|
+
|
|
5
|
+
Permission is hereby granted, free of charge, to any person obtaining a copy
|
|
6
|
+
of this software and associated documentation files (the "Software"), to deal
|
|
7
|
+
in the Software without restriction, including without limitation the rights
|
|
8
|
+
to use, copy, modify, merge, publish, distribute, sublicense, and/or sell
|
|
9
|
+
copies of the Software, and to permit persons to whom the Software is
|
|
10
|
+
furnished to do so, subject to the following conditions:
|
|
11
|
+
|
|
12
|
+
The above copyright notice and this permission notice shall be included in all
|
|
13
|
+
copies or substantial portions of the Software.
|
|
14
|
+
|
|
15
|
+
THE SOFTWARE IS PROVIDED "AS IS", WITHOUT WARRANTY OF ANY KIND, EXPRESS OR
|
|
16
|
+
IMPLIED, INCLUDING BUT NOT LIMITED TO THE WARRANTIES OF MERCHANTABILITY,
|
|
17
|
+
FITNESS FOR A PARTICULAR PURPOSE AND NONINFRINGEMENT. IN NO EVENT SHALL THE
|
|
18
|
+
AUTHORS OR COPYRIGHT HOLDERS BE LIABLE FOR ANY CLAIM, DAMAGES OR OTHER
|
|
19
|
+
LIABILITY, WHETHER IN AN ACTION OF CONTRACT, TORT OR OTHERWISE, ARISING FROM,
|
|
20
|
+
OUT OF OR IN CONNECTION WITH THE SOFTWARE OR THE USE OR OTHER DEALINGS IN THE
|
|
21
|
+
SOFTWARE.
|