hiplot-mm 0.0.2__py3-none-any.whl → 0.0.3rc1__py3-none-any.whl
This diff represents the content of publicly available package versions that have been released to one of the supported registries. The information contained in this diff is provided for informational purposes only and reflects changes between package versions as they appear in their respective public registries.
- hiplot/__init__.py +1 -1
- hiplot/fetchers.py +1 -1
- hiplot/fetchers_demo.py +2 -2
- hiplot/ipython.py +40 -8
- hiplot/pkginfo.py +11 -2
- hiplot/render.py +2 -2
- hiplot/server.py +9 -3
- hiplot/static/built/hiplot.bundle.js +1 -1
- hiplot/static/built/streamlit_component/hiplot_streamlit.bundle.js +1 -1
- hiplot/streamlit_helpers.py +11 -2
- hiplot/test_render.py +2 -2
- hiplot_mm-0.0.3rc1.dist-info/METADATA +174 -0
- hiplot_mm-0.0.3rc1.dist-info/RECORD +33 -0
- {hiplot_mm-0.0.2.dist-info → hiplot_mm-0.0.3rc1.dist-info}/WHEEL +1 -1
- {hiplot_mm-0.0.2.dist-info → hiplot_mm-0.0.3rc1.dist-info}/entry_points.txt +1 -2
- hiplot/static/built/component.d.ts +0 -109
- hiplot/static/built/component.js +0 -528
- hiplot/static/built/contextmenu.d.ts +0 -26
- hiplot/static/built/contextmenu.js +0 -90
- hiplot/static/built/controls.d.ts +0 -52
- hiplot/static/built/controls.js +0 -163
- hiplot/static/built/filters.d.ts +0 -21
- hiplot/static/built/filters.js +0 -96
- hiplot/static/built/header.d.ts +0 -39
- hiplot/static/built/header.js +0 -176
- hiplot/static/built/hiplot-mm-0.0.0.tar.gz +0 -0
- hiplot/static/built/hiplot.bundle.js.LICENSE.txt +0 -88
- hiplot/static/built/hiplot.bundle.js.map +0 -1
- hiplot/static/built/hiplot.d.ts +0 -8
- hiplot/static/built/hiplot.js +0 -14
- hiplot/static/built/hiplot.lib.js +0 -57712
- hiplot/static/built/hiplot.lib.js.map +0 -1
- hiplot/static/built/hiplot.licenses.txt +0 -682
- hiplot/static/built/hiplot_mm-0.0.0-py3-none-any.whl +0 -0
- hiplot/static/built/hiplot_streamlit.bundle.js +0 -3
- hiplot/static/built/hiplot_streamlit.bundle.js.LICENSE.txt +0 -97
- hiplot/static/built/hiplot_streamlit.bundle.js.map +0 -1
- hiplot/static/built/hiplot_streamlit.d.ts +0 -1
- hiplot/static/built/hiplot_streamlit.js +0 -85
- hiplot/static/built/hiplot_streamlit.licenses.txt +0 -689
- hiplot/static/built/hiplot_test.bundle.js +0 -3
- hiplot/static/built/hiplot_test.bundle.js.LICENSE.txt +0 -88
- hiplot/static/built/hiplot_test.bundle.js.map +0 -1
- hiplot/static/built/hiplot_test.d.ts +0 -46
- hiplot/static/built/hiplot_test.js +0 -238
- hiplot/static/built/hiplot_test.licenses.txt +0 -682
- hiplot/static/built/hiplot_web.d.ts +0 -3
- hiplot/static/built/hiplot_web.js +0 -54
- hiplot/static/built/infertypes.d.ts +0 -38
- hiplot/static/built/infertypes.js +0 -316
- hiplot/static/built/plotxy.d.ts +0 -62
- hiplot/static/built/plotxy.js +0 -602
- hiplot/static/built/plugin.d.ts +0 -38
- hiplot/static/built/plugin.js +0 -8
- hiplot/static/built/rowsdisplaytable.d.ts +0 -35
- hiplot/static/built/rowsdisplaytable.js +0 -284
- hiplot/static/built/streamlit_component/hiplot.bundle.js +0 -3
- hiplot/static/built/types.d.ts +0 -64
- hiplot/static/built/types.js +0 -55
- hiplot_mm-0.0.2.dist-info/METADATA +0 -106
- hiplot_mm-0.0.2.dist-info/RECORD +0 -77
- {hiplot_mm-0.0.2.dist-info → hiplot_mm-0.0.3rc1.dist-info/licenses}/LICENSE +0 -0
- {hiplot_mm-0.0.2.dist-info → hiplot_mm-0.0.3rc1.dist-info/licenses}/NOTICE +0 -0
- {hiplot_mm-0.0.2.dist-info → hiplot_mm-0.0.3rc1.dist-info}/top_level.txt +0 -0
hiplot/streamlit_helpers.py
CHANGED
|
@@ -18,7 +18,9 @@ class _StreamlitHelpers:
|
|
|
18
18
|
def is_running_within_streamlit() -> bool:
|
|
19
19
|
try:
|
|
20
20
|
from streamlit import runtime
|
|
21
|
-
except
|
|
21
|
+
except ImportError:
|
|
22
|
+
return False
|
|
23
|
+
except Exception: # pylint: disable=broad-except
|
|
22
24
|
return False
|
|
23
25
|
return bool(runtime.exists())
|
|
24
26
|
|
|
@@ -26,10 +28,17 @@ class _StreamlitHelpers:
|
|
|
26
28
|
def create_component(cls) -> tp.Optional[tp.Callable[..., tp.Any]]:
|
|
27
29
|
if cls.component is not None:
|
|
28
30
|
return cls.component
|
|
29
|
-
|
|
31
|
+
try:
|
|
32
|
+
from streamlit import runtime
|
|
33
|
+
except ImportError as e:
|
|
34
|
+
raise ImportError(
|
|
35
|
+
"Streamlit is required for Streamlit support. "
|
|
36
|
+
"Install it with: pip install hiplot-mm[streamlit]"
|
|
37
|
+
) from e
|
|
30
38
|
try:
|
|
31
39
|
import streamlit.components.v1 as components
|
|
32
40
|
except ModuleNotFoundError as e:
|
|
41
|
+
import streamlit as st
|
|
33
42
|
raise RuntimeError(f"""Your streamlit version ({st.__version__}) is too old and does not support components.
|
|
34
43
|
Please update streamlit with `pip install -U streamlit`""") from e
|
|
35
44
|
assert runtime.exists()
|
hiplot/test_render.py
CHANGED
|
@@ -17,8 +17,8 @@ def test_demos_ipython() -> None:
|
|
|
17
17
|
v().display()
|
|
18
18
|
|
|
19
19
|
|
|
20
|
-
@unittest.mock.patch('streamlit.
|
|
21
|
-
def test_demos_streamlit() -> None:
|
|
20
|
+
@unittest.mock.patch('streamlit.runtime.exists', return_value=True)
|
|
21
|
+
def test_demos_streamlit(_mock: unittest.mock.MagicMock) -> None:
|
|
22
22
|
for k, v in README_DEMOS.items():
|
|
23
23
|
print(k)
|
|
24
24
|
v().display_st(key=f'hiplot{k}a')
|
|
@@ -0,0 +1,174 @@
|
|
|
1
|
+
Metadata-Version: 2.4
|
|
2
|
+
Name: hiplot-mm
|
|
3
|
+
Version: 0.0.3rc1
|
|
4
|
+
Summary: High dimensional Interactive Plotting tool
|
|
5
|
+
Author: Facebook AI Research, mathematicalmichael @ Mind the Math, LLC
|
|
6
|
+
License-Expression: MIT
|
|
7
|
+
Project-URL: Homepage, https://github.com/mindthemath/hiplot
|
|
8
|
+
Project-URL: Documentation, https://facebookresearch.github.io/hiplot/
|
|
9
|
+
Project-URL: Repository, https://github.com/mindthemath/hiplot
|
|
10
|
+
Classifier: Development Status :: 4 - Beta
|
|
11
|
+
Classifier: Intended Audience :: Developers
|
|
12
|
+
Classifier: Intended Audience :: Science/Research
|
|
13
|
+
Classifier: Operating System :: OS Independent
|
|
14
|
+
Classifier: Programming Language :: Python :: 3
|
|
15
|
+
Classifier: Programming Language :: Python :: 3.8
|
|
16
|
+
Classifier: Programming Language :: Python :: 3.9
|
|
17
|
+
Classifier: Programming Language :: Python :: 3.10
|
|
18
|
+
Classifier: Programming Language :: Python :: 3.11
|
|
19
|
+
Classifier: Programming Language :: Python :: 3.12
|
|
20
|
+
Classifier: Programming Language :: Python :: 3.13
|
|
21
|
+
Classifier: Programming Language :: Python :: 3.14
|
|
22
|
+
Classifier: Topic :: Scientific/Engineering :: Visualization
|
|
23
|
+
Requires-Python: >=3.8
|
|
24
|
+
Description-Content-Type: text/markdown
|
|
25
|
+
License-File: LICENSE
|
|
26
|
+
License-File: NOTICE
|
|
27
|
+
Requires-Dist: beautifulsoup4
|
|
28
|
+
Requires-Dist: jinja2
|
|
29
|
+
Provides-Extra: server
|
|
30
|
+
Requires-Dist: flask; extra == "server"
|
|
31
|
+
Requires-Dist: flask-compress; extra == "server"
|
|
32
|
+
Provides-Extra: notebook
|
|
33
|
+
Requires-Dist: ipython>=7.0.1; extra == "notebook"
|
|
34
|
+
Requires-Dist: ipykernel; extra == "notebook"
|
|
35
|
+
Provides-Extra: streamlit
|
|
36
|
+
Requires-Dist: streamlit>=0.63; extra == "streamlit"
|
|
37
|
+
Provides-Extra: all
|
|
38
|
+
Requires-Dist: hiplot-mm[notebook,server,streamlit]; extra == "all"
|
|
39
|
+
Provides-Extra: dev
|
|
40
|
+
Requires-Dist: pytest; extra == "dev"
|
|
41
|
+
Requires-Dist: ty; extra == "dev"
|
|
42
|
+
Requires-Dist: ipykernel; extra == "dev"
|
|
43
|
+
Requires-Dist: wheel; extra == "dev"
|
|
44
|
+
Requires-Dist: mistune==0.8.4; extra == "dev"
|
|
45
|
+
Requires-Dist: twine; extra == "dev"
|
|
46
|
+
Requires-Dist: pre-commit; extra == "dev"
|
|
47
|
+
Requires-Dist: pandas; extra == "dev"
|
|
48
|
+
Requires-Dist: streamlit>=0.63; extra == "dev"
|
|
49
|
+
Requires-Dist: beautifulsoup4; extra == "dev"
|
|
50
|
+
Requires-Dist: optuna; extra == "dev"
|
|
51
|
+
Requires-Dist: sphinx==5.2.0; extra == "dev"
|
|
52
|
+
Requires-Dist: guzzle_sphinx_theme==0.7.11; extra == "dev"
|
|
53
|
+
Requires-Dist: m2r2>=0.3.4; extra == "dev"
|
|
54
|
+
Requires-Dist: flask; extra == "dev"
|
|
55
|
+
Requires-Dist: flask-compress; extra == "dev"
|
|
56
|
+
Requires-Dist: ipython>=7.0.1; extra == "dev"
|
|
57
|
+
Dynamic: license-file
|
|
58
|
+
|
|
59
|
+
# HiPlot - High dimensional Interactive Plotting
|
|
60
|
+
|
|
61
|
+

|
|
62
|
+
|
|
63
|
+
[](https://github.com/mindthemath/hiplot/actions/workflows/ci.yml)
|
|
64
|
+
[](https://github.com/mindthemath/hiplot/actions/workflows/release.yml)
|
|
65
|
+
[](https://opensource.org/licenses/MIT)
|
|
66
|
+
[](https://pypi.python.org/pypi/hiplot-mm/)
|
|
67
|
+
[](https://pypi.python.org/pypi/hiplot-mm/)
|
|
68
|
+
[](https://colab.research.google.com/github/mindthemath/hiplot/blob/main/examples/HiPlotColabExample.ipynb)
|
|
69
|
+
|
|
70
|
+
> **Community-maintained fork**: This is a community-maintained fork of [Facebook Research's HiPlot](https://github.com/facebookresearch/hiplot), which has been archived. We aim to keep the project alive with bug fixes, security updates, and new features.
|
|
71
|
+
|
|
72
|
+
HiPlot is a lightweight interactive visualization tool to help AI researchers discover correlations and patterns in high-dimensional data using parallel plots and other graphical ways to represent information.
|
|
73
|
+
|
|
74
|
+
### [Try a demo now with sweep data](https://mindthemath.github.io/hiplot/_static/demo/ml1.csv.html) or [upload your CSV](https://mindthemath.github.io/hiplot/_static/hiplot_upload.html) or [](https://colab.research.google.com/github/mindthemath/hiplot/blob/main/examples/HiPlotColabExample.ipynb)
|
|
75
|
+
|
|
76
|
+
There are several modes to HiPlot:
|
|
77
|
+
- As a web-server (if your data is a CSV for instance)
|
|
78
|
+
- In a jupyter notebook (to visualize python data), or in [Streamlit apps](https://mindthemath.github.io/hiplot/tuto_streamlit.html)
|
|
79
|
+
- In CLI to render standalone HTML
|
|
80
|
+
|
|
81
|
+
|
|
82
|
+
```bash
|
|
83
|
+
# Core package (HTML export only)
|
|
84
|
+
pip install hiplot-mm
|
|
85
|
+
|
|
86
|
+
# With Jupyter notebook support
|
|
87
|
+
pip install hiplot-mm[notebook]
|
|
88
|
+
|
|
89
|
+
# With web server support (hiplot CLI command)
|
|
90
|
+
pip install hiplot-mm[server]
|
|
91
|
+
|
|
92
|
+
# With Streamlit support
|
|
93
|
+
pip install hiplot-mm[streamlit]
|
|
94
|
+
|
|
95
|
+
# Everything
|
|
96
|
+
pip install hiplot-mm[all]
|
|
97
|
+
```
|
|
98
|
+
|
|
99
|
+
If you have a Jupyter notebook, you can get started with something as simple as:
|
|
100
|
+
|
|
101
|
+
```python
|
|
102
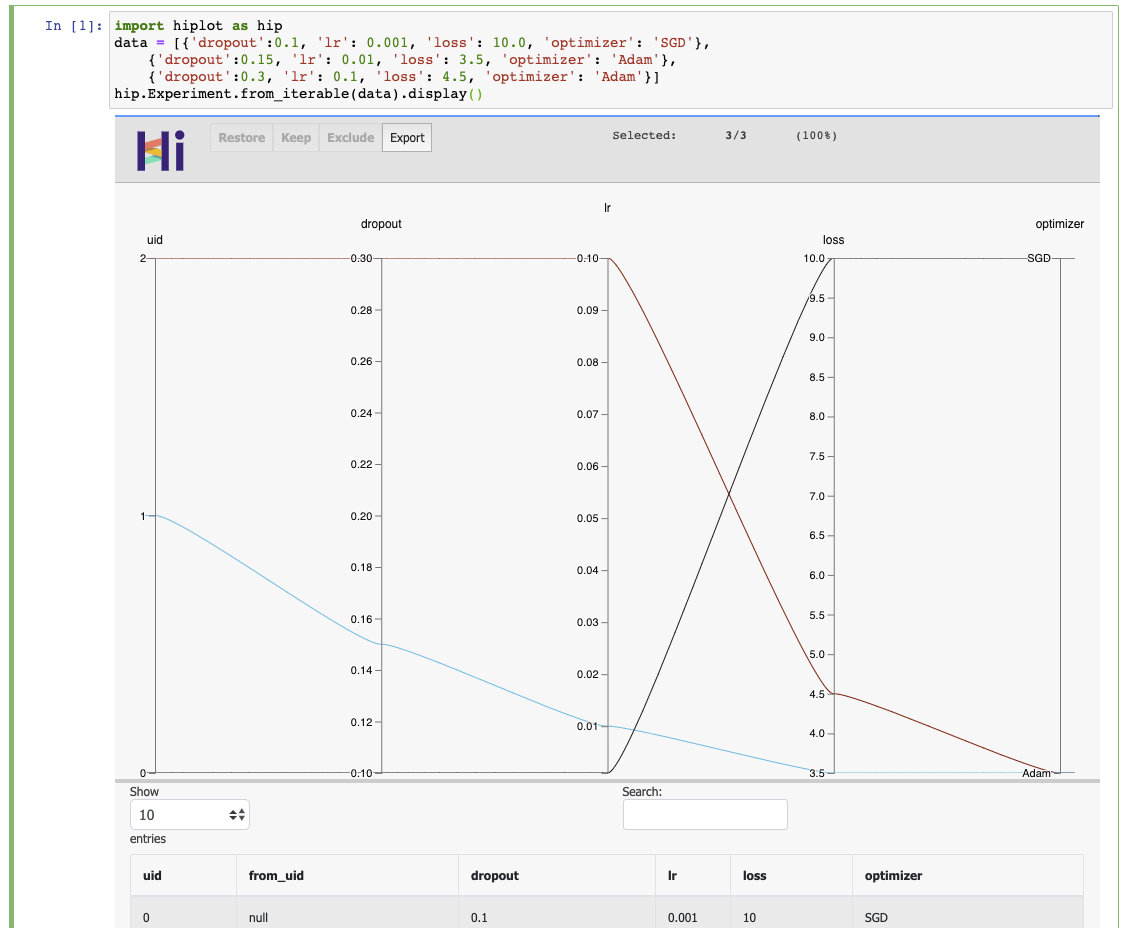
|
+
import hiplot as hip
|
|
103
|
+
data = [{'dropout':0.1, 'lr': 0.001, 'loss': 10.0, 'optimizer': 'SGD'},
|
|
104
|
+
{'dropout':0.15, 'lr': 0.01, 'loss': 3.5, 'optimizer': 'Adam'},
|
|
105
|
+
{'dropout':0.3, 'lr': 0.1, 'loss': 4.5, 'optimizer': 'Adam'}]
|
|
106
|
+
hip.Experiment.from_iterable(data).display()
|
|
107
|
+
```
|
|
108
|
+
|
|
109
|
+
### [See the live result](https://mindthemath.github.io/hiplot/_static/demo/demo_basic_usage.html)
|
|
110
|
+
|
|
111
|
+
|
|
112
|
+
## Links
|
|
113
|
+
|
|
114
|
+
* Repository: https://github.com/mindthemath/hiplot
|
|
115
|
+
* Documentation: https://mindthemath.github.io/hiplot/
|
|
116
|
+
* PyPI package: https://pypi.org/project/hiplot-mm/
|
|
117
|
+
* Examples: https://github.com/mindthemath/hiplot/tree/main/examples
|
|
118
|
+
* Original blog post: https://ai.facebook.com/blog/hiplot-high-dimensional-interactive-plots-made-easy/
|
|
119
|
+
|
|
120
|
+
|
|
121
|
+
## Development
|
|
122
|
+
|
|
123
|
+
To build from source:
|
|
124
|
+
|
|
125
|
+
```bash
|
|
126
|
+
# Install dependencies
|
|
127
|
+
bun install
|
|
128
|
+
uv sync --all-extras
|
|
129
|
+
|
|
130
|
+
# Build JavaScript bundles
|
|
131
|
+
bun run build
|
|
132
|
+
|
|
133
|
+
# Build Python package
|
|
134
|
+
uv build
|
|
135
|
+
|
|
136
|
+
# Or use the all-in-one build script
|
|
137
|
+
./build.sh
|
|
138
|
+
```
|
|
139
|
+
|
|
140
|
+
**Output directories:**
|
|
141
|
+
- `npm-dist/` - NPM package artifacts
|
|
142
|
+
- `dist/` - Python wheel and sdist
|
|
143
|
+
- `hiplot/static/built/` - JS bundle included in Python package
|
|
144
|
+
|
|
145
|
+
**Run the dev server:**
|
|
146
|
+
```bash
|
|
147
|
+
uv run hiplot --port 8765
|
|
148
|
+
```
|
|
149
|
+
|
|
150
|
+
|
|
151
|
+
## Citing
|
|
152
|
+
|
|
153
|
+
```bibtex
|
|
154
|
+
@misc{hiplot,
|
|
155
|
+
author = {Haziza, D. and Rapin, J. and Synnaeve, G.},
|
|
156
|
+
title = {{Hiplot, interactive high-dimensionality plots}},
|
|
157
|
+
year = {2020},
|
|
158
|
+
publisher = {GitHub},
|
|
159
|
+
journal = {GitHub repository},
|
|
160
|
+
howpublished = {\url{https://github.com/facebookresearch/hiplot}},
|
|
161
|
+
}
|
|
162
|
+
```
|
|
163
|
+
|
|
164
|
+
## Credits
|
|
165
|
+
Inspired by and based on code from [Kai Chang](http://bl.ocks.org/syntagmatic/3150059), [Mike Bostock](http://bl.ocks.org/1341021) and [Jason Davies](http://bl.ocks.org/1341281).
|
|
166
|
+
|
|
167
|
+
External contributors (*please add your name when you submit your first pull request*):
|
|
168
|
+
- [louismartin](https://github.com/louismartin)
|
|
169
|
+
- [GoldenCorgi](https://github.com/GoldenCorgi)
|
|
170
|
+
- [callistachang](https://github.com/callistachang)
|
|
171
|
+
|
|
172
|
+
|
|
173
|
+
## License
|
|
174
|
+
HiPlot is [MIT](LICENSE) licensed, as found in the [LICENSE](LICENSE) file.
|
|
@@ -0,0 +1,33 @@
|
|
|
1
|
+
hiplot/__init__.py,sha256=e8cvytHcwf-Ywycv1wBoldEC0Pbmik4bjSmBzZfa_PE,882
|
|
2
|
+
hiplot/__main__.py,sha256=iTsr-pqySeHZ1_Uk-F0O5BOsVJjWslG7z2YZm2KkFpE,283
|
|
3
|
+
hiplot/compress.py,sha256=9J2rLJVtZX-EHjdySsGekA0LeOxpmwaB8SnsLA1esco,964
|
|
4
|
+
hiplot/experiment.py,sha256=d00uvhw-yrMES9IZ0sk9yFL9FwNV_KTPrq11cIyEVA4,24652
|
|
5
|
+
hiplot/fetchers.py,sha256=7CASSHVIak7uz6Fh4t9IShTLwJs5uRgtYeBpYNvdZho,11554
|
|
6
|
+
hiplot/fetchers_demo.py,sha256=YoS8WPKrpP2DufiYQfjsLzOkRIN4qbVYN65d2cVErTw,12982
|
|
7
|
+
hiplot/ipython.py,sha256=xYLaaawSme_QNZpkic2Io3J1F4Kh1u2qZtu5hn4aWpk,7734
|
|
8
|
+
hiplot/pkginfo.py,sha256=FAFdJSUb-YTXawWUKcjbUNxgA8ps29QnxQVcNnrHBnU,562
|
|
9
|
+
hiplot/py.typed,sha256=47DEQpj8HBSa-_TImW-5JCeuQeRkm5NMpJWZG3hSuFU,0
|
|
10
|
+
hiplot/render.py,sha256=k30ZBYsqSCGlvmqprTYex72CYJ__siyQUGDtWSwwkE4,3733
|
|
11
|
+
hiplot/server.py,sha256=lGTFGlY7vfn_9i7YoviPqjsCWD1FTVvKu_FOuJJtqsk,2433
|
|
12
|
+
hiplot/streamlit_helpers.py,sha256=ZClfgbafgHWFQi0E16CgzdfKz8-AACRIe2DqryDM0fM,5214
|
|
13
|
+
hiplot/test_experiment.py,sha256=dOFpq6qEjexvRRGOkpNjWzrDpcVw8ckCOktCGJFdUr0,6748
|
|
14
|
+
hiplot/test_fetchers.py,sha256=zXMN15E22_yNUU_YPcKWx9L4XAyZi1I1yr30cBlmkB0,2208
|
|
15
|
+
hiplot/test_render.py,sha256=d8nNA9ptuXakSTkFzITpQXT7J9R4UCyVAeIXvHrIdC8,2155
|
|
16
|
+
hiplot/static/icon-w.svg,sha256=0hfr9tMtWZPOS_GXVOE3s03I4JZ9WFBn7RyyOW9GN0w,1160
|
|
17
|
+
hiplot/static/icon.png,sha256=hSllX0zW4r-6Cn8nqfiG9WbkGFU0HE3fTQyjBLg0dXE,21466
|
|
18
|
+
hiplot/static/icon.svg,sha256=MDyI5uC4n5FAmMKKqNBmUUhigmxDnjmEeB6FtuSTBGI,1151
|
|
19
|
+
hiplot/static/logo-w.svg,sha256=Ptvs98gsgr0Qk12LnbglQKx2lSfs6Hc4TUTx6Mk9hF0,2274
|
|
20
|
+
hiplot/static/logo.png,sha256=Rd7cq4aMlvQmSrL5OKrOWcucDngQgkt5ZUUKO2i4uRE,15653
|
|
21
|
+
hiplot/static/logo.svg,sha256=vzVSSRpfkuCMuW3RhmrwRk9JkKb2YtHeQIO9f_LFW1k,2265
|
|
22
|
+
hiplot/static/thumbnail.png,sha256=SX3sY85PxZ5y0LbPWzoSWGXHvU-fgBBZgW7zxMT_3hk,45290
|
|
23
|
+
hiplot/static/built/hiplot.bundle.js,sha256=f5mg5lWzfyTP7WPsr5BVk7HaLOSH4RJ3sVAHXwzBvc0,1578564
|
|
24
|
+
hiplot/static/built/streamlit_component/hiplot_streamlit.bundle.js,sha256=6lO4Xjt0-eovn0U5TGTcfUhO8oxc7JuJFlu4YaT8aOg,1561437
|
|
25
|
+
hiplot/static/built/streamlit_component/index.html,sha256=9zbuZu0iE1vFr2cy0ulrP3l34i8W_3-Mkl_JCPVq-tc,512
|
|
26
|
+
hiplot/templates/index.html,sha256=cwt7fGGdz3UHxHZAh3EMnudmwMauGV7Jp8YOUxtSFPE,1281
|
|
27
|
+
hiplot_mm-0.0.3rc1.dist-info/licenses/LICENSE,sha256=UkEte8fOQVfqYou6rLiCngqcs8WPV_mRdhJryM8r_IU,1086
|
|
28
|
+
hiplot_mm-0.0.3rc1.dist-info/licenses/NOTICE,sha256=BgJexxrr6wJp6w2Sh51mRAiLn1ymNC5o6F5KrnUV8Do,11609
|
|
29
|
+
hiplot_mm-0.0.3rc1.dist-info/METADATA,sha256=zrA48TTxVTMySV35qm4CYR3cZ1KoQUqqewQ2Nf_VQmw,6934
|
|
30
|
+
hiplot_mm-0.0.3rc1.dist-info/WHEEL,sha256=wUyA8OaulRlbfwMtmQsvNngGrxQHAvkKcvRmdizlJi0,92
|
|
31
|
+
hiplot_mm-0.0.3rc1.dist-info/entry_points.txt,sha256=4hfapToNypT55b9ZlFt9T3slAQbb8XzapVL3mpZvou8,109
|
|
32
|
+
hiplot_mm-0.0.3rc1.dist-info/top_level.txt,sha256=J1kKpj7DXS676kMWcep6U8rHfAHrL1YQWAwhjcHMpMU,7
|
|
33
|
+
hiplot_mm-0.0.3rc1.dist-info/RECORD,,
|
|
@@ -1,109 +0,0 @@
|
|
|
1
|
-
import React from "react";
|
|
2
|
-
import './style/global';
|
|
3
|
-
import { Datapoint, HiPlotExperiment, HiPlotLoadStatus, DatapointLookup, IDatasets } from "./types";
|
|
4
|
-
import { ParamDefMap } from "./infertypes";
|
|
5
|
-
import { PersistentState } from "./lib/savedstate";
|
|
6
|
-
import { HiPlotPluginData, DataProviderClass } from "./plugin";
|
|
7
|
-
import { ContextMenu } from "./contextmenu";
|
|
8
|
-
import { Filter } from "./filters";
|
|
9
|
-
export { PlotXY } from "./plotxy";
|
|
10
|
-
export { ParallelPlot } from "./parallel/parallel";
|
|
11
|
-
export { RowsDisplayTable } from "./rowsdisplaytable";
|
|
12
|
-
export { HiPlotPluginData } from "./plugin";
|
|
13
|
-
export { Datapoint, HiPlotExperiment, IDatasets, HiPlotLoadStatus } from "./types";
|
|
14
|
-
declare type PluginComponent<P> = React.Component<P, any>;
|
|
15
|
-
declare type PluginComponentClass<P> = React.ComponentClass<P>;
|
|
16
|
-
declare type PluginClass = React.ClassType<HiPlotPluginData, PluginComponent<HiPlotPluginData>, PluginComponentClass<HiPlotPluginData>>;
|
|
17
|
-
interface PluginsMap {
|
|
18
|
-
[k: string]: PluginClass;
|
|
19
|
-
}
|
|
20
|
-
declare type LoadURIPromiseResult = {
|
|
21
|
-
experiment: HiPlotExperiment;
|
|
22
|
-
} | {
|
|
23
|
-
error: string;
|
|
24
|
-
};
|
|
25
|
-
export declare type LoadURIPromise = Promise<LoadURIPromiseResult>;
|
|
26
|
-
interface CancelablePromise {
|
|
27
|
-
promise: LoadURIPromise;
|
|
28
|
-
cancel: () => void;
|
|
29
|
-
}
|
|
30
|
-
export interface HiPlotProps {
|
|
31
|
-
experiment: HiPlotExperiment | null;
|
|
32
|
-
plugins: PluginsMap;
|
|
33
|
-
persistentState?: PersistentState;
|
|
34
|
-
onChange: {
|
|
35
|
-
[k: string]: (type: string, data: any) => void;
|
|
36
|
-
};
|
|
37
|
-
dark: boolean;
|
|
38
|
-
asserts: boolean;
|
|
39
|
-
dataProvider: DataProviderClass;
|
|
40
|
-
}
|
|
41
|
-
interface HiPlotState extends IDatasets {
|
|
42
|
-
experiment: HiPlotExperiment | null;
|
|
43
|
-
loadStatus: HiPlotLoadStatus;
|
|
44
|
-
loadPromise: CancelablePromise | null;
|
|
45
|
-
error: string;
|
|
46
|
-
params_def: ParamDefMap;
|
|
47
|
-
params_def_unfiltered: ParamDefMap;
|
|
48
|
-
dp_lookup: DatapointLookup;
|
|
49
|
-
colorby: string;
|
|
50
|
-
colormap: string;
|
|
51
|
-
rows_filtered_filters: Array<Filter>;
|
|
52
|
-
rows_selected_filter: Filter;
|
|
53
|
-
persistentState: PersistentState;
|
|
54
|
-
dark: boolean;
|
|
55
|
-
dataProvider: DataProviderClass;
|
|
56
|
-
}
|
|
57
|
-
export declare enum DefaultPlugins {
|
|
58
|
-
PARALLEL_PLOT = "PARALLEL_PLOT",
|
|
59
|
-
XY = "XY",
|
|
60
|
-
DISTRIBUTION = "DISTRIBUTION",
|
|
61
|
-
TABLE = "TABLE"
|
|
62
|
-
}
|
|
63
|
-
export declare const defaultPlugins: PluginsMap;
|
|
64
|
-
export declare function createDefaultPlugins(): PluginsMap;
|
|
65
|
-
export declare class HiPlot extends React.Component<HiPlotProps, HiPlotState> {
|
|
66
|
-
contextMenuRef: React.RefObject<ContextMenu>;
|
|
67
|
-
rootRef: React.RefObject<HTMLDivElement>;
|
|
68
|
-
plugins_window_state: {
|
|
69
|
-
[plugin: string]: any;
|
|
70
|
-
};
|
|
71
|
-
plugins_ref: {
|
|
72
|
-
[plugin: string]: React.RefObject<PluginClass>;
|
|
73
|
-
};
|
|
74
|
-
constructor(props: HiPlotProps);
|
|
75
|
-
static defaultProps: {
|
|
76
|
-
loadURI: any;
|
|
77
|
-
comm: any;
|
|
78
|
-
dark: boolean;
|
|
79
|
-
asserts: boolean;
|
|
80
|
-
plugins: PluginsMap;
|
|
81
|
-
experiment: any;
|
|
82
|
-
dataProvider: any;
|
|
83
|
-
onChange: any;
|
|
84
|
-
};
|
|
85
|
-
static getDerivedStateFromError(error: Error): {
|
|
86
|
-
experiment: any;
|
|
87
|
-
loadStatus: HiPlotLoadStatus;
|
|
88
|
-
error: string;
|
|
89
|
-
};
|
|
90
|
-
makeDatasets(experiment: HiPlotExperiment | null, dp_lookup: DatapointLookup, initial_filters: Array<Filter>): IDatasets;
|
|
91
|
-
sendMessage(type: string, get_data: () => any): void;
|
|
92
|
-
callSelectedUidsHooks: any;
|
|
93
|
-
callFilteredUidsHooks: any;
|
|
94
|
-
_loadExperiment(experiment: HiPlotExperiment): void;
|
|
95
|
-
getColorForRow(trial: Datapoint, alpha: number): string;
|
|
96
|
-
loadWithPromise(prom: LoadURIPromise): void;
|
|
97
|
-
componentWillUnmount(): void;
|
|
98
|
-
componentDidMount(): void;
|
|
99
|
-
componentDidUpdate(prevProps: HiPlotProps, prevState: HiPlotState): void;
|
|
100
|
-
columnContextMenu(column: string, cm: HTMLDivElement): void;
|
|
101
|
-
createNewParamsDef(rows_filtered: Array<Datapoint>): ParamDefMap;
|
|
102
|
-
restoreAllRows(): void;
|
|
103
|
-
filterRows(keep: boolean): void;
|
|
104
|
-
setSelected(rows: Array<Datapoint>, filter?: Filter | null): void;
|
|
105
|
-
setHighlighted(rows: Array<Datapoint>): void;
|
|
106
|
-
renderRowText(row: Datapoint): string;
|
|
107
|
-
render(): JSX.Element;
|
|
108
|
-
getPlugin<P extends HiPlotPluginData, T extends React.Component<P>>(cls: React.ClassType<P, T, React.ComponentClass<P>>): T;
|
|
109
|
-
}
|