camminady_matplotlib_theme 0.2.0__py3-none-any.whl
This diff represents the content of publicly available package versions that have been released to one of the supported registries. The information contained in this diff is provided for informational purposes only and reflects changes between package versions as they appear in their respective public registries.
- camminady_matplotlib_theme/__init__.py +47 -0
- camminady_matplotlib_theme/camminady.mplstyle +85 -0
- camminady_matplotlib_theme/camminady_dark.mplstyle +85 -0
- camminady_matplotlib_theme/layout.py +242 -0
- camminady_matplotlib_theme/py.typed +0 -0
- camminady_matplotlib_theme/theme.py +286 -0
- camminady_matplotlib_theme/ticks.py +127 -0
- camminady_matplotlib_theme-0.2.0.dist-info/METADATA +177 -0
- camminady_matplotlib_theme-0.2.0.dist-info/RECORD +11 -0
- camminady_matplotlib_theme-0.2.0.dist-info/WHEEL +4 -0
- camminady_matplotlib_theme-0.2.0.dist-info/licenses/LICENSE +21 -0
|
@@ -0,0 +1,47 @@
|
|
|
1
|
+
"""Minimal matplotlib styles: ``"camminady"`` and ``"camminady_dark"``.
|
|
2
|
+
|
|
3
|
+
They match the Altair theme of ``camminady_altair_theme``. Use a style
|
|
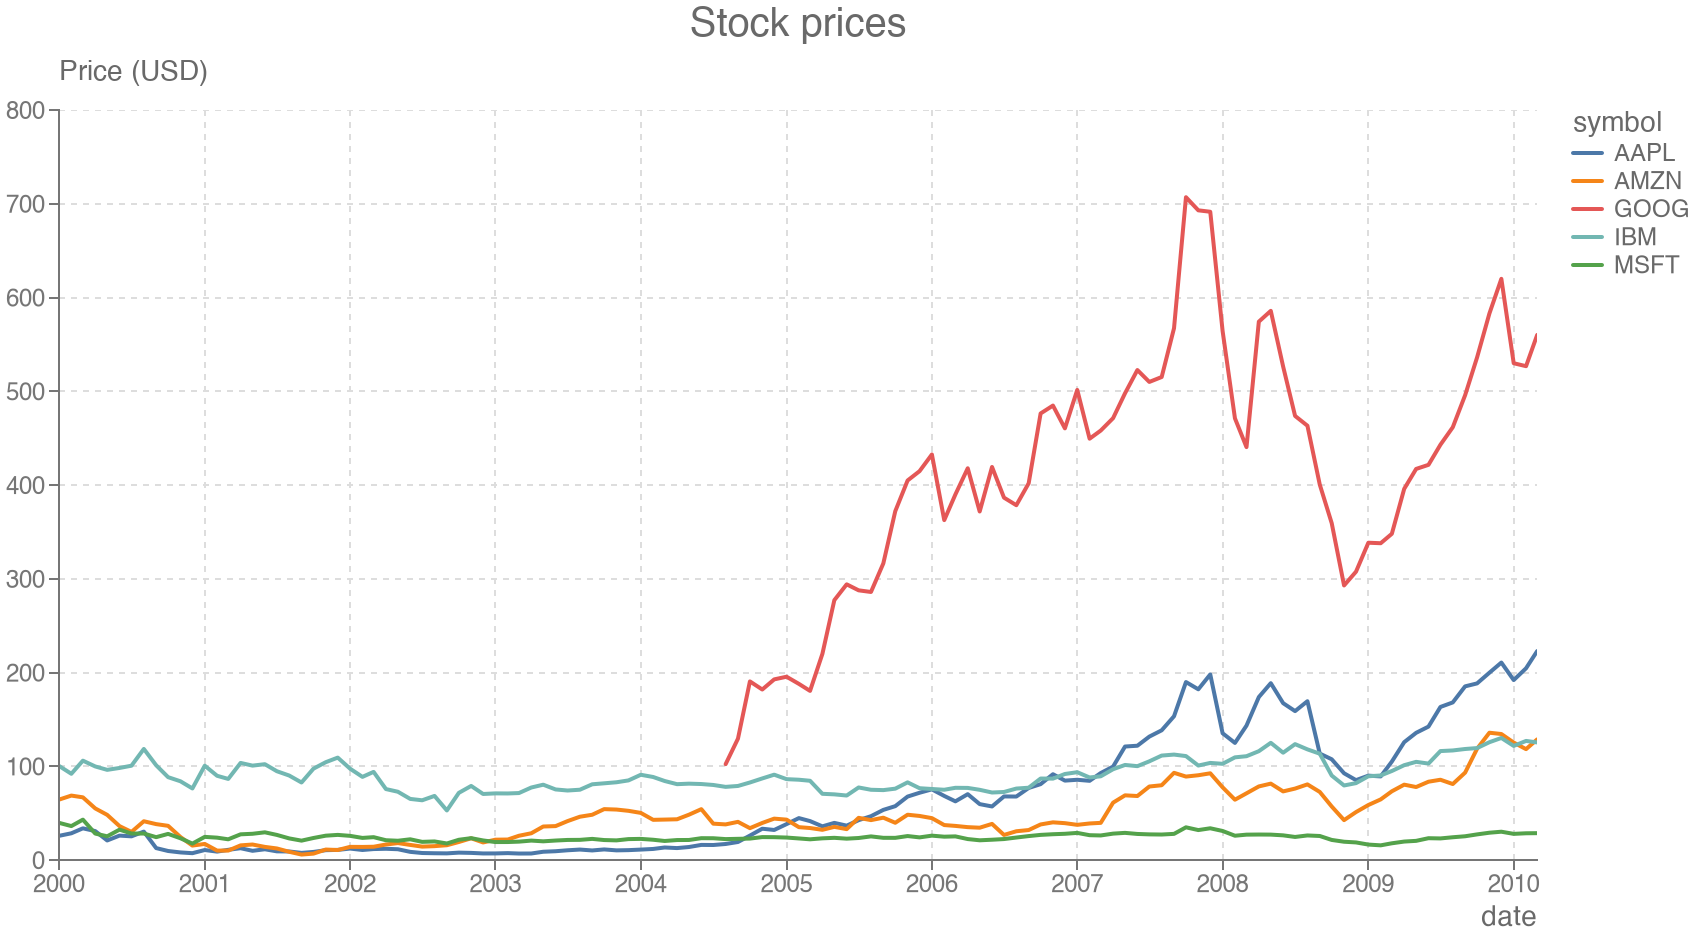
4
|
+
without importing this package::
|
|
5
|
+
|
|
6
|
+
import matplotlib.pyplot as plt
|
|
7
|
+
|
|
8
|
+
plt.style.use("camminady_matplotlib_theme.camminady")
|
|
9
|
+
|
|
10
|
+
Importing the package also registers the short names ``"camminady"`` and
|
|
11
|
+
``"camminady_dark"`` with matplotlib, without applying a style.
|
|
12
|
+
|
|
13
|
+
.. include:: ../../README.md
|
|
14
|
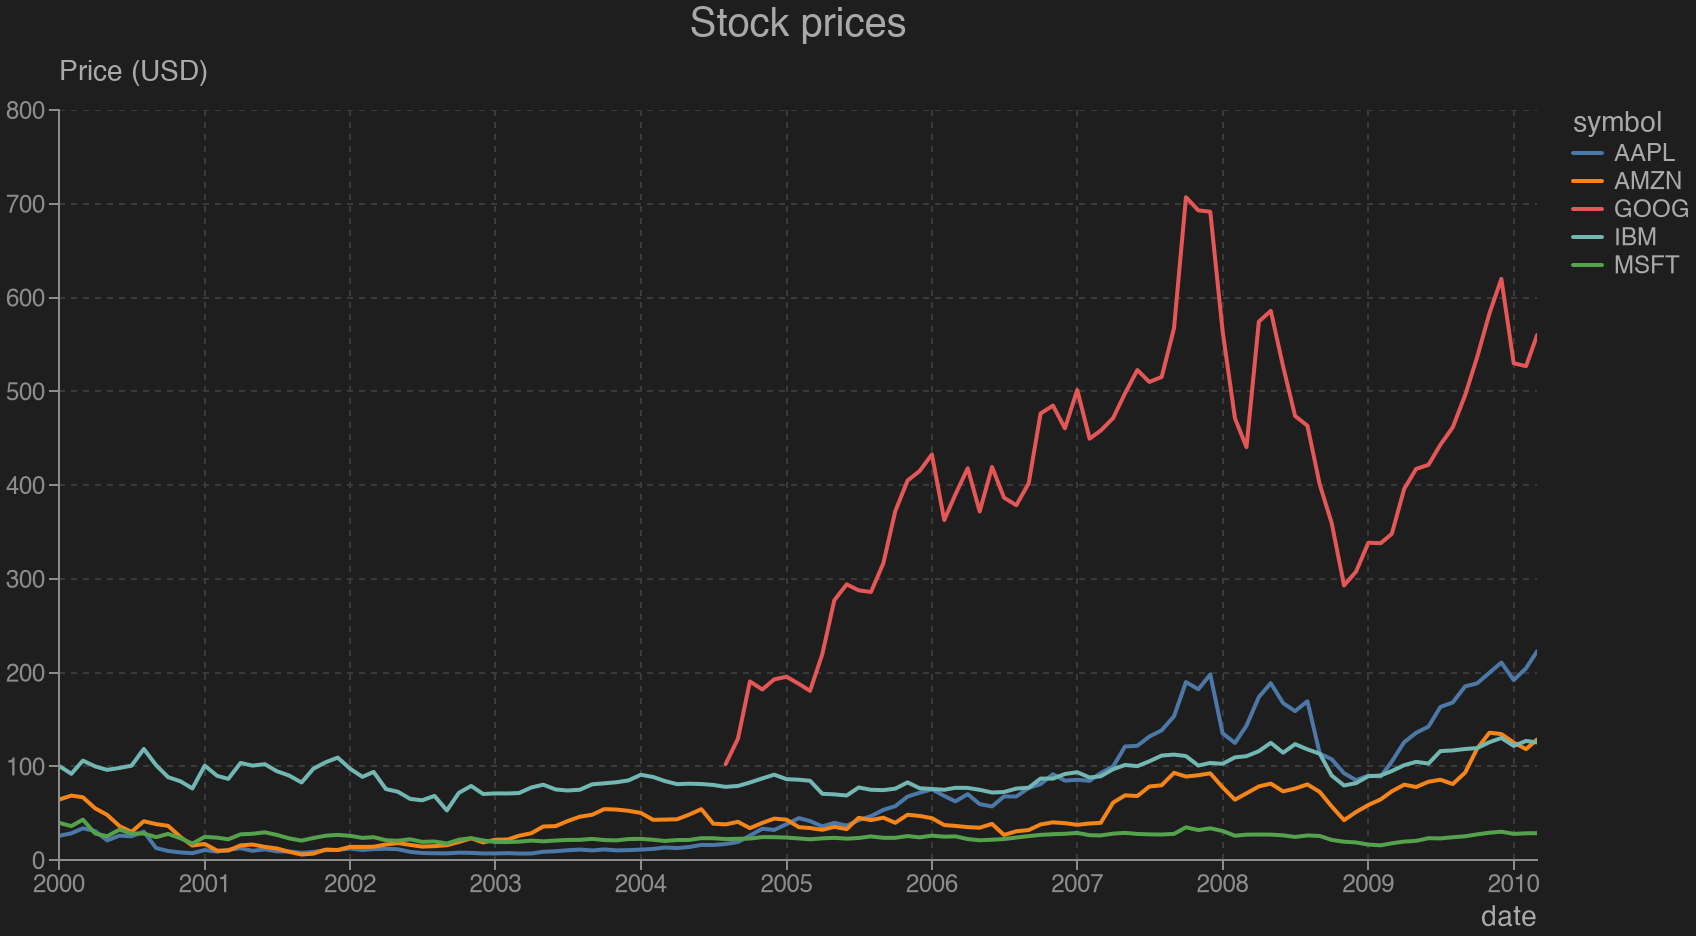
+
:start-after: <!-- docs-start -->
|
|
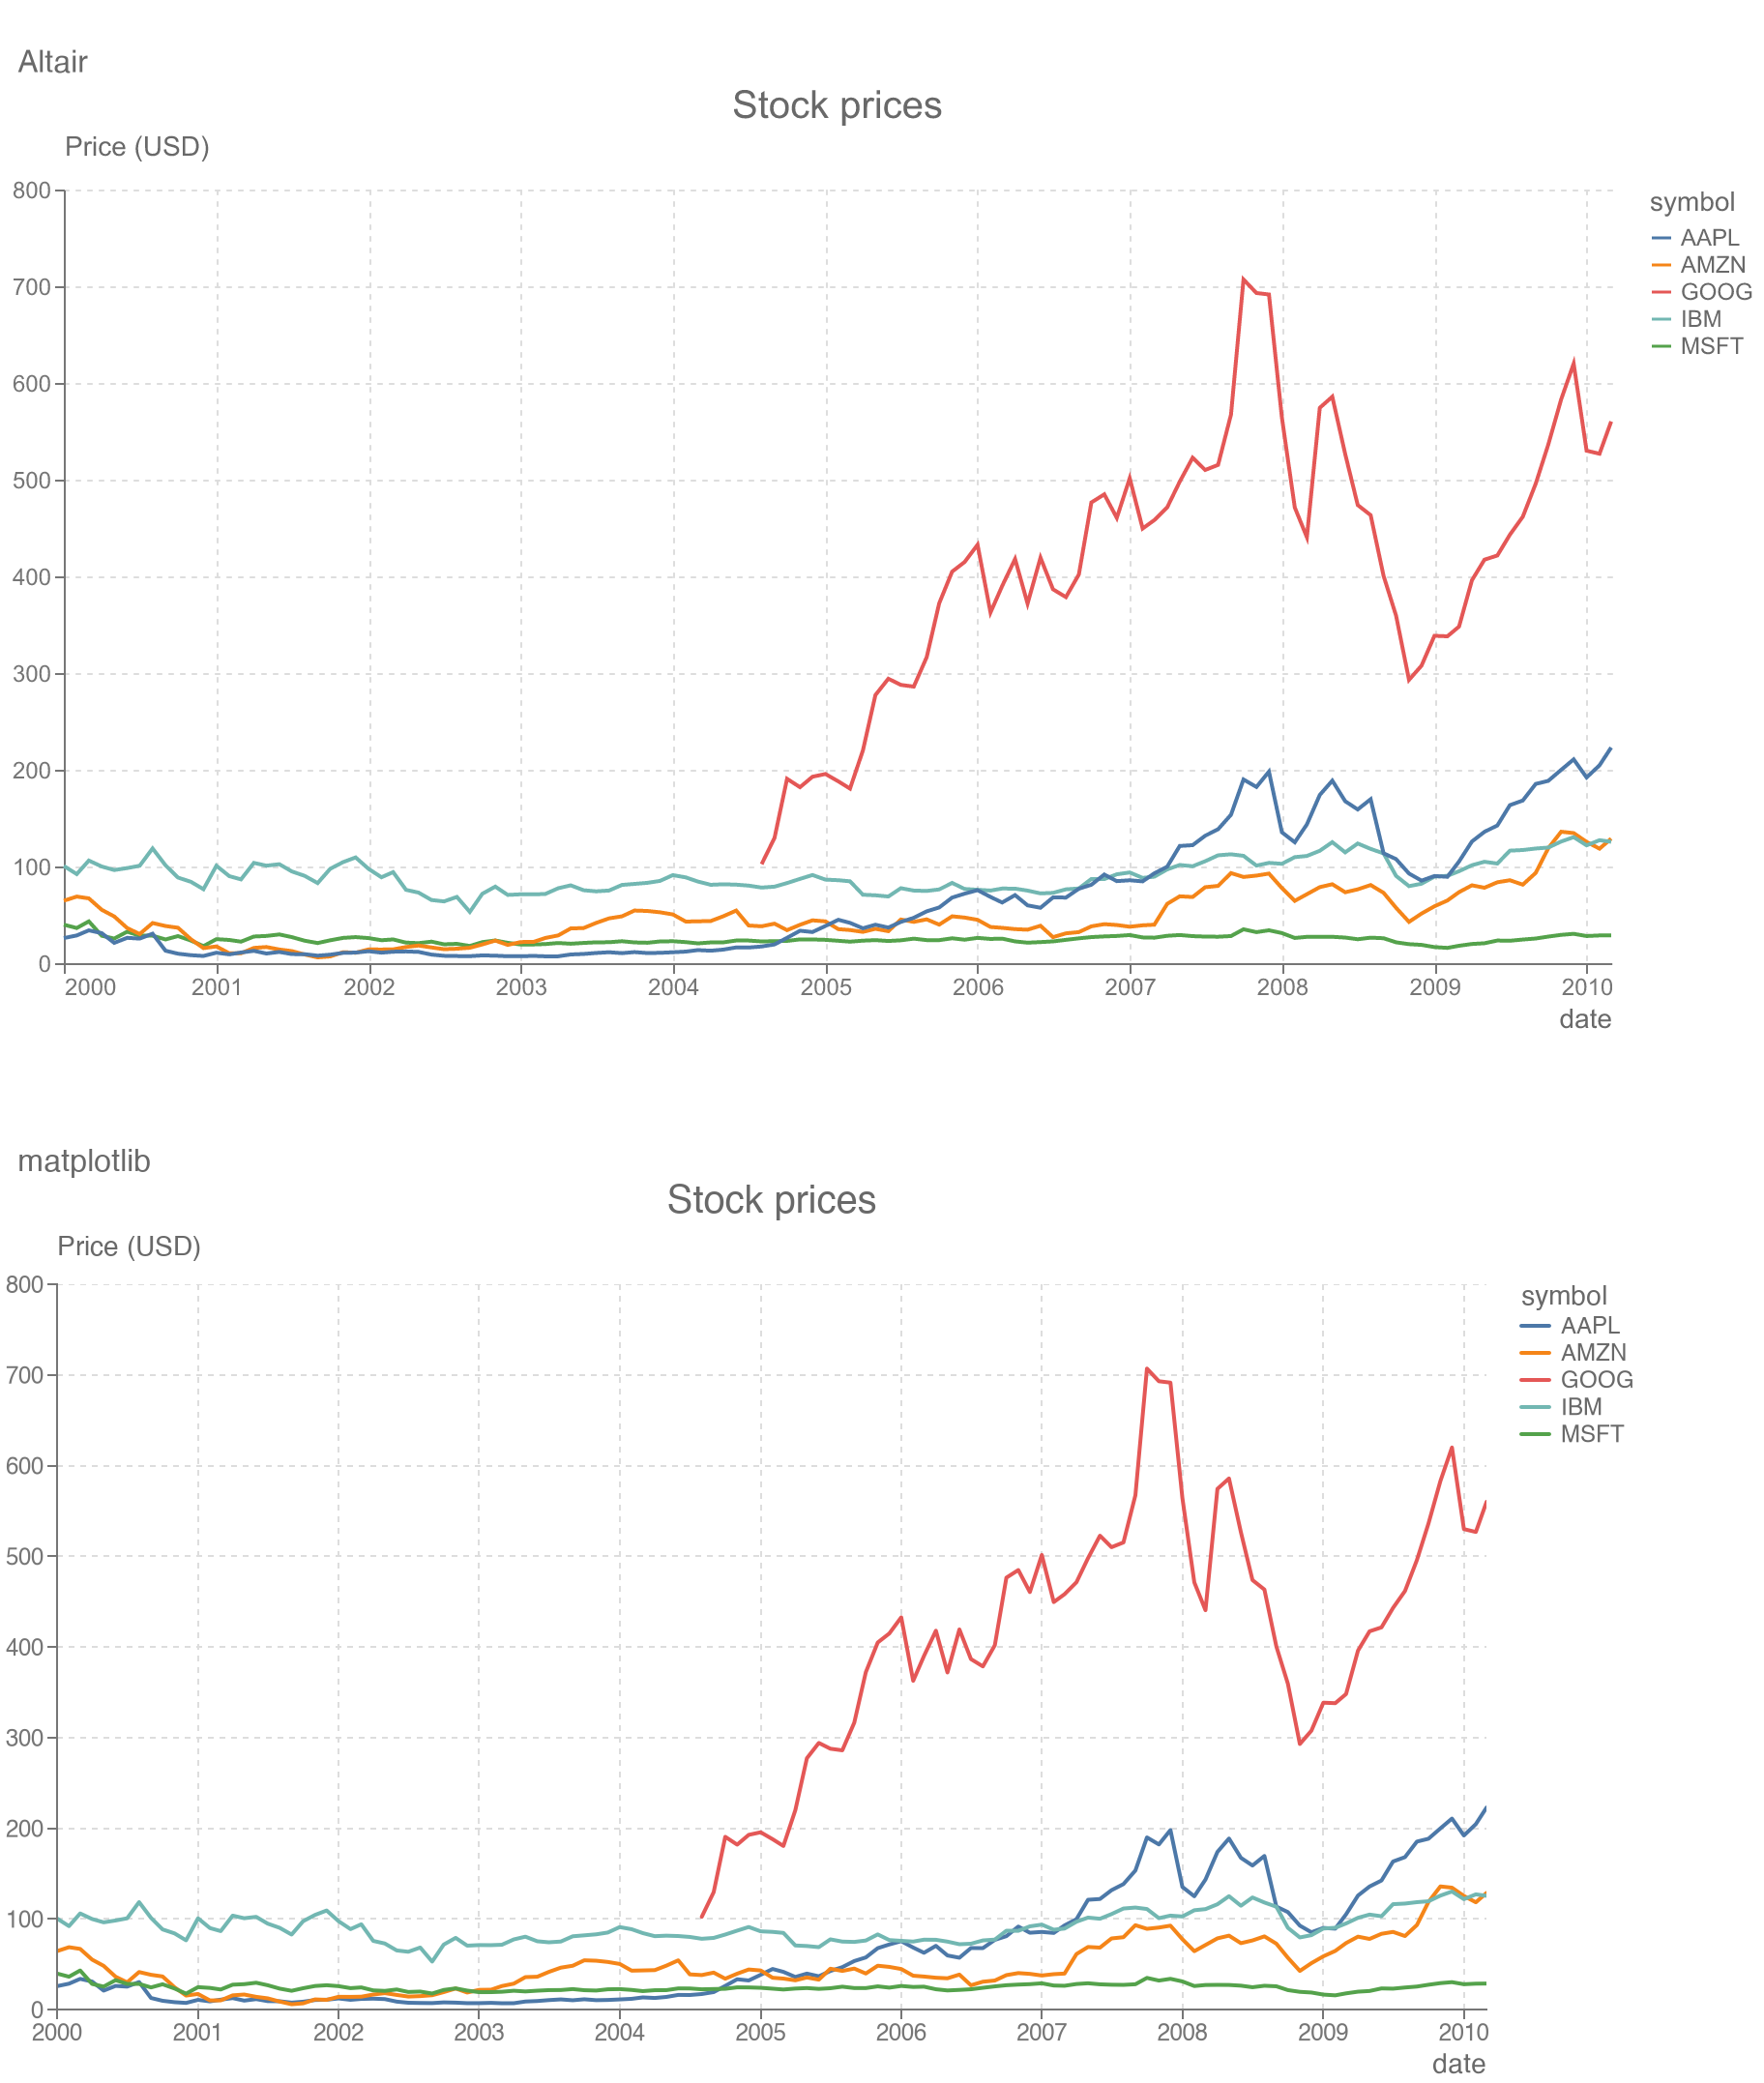
15
|
+
"""
|
|
16
|
+
|
|
17
|
+
from importlib.metadata import version
|
|
18
|
+
|
|
19
|
+
import matplotlib
|
|
20
|
+
import matplotlib.style
|
|
21
|
+
|
|
22
|
+
from camminady_matplotlib_theme.layout import install
|
|
23
|
+
from camminady_matplotlib_theme.theme import (
|
|
24
|
+
OKABE_ITO,
|
|
25
|
+
TABLEAU10,
|
|
26
|
+
Config,
|
|
27
|
+
config,
|
|
28
|
+
config_dark,
|
|
29
|
+
rc_params,
|
|
30
|
+
to_mplstyle,
|
|
31
|
+
)
|
|
32
|
+
|
|
33
|
+
__all__ = [
|
|
34
|
+
"OKABE_ITO",
|
|
35
|
+
"TABLEAU10",
|
|
36
|
+
"Config",
|
|
37
|
+
"install",
|
|
38
|
+
"rc_params",
|
|
39
|
+
"to_mplstyle",
|
|
40
|
+
]
|
|
41
|
+
__version__ = version("camminady-matplotlib-theme")
|
|
42
|
+
|
|
43
|
+
matplotlib.style.library["camminady"] = matplotlib.RcParams(rc_params(config))
|
|
44
|
+
matplotlib.style.library["camminady_dark"] = matplotlib.RcParams(
|
|
45
|
+
rc_params(config_dark)
|
|
46
|
+
)
|
|
47
|
+
matplotlib.style.available[:] = sorted(matplotlib.style.library)
|
|
@@ -0,0 +1,85 @@
|
|
|
1
|
+
figure.dpi: 72
|
|
2
|
+
savefig.dpi: 288
|
|
3
|
+
figure.figsize: 11.777777777777779, 6.5
|
|
4
|
+
figure.facecolor: white
|
|
5
|
+
figure.edgecolor: white
|
|
6
|
+
figure.titlesize: 20
|
|
7
|
+
figure.titleweight: normal
|
|
8
|
+
figure.labelsize: 14
|
|
9
|
+
figure.labelweight: normal
|
|
10
|
+
figure.constrained_layout.use: True
|
|
11
|
+
figure.hooks: camminady_matplotlib_theme.layout:install
|
|
12
|
+
font.family: sans-serif
|
|
13
|
+
font.sans-serif: Helvetica, Arial, Liberation Sans, DejaVu Sans
|
|
14
|
+
font.size: 12
|
|
15
|
+
font.weight: normal
|
|
16
|
+
text.color: dimgray
|
|
17
|
+
axes.facecolor: white
|
|
18
|
+
axes.edgecolor: 767676
|
|
19
|
+
axes.linewidth: 1
|
|
20
|
+
axes.spines.top: False
|
|
21
|
+
axes.spines.right: False
|
|
22
|
+
axes.grid: True
|
|
23
|
+
axes.grid.axis: both
|
|
24
|
+
axes.axisbelow: True
|
|
25
|
+
axes.labelcolor: dimgray
|
|
26
|
+
axes.labelsize: 14
|
|
27
|
+
axes.labelweight: normal
|
|
28
|
+
axes.labelpad: 4
|
|
29
|
+
axes.titlecolor: dimgray
|
|
30
|
+
axes.titlesize: 20
|
|
31
|
+
axes.titleweight: normal
|
|
32
|
+
axes.titlepad: 8
|
|
33
|
+
axes.prop_cycle: cycler('color', ['4c78a8', 'f58518', 'e45756', '72b7b2', '54a24b', 'eeca3b', 'b279a2', 'ff9da6', '9d755d', 'bab0ac'])
|
|
34
|
+
axes.autolimit_mode: round_numbers
|
|
35
|
+
axes.xmargin: 0
|
|
36
|
+
axes.ymargin: 0
|
|
37
|
+
xaxis.labellocation: right
|
|
38
|
+
yaxis.labellocation: top
|
|
39
|
+
grid.color: dddddd
|
|
40
|
+
grid.linewidth: 1
|
|
41
|
+
grid.linestyle: (0, (3, 3))
|
|
42
|
+
grid.alpha: 1
|
|
43
|
+
xtick.color: 767676
|
|
44
|
+
xtick.labelcolor: 767676
|
|
45
|
+
xtick.labelsize: 12
|
|
46
|
+
xtick.direction: out
|
|
47
|
+
xtick.major.size: 5
|
|
48
|
+
xtick.major.width: 1
|
|
49
|
+
xtick.major.pad: 2
|
|
50
|
+
xtick.minor.visible: False
|
|
51
|
+
ytick.color: 767676
|
|
52
|
+
ytick.labelcolor: 767676
|
|
53
|
+
ytick.labelsize: 12
|
|
54
|
+
ytick.direction: out
|
|
55
|
+
ytick.major.size: 5
|
|
56
|
+
ytick.major.width: 1
|
|
57
|
+
ytick.major.pad: 2
|
|
58
|
+
ytick.minor.visible: False
|
|
59
|
+
lines.linewidth: 2
|
|
60
|
+
lines.color: dimgray
|
|
61
|
+
lines.solid_capstyle: round
|
|
62
|
+
lines.markersize: 5.5
|
|
63
|
+
patch.facecolor: 4c78a8
|
|
64
|
+
patch.force_edgecolor: True
|
|
65
|
+
patch.edgecolor: white
|
|
66
|
+
patch.linewidth: 1
|
|
67
|
+
legend.frameon: False
|
|
68
|
+
legend.fontsize: 12
|
|
69
|
+
legend.title_fontsize: 14
|
|
70
|
+
legend.labelcolor: dimgray
|
|
71
|
+
legend.borderpad: 0
|
|
72
|
+
legend.labelspacing: 0.25
|
|
73
|
+
legend.handlelength: 1.2
|
|
74
|
+
legend.handletextpad: 0.5
|
|
75
|
+
boxplot.patchartist: True
|
|
76
|
+
boxplot.showcaps: False
|
|
77
|
+
boxplot.boxprops.color: 4c78a8
|
|
78
|
+
boxplot.whiskerprops.color: dimgray
|
|
79
|
+
boxplot.whiskerprops.linewidth: 1
|
|
80
|
+
boxplot.medianprops.color: white
|
|
81
|
+
boxplot.medianprops.linewidth: 1
|
|
82
|
+
boxplot.flierprops.marker: o
|
|
83
|
+
boxplot.flierprops.markerfacecolor: none
|
|
84
|
+
boxplot.flierprops.markeredgecolor: 4c78a8
|
|
85
|
+
errorbar.capsize: 0
|
|
@@ -0,0 +1,85 @@
|
|
|
1
|
+
figure.dpi: 72
|
|
2
|
+
savefig.dpi: 288
|
|
3
|
+
figure.figsize: 11.777777777777779, 6.5
|
|
4
|
+
figure.facecolor: 1e1e1e
|
|
5
|
+
figure.edgecolor: 1e1e1e
|
|
6
|
+
figure.titlesize: 20
|
|
7
|
+
figure.titleweight: normal
|
|
8
|
+
figure.labelsize: 14
|
|
9
|
+
figure.labelweight: normal
|
|
10
|
+
figure.constrained_layout.use: True
|
|
11
|
+
figure.hooks: camminady_matplotlib_theme.layout:install
|
|
12
|
+
font.family: sans-serif
|
|
13
|
+
font.sans-serif: Helvetica, Arial, Liberation Sans, DejaVu Sans
|
|
14
|
+
font.size: 12
|
|
15
|
+
font.weight: normal
|
|
16
|
+
text.color: a9a9a9
|
|
17
|
+
axes.facecolor: 1e1e1e
|
|
18
|
+
axes.edgecolor: 8c8c8c
|
|
19
|
+
axes.linewidth: 1
|
|
20
|
+
axes.spines.top: False
|
|
21
|
+
axes.spines.right: False
|
|
22
|
+
axes.grid: True
|
|
23
|
+
axes.grid.axis: both
|
|
24
|
+
axes.axisbelow: True
|
|
25
|
+
axes.labelcolor: a9a9a9
|
|
26
|
+
axes.labelsize: 14
|
|
27
|
+
axes.labelweight: normal
|
|
28
|
+
axes.labelpad: 4
|
|
29
|
+
axes.titlecolor: a9a9a9
|
|
30
|
+
axes.titlesize: 20
|
|
31
|
+
axes.titleweight: normal
|
|
32
|
+
axes.titlepad: 8
|
|
33
|
+
axes.prop_cycle: cycler('color', ['4c78a8', 'f58518', 'e45756', '72b7b2', '54a24b', 'eeca3b', 'b279a2', 'ff9da6', '9d755d', 'bab0ac'])
|
|
34
|
+
axes.autolimit_mode: round_numbers
|
|
35
|
+
axes.xmargin: 0
|
|
36
|
+
axes.ymargin: 0
|
|
37
|
+
xaxis.labellocation: right
|
|
38
|
+
yaxis.labellocation: top
|
|
39
|
+
grid.color: 3a3a3a
|
|
40
|
+
grid.linewidth: 1
|
|
41
|
+
grid.linestyle: (0, (3, 3))
|
|
42
|
+
grid.alpha: 1
|
|
43
|
+
xtick.color: 8c8c8c
|
|
44
|
+
xtick.labelcolor: 8c8c8c
|
|
45
|
+
xtick.labelsize: 12
|
|
46
|
+
xtick.direction: out
|
|
47
|
+
xtick.major.size: 5
|
|
48
|
+
xtick.major.width: 1
|
|
49
|
+
xtick.major.pad: 2
|
|
50
|
+
xtick.minor.visible: False
|
|
51
|
+
ytick.color: 8c8c8c
|
|
52
|
+
ytick.labelcolor: 8c8c8c
|
|
53
|
+
ytick.labelsize: 12
|
|
54
|
+
ytick.direction: out
|
|
55
|
+
ytick.major.size: 5
|
|
56
|
+
ytick.major.width: 1
|
|
57
|
+
ytick.major.pad: 2
|
|
58
|
+
ytick.minor.visible: False
|
|
59
|
+
lines.linewidth: 2
|
|
60
|
+
lines.color: a9a9a9
|
|
61
|
+
lines.solid_capstyle: round
|
|
62
|
+
lines.markersize: 5.5
|
|
63
|
+
patch.facecolor: 4c78a8
|
|
64
|
+
patch.force_edgecolor: True
|
|
65
|
+
patch.edgecolor: 1e1e1e
|
|
66
|
+
patch.linewidth: 1
|
|
67
|
+
legend.frameon: False
|
|
68
|
+
legend.fontsize: 12
|
|
69
|
+
legend.title_fontsize: 14
|
|
70
|
+
legend.labelcolor: a9a9a9
|
|
71
|
+
legend.borderpad: 0
|
|
72
|
+
legend.labelspacing: 0.25
|
|
73
|
+
legend.handlelength: 1.2
|
|
74
|
+
legend.handletextpad: 0.5
|
|
75
|
+
boxplot.patchartist: True
|
|
76
|
+
boxplot.showcaps: False
|
|
77
|
+
boxplot.boxprops.color: 4c78a8
|
|
78
|
+
boxplot.whiskerprops.color: a9a9a9
|
|
79
|
+
boxplot.whiskerprops.linewidth: 1
|
|
80
|
+
boxplot.medianprops.color: white
|
|
81
|
+
boxplot.medianprops.linewidth: 1
|
|
82
|
+
boxplot.flierprops.marker: o
|
|
83
|
+
boxplot.flierprops.markerfacecolor: none
|
|
84
|
+
boxplot.flierprops.markeredgecolor: 4c78a8
|
|
85
|
+
errorbar.capsize: 0
|
|
@@ -0,0 +1,242 @@
|
|
|
1
|
+
"""Place axis titles, legends and ticks like the camminady Altair theme.
|
|
2
|
+
|
|
3
|
+
matplotlib has no rcParams for a horizontal y-axis title above the axis, for
|
|
4
|
+
a legend outside the plot or for Vega's tick density, so the styles register
|
|
5
|
+
`install` as a figure hook. It gives each figure created with ``plt.figure``
|
|
6
|
+
or ``plt.subplots`` a constrained layout engine that, before every layout
|
|
7
|
+
pass:
|
|
8
|
+
|
|
9
|
+
- turns the y-axis title horizontal and moves it above the axis, aligned
|
|
10
|
+
with the axis line (a right y axis gets a right-aligned title),
|
|
11
|
+
- lifts the title of the axes above that y-axis title,
|
|
12
|
+
- moves a legend whose location was not chosen outside the plot, to the
|
|
13
|
+
right of it, with a left-aligned title,
|
|
14
|
+
- replaces the default tick locator of linear axes with one that places
|
|
15
|
+
ticks and rounds the axis limits like Vega (see `ticks`),
|
|
16
|
+
- removes grid lines across categorical axes (string data, or ticks with
|
|
17
|
+
fixed labels such as those of a boxplot), which Vega does not draw for
|
|
18
|
+
band scales, and across images.
|
|
19
|
+
|
|
20
|
+
Figures created with another layout engine (``layout="tight"`` or
|
|
21
|
+
``layout="none"``) are left alone. For figures not created through pyplot,
|
|
22
|
+
call ``install(fig)`` yourself.
|
|
23
|
+
"""
|
|
24
|
+
|
|
25
|
+
import math
|
|
26
|
+
from typing import Final
|
|
27
|
+
|
|
28
|
+
import matplotlib as mpl
|
|
29
|
+
from matplotlib.artist import Artist
|
|
30
|
+
from matplotlib.axes import Axes
|
|
31
|
+
from matplotlib.axis import Axis
|
|
32
|
+
from matplotlib.backend_bases import RendererBase
|
|
33
|
+
from matplotlib.category import StrCategoryConverter
|
|
34
|
+
from matplotlib.figure import Figure
|
|
35
|
+
from matplotlib.layout_engine import ConstrainedLayoutEngine
|
|
36
|
+
from matplotlib.text import Text
|
|
37
|
+
from matplotlib.ticker import AutoLocator, FixedFormatter
|
|
38
|
+
from matplotlib.transforms import Bbox, ScaledTranslation
|
|
39
|
+
|
|
40
|
+
from camminady_matplotlib_theme.ticks import PIXELS_PER_TICK, VegaLocator
|
|
41
|
+
|
|
42
|
+
Y_TITLE_OFFSET: Final = 15.0
|
|
43
|
+
"""Distance between the top of the plot and the baseline of the y title."""
|
|
44
|
+
|
|
45
|
+
LEGEND_OFFSET: Final = 18.0
|
|
46
|
+
"""Distance between the plot and a legend outside of it (Vega's default)."""
|
|
47
|
+
|
|
48
|
+
|
|
49
|
+
class ThemeLayoutEngine(ConstrainedLayoutEngine):
|
|
50
|
+
"""Constrained layout that first arranges titles, legends and ticks."""
|
|
51
|
+
|
|
52
|
+
def execute(self, fig: Figure) -> dict: # ty: ignore[invalid-method-override]
|
|
53
|
+
"""Arrange all axes of ``fig``, then run the constrained layout."""
|
|
54
|
+
for ax in fig.axes:
|
|
55
|
+
arrange(ax)
|
|
56
|
+
result = super().execute(fig)
|
|
57
|
+
# The tick count depends on the axis length, which the layout has
|
|
58
|
+
# just changed; lay out again with the new tick labels if needed.
|
|
59
|
+
# A list, not a generator: update every axes, do not short-circuit.
|
|
60
|
+
if any([_update_tick_count(ax) for ax in fig.axes]): # noqa: C419
|
|
61
|
+
result = super().execute(fig)
|
|
62
|
+
return result
|
|
63
|
+
|
|
64
|
+
|
|
65
|
+
def install(fig: Figure) -> None:
|
|
66
|
+
"""Use the theme's layout for ``fig`` if it has a constrained layout.
|
|
67
|
+
|
|
68
|
+
Parameters
|
|
69
|
+
----------
|
|
70
|
+
fig
|
|
71
|
+
A figure, typically one just created by ``plt.figure``.
|
|
72
|
+
"""
|
|
73
|
+
engine = fig.get_layout_engine()
|
|
74
|
+
if type(engine) is not ConstrainedLayoutEngine:
|
|
75
|
+
return
|
|
76
|
+
fig.set_layout_engine(
|
|
77
|
+
ThemeLayoutEngine(
|
|
78
|
+
# `compress` is not part of the engine's public parameters.
|
|
79
|
+
compress=getattr(engine, "_compress", False),
|
|
80
|
+
**engine.get(),
|
|
81
|
+
)
|
|
82
|
+
)
|
|
83
|
+
|
|
84
|
+
|
|
85
|
+
def arrange(ax: Axes) -> None:
|
|
86
|
+
"""Place the axis titles, title, legend and ticks of ``ax``.
|
|
87
|
+
|
|
88
|
+
Parameters
|
|
89
|
+
----------
|
|
90
|
+
ax
|
|
91
|
+
Axes to arrange. Only rectilinear axes are changed.
|
|
92
|
+
"""
|
|
93
|
+
fig = ax.get_figure(root=True)
|
|
94
|
+
if ax.name != "rectilinear" or fig is None:
|
|
95
|
+
return
|
|
96
|
+
twins = _twins(ax)
|
|
97
|
+
_place_y_title(ax, fig)
|
|
98
|
+
_place_title(ax, fig, twins)
|
|
99
|
+
_place_legend(ax, fig, twins)
|
|
100
|
+
for axis in (ax.xaxis, ax.yaxis):
|
|
101
|
+
if ax.images or _is_categorical(axis):
|
|
102
|
+
axis.grid(False)
|
|
103
|
+
# Colorbars keep their own ticks, like Vega's gradient legends.
|
|
104
|
+
if ax.get_label() == "<colorbar>":
|
|
105
|
+
continue
|
|
106
|
+
if type(axis.get_major_locator()) is AutoLocator:
|
|
107
|
+
axis.set_major_locator(VegaLocator())
|
|
108
|
+
# Still the default, so that e.g. categorical data replaces it.
|
|
109
|
+
axis.isDefault_majloc = True
|
|
110
|
+
# Round the limits with the new locator; this does nothing if
|
|
111
|
+
# the limits were set explicitly.
|
|
112
|
+
ax.autoscale_view(scalex=axis is ax.xaxis, scaley=axis is ax.yaxis)
|
|
113
|
+
_update_tick_count(ax)
|
|
114
|
+
|
|
115
|
+
|
|
116
|
+
def _is_categorical(axis: Axis) -> bool:
|
|
117
|
+
return isinstance(axis.get_converter(), StrCategoryConverter) or isinstance(
|
|
118
|
+
axis.get_major_formatter(), FixedFormatter
|
|
119
|
+
)
|
|
120
|
+
|
|
121
|
+
|
|
122
|
+
def _update_tick_count(ax: Axes) -> bool:
|
|
123
|
+
"""Set the tick count from the axis length; return whether it changed."""
|
|
124
|
+
fig = ax.get_figure(root=True)
|
|
125
|
+
if ax.name != "rectilinear" or fig is None:
|
|
126
|
+
return False
|
|
127
|
+
changed = False
|
|
128
|
+
position = ax.get_position()
|
|
129
|
+
width, height = fig.get_size_inches() * 72
|
|
130
|
+
for axis, length in (
|
|
131
|
+
(ax.xaxis, position.width * width),
|
|
132
|
+
(ax.yaxis, position.height * height),
|
|
133
|
+
):
|
|
134
|
+
locator = axis.get_major_locator()
|
|
135
|
+
if isinstance(locator, VegaLocator):
|
|
136
|
+
count = math.ceil(length / PIXELS_PER_TICK)
|
|
137
|
+
changed |= locator.count != count
|
|
138
|
+
locator.count = count
|
|
139
|
+
return changed
|
|
140
|
+
|
|
141
|
+
|
|
142
|
+
def _twins(ax: Axes) -> list[Axes]:
|
|
143
|
+
"""Axes that share the plot area of ``ax``, including ``ax`` itself."""
|
|
144
|
+
fig = ax.get_figure(root=False)
|
|
145
|
+
if fig is None:
|
|
146
|
+
return [ax]
|
|
147
|
+
bounds = ax.get_position().bounds
|
|
148
|
+
return [a for a in fig.axes if a.get_position().bounds == bounds]
|
|
149
|
+
|
|
150
|
+
|
|
151
|
+
def _offset(fig: Figure, dx: float = 0, dy: float = 0) -> ScaledTranslation:
|
|
152
|
+
"""Translation by ``dx`` and ``dy`` points."""
|
|
153
|
+
return ScaledTranslation(dx / 72, dy / 72, fig.dpi_scale_trans)
|
|
154
|
+
|
|
155
|
+
|
|
156
|
+
class _TitleExtent(Artist):
|
|
157
|
+
"""Invisible artist that makes the layout reserve room for a y title.
|
|
158
|
+
|
|
159
|
+
Constrained layout only counts one pixel of the height of a y-axis
|
|
160
|
+
title (it expects a rotated title), so a horizontal title above the
|
|
161
|
+
axis would be cut off at the top of the figure.
|
|
162
|
+
"""
|
|
163
|
+
|
|
164
|
+
def __init__(self, axis: Axis) -> None:
|
|
165
|
+
super().__init__()
|
|
166
|
+
self._title: Text = axis.label
|
|
167
|
+
self.set_label("_camminady_y_title_extent")
|
|
168
|
+
|
|
169
|
+
def get_window_extent(self, renderer: RendererBase | None = None) -> Bbox:
|
|
170
|
+
if not (self._title.get_visible() and self._title.get_text()):
|
|
171
|
+
return Bbox.null()
|
|
172
|
+
return self._title.get_window_extent(renderer)
|
|
173
|
+
|
|
174
|
+
def get_tightbbox(self, renderer: RendererBase | None = None) -> Bbox:
|
|
175
|
+
return self.get_window_extent(renderer)
|
|
176
|
+
|
|
177
|
+
def draw(self, renderer: RendererBase) -> None:
|
|
178
|
+
pass
|
|
179
|
+
|
|
180
|
+
|
|
181
|
+
def _place_y_title(ax: Axes, fig: Figure) -> None:
|
|
182
|
+
label = ax.yaxis.label
|
|
183
|
+
# Leave titles alone that the user rotated to some other angle.
|
|
184
|
+
if label.get_rotation() not in (0, 90):
|
|
185
|
+
return
|
|
186
|
+
right = ax.yaxis.get_label_position() == "right"
|
|
187
|
+
ax.yaxis.set_label_coords(
|
|
188
|
+
1 if right else 0,
|
|
189
|
+
1,
|
|
190
|
+
transform=ax.transAxes + _offset(fig, dy=Y_TITLE_OFFSET),
|
|
191
|
+
)
|
|
192
|
+
label.set(
|
|
193
|
+
rotation=0,
|
|
194
|
+
horizontalalignment="right" if right else "left",
|
|
195
|
+
verticalalignment="baseline",
|
|
196
|
+
)
|
|
197
|
+
if not any(isinstance(a, _TitleExtent) for a in ax.artists):
|
|
198
|
+
extent = ax.add_artist(_TitleExtent(ax.yaxis))
|
|
199
|
+
# `add_artist` clips to the axes, which hides it from the layout.
|
|
200
|
+
extent.set_clip_on(False)
|
|
201
|
+
if ax.yaxis.get_ticks_position() == "right":
|
|
202
|
+
# A secondary y axis (`ax.twinx()`) gets the axis line that the
|
|
203
|
+
# style hides on the right.
|
|
204
|
+
ax.spines.right.set_visible(True)
|
|
205
|
+
ax.spines.left.set_visible(False)
|
|
206
|
+
|
|
207
|
+
|
|
208
|
+
def _has_y_title(ax: Axes) -> bool:
|
|
209
|
+
label = ax.yaxis.label
|
|
210
|
+
return bool(label.get_visible() and label.get_text())
|
|
211
|
+
|
|
212
|
+
|
|
213
|
+
def _place_title(ax: Axes, fig: Figure, twins: list[Axes]) -> None:
|
|
214
|
+
pad = mpl.rcParams["axes.titlepad"]
|
|
215
|
+
titled = [a for a in twins if _has_y_title(a)]
|
|
216
|
+
if titled:
|
|
217
|
+
size = max(
|
|
218
|
+
a.yaxis.label.get_fontproperties().get_size_in_points()
|
|
219
|
+
for a in titled
|
|
220
|
+
)
|
|
221
|
+
pad += Y_TITLE_OFFSET + size
|
|
222
|
+
ax.title.set_transform(ax.transAxes + _offset(fig, dy=pad))
|
|
223
|
+
|
|
224
|
+
|
|
225
|
+
def _place_legend(ax: Axes, fig: Figure, twins: list[Axes]) -> None:
|
|
226
|
+
legend = ax.get_legend()
|
|
227
|
+
# `_loc_used_default` is True only while the location is the default
|
|
228
|
+
# one, i.e. neither passed to `legend()` nor set since; the legend is
|
|
229
|
+
# moved once.
|
|
230
|
+
if legend is None or not getattr(legend, "_loc_used_default", False):
|
|
231
|
+
return
|
|
232
|
+
if legend.get_bbox_to_anchor() is not ax.bbox:
|
|
233
|
+
return
|
|
234
|
+
# A secondary y axis would need the legend further right.
|
|
235
|
+
if any(a.yaxis.get_ticks_position() == "right" for a in twins):
|
|
236
|
+
return
|
|
237
|
+
legend.set_loc("upper left")
|
|
238
|
+
legend.set_bbox_to_anchor(
|
|
239
|
+
(1, 1), transform=ax.transAxes + _offset(fig, dx=LEGEND_OFFSET)
|
|
240
|
+
)
|
|
241
|
+
legend.borderaxespad = 0
|
|
242
|
+
legend.set_alignment("left")
|
|
File without changes
|
|
@@ -0,0 +1,286 @@
|
|
|
1
|
+
"""Design tokens and matplotlib rcParams of the camminady styles.
|
|
2
|
+
|
|
3
|
+
The tokens and their defaults are those of the Altair theme in
|
|
4
|
+
``camminady_altair_theme``, so that charts made with either library look
|
|
5
|
+
alike. Sizes are in points; the styles set ``figure.dpi`` to 72, so that one
|
|
6
|
+
point is one pixel on screen, as in Vega.
|
|
7
|
+
"""
|
|
8
|
+
|
|
9
|
+
from collections.abc import Mapping
|
|
10
|
+
from dataclasses import dataclass
|
|
11
|
+
from typing import Any, Final, Literal
|
|
12
|
+
|
|
13
|
+
from cycler import Cycler, cycler
|
|
14
|
+
|
|
15
|
+
FontWeight = Literal[
|
|
16
|
+
"normal",
|
|
17
|
+
"bold",
|
|
18
|
+
100,
|
|
19
|
+
200,
|
|
20
|
+
300,
|
|
21
|
+
400,
|
|
22
|
+
500,
|
|
23
|
+
600,
|
|
24
|
+
700,
|
|
25
|
+
800,
|
|
26
|
+
900,
|
|
27
|
+
]
|
|
28
|
+
|
|
29
|
+
TABLEAU10: Final[tuple[str, ...]] = (
|
|
30
|
+
"#4c78a8",
|
|
31
|
+
"#f58518",
|
|
32
|
+
"#e45756",
|
|
33
|
+
"#72b7b2",
|
|
34
|
+
"#54a24b",
|
|
35
|
+
"#eeca3b",
|
|
36
|
+
"#b279a2",
|
|
37
|
+
"#ff9da6",
|
|
38
|
+
"#9d755d",
|
|
39
|
+
"#bab0ac",
|
|
40
|
+
)
|
|
41
|
+
"""Vega's default ``tableau10`` category palette, used as the colour cycle."""
|
|
42
|
+
|
|
43
|
+
OKABE_ITO: Final[tuple[str, ...]] = (
|
|
44
|
+
"#0072b2", # blue
|
|
45
|
+
"#e69f00", # orange
|
|
46
|
+
"#009e73", # bluish green
|
|
47
|
+
"#cc79a7", # reddish purple
|
|
48
|
+
"#56b4e9", # sky blue
|
|
49
|
+
"#d55e00", # vermillion
|
|
50
|
+
"#f0e442", # yellow
|
|
51
|
+
)
|
|
52
|
+
"""Okabe-Ito palette (without black), ordered blue and orange first.
|
|
53
|
+
|
|
54
|
+
The 3rd (red) and 5th (green) colour of the default cycle are nearly
|
|
55
|
+
indistinguishable with deuteranopia. Use this palette when a chart has more
|
|
56
|
+
than four categories, e.g. ``ax.set_prop_cycle(color=OKABE_ITO)``.
|
|
57
|
+
"""
|
|
58
|
+
|
|
59
|
+
SANS_SERIF: Final[tuple[str, ...]] = (
|
|
60
|
+
"Helvetica",
|
|
61
|
+
"Arial",
|
|
62
|
+
"Liberation Sans",
|
|
63
|
+
"DejaVu Sans",
|
|
64
|
+
)
|
|
65
|
+
"""Fonts closest to the ``sans-serif`` font that Vega uses in browsers."""
|
|
66
|
+
|
|
67
|
+
HOOK: Final = "camminady_matplotlib_theme.layout:install"
|
|
68
|
+
"""Figure hook that places axis titles and legends like the Altair theme."""
|
|
69
|
+
|
|
70
|
+
# Space around a plot area of `width` x `height` for tick labels and axis
|
|
71
|
+
# titles, so that a chart without a legend gets about that plot area.
|
|
72
|
+
MARGIN_WIDTH: Final = 48
|
|
73
|
+
MARGIN_HEIGHT: Final = 68
|
|
74
|
+
|
|
75
|
+
|
|
76
|
+
@dataclass
|
|
77
|
+
class Config:
|
|
78
|
+
"""Design tokens from which a style is built.
|
|
79
|
+
|
|
80
|
+
Attributes
|
|
81
|
+
----------
|
|
82
|
+
color_primary
|
|
83
|
+
Titles, axis titles, legends and text.
|
|
84
|
+
color_secondary
|
|
85
|
+
Tick labels, ticks and axis lines.
|
|
86
|
+
color_background
|
|
87
|
+
Background of the figure and the axes.
|
|
88
|
+
color_grid
|
|
89
|
+
Dashed grid lines.
|
|
90
|
+
color_rule
|
|
91
|
+
Lines without a colour of their own, such as ``ax.axhline`` and
|
|
92
|
+
boxplot whiskers.
|
|
93
|
+
font_weight
|
|
94
|
+
Weight of all text.
|
|
95
|
+
size_small
|
|
96
|
+
Font size of tick labels, legend labels and text in points.
|
|
97
|
+
size_medium
|
|
98
|
+
Font size of axis titles and legend titles in points.
|
|
99
|
+
size_large
|
|
100
|
+
Font size of titles in points.
|
|
101
|
+
height
|
|
102
|
+
Approximate height of the plot area of a single chart in points.
|
|
103
|
+
width
|
|
104
|
+
Approximate width of the plot area of a single chart in points.
|
|
105
|
+
"""
|
|
106
|
+
|
|
107
|
+
color_primary: str = "dimgray"
|
|
108
|
+
# "gray" (#808080) has a contrast of 3.9:1 on white, below the 4.5:1 that
|
|
109
|
+
# WCAG AA requires for small text such as tick labels; #767676 passes.
|
|
110
|
+
color_secondary: str = "#767676"
|
|
111
|
+
color_background: str = "white"
|
|
112
|
+
color_grid: str = "#dddddd"
|
|
113
|
+
color_rule: str = "dimgray"
|
|
114
|
+
font_weight: FontWeight = "normal"
|
|
115
|
+
size_small: float = 12
|
|
116
|
+
size_medium: float = 14
|
|
117
|
+
size_large: float = 20
|
|
118
|
+
height: float = 400
|
|
119
|
+
width: float = 800
|
|
120
|
+
|
|
121
|
+
|
|
122
|
+
config = Config()
|
|
123
|
+
"""Tokens of the ``"camminady"`` style."""
|
|
124
|
+
|
|
125
|
+
config_dark = Config(
|
|
126
|
+
color_primary="#a9a9a9",
|
|
127
|
+
color_secondary="#8c8c8c",
|
|
128
|
+
color_background="#1e1e1e",
|
|
129
|
+
color_grid="#3a3a3a",
|
|
130
|
+
color_rule="#a9a9a9",
|
|
131
|
+
)
|
|
132
|
+
"""Tokens of the ``"camminady_dark"`` style."""
|
|
133
|
+
|
|
134
|
+
|
|
135
|
+
def rc_params(c: Config) -> dict[str, Any]:
|
|
136
|
+
"""Return the matplotlib rcParams of a style built from ``c``.
|
|
137
|
+
|
|
138
|
+
Parameters
|
|
139
|
+
----------
|
|
140
|
+
c
|
|
141
|
+
Colours, font sizes and dimensions of the style.
|
|
142
|
+
|
|
143
|
+
Returns
|
|
144
|
+
-------
|
|
145
|
+
dict[str, Any]
|
|
146
|
+
rcParams that can be passed to ``plt.style.use`` or
|
|
147
|
+
``plt.style.context``.
|
|
148
|
+
"""
|
|
149
|
+
ticks = {
|
|
150
|
+
"color": c.color_secondary,
|
|
151
|
+
"labelcolor": c.color_secondary,
|
|
152
|
+
"labelsize": c.size_small,
|
|
153
|
+
"direction": "out",
|
|
154
|
+
"major.size": 5,
|
|
155
|
+
"major.width": 1,
|
|
156
|
+
"major.pad": 2,
|
|
157
|
+
"minor.visible": False,
|
|
158
|
+
}
|
|
159
|
+
return {
|
|
160
|
+
# One point is one pixel on screen, as in Vega. Saved files get four pixels per point:
|
|
161
|
+
# at twice that (144 dpi) PNGs looked blurry once scaled up in documents.
|
|
162
|
+
"figure.dpi": 72,
|
|
163
|
+
"savefig.dpi": 288,
|
|
164
|
+
"figure.figsize": (
|
|
165
|
+
(c.width + MARGIN_WIDTH) / 72,
|
|
166
|
+
(c.height + MARGIN_HEIGHT) / 72,
|
|
167
|
+
),
|
|
168
|
+
"figure.facecolor": c.color_background,
|
|
169
|
+
"figure.edgecolor": c.color_background,
|
|
170
|
+
"figure.titlesize": c.size_large,
|
|
171
|
+
"figure.titleweight": c.font_weight,
|
|
172
|
+
"figure.labelsize": c.size_medium,
|
|
173
|
+
"figure.labelweight": c.font_weight,
|
|
174
|
+
"figure.constrained_layout.use": True,
|
|
175
|
+
"figure.hooks": [HOOK],
|
|
176
|
+
"font.family": "sans-serif",
|
|
177
|
+
"font.sans-serif": list(SANS_SERIF),
|
|
178
|
+
"font.size": c.size_small,
|
|
179
|
+
"font.weight": c.font_weight,
|
|
180
|
+
"text.color": c.color_primary,
|
|
181
|
+
"axes.facecolor": c.color_background,
|
|
182
|
+
"axes.edgecolor": c.color_secondary,
|
|
183
|
+
"axes.linewidth": 1,
|
|
184
|
+
"axes.spines.top": False,
|
|
185
|
+
"axes.spines.right": False,
|
|
186
|
+
"axes.grid": True,
|
|
187
|
+
"axes.grid.axis": "both",
|
|
188
|
+
"axes.axisbelow": True,
|
|
189
|
+
"axes.labelcolor": c.color_primary,
|
|
190
|
+
"axes.labelsize": c.size_medium,
|
|
191
|
+
"axes.labelweight": c.font_weight,
|
|
192
|
+
"axes.labelpad": 4,
|
|
193
|
+
"axes.titlecolor": c.color_primary,
|
|
194
|
+
"axes.titlesize": c.size_large,
|
|
195
|
+
"axes.titleweight": c.font_weight,
|
|
196
|
+
"axes.titlepad": 8,
|
|
197
|
+
"axes.prop_cycle": _color_cycle(),
|
|
198
|
+
# Like Vega's "nice" scales: axes end at a tick, without padding.
|
|
199
|
+
"axes.autolimit_mode": "round_numbers",
|
|
200
|
+
"axes.xmargin": 0,
|
|
201
|
+
"axes.ymargin": 0,
|
|
202
|
+
# The y title is moved above the axis by the figure hook; without
|
|
203
|
+
# the hook it stays rotated at the top of the axis.
|
|
204
|
+
"xaxis.labellocation": "right",
|
|
205
|
+
"yaxis.labellocation": "top",
|
|
206
|
+
"grid.color": c.color_grid,
|
|
207
|
+
"grid.linewidth": 1,
|
|
208
|
+
# Vega draws 2-on-4-off dashes with round caps, which look like
|
|
209
|
+
# 3-on-3-off dashes with the butt caps matplotlib uses.
|
|
210
|
+
"grid.linestyle": (0, (3, 3)),
|
|
211
|
+
"grid.alpha": 1,
|
|
212
|
+
**{f"xtick.{key}": value for key, value in ticks.items()},
|
|
213
|
+
**{f"ytick.{key}": value for key, value in ticks.items()},
|
|
214
|
+
"lines.linewidth": 2,
|
|
215
|
+
"lines.color": c.color_rule,
|
|
216
|
+
"lines.solid_capstyle": "round",
|
|
217
|
+
# The area of a Vega point is 30 square pixels.
|
|
218
|
+
"lines.markersize": 5.5,
|
|
219
|
+
"patch.facecolor": TABLEAU10[0],
|
|
220
|
+
# Separate adjacent bars, such as histogram bins, like Vega's
|
|
221
|
+
# one-pixel bin spacing.
|
|
222
|
+
"patch.force_edgecolor": True,
|
|
223
|
+
"patch.edgecolor": c.color_background,
|
|
224
|
+
"patch.linewidth": 1,
|
|
225
|
+
"legend.frameon": False,
|
|
226
|
+
"legend.fontsize": c.size_small,
|
|
227
|
+
"legend.title_fontsize": c.size_medium,
|
|
228
|
+
"legend.labelcolor": c.color_primary,
|
|
229
|
+
"legend.borderpad": 0,
|
|
230
|
+
"legend.labelspacing": 0.25,
|
|
231
|
+
"legend.handlelength": 1.2,
|
|
232
|
+
"legend.handletextpad": 0.5,
|
|
233
|
+
"boxplot.patchartist": True,
|
|
234
|
+
"boxplot.showcaps": False,
|
|
235
|
+
"boxplot.boxprops.color": TABLEAU10[0],
|
|
236
|
+
"boxplot.whiskerprops.color": c.color_rule,
|
|
237
|
+
"boxplot.whiskerprops.linewidth": 1,
|
|
238
|
+
"boxplot.medianprops.color": "white",
|
|
239
|
+
"boxplot.medianprops.linewidth": 1,
|
|
240
|
+
"boxplot.flierprops.marker": "o",
|
|
241
|
+
"boxplot.flierprops.markerfacecolor": "none",
|
|
242
|
+
"boxplot.flierprops.markeredgecolor": TABLEAU10[0],
|
|
243
|
+
"errorbar.capsize": 0,
|
|
244
|
+
}
|
|
245
|
+
|
|
246
|
+
|
|
247
|
+
def _color_cycle() -> Cycler:
|
|
248
|
+
return cycler(color=list(TABLEAU10))
|
|
249
|
+
|
|
250
|
+
|
|
251
|
+
def to_mplstyle(rc: Mapping[str, Any]) -> str:
|
|
252
|
+
"""Format rcParams as the contents of a ``.mplstyle`` file.
|
|
253
|
+
|
|
254
|
+
Parameters
|
|
255
|
+
----------
|
|
256
|
+
rc
|
|
257
|
+
rcParams as returned by `rc_params`.
|
|
258
|
+
|
|
259
|
+
Returns
|
|
260
|
+
-------
|
|
261
|
+
str
|
|
262
|
+
One ``key: value`` line per parameter.
|
|
263
|
+
"""
|
|
264
|
+
return "".join(f"{key}: {_format(value)}\n" for key, value in rc.items())
|
|
265
|
+
|
|
266
|
+
|
|
267
|
+
def _format(value: object) -> str:
|
|
268
|
+
match value:
|
|
269
|
+
case bool() | int() | float():
|
|
270
|
+
return str(value)
|
|
271
|
+
case str() if value.startswith("#"):
|
|
272
|
+
# "#" starts a comment in style files.
|
|
273
|
+
return value[1:]
|
|
274
|
+
case str():
|
|
275
|
+
return value
|
|
276
|
+
case Cycler():
|
|
277
|
+
colors = ", ".join(
|
|
278
|
+
repr(_format(color)) for color in value.by_key()["color"]
|
|
279
|
+
)
|
|
280
|
+
return f"cycler('color', [{colors}])"
|
|
281
|
+
case (int(), tuple()):
|
|
282
|
+
return str(value)
|
|
283
|
+
case tuple() | list():
|
|
284
|
+
return ", ".join(_format(item) for item in value)
|
|
285
|
+
case _:
|
|
286
|
+
raise TypeError(f"cannot write {value!r} to a style file")
|
|
@@ -0,0 +1,127 @@
|
|
|
1
|
+
"""Tick positions and "nice" axis limits computed like Vega (d3-scale).
|
|
2
|
+
|
|
3
|
+
Vega asks for about one tick per 40 pixels of axis length and rounds the
|
|
4
|
+
domain of a linear scale outwards to multiples of 1, 2 or 5 times a power of
|
|
5
|
+
ten. matplotlib's default `AutoLocator` allows at most 9 intervals and also
|
|
6
|
+
uses steps of 2.5, so charts get fewer and differently spaced grid lines.
|
|
7
|
+
"""
|
|
8
|
+
|
|
9
|
+
import math
|
|
10
|
+
from collections.abc import Sequence
|
|
11
|
+
from typing import Final
|
|
12
|
+
|
|
13
|
+
import matplotlib as mpl
|
|
14
|
+
from matplotlib.ticker import Locator
|
|
15
|
+
|
|
16
|
+
PIXELS_PER_TICK: Final = 40
|
|
17
|
+
"""Vega's default tick count is ``ceil(length / 40)`` for an axis."""
|
|
18
|
+
|
|
19
|
+
NICE_COUNT: Final = 10
|
|
20
|
+
"""Vega rounds the domain (``nice: true``) with d3's default count of 10."""
|
|
21
|
+
|
|
22
|
+
_E10: Final = math.sqrt(50)
|
|
23
|
+
_E5: Final = math.sqrt(10)
|
|
24
|
+
_E2: Final = math.sqrt(2)
|
|
25
|
+
|
|
26
|
+
|
|
27
|
+
def _round(x: float) -> int:
|
|
28
|
+
"""JavaScript's ``Math.round``: halves are rounded up, not to even."""
|
|
29
|
+
return math.floor(x + 0.5)
|
|
30
|
+
|
|
31
|
+
|
|
32
|
+
def _tick_spec(
|
|
33
|
+
start: float, stop: float, count: float
|
|
34
|
+
) -> tuple[int, int, float]:
|
|
35
|
+
"""Port of ``tickSpec`` from d3-array."""
|
|
36
|
+
step = (stop - start) / max(0, count)
|
|
37
|
+
power = math.floor(math.log10(step))
|
|
38
|
+
error = step / 10**power
|
|
39
|
+
factor = (
|
|
40
|
+
10 if error >= _E10 else 5 if error >= _E5 else 2 if error >= _E2 else 1
|
|
41
|
+
)
|
|
42
|
+
if power < 0:
|
|
43
|
+
inc = 10 ** (-power) / factor
|
|
44
|
+
i1, i2 = _round(start * inc), _round(stop * inc)
|
|
45
|
+
if i1 / inc < start:
|
|
46
|
+
i1 += 1
|
|
47
|
+
if i2 / inc > stop:
|
|
48
|
+
i2 -= 1
|
|
49
|
+
inc = -inc
|
|
50
|
+
else:
|
|
51
|
+
inc = 10**power * factor
|
|
52
|
+
i1, i2 = _round(start / inc), _round(stop / inc)
|
|
53
|
+
if i1 * inc < start:
|
|
54
|
+
i1 += 1
|
|
55
|
+
if i2 * inc > stop:
|
|
56
|
+
i2 -= 1
|
|
57
|
+
if i2 < i1 and 0.5 <= count < 2:
|
|
58
|
+
return _tick_spec(start, stop, count * 2)
|
|
59
|
+
return i1, i2, inc
|
|
60
|
+
|
|
61
|
+
|
|
62
|
+
def ticks(start: float, stop: float, count: float) -> list[float]:
|
|
63
|
+
"""Port of ``ticks`` from d3-array, for ``start < stop``."""
|
|
64
|
+
if not (count > 0 and start < stop):
|
|
65
|
+
return [start] if start == stop else []
|
|
66
|
+
i1, i2, inc = _tick_spec(start, stop, count)
|
|
67
|
+
if i2 < i1:
|
|
68
|
+
return []
|
|
69
|
+
if inc < 0:
|
|
70
|
+
return [(i1 + i) / -inc for i in range(i2 - i1 + 1)]
|
|
71
|
+
return [(i1 + i) * inc for i in range(i2 - i1 + 1)]
|
|
72
|
+
|
|
73
|
+
|
|
74
|
+
def nice(
|
|
75
|
+
start: float, stop: float, count: float = NICE_COUNT
|
|
76
|
+
) -> tuple[float, float]:
|
|
77
|
+
"""Port of ``linear.nice`` from d3-scale, for ``start < stop``."""
|
|
78
|
+
previous = None
|
|
79
|
+
for _ in range(10):
|
|
80
|
+
_, _, step = _tick_spec(start, stop, count)
|
|
81
|
+
if step == previous:
|
|
82
|
+
break
|
|
83
|
+
if step > 0:
|
|
84
|
+
start, stop = (
|
|
85
|
+
math.floor(start / step) * step,
|
|
86
|
+
math.ceil(stop / step) * step,
|
|
87
|
+
)
|
|
88
|
+
else:
|
|
89
|
+
start, stop = (
|
|
90
|
+
math.ceil(start * step) / step,
|
|
91
|
+
math.floor(stop * step) / step,
|
|
92
|
+
)
|
|
93
|
+
previous = step
|
|
94
|
+
return start, stop
|
|
95
|
+
|
|
96
|
+
|
|
97
|
+
class VegaLocator(Locator):
|
|
98
|
+
"""Locate ticks like Vega does on a linear axis.
|
|
99
|
+
|
|
100
|
+
Parameters
|
|
101
|
+
----------
|
|
102
|
+
count
|
|
103
|
+
Desired number of ticks; the layout sets it from the axis length.
|
|
104
|
+
"""
|
|
105
|
+
|
|
106
|
+
def __init__(self, count: float = NICE_COUNT) -> None:
|
|
107
|
+
self.count = count
|
|
108
|
+
|
|
109
|
+
def __call__(self) -> Sequence[float]:
|
|
110
|
+
"""Return the tick locations within the view limits."""
|
|
111
|
+
if self.axis is None:
|
|
112
|
+
return []
|
|
113
|
+
vmin, vmax = self.axis.get_view_interval()
|
|
114
|
+
return self.tick_values(vmin, vmax)
|
|
115
|
+
|
|
116
|
+
def tick_values(self, vmin: float, vmax: float) -> Sequence[float]:
|
|
117
|
+
"""Return the tick locations between ``vmin`` and ``vmax``."""
|
|
118
|
+
if vmax < vmin:
|
|
119
|
+
vmin, vmax = vmax, vmin
|
|
120
|
+
return self.raise_if_exceeds(ticks(vmin, vmax, self.count))
|
|
121
|
+
|
|
122
|
+
def view_limits(self, vmin: float, vmax: float) -> tuple[float, float]:
|
|
123
|
+
"""Round the data limits outwards like a Vega scale with ``nice``."""
|
|
124
|
+
vmin, vmax = self.nonsingular(vmin, vmax)
|
|
125
|
+
if mpl.rcParams["axes.autolimit_mode"] != "round_numbers":
|
|
126
|
+
return vmin, vmax
|
|
127
|
+
return nice(vmin, vmax)
|
|
@@ -0,0 +1,177 @@
|
|
|
1
|
+
Metadata-Version: 2.5
|
|
2
|
+
Name: camminady_matplotlib_theme
|
|
3
|
+
Version: 0.2.0
|
|
4
|
+
Summary: A minimal matplotlib style that matches camminady_altair_theme: muted gray text, dashed grid lines and horizontal axis titles.
|
|
5
|
+
Project-URL: Homepage, https://github.com/thomascamminady/camminady_matplotlib_theme
|
|
6
|
+
Project-URL: Documentation, https://camminady.dev/camminady_matplotlib_theme/
|
|
7
|
+
Project-URL: Repository, https://github.com/thomascamminady/camminady_matplotlib_theme
|
|
8
|
+
Project-URL: Issues, https://github.com/thomascamminady/camminady_matplotlib_theme/issues
|
|
9
|
+
Author-email: Thomas Camminady <0milieux_member@icloud.com>
|
|
10
|
+
License-Expression: MIT
|
|
11
|
+
License-File: LICENSE
|
|
12
|
+
Keywords: charts,matplotlib,style,theme,visualization
|
|
13
|
+
Classifier: Development Status :: 4 - Beta
|
|
14
|
+
Classifier: Framework :: Matplotlib
|
|
15
|
+
Classifier: Intended Audience :: Science/Research
|
|
16
|
+
Classifier: Programming Language :: Python :: 3
|
|
17
|
+
Classifier: Programming Language :: Python :: 3.11
|
|
18
|
+
Classifier: Programming Language :: Python :: 3.12
|
|
19
|
+
Classifier: Programming Language :: Python :: 3.13
|
|
20
|
+
Classifier: Programming Language :: Python :: 3.14
|
|
21
|
+
Classifier: Topic :: Scientific/Engineering :: Visualization
|
|
22
|
+
Classifier: Typing :: Typed
|
|
23
|
+
Requires-Python: >=3.11
|
|
24
|
+
Requires-Dist: matplotlib>=3.10
|
|
25
|
+
Description-Content-Type: text/markdown
|
|
26
|
+
|
|
27
|
+
# camminady_matplotlib_theme
|
|
28
|
+
|
|
29
|
+
A minimal [matplotlib](https://matplotlib.org) style that matches
|
|
30
|
+
[camminady_altair_theme](https://github.com/thomascamminady/camminady_altair_theme):
|
|
31
|
+
muted gray text, dashed grid lines, no frame around the plot, and horizontal
|
|
32
|
+
axis titles at the end of each axis. It comes in a light (`camminady`) and a
|
|
33
|
+
dark (`camminady_dark`) variant.
|
|
34
|
+
|
|
35
|
+
|
|
36
|
+
|
|
37
|
+
<!-- docs-start -->
|
|
38
|
+
|
|
39
|
+
## Installation
|
|
40
|
+
|
|
41
|
+
```bash
|
|
42
|
+
uv add camminady-matplotlib-theme
|
|
43
|
+
# or
|
|
44
|
+
pip install camminady-matplotlib-theme
|
|
45
|
+
```
|
|
46
|
+
|
|
47
|
+
Requires Python 3.11+ and matplotlib 3.10+.
|
|
48
|
+
|
|
49
|
+
## Usage
|
|
50
|
+
|
|
51
|
+
```python
|
|
52
|
+
import matplotlib.pyplot as plt
|
|
53
|
+
|
|
54
|
+
plt.style.use("camminady_matplotlib_theme.camminady") # or ".camminady_dark"
|
|
55
|
+
```
|
|
56
|
+
|
|
57
|
+
There is no need to import the package. After
|
|
58
|
+
`import camminady_matplotlib_theme`, the short names `"camminady"` and
|
|
59
|
+
`"camminady_dark"` work as well; importing does not apply a style.
|
|
60
|
+
|
|
61
|
+
To use the style for some figures only:
|
|
62
|
+
|
|
63
|
+
```python
|
|
64
|
+
with plt.style.context("camminady_matplotlib_theme.camminady"):
|
|
65
|
+
fig, ax = plt.subplots()
|
|
66
|
+
...
|
|
67
|
+
fig.savefig("chart.png")
|
|
68
|
+
```
|
|
69
|
+
|
|
70
|
+
## Example
|
|
71
|
+
|
|
72
|
+
A complete script that draws a line chart of stock prices. The data comes
|
|
73
|
+
from [vega_datasets](https://github.com/altair-viz/vega_datasets)
|
|
74
|
+
(`uv add vega_datasets`), which ships it, so the script runs offline.
|
|
75
|
+
|
|
76
|
+
```python
|
|
77
|
+
import matplotlib.pyplot as plt
|
|
78
|
+
from vega_datasets import data
|
|
79
|
+
|
|
80
|
+
plt.style.use("camminady_matplotlib_theme.camminady")
|
|
81
|
+
|
|
82
|
+
stocks = data.stocks()
|
|
83
|
+
fig, ax = plt.subplots()
|
|
84
|
+
for symbol, group in stocks.groupby("symbol"):
|
|
85
|
+
ax.plot(group["date"], group["price"], label=symbol)
|
|
86
|
+
ax.set(title="Stock prices", xlabel="date", ylabel="Price (USD)")
|
|
87
|
+
ax.legend(title="symbol")
|
|
88
|
+
fig.savefig("stock_prices.png")
|
|
89
|
+
```
|
|
90
|
+
|
|
91
|
+

|
|
92
|
+
|
|
93
|
+
With `"camminady_matplotlib_theme.camminady_dark"`:
|
|
94
|
+
|
|
95
|
+
|
|
96
|
+
|
|
97
|
+
The same chart made with Altair and the Altair theme (top) and with this
|
|
98
|
+
style (bottom):
|
|
99
|
+
|
|
100
|
+
|
|
101
|
+
|
|
102
|
+
## Matching the Altair theme
|
|
103
|
+
|
|
104
|
+
The style uses the design tokens of the Altair theme (colours, font sizes and
|
|
105
|
+
the 800 × 400 plot area) and Vega's default colour palette. It sets
|
|
106
|
+
`figure.dpi` to 72 so that one point is one pixel on screen, as in Vega;
|
|
107
|
+
`savefig` writes at 288 dpi (four pixels per point), so saved PNGs stay sharp
|
|
108
|
+
when scaled up. Pass `dpi=` to `savefig` to override it.
|
|
109
|
+
|
|
110
|
+
Some of the look cannot be expressed in a style file. The style therefore
|
|
111
|
+
registers a figure hook that gives each figure created through pyplot a
|
|
112
|
+
constrained layout which, before drawing:
|
|
113
|
+
|
|
114
|
+
- turns the y-axis title horizontal and places it above the axis, aligned
|
|
115
|
+
with the axis line (titles of `ax.twinx()` go to the right end),
|
|
116
|
+
- moves the axes title above that y-axis title,
|
|
117
|
+
- places a legend outside the plot on the right, unless you pass a location
|
|
118
|
+
(`ax.legend(loc="lower right")` stays where you put it),
|
|
119
|
+
- places ticks and rounds axis limits like Vega: about one tick per 40
|
|
120
|
+
points, at multiples of 1, 2 or 5 times a power of ten,
|
|
121
|
+
- removes grid lines across categorical axes and images.
|
|
122
|
+
|
|
123
|
+
The hook leaves figures alone that use another layout
|
|
124
|
+
(`plt.subplots(layout="tight")`). For a figure created without pyplot, call
|
|
125
|
+
`camminady_matplotlib_theme.install(fig)`.
|
|
126
|
+
|
|
127
|
+
Two differences remain: Vega-Lite includes zero in quantitative axes and
|
|
128
|
+
draws points as hollow circles; matplotlib does neither by default.
|
|
129
|
+
|
|
130
|
+
## Customising
|
|
131
|
+
|
|
132
|
+
All colours, font sizes and the plot size are fields of `Config`, with the
|
|
133
|
+
same names and defaults as in the Altair theme:
|
|
134
|
+
|
|
135
|
+
```python
|
|
136
|
+
import matplotlib.pyplot as plt
|
|
137
|
+
from camminady_matplotlib_theme import Config, rc_params
|
|
138
|
+
|
|
139
|
+
plt.style.use(rc_params(Config(width=400, height=250)))
|
|
140
|
+
```
|
|
141
|
+
|
|
142
|
+
`to_mplstyle(rc_params(...))` returns the contents of a `.mplstyle` file.
|
|
143
|
+
|
|
144
|
+
## Colour-blind safety
|
|
145
|
+
|
|
146
|
+
The default palette is Vega's `tableau10`. Its third (red) and fifth (green)
|
|
147
|
+
colours are nearly indistinguishable for people with deuteranopia, so for five
|
|
148
|
+
or more categories use the bundled Okabe-Ito palette:
|
|
149
|
+
|
|
150
|
+
```python
|
|
151
|
+
from camminady_matplotlib_theme import OKABE_ITO
|
|
152
|
+
|
|
153
|
+
ax.set_prop_cycle(color=OKABE_ITO)
|
|
154
|
+
```
|
|
155
|
+
|
|
156
|
+
## Development
|
|
157
|
+
|
|
158
|
+
```bash
|
|
159
|
+
uv sync
|
|
160
|
+
uv run pytest
|
|
161
|
+
uv run ruff check . && uv run ruff format --check .
|
|
162
|
+
uv run ty check
|
|
163
|
+
uv run python create_charts.py # regenerate the images above
|
|
164
|
+
```
|
|
165
|
+
|
|
166
|
+
The `.mplstyle` files are generated from `Config`; after changing a token,
|
|
167
|
+
rewrite them with:
|
|
168
|
+
|
|
169
|
+
```bash
|
|
170
|
+
uv run python -c "
|
|
171
|
+
from importlib.resources import files
|
|
172
|
+
from camminady_matplotlib_theme import theme
|
|
173
|
+
for name, c in {'camminady': theme.config, 'camminady_dark': theme.config_dark}.items():
|
|
174
|
+
(files('camminady_matplotlib_theme') / f'{name}.mplstyle').write_text(
|
|
175
|
+
theme.to_mplstyle(theme.rc_params(c)))
|
|
176
|
+
"
|
|
177
|
+
```
|
|
@@ -0,0 +1,11 @@
|
|
|
1
|
+
camminady_matplotlib_theme/__init__.py,sha256=6y6Uqwth4PLpHgTw2ubYFFDNe_BxSRfRtl_c1EYht5c,1178
|
|
2
|
+
camminady_matplotlib_theme/camminady.mplstyle,sha256=fjr74UorYSUb40c0zG22H5uB7-vbPy4Fs72dsw7L3T0,2196
|
|
3
|
+
camminady_matplotlib_theme/camminady_dark.mplstyle,sha256=R5PuzxnF2-_0W5kn9XLBXJ975GCRIxnQgaj-ZFdn1rs,2194
|
|
4
|
+
camminady_matplotlib_theme/layout.py,sha256=dXXJ8xu7m0RKZnNNHzZoEgjRnhPM80_J2oYQ6rGxfnk,8973
|
|
5
|
+
camminady_matplotlib_theme/py.typed,sha256=47DEQpj8HBSa-_TImW-5JCeuQeRkm5NMpJWZG3hSuFU,0
|
|
6
|
+
camminady_matplotlib_theme/theme.py,sha256=vicp79WPYi0l3UQtRBBy5Uy8Kf6_rtGkX2fzt2WI4sk,8964
|
|
7
|
+
camminady_matplotlib_theme/ticks.py,sha256=31zul5zOSXa0wJrq1okkJpMMQtmmCe6BfFCgPMlhHr8,4082
|
|
8
|
+
camminady_matplotlib_theme-0.2.0.dist-info/METADATA,sha256=IFuX89sK75j4mNaGOoYOTAv9jKqHVTYEazrjc30hC8U,6310
|
|
9
|
+
camminady_matplotlib_theme-0.2.0.dist-info/WHEEL,sha256=W3fkpkm7-wf9vBI5Z-7s0eWkeM-spu78I8Neb98DeEg,87
|
|
10
|
+
camminady_matplotlib_theme-0.2.0.dist-info/licenses/LICENSE,sha256=CpyBxdriK2olyq3pzrDG86x-8BgMm6kHEnLsjhrnq9I,1074
|
|
11
|
+
camminady_matplotlib_theme-0.2.0.dist-info/RECORD,,
|
|
@@ -0,0 +1,21 @@
|
|
|
1
|
+
MIT License
|
|
2
|
+
|
|
3
|
+
Copyright (c) 2026, Thomas Camminady
|
|
4
|
+
|
|
5
|
+
Permission is hereby granted, free of charge, to any person obtaining a copy
|
|
6
|
+
of this software and associated documentation files (the "Software"), to deal
|
|
7
|
+
in the Software without restriction, including without limitation the rights
|
|
8
|
+
to use, copy, modify, merge, publish, distribute, sublicense, and/or sell
|
|
9
|
+
copies of the Software, and to permit persons to whom the Software is
|
|
10
|
+
furnished to do so, subject to the following conditions:
|
|
11
|
+
|
|
12
|
+
The above copyright notice and this permission notice shall be included in all
|
|
13
|
+
copies or substantial portions of the Software.
|
|
14
|
+
|
|
15
|
+
THE SOFTWARE IS PROVIDED "AS IS", WITHOUT WARRANTY OF ANY KIND, EXPRESS OR
|
|
16
|
+
IMPLIED, INCLUDING BUT NOT LIMITED TO THE WARRANTIES OF MERCHANTABILITY,
|
|
17
|
+
FITNESS FOR A PARTICULAR PURPOSE AND NONINFRINGEMENT. IN NO EVENT SHALL THE
|
|
18
|
+
AUTHORS OR COPYRIGHT HOLDERS BE LIABLE FOR ANY CLAIM, DAMAGES OR OTHER
|
|
19
|
+
LIABILITY, WHETHER IN AN ACTION OF CONTRACT, TORT OR OTHERWISE, ARISING FROM,
|
|
20
|
+
OUT OF OR IN CONNECTION WITH THE SOFTWARE OR THE USE OR OTHER DEALINGS IN THE
|
|
21
|
+
SOFTWARE.
|