biopipen 0.34.1__py3-none-any.whl → 0.34.3__py3-none-any.whl
This diff represents the content of publicly available package versions that have been released to one of the supported registries. The information contained in this diff is provided for informational purposes only and reflects changes between package versions as they appear in their respective public registries.
Potentially problematic release.
This version of biopipen might be problematic. Click here for more details.
- biopipen/__init__.py +1 -1
- biopipen/ns/scrna.py +259 -34
- biopipen/ns/scrna_metabolic_landscape.py +1 -1
- biopipen/ns/tcr.py +9 -4
- biopipen/reports/scrna_metabolic_landscape/MetabolicFeatures.svelte +12 -3
- biopipen/reports/scrna_metabolic_landscape/MetabolicPathwayActivity.svelte +12 -3
- biopipen/reports/scrna_metabolic_landscape/MetabolicPathwayHeterogeneity.svelte +12 -3
- biopipen/scripts/scrna/CellTypeAnnotation-celltypist.R +3 -10
- biopipen/scripts/scrna/MarkersFinder.R +34 -28
- biopipen/scripts/scrna/PseudoBulkDEG.R +592 -0
- biopipen/scripts/scrna/ScFGSEA.R +35 -35
- biopipen/scripts/scrna/SeuratClusterStats-clustree.R +16 -0
- biopipen/scripts/scrna/SeuratClusterStats-dimplots.R +1 -1
- biopipen/scripts/scrna/SeuratClusterStats-features.R +29 -6
- biopipen/scripts/scrna/SeuratClusterStats-stats.R +29 -1
- biopipen/scripts/scrna/SeuratClusterStats.R +1 -0
- biopipen/scripts/scrna/TopExpressingGenes.R +6 -6
- biopipen/scripts/scrna/celltypist-wrapper.py +2 -0
- biopipen/scripts/scrna_metabolic_landscape/MetabolicFeatures.R +9 -3
- biopipen/scripts/scrna_metabolic_landscape/MetabolicPathwayActivity.R +2 -2
- biopipen/scripts/scrna_metabolic_landscape/MetabolicPathwayHeterogeneity.R +1 -0
- biopipen/scripts/tcr/GIANA/GIANA4.py +2 -4
- biopipen/scripts/tcr/ScRepCombiningExpression.R +3 -2
- biopipen/scripts/tcr/ScRepLoading.R +7 -2
- biopipen/scripts/tcr/TCRClustering.R +9 -23
- biopipen/scripts/tcr/TESSA.R +4 -2
- {biopipen-0.34.1.dist-info → biopipen-0.34.3.dist-info}/METADATA +1 -1
- {biopipen-0.34.1.dist-info → biopipen-0.34.3.dist-info}/RECORD +30 -31
- biopipen/reports/scrna/TopExpressingGenes.svelte +0 -17
- biopipen/scripts/scrna/SCP-plot.R +0 -15202
- {biopipen-0.34.1.dist-info → biopipen-0.34.3.dist-info}/WHEEL +0 -0
- {biopipen-0.34.1.dist-info → biopipen-0.34.3.dist-info}/entry_points.txt +0 -0
biopipen/__init__.py
CHANGED
|
@@ -1 +1 @@
|
|
|
1
|
-
__version__ = "0.34.
|
|
1
|
+
__version__ = "0.34.3"
|
biopipen/ns/scrna.py
CHANGED
|
@@ -197,8 +197,8 @@ class SeuratPreparing(Proc):
|
|
|
197
197
|
|
|
198
198
|
SCTransform (ns): Arguments for [`SCTransform()`](https://satijalab.org/seurat/reference/sctransform).
|
|
199
199
|
`object` is specified internally, and `-` in the key will be replaced with `.`.
|
|
200
|
-
-
|
|
201
|
-
-
|
|
200
|
+
- return-only-var-genes: Whether to return only variable genes.
|
|
201
|
+
- min_cells: The minimum number of cells that a gene must be expressed in to be kept.
|
|
202
202
|
A hidden argument of `SCTransform` to filter genes.
|
|
203
203
|
If you try to keep all genes in the `RNA` assay, you can set `min_cells` to `0` and
|
|
204
204
|
`return-only-var-genes` to `False`.
|
|
@@ -491,7 +491,7 @@ class SeuratClusterStats(Proc):
|
|
|
491
491
|
|
|
492
492
|
```toml
|
|
493
493
|
[SeuratClusterStats.envs.stats]
|
|
494
|
-
nCells_Sample = {
|
|
494
|
+
nCells_Sample = { group_by = "Sample" }
|
|
495
495
|
```
|
|
496
496
|
|
|
497
497
|
{: width="80%" }
|
|
@@ -515,8 +515,6 @@ class SeuratClusterStats(Proc):
|
|
|
515
515
|
```toml
|
|
516
516
|
[SeuratClusterStats.envs.dimplots.Idents]
|
|
517
517
|
label = true
|
|
518
|
-
label-box = true
|
|
519
|
-
repel = true
|
|
520
518
|
```
|
|
521
519
|
|
|
522
520
|
{: width="80%" }
|
|
@@ -533,6 +531,8 @@ class SeuratClusterStats(Proc):
|
|
|
533
531
|
Envs:
|
|
534
532
|
mutaters (type=json): The mutaters to mutate the metadata to subset the cells.
|
|
535
533
|
The mutaters will be applied in the order specified.
|
|
534
|
+
You can also use the clone selectors to select the TCR clones/clusters.
|
|
535
|
+
See <https://pwwang.github.io/scplotter/reference/clone_selectors.html>.
|
|
536
536
|
cache (type=auto): Whether to cache the plots.
|
|
537
537
|
Currently only plots for features are supported, since creating the those
|
|
538
538
|
plots can be time consuming.
|
|
@@ -566,6 +566,7 @@ class SeuratClusterStats(Proc):
|
|
|
566
566
|
- res (type=int): The resolution of the plots.
|
|
567
567
|
- height (type=int): The height of the plots.
|
|
568
568
|
- width (type=int): The width of the plots.
|
|
569
|
+
- descr: The description of the plot, showing in the report.
|
|
569
570
|
- more_formats (type=list): The formats to save the plots other than `png`.
|
|
570
571
|
- save_code (flag): Whether to save the code to reproduce the plot.
|
|
571
572
|
- save_data (flag): Whether to save the data used to generate the plot.
|
|
@@ -657,6 +658,7 @@ class SeuratClusterStats(Proc):
|
|
|
657
658
|
"clustrees": {},
|
|
658
659
|
"stats_defaults": {
|
|
659
660
|
"subset": None,
|
|
661
|
+
"descr": None,
|
|
660
662
|
"devpars": {"res": 100},
|
|
661
663
|
"more_formats": [],
|
|
662
664
|
"save_code": False,
|
|
@@ -665,10 +667,12 @@ class SeuratClusterStats(Proc):
|
|
|
665
667
|
"stats": {
|
|
666
668
|
"Number of cells in each cluster (Bar Chart)": {
|
|
667
669
|
"plot_type": "bar",
|
|
670
|
+
"x_text_angle": 90,
|
|
668
671
|
},
|
|
669
672
|
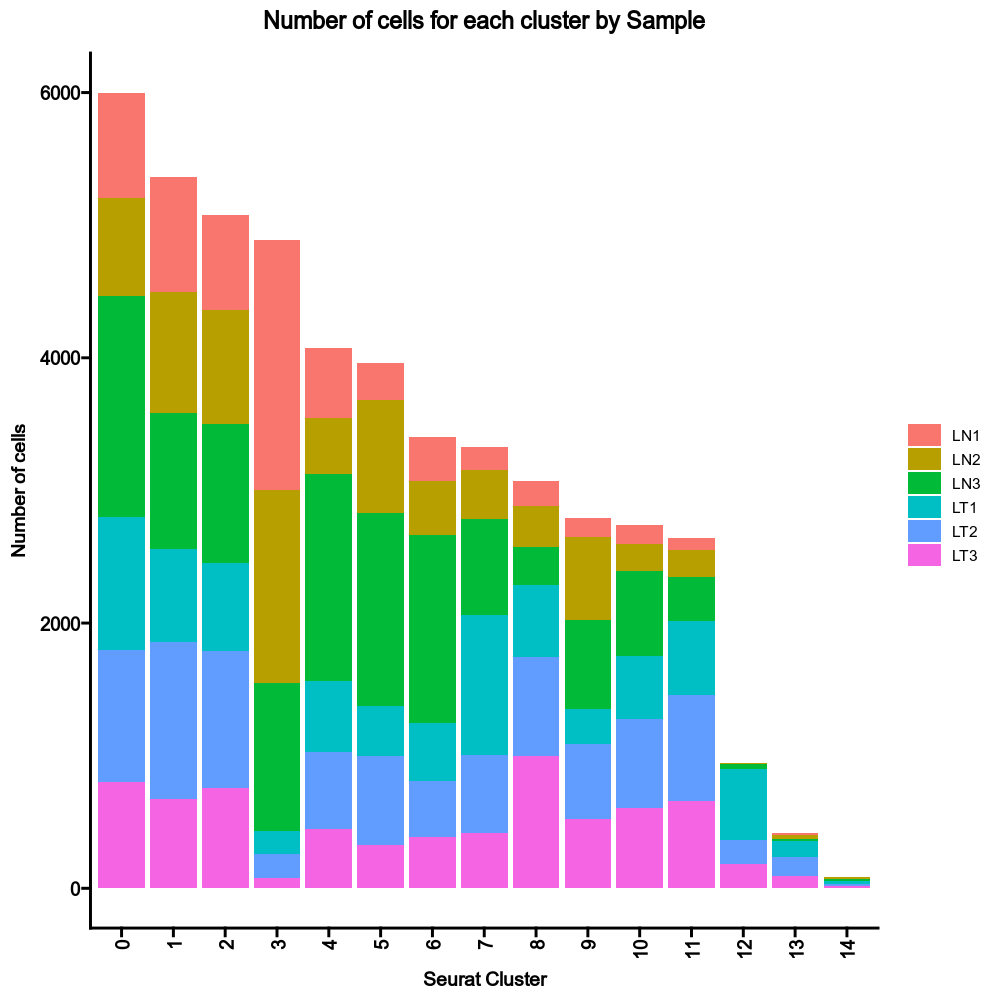
"Number of cells in each cluster by Sample (Bar Chart)": {
|
|
670
673
|
"plot_type": "bar",
|
|
671
674
|
"group_by": "Sample",
|
|
675
|
+
"x_text_angle": 90,
|
|
672
676
|
},
|
|
673
677
|
},
|
|
674
678
|
"ngenes_defaults": {
|
|
@@ -700,7 +704,6 @@ class SeuratClusterStats(Proc):
|
|
|
700
704
|
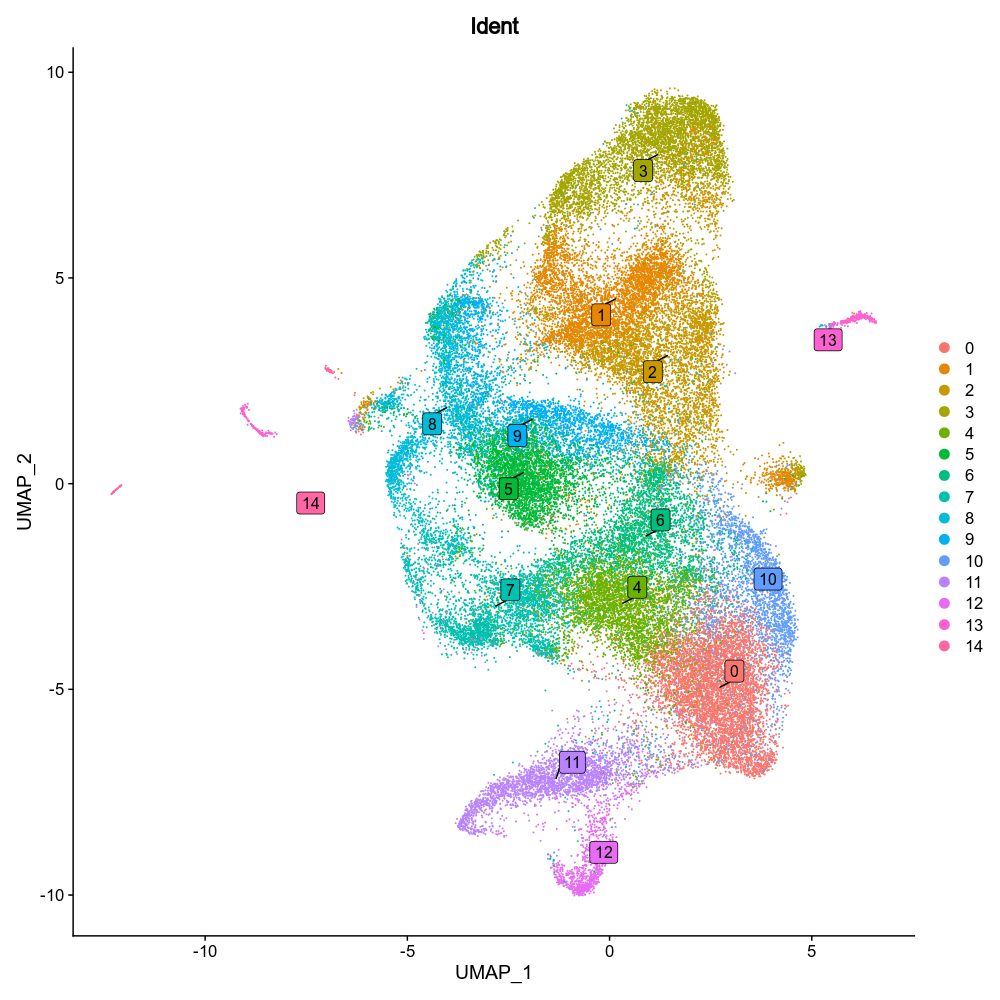
"dimplots": {
|
|
701
705
|
"Dimensional reduction plot": {
|
|
702
706
|
"label": True,
|
|
703
|
-
"label_insitu": True,
|
|
704
707
|
},
|
|
705
708
|
},
|
|
706
709
|
}
|
|
@@ -1007,11 +1010,11 @@ class DimPlots(Proc):
|
|
|
1007
1010
|
class MarkersFinder(Proc):
|
|
1008
1011
|
"""Find markers between different groups of cells
|
|
1009
1012
|
|
|
1010
|
-
When only `
|
|
1013
|
+
When only `group_by` is specified as `"seurat_clusters"` in
|
|
1011
1014
|
`envs.cases`, the markers will be found for all the clusters.
|
|
1012
1015
|
|
|
1013
1016
|
You can also find the differentially expressed genes between
|
|
1014
|
-
any two groups of cells by setting `
|
|
1017
|
+
any two groups of cells by setting `group_by` to a different
|
|
1015
1018
|
column name in metadata. Follow `envs.cases` for more details.
|
|
1016
1019
|
|
|
1017
1020
|
Input:
|
|
@@ -1027,17 +1030,19 @@ class MarkersFinder(Proc):
|
|
|
1027
1030
|
ncores (type=int): Number of cores to use for parallel computing for some `Seurat` procedures.
|
|
1028
1031
|
* Used in `future::plan(strategy = "multicore", workers = <ncores>)` to parallelize some Seurat procedures.
|
|
1029
1032
|
* See also: <https://satijalab.org/seurat/articles/future_vignette.html>
|
|
1030
|
-
mutaters (type=json): The mutaters to mutate the metadata
|
|
1031
|
-
|
|
1032
|
-
|
|
1033
|
+
mutaters (type=json): The mutaters to mutate the metadata.
|
|
1034
|
+
You can also use the clone selectors to select the TCR clones/clusters.
|
|
1035
|
+
See <https://pwwang.github.io/scplotter/reference/clone_selectors.html>.
|
|
1036
|
+
group_by: The column name in metadata to group the cells.
|
|
1037
|
+
If only `group_by` is specified, and `ident-1` and `ident-2` are
|
|
1033
1038
|
not specified, markers will be found for all groups in this column
|
|
1034
1039
|
in the manner of "group vs rest" comparison.
|
|
1035
1040
|
`NA` group will be ignored.
|
|
1036
1041
|
If `None`, `Seurat::Idents(srtobj)` will be used, which is usually
|
|
1037
1042
|
`"seurat_clusters"` after unsupervised clustering.
|
|
1038
|
-
|
|
1039
|
-
When this is empty, the comparisons will be expanded to each group v.s. the rest of the cells in `
|
|
1040
|
-
|
|
1043
|
+
ident_1: The first group of cells to compare
|
|
1044
|
+
When this is empty, the comparisons will be expanded to each group v.s. the rest of the cells in `group_by`.
|
|
1045
|
+
ident_2: The second group of cells to compare
|
|
1041
1046
|
If not provided, the rest of the cells are used for `ident-2`.
|
|
1042
1047
|
each: The column name in metadata to separate the cells into different
|
|
1043
1048
|
cases.
|
|
@@ -1164,9 +1169,9 @@ class MarkersFinder(Proc):
|
|
|
1164
1169
|
envs = {
|
|
1165
1170
|
"ncores": config.misc.ncores,
|
|
1166
1171
|
"mutaters": {},
|
|
1167
|
-
"
|
|
1168
|
-
"
|
|
1169
|
-
"
|
|
1172
|
+
"group_by": None,
|
|
1173
|
+
"ident_1": None,
|
|
1174
|
+
"ident_2": None,
|
|
1170
1175
|
"each": None,
|
|
1171
1176
|
"dbs": ["KEGG_2021_Human", "MSigDB_Hallmark_2020"],
|
|
1172
1177
|
"sigmarkers": "p_val_adj < 0.05",
|
|
@@ -1239,13 +1244,15 @@ class TopExpressingGenes(Proc):
|
|
|
1239
1244
|
outdir: The output directory for the tables and plots
|
|
1240
1245
|
|
|
1241
1246
|
Envs:
|
|
1242
|
-
mutaters (type=json): The mutaters to mutate the metadata
|
|
1247
|
+
mutaters (type=json): The mutaters to mutate the metadata.
|
|
1248
|
+
You can also use the clone selectors to select the TCR clones/clusters.
|
|
1249
|
+
See <https://pwwang.github.io/scplotter/reference/clone_selectors.html>.
|
|
1243
1250
|
ident: The group of cells to find the top expressing genes.
|
|
1244
|
-
The cells will be selected by the `
|
|
1251
|
+
The cells will be selected by the `group_by` column with this
|
|
1245
1252
|
`ident` value in metadata.
|
|
1246
1253
|
If not provided, the top expressing genes will be found for all
|
|
1247
|
-
groups of cells in the `
|
|
1248
|
-
|
|
1254
|
+
groups of cells in the `group_by` column.
|
|
1255
|
+
group_by: The column name in metadata to group the cells.
|
|
1249
1256
|
each: The column name in metadata to separate the cells into different
|
|
1250
1257
|
cases.
|
|
1251
1258
|
dbs (list): The dbs to do enrichment analysis for significant
|
|
@@ -1288,7 +1295,7 @@ class TopExpressingGenes(Proc):
|
|
|
1288
1295
|
envs = {
|
|
1289
1296
|
"mutaters": {},
|
|
1290
1297
|
"ident": None,
|
|
1291
|
-
"
|
|
1298
|
+
"group_by": None,
|
|
1292
1299
|
"each": None,
|
|
1293
1300
|
"dbs": ["KEGG_2021_Human", "MSigDB_Hallmark_2020"],
|
|
1294
1301
|
"n": 250,
|
|
@@ -1305,7 +1312,7 @@ class TopExpressingGenes(Proc):
|
|
|
1305
1312
|
"cases": {},
|
|
1306
1313
|
}
|
|
1307
1314
|
plugin_opts = {
|
|
1308
|
-
"report": "file://../reports/
|
|
1315
|
+
"report": "file://../reports/common.svelte",
|
|
1309
1316
|
"report_paging": 8,
|
|
1310
1317
|
}
|
|
1311
1318
|
|
|
@@ -1608,10 +1615,12 @@ class ScFGSEA(Proc):
|
|
|
1608
1615
|
Passed to `nproc` of `fgseaMultilevel()`.
|
|
1609
1616
|
mutaters (type=json): The mutaters to mutate the metadata.
|
|
1610
1617
|
The key-value pairs will be passed the `dplyr::mutate()` to mutate the metadata.
|
|
1618
|
+
You can also use the clone selectors to select the TCR clones/clusters.
|
|
1619
|
+
See <https://pwwang.github.io/scplotter/reference/clone_selectors.html>.
|
|
1611
1620
|
|
|
1612
|
-
|
|
1613
|
-
|
|
1614
|
-
|
|
1621
|
+
group_by: The column name in metadata to group the cells.
|
|
1622
|
+
ident_1: The first group of cells to compare
|
|
1623
|
+
ident_2: The second group of cells to compare, if not provided, the rest of the cells that are not `NA`s in `group_by` column are used for `ident-2`.
|
|
1615
1624
|
each: The column name in metadata to separate the cells into different subsets to do the analysis.
|
|
1616
1625
|
subset: An expression to subset the cells.
|
|
1617
1626
|
gmtfile: The pathways in GMT format, with the gene names/ids in the same format as the seurat object.
|
|
@@ -1637,15 +1646,15 @@ class ScFGSEA(Proc):
|
|
|
1637
1646
|
If it is < 1, will apply it to `padj`, selecting pathways with `padj` < `top`.
|
|
1638
1647
|
eps (type=float): This parameter sets the boundary for calculating the p value.
|
|
1639
1648
|
See <https://rdrr.io/bioc/fgsea/man/fgseaMultilevel.html>
|
|
1640
|
-
|
|
1649
|
+
alleach_plots_defaults (ns): Default options for the plots to generate for all pathways.
|
|
1641
1650
|
- plot_type: The type of the plot, currently either dot or heatmap (default)
|
|
1642
1651
|
- devpars (ns): The device parameters for the plots.
|
|
1643
1652
|
- res (type=int): The resolution of the plots.
|
|
1644
1653
|
- height (type=int): The height of the plots.
|
|
1645
1654
|
- width (type=int): The width of the plots.
|
|
1646
1655
|
- <more>: See <https://pwwang.github.io/biopipen.utils.R/reference/VizGSEA.html>.
|
|
1647
|
-
|
|
1648
|
-
The keys are the names of the cases and the values are the dicts inherited from `
|
|
1656
|
+
alleach_plots (type=json): Cases of the plots to generate for all pathways.
|
|
1657
|
+
The keys are the names of the cases and the values are the dicts inherited from `alleach_plots_defaults`.
|
|
1649
1658
|
minsize (type=int): Minimal size of a gene set to test. All pathways below the threshold are excluded.
|
|
1650
1659
|
maxsize (type=int): Maximal size of a gene set to test. All pathways above the threshold are excluded.
|
|
1651
1660
|
rest (type=json;order=98): Rest arguments for [`fgsea()`](https://rdrr.io/bioc/fgsea/man/fgsea.html)
|
|
@@ -1668,9 +1677,9 @@ class ScFGSEA(Proc):
|
|
|
1668
1677
|
envs = {
|
|
1669
1678
|
"mutaters": {},
|
|
1670
1679
|
"ncores": config.misc.ncores,
|
|
1671
|
-
"
|
|
1672
|
-
"
|
|
1673
|
-
"
|
|
1680
|
+
"group_by": None,
|
|
1681
|
+
"ident_1": None,
|
|
1682
|
+
"ident_2": None,
|
|
1674
1683
|
"each": None,
|
|
1675
1684
|
"subset": None,
|
|
1676
1685
|
"gmtfile": "KEGG_2021_Human",
|
|
@@ -1679,11 +1688,11 @@ class ScFGSEA(Proc):
|
|
|
1679
1688
|
"minsize": 10,
|
|
1680
1689
|
"maxsize": 100,
|
|
1681
1690
|
"eps": 0,
|
|
1682
|
-
"
|
|
1691
|
+
"alleach_plots_defaults": {
|
|
1683
1692
|
"plot_type": "heatmap",
|
|
1684
1693
|
"devpars": {"res": 100},
|
|
1685
1694
|
},
|
|
1686
|
-
"
|
|
1695
|
+
"alleach_plots": {},
|
|
1687
1696
|
"rest": {},
|
|
1688
1697
|
"cases": {},
|
|
1689
1698
|
}
|
|
@@ -2681,3 +2690,219 @@ class LoomTo10X(Proc):
|
|
|
2681
2690
|
output = "outdir:dir:{{in.loomfile | stem}}.10X"
|
|
2682
2691
|
lang = config.lang.rscript
|
|
2683
2692
|
script = "file://../scripts/scrna/LoomTo10X.R"
|
|
2693
|
+
|
|
2694
|
+
|
|
2695
|
+
class PseudoBulkDEG(Proc):
|
|
2696
|
+
"""Pseduo-bulk differential gene expression analysis
|
|
2697
|
+
|
|
2698
|
+
This process performs differential gene expression analysis, instead of
|
|
2699
|
+
on single-cell level, on the pseudo-bulk data, aggregated from the single-cell data.
|
|
2700
|
+
|
|
2701
|
+
Input:
|
|
2702
|
+
sobjfile: The seurat object file in RDS or qs/qs2 format.
|
|
2703
|
+
|
|
2704
|
+
Output:
|
|
2705
|
+
outdir: The output containing the results of the differential gene expression
|
|
2706
|
+
analysis.
|
|
2707
|
+
|
|
2708
|
+
Envs:
|
|
2709
|
+
mutaters (type=json): Mutaters to mutate the metadata of the
|
|
2710
|
+
seurat object. Keys are the new column names and values are the
|
|
2711
|
+
expressions to mutate the columns. These new columns can be
|
|
2712
|
+
used to define your cases.
|
|
2713
|
+
You can also use the clone selectors to select the TCR clones/clusters.
|
|
2714
|
+
See <https://pwwang.github.io/scplotter/reference/clone_selectors.html>.
|
|
2715
|
+
each: The column name in metadata to separate the cells into different cases.
|
|
2716
|
+
When specified, the case will be expanded to multiple cases for
|
|
2717
|
+
each value in the column.
|
|
2718
|
+
subset: An expression in string to subset the cells.
|
|
2719
|
+
aggregate_by: The column names in metadata to aggregate the cells.
|
|
2720
|
+
layer: The layer to pull and aggregate the data.
|
|
2721
|
+
assay: The assay to pull and aggregate the data.
|
|
2722
|
+
error (flag): Error out if no/not enough markers are found or no pathways are enriched.
|
|
2723
|
+
If `False`, empty results will be returned.
|
|
2724
|
+
group_by: The column name in metadata to group the cells.
|
|
2725
|
+
ident_1: The first identity to compare.
|
|
2726
|
+
ident_2: The second identity to compare.
|
|
2727
|
+
If not specified, the rest of the identities will be compared with `ident_1`.
|
|
2728
|
+
paired_by: The column name in metadata to mark the paired samples.
|
|
2729
|
+
For example, subject. If specified, the paired test will be performed.
|
|
2730
|
+
dbs (list): The databases to use for enrichment analysis.
|
|
2731
|
+
The databases are passed to `biopipen.utils::Enrichr()` to do the
|
|
2732
|
+
enrichment analysis. The default databases are `KEGG_2021_Human` and
|
|
2733
|
+
`MSigDB_Hallmark_2020`.
|
|
2734
|
+
See <https://maayanlab.cloud/Enrichr/#libraries> for the available
|
|
2735
|
+
libraries.
|
|
2736
|
+
sigmarkers: An expression passed to `dplyr::filter()` to filter the
|
|
2737
|
+
significant markers for enrichment analysis.
|
|
2738
|
+
The default is `p_val_adj < 0.05`.
|
|
2739
|
+
If `tool = 'DESeq2'`, the variables that can be used for filtering
|
|
2740
|
+
are: `baseMean`, `log2FC`, `lfcSE`, `stat`, `p_val`, `p_val_adj`.
|
|
2741
|
+
If `tool = 'edgeR'`, the variables that can be used for filtering
|
|
2742
|
+
are: `logCPM`, `log2FC`, `LR`, `p_val`, `p_val_adj`.
|
|
2743
|
+
enrich_style (choice): The style of the enrichment analysis.
|
|
2744
|
+
- enrichr: Use `enrichr`-style for the enrichment analysis.
|
|
2745
|
+
- clusterProfiler: Use `clusterProfiler`-style for the enrichment analysis.
|
|
2746
|
+
allmarker_plots_defaults (ns): Default options for the plots for all markers when `ident-1` is not specified.
|
|
2747
|
+
- plot_type: The type of the plot.
|
|
2748
|
+
See <https://pwwang.github.io/scplotter/reference/FeatureStatPlot.html>.
|
|
2749
|
+
Available types are `violin`, `box`, `bar`, `ridge`, `dim`, `heatmap` and `dot`.
|
|
2750
|
+
- more_formats (type=list): The extra formats to save the plot in.
|
|
2751
|
+
- save_code (flag): Whether to save the code to generate the plot.
|
|
2752
|
+
- devpars (ns): The device parameters for the plots.
|
|
2753
|
+
- res (type=int): The resolution of the plots.
|
|
2754
|
+
- height (type=int): The height of the plots.
|
|
2755
|
+
- width (type=int): The width of the plots.
|
|
2756
|
+
- order_by: an expression to order the markers, passed by `dplyr::arrange()`.
|
|
2757
|
+
- genes: The number of top genes to show or an expression passed to `dplyr::filter()` to filter the genes.
|
|
2758
|
+
- <more>: Other arguments passed to [`scplotter::FeatureStatPlot()`](https://pwwang.github.io/scplotter/reference/FeatureStatPlot.html).
|
|
2759
|
+
allmarker_plots (type=json): All marker plot cases.
|
|
2760
|
+
The keys are the names of the cases and the values are the dicts inherited from `allmarker_plots_defaults`.
|
|
2761
|
+
allenrich_plots_defaults (ns): Default options for the plots to generate for the enrichment analysis.
|
|
2762
|
+
- plot_type: The type of the plot.
|
|
2763
|
+
- devpars (ns): The device parameters for the plots.
|
|
2764
|
+
- res (type=int): The resolution of the plots.
|
|
2765
|
+
- height (type=int): The height of the plots.
|
|
2766
|
+
- width (type=int): The width of the plots.
|
|
2767
|
+
- <more>: See <https://pwwang.github.io/scplotter/reference/EnrichmentPlot.html>.
|
|
2768
|
+
allenrich_plots (type=json): Cases of the plots to generate for the enrichment analysis.
|
|
2769
|
+
The keys are the names of the cases and the values are the dicts inherited from `allenrich_plots_defaults`.
|
|
2770
|
+
The cases under `envs.cases` can inherit this options.
|
|
2771
|
+
marker_plots_defaults (ns): Default options for the plots to generate for the markers.
|
|
2772
|
+
- plot_type: The type of the plot.
|
|
2773
|
+
See <https://pwwang.github.io/scplotter/reference/FeatureStatPlot.html>.
|
|
2774
|
+
Available types are `violin`, `box`, `bar`, `ridge`, `dim`, `heatmap` and `dot`.
|
|
2775
|
+
There are two additional types available - `volcano_pct` and `volcano_log2fc`.
|
|
2776
|
+
- more_formats (type=list): The extra formats to save the plot in.
|
|
2777
|
+
- save_code (flag): Whether to save the code to generate the plot.
|
|
2778
|
+
- devpars (ns): The device parameters for the plots.
|
|
2779
|
+
- res (type=int): The resolution of the plots.
|
|
2780
|
+
- height (type=int): The height of the plots.
|
|
2781
|
+
- width (type=int): The width of the plots.
|
|
2782
|
+
- order_by: an expression to order the markers, passed by `dplyr::arrange()`.
|
|
2783
|
+
- genes: The number of top genes to show or an expression passed to `dplyr::filter()` to filter the genes.
|
|
2784
|
+
- <more>: Other arguments passed to [`scplotter::FeatureStatPlot()`](https://pwwang.github.io/scplotter/reference/FeatureStatPlot.html).
|
|
2785
|
+
If `plot_type` is `volcano_pct` or `volcano_log2fc`, they will be passed to
|
|
2786
|
+
[`scplotter::VolcanoPlot()`](https://pwwang.github.io/plotthis/reference/VolcanoPlot.html).
|
|
2787
|
+
marker_plots (type=json): Cases of the plots to generate for the markers.
|
|
2788
|
+
Plot cases. The keys are the names of the cases and the values are the dicts inherited from `marker_plots_defaults`.
|
|
2789
|
+
The cases under `envs.cases` can inherit this options.
|
|
2790
|
+
enrich_plots_defaults (ns): Default options for the plots to generate for the enrichment analysis.
|
|
2791
|
+
- plot_type: The type of the plot.
|
|
2792
|
+
See <https://pwwang.github.io/scplotter/reference/EnrichmentPlot.html>.
|
|
2793
|
+
Available types are `bar`, `dot`, `lollipop`, `network`, `enrichmap` and `wordcloud`.
|
|
2794
|
+
- more_formats (type=list): The extra formats to save the plot in.
|
|
2795
|
+
- save_code (flag): Whether to save the code to generate the plot.
|
|
2796
|
+
- devpars (ns): The device parameters for the plots.
|
|
2797
|
+
- res (type=int): The resolution of the plots.
|
|
2798
|
+
- height (type=int): The height of the plots.
|
|
2799
|
+
- width (type=int): The width of the plots.
|
|
2800
|
+
- <more>: See <https://pwwang.github.io/scplotter/reference/EnrichmentPlot.htmll>.
|
|
2801
|
+
enrich_plots (type=json): Cases of the plots to generate for the enrichment analysis.
|
|
2802
|
+
The keys are the names of the cases and the values are the dicts inherited from `enrich_plots_defaults`.
|
|
2803
|
+
The cases under `envs.cases` can inherit this options.
|
|
2804
|
+
overlaps_defaults (ns): Default options for investigating the overlapping of significant markers between different cases or comparisons.
|
|
2805
|
+
This means either `ident-1` should be empty, so that they can be expanded to multiple comparisons.
|
|
2806
|
+
- sigmarkers: The expression to filter the significant markers for each case.
|
|
2807
|
+
If not provided, `envs.sigmarkers` will be used.
|
|
2808
|
+
- plot_type (choice): The type of the plot to generate for the overlaps.
|
|
2809
|
+
- venn: Use `plotthis::VennDiagram()`.
|
|
2810
|
+
- upset: Use `plotthis::UpsetPlot()`.
|
|
2811
|
+
- more_formats (type=list): The extra formats to save the plot in.
|
|
2812
|
+
- save_code (flag): Whether to save the code to generate the plot.
|
|
2813
|
+
- devpars (ns): The device parameters for the plots.
|
|
2814
|
+
- res (type=int): The resolution of the plots.
|
|
2815
|
+
- height (type=int): The height of the plots.
|
|
2816
|
+
- width (type=int): The width of the plots.
|
|
2817
|
+
- <more>: More arguments pased to `plotthis::VennDiagram()`
|
|
2818
|
+
(<https://pwwang.github.io/plotthis/reference/venndiagram1.html>)
|
|
2819
|
+
or `plotthis::UpsetPlot()`
|
|
2820
|
+
(<https://pwwang.github.io/plotthis/reference/upsetplot1.html>)
|
|
2821
|
+
overlaps (type=json): Cases for investigating the overlapping of significant markers between different cases or comparisons.
|
|
2822
|
+
The keys are the names of the cases and the values are the dicts inherited from `overlaps_defaults`.
|
|
2823
|
+
There are two situations that we can perform overlaps:
|
|
2824
|
+
1. If `ident-1` is not specified, the overlaps can be performed between different comparisons.
|
|
2825
|
+
2. If `each` is specified, the overlaps can be performed between different cases, where in each case, `ident-1` must be specified.
|
|
2826
|
+
tool (choice): The method to use for the differential expression analysis.
|
|
2827
|
+
- DESeq2: Use DESeq2 for the analysis.
|
|
2828
|
+
- edgeR: Use edgeR for the analysis.
|
|
2829
|
+
plots_defaults (ns): The default parameters for the plots.
|
|
2830
|
+
- <more>: Parameters passed to `biopipen.utils::VizBulkDEGs()`.
|
|
2831
|
+
See: <https://pwwang.github.io/biopipen.utils.R/reference/VizBulkDEGs.html>
|
|
2832
|
+
plots (type=json): The parameters for the plots.
|
|
2833
|
+
The keys are the names of the plots and the values are the parameters
|
|
2834
|
+
for the plots. The parameters will override the defaults in `plots_defaults`.
|
|
2835
|
+
If not specified, no plots will be generated.
|
|
2836
|
+
cases (type=json): The cases for the analysis.
|
|
2837
|
+
The keys are the names of the cases and the values are the arguments for
|
|
2838
|
+
the analysis. The arguments include the ones inherited from `envs`.
|
|
2839
|
+
If no cases are specified, a default case will be added with
|
|
2840
|
+
the name `DEG Analysis` and the default values specified above.
|
|
2841
|
+
""" # noqa: E501
|
|
2842
|
+
input = "sobjfile:file"
|
|
2843
|
+
output = "outdir:dir:{{in.sobjfile | stem}}.pseudobulk_deg"
|
|
2844
|
+
lang = config.lang.rscript
|
|
2845
|
+
script = "file://../scripts/scrna/PseudoBulkDEG.R"
|
|
2846
|
+
envs = {
|
|
2847
|
+
"mutaters": {},
|
|
2848
|
+
"each": None,
|
|
2849
|
+
"subset": None,
|
|
2850
|
+
"aggregate_by": None,
|
|
2851
|
+
"layer": "counts",
|
|
2852
|
+
"assay": "RNA",
|
|
2853
|
+
"error": True,
|
|
2854
|
+
"group_by": None,
|
|
2855
|
+
"ident_1": None,
|
|
2856
|
+
"ident_2": None,
|
|
2857
|
+
"paired_by": None,
|
|
2858
|
+
"tool": "DESeq2",
|
|
2859
|
+
"dbs": ["KEGG_2021_Human", "MSigDB_Hallmark_2020"],
|
|
2860
|
+
"sigmarkers": "p_val_adj < 0.05",
|
|
2861
|
+
"enrich_style": "enrichr",
|
|
2862
|
+
"allmarker_plots_defaults": {
|
|
2863
|
+
"plot_type": None,
|
|
2864
|
+
"more_formats": [],
|
|
2865
|
+
"save_code": False,
|
|
2866
|
+
"devpars": {"res": 100},
|
|
2867
|
+
"order_by": "desc(abs(log2FC))",
|
|
2868
|
+
"genes": 10,
|
|
2869
|
+
},
|
|
2870
|
+
"allmarker_plots": {},
|
|
2871
|
+
"allenrich_plots_defaults": {
|
|
2872
|
+
"plot_type": "heatmap",
|
|
2873
|
+
"devpars": {"res": 100},
|
|
2874
|
+
},
|
|
2875
|
+
"allenrich_plots": {},
|
|
2876
|
+
"marker_plots_defaults": {
|
|
2877
|
+
"plot_type": None,
|
|
2878
|
+
"more_formats": [],
|
|
2879
|
+
"save_code": False,
|
|
2880
|
+
"devpars": {"res": 100},
|
|
2881
|
+
"order_by": "desc(abs(log2FC))",
|
|
2882
|
+
"genes": 10,
|
|
2883
|
+
},
|
|
2884
|
+
"marker_plots": {
|
|
2885
|
+
"Volcano Plot": {"plot_type": "volcano"},
|
|
2886
|
+
},
|
|
2887
|
+
"enrich_plots_defaults": {
|
|
2888
|
+
"more_formats": [],
|
|
2889
|
+
"save_code": False,
|
|
2890
|
+
"devpars": {"res": 100},
|
|
2891
|
+
},
|
|
2892
|
+
"enrich_plots": {
|
|
2893
|
+
"Bar Plot": {"plot_type": "bar", "ncol": 1, "top_term": 10},
|
|
2894
|
+
},
|
|
2895
|
+
"overlaps_defaults": {
|
|
2896
|
+
"sigmarkers": None,
|
|
2897
|
+
"plot_type": "venn",
|
|
2898
|
+
"more_formats": [],
|
|
2899
|
+
"save_code": False,
|
|
2900
|
+
"devpars": {"res": 100},
|
|
2901
|
+
},
|
|
2902
|
+
"overlaps": {},
|
|
2903
|
+
"cases": {},
|
|
2904
|
+
}
|
|
2905
|
+
plugin_opts = {
|
|
2906
|
+
"report": "file://../reports/common.svelte",
|
|
2907
|
+
"report_paging": 8,
|
|
2908
|
+
}
|
|
@@ -165,7 +165,7 @@ class MetabolicFeatures(Proc):
|
|
|
165
165
|
`1`, `2` and `3` in the `group_by` column, we could have
|
|
166
166
|
`comparisons = ["1", "2"]`, which will compare the group `1` with groups
|
|
167
167
|
`2` and `3`, and the group `2` with groups `1` and `3`. We could also
|
|
168
|
-
have `comparisons = ["1
|
|
168
|
+
have `comparisons = ["1:2", "1:3"]`, which will compare the group `1` with
|
|
169
169
|
group `2` and group `1` with group `3`.
|
|
170
170
|
fgsea_args (type=json): Other arguments for the `fgsea::fgsea()` function.
|
|
171
171
|
For example, `{"minSize": 15, "maxSize": 500}`.
|
biopipen/ns/tcr.py
CHANGED
|
@@ -1749,6 +1749,11 @@ class ScRepCombiningExpression(Proc):
|
|
|
1749
1749
|
|
|
1750
1750
|
Output:
|
|
1751
1751
|
outfile: The `Seurat` object with the TCR/BCR data combined
|
|
1752
|
+
In addition to the meta columns added by
|
|
1753
|
+
`scRepertoire::combineExpression()`, a new column `TCR_Presence` will be
|
|
1754
|
+
added to the metadata. It indicates whether the cell has a TCR/BCR
|
|
1755
|
+
sequence or not. The value is `TRUE` if the cell has a TCR/BCR sequence,
|
|
1756
|
+
and `FALSE` otherwise.
|
|
1752
1757
|
|
|
1753
1758
|
Envs:
|
|
1754
1759
|
cloneCall: How to call the clone - VDJC gene (gene), CDR3 nucleotide (nt),
|
|
@@ -1756,10 +1761,10 @@ class ScRepCombiningExpression(Proc):
|
|
|
1756
1761
|
a custom variable in the data.
|
|
1757
1762
|
chain: indicate if both or a specific chain should be used
|
|
1758
1763
|
e.g. "both", "TRA", "TRG", "IGH", "IGL".
|
|
1759
|
-
|
|
1764
|
+
group_by: The column label in the combined clones in which clone frequency will
|
|
1760
1765
|
be calculated. NULL or "none" will keep the format of input.data.
|
|
1761
1766
|
proportion (flag): Whether to proportion (TRUE) or total frequency (FALSE) of
|
|
1762
|
-
the clone based on the
|
|
1767
|
+
the clone based on the group_by variable.
|
|
1763
1768
|
filterNA (flag): Method to subset Seurat/SCE object of barcodes without clone
|
|
1764
1769
|
information
|
|
1765
1770
|
cloneSize (type=json): The bins for the grouping based on proportion or
|
|
@@ -1767,7 +1772,7 @@ class ScRepCombiningExpression(Proc):
|
|
|
1767
1772
|
If proportion is FALSE and the cloneSizes are not set high enough based on
|
|
1768
1773
|
frequency, the upper limit of cloneSizes will be automatically updated.
|
|
1769
1774
|
addLabel (flag): This will add a label to the frequency header, allowing the
|
|
1770
|
-
user to try multiple
|
|
1775
|
+
user to try multiple group_by variables or recalculate frequencies after
|
|
1771
1776
|
subsetting the data.
|
|
1772
1777
|
"""
|
|
1773
1778
|
input = "screpfile:file,srtobj:file"
|
|
@@ -1776,7 +1781,7 @@ class ScRepCombiningExpression(Proc):
|
|
|
1776
1781
|
envs = {
|
|
1777
1782
|
"cloneCall": "aa",
|
|
1778
1783
|
"chain": "both",
|
|
1779
|
-
"
|
|
1784
|
+
"group_by": "Sample",
|
|
1780
1785
|
"proportion": True,
|
|
1781
1786
|
"filterNA": False,
|
|
1782
1787
|
"cloneSize": {
|
|
@@ -34,15 +34,15 @@ The cells are grouped at 2 dimensions: `subset_by`, usually the clinic groups th
|
|
|
34
34
|
|
|
35
35
|
<UnorderedList>
|
|
36
36
|
<ListItem>
|
|
37
|
-
<a href="
|
|
37
|
+
<a href="?proc=MetabolicPathwayActivity" class="listitem">MetabolicPathwayActivity</a>
|
|
38
38
|
<Tile><p>Investigating the metabolic pathways of the cells in different subsets and groups.</p></Tile>
|
|
39
39
|
</ListItem>
|
|
40
40
|
<ListItem>
|
|
41
|
-
<a href="
|
|
41
|
+
<a href="?proc=MetabolicPathwayHeterogeneity" class="listitem">MetabolicPathwayHeterogeneity</a>
|
|
42
42
|
<Tile><p>Showing metabolic pathways enriched in genes with highest contribution to the metabolic heterogeneities</p></Tile>
|
|
43
43
|
</ListItem>
|
|
44
44
|
<ListItem>
|
|
45
|
-
MetabolicFeatures (this page)
|
|
45
|
+
<span class="listitem">MetabolicFeatures (this page)</span>
|
|
46
46
|
<Tile>
|
|
47
47
|
<p>Gene set enrichment analysis against the metabolic pathways for comparisons by different groups in different subsets.</p>
|
|
48
48
|
<p>The metabolic features are actual gene set enrichment analysis (GSEA) results for the metabolic pathways with given comparisons.</p>
|
|
@@ -59,3 +59,12 @@ The cells are grouped at 2 dimensions: `subset_by`, usually the clinic groups th
|
|
|
59
59
|
{%- endmacro -%}
|
|
60
60
|
|
|
61
61
|
{{ report_jobs(jobs, head_job, report_job) }}
|
|
62
|
+
|
|
63
|
+
<style>
|
|
64
|
+
.listitem {
|
|
65
|
+
font-size: large;
|
|
66
|
+
font-weight: bold;
|
|
67
|
+
margin: 1rem 0 0.5rem 0;
|
|
68
|
+
display: inline-block;
|
|
69
|
+
}
|
|
70
|
+
</style>
|
|
@@ -34,7 +34,7 @@ The cells are grouped at 2 dimensions: `subset_by`, usually the clinic groups th
|
|
|
34
34
|
|
|
35
35
|
<UnorderedList>
|
|
36
36
|
<ListItem>
|
|
37
|
-
MetabolicPathwayActivity (this page)
|
|
37
|
+
<span class="listitem">MetabolicPathwayActivity (this page)</span>
|
|
38
38
|
<Tile>
|
|
39
39
|
<p>Investigating the metabolic pathways of the cells in different subsets and groups.</p>
|
|
40
40
|
<p>The cells are first subset by subsets and then the metabolic activities are examined for each groups in different subsets.</p>
|
|
@@ -69,13 +69,13 @@ The cells are grouped at 2 dimensions: `subset_by`, usually the clinic groups th
|
|
|
69
69
|
</Tile>
|
|
70
70
|
</ListItem>
|
|
71
71
|
<ListItem>
|
|
72
|
-
<a href="
|
|
72
|
+
<a href="?proc=MetabolicPathwayHeterogeneity" class="listitem">MetabolicPathwayHeterogeneity</a>
|
|
73
73
|
<Tile>
|
|
74
74
|
<p>Showing metabolic pathways enriched in genes with highest contribution to the metabolic heterogeneities</p>
|
|
75
75
|
</Tile>
|
|
76
76
|
</ListItem>
|
|
77
77
|
<ListItem>
|
|
78
|
-
<a href="
|
|
78
|
+
<a href="?proc=MetabolicFeatures" class="listitem">MetabolicFeatures</a>
|
|
79
79
|
<Tile>
|
|
80
80
|
<p>Gene set enrichment analysis against the metabolic pathways for comparisons by different groups in different subsets.</p>
|
|
81
81
|
</Tile>
|
|
@@ -91,3 +91,12 @@ The cells are grouped at 2 dimensions: `subset_by`, usually the clinic groups th
|
|
|
91
91
|
{%- endmacro -%}
|
|
92
92
|
|
|
93
93
|
{{ report_jobs(jobs, head_job, report_job) }}
|
|
94
|
+
|
|
95
|
+
<style>
|
|
96
|
+
.listitem {
|
|
97
|
+
font-size: large;
|
|
98
|
+
font-weight: bold;
|
|
99
|
+
margin: 1rem 0 0.5rem 0;
|
|
100
|
+
display: inline-block;
|
|
101
|
+
}
|
|
102
|
+
</style>
|
|
@@ -34,13 +34,13 @@ The cells are grouped at 2 dimensions: `subset_by`, usually the clinic groups th
|
|
|
34
34
|
|
|
35
35
|
<UnorderedList>
|
|
36
36
|
<ListItem>
|
|
37
|
-
<a href="
|
|
37
|
+
<a href="?proc=MetabolicPathwayActivity" class="listitem">MetabolicPathwayActivity</a>
|
|
38
38
|
<Tile>
|
|
39
39
|
<p>Investigating the metabolic pathways of the cells in different subsets and groups.</p>
|
|
40
40
|
</Tile>
|
|
41
41
|
</ListItem>
|
|
42
42
|
<ListItem>
|
|
43
|
-
MetabolicPathwayHeterogeneity (this page)
|
|
43
|
+
<span class="listitem">MetabolicPathwayHeterogeneity (this page)</span>
|
|
44
44
|
<Tile>
|
|
45
45
|
<p>Showing metabolic pathways enriched in genes with highest contribution to the metabolic heterogeneities</p>
|
|
46
46
|
<p>
|
|
@@ -54,7 +54,7 @@ The cells are grouped at 2 dimensions: `subset_by`, usually the clinic groups th
|
|
|
54
54
|
</Tile>
|
|
55
55
|
</ListItem>
|
|
56
56
|
<ListItem>
|
|
57
|
-
<a href="
|
|
57
|
+
<a href="?proc=MetabolicFeatures" class="listitem">MetabolicFeatures</a>
|
|
58
58
|
<Tile>
|
|
59
59
|
<p>Gene set enrichment analysis against the metabolic pathways for comparisons by different groups in different subsets.</p>
|
|
60
60
|
</Tile>
|
|
@@ -70,3 +70,12 @@ The cells are grouped at 2 dimensions: `subset_by`, usually the clinic groups th
|
|
|
70
70
|
{%- endmacro -%}
|
|
71
71
|
|
|
72
72
|
{{ report_jobs(jobs, head_job, report_job) }}
|
|
73
|
+
|
|
74
|
+
<style>
|
|
75
|
+
.listitem {
|
|
76
|
+
font-size: large;
|
|
77
|
+
font-weight: bold;
|
|
78
|
+
margin: 1rem 0 0.5rem 0;
|
|
79
|
+
display: inline-block;
|
|
80
|
+
}
|
|
81
|
+
</style>
|
|
@@ -26,15 +26,8 @@ if (is.null(celltypist_args$model)) {
|
|
|
26
26
|
}
|
|
27
27
|
dir.create(file.path(outdir, "data", "models"), recursive = TRUE, showWarnings = FALSE)
|
|
28
28
|
modelfile <- file.path(outdir, "data", "models", basename(celltypist_args$model))
|
|
29
|
-
|
|
30
|
-
|
|
31
|
-
} else {
|
|
32
|
-
real_modelfile <- normalizePath(Sys.readlink(modelfile))
|
|
33
|
-
if (real_modelfile != normalizePath(celltypist_args$model)) {
|
|
34
|
-
file.remove(modelfile)
|
|
35
|
-
file.symlink(celltypist_args$model, modelfile)
|
|
36
|
-
}
|
|
37
|
-
}
|
|
29
|
+
suppressWarnings(file.remove(modelfile))
|
|
30
|
+
file.symlink(normalizePath(celltypist_args$model), modelfile)
|
|
38
31
|
|
|
39
32
|
sobj <- NULL
|
|
40
33
|
if (!endsWith(sobjfile, ".h5ad")) {
|
|
@@ -43,7 +36,7 @@ if (!endsWith(sobjfile, ".h5ad")) {
|
|
|
43
36
|
# find the default ident name in meta.data
|
|
44
37
|
for (col in colnames(sobj@meta.data)) {
|
|
45
38
|
if (!is.factor(sobj@meta.data[[col]])) { next }
|
|
46
|
-
if (isTRUE(all.equal(Idents(sobj), sobj@meta.data[[col]]))) {
|
|
39
|
+
if (isTRUE(all.equal(unname(Idents(sobj)), sobj@meta.data[[col]]))) {
|
|
47
40
|
celltypist_args$over_clustering <- col
|
|
48
41
|
break
|
|
49
42
|
}
|