biopipen 0.29.0__py3-none-any.whl → 0.29.1__py3-none-any.whl
This diff represents the content of publicly available package versions that have been released to one of the supported registries. The information contained in this diff is provided for informational purposes only and reflects changes between package versions as they appear in their respective public registries.
Potentially problematic release.
This version of biopipen might be problematic. Click here for more details.
- biopipen/__init__.py +1 -1
- biopipen/ns/plot.py +66 -8
- biopipen/ns/{regulation.py → regulatory.py} +3 -3
- biopipen/ns/scrna.py +16 -2
- biopipen/ns/stats.py +93 -1
- biopipen/scripts/delim/SampleInfo.R +10 -5
- biopipen/scripts/plot/Manhattan.R +6 -0
- biopipen/scripts/plot/QQPlot.R +100 -16
- biopipen/scripts/{regulation → regulatory}/MotifAffinityTest.R +3 -3
- biopipen/scripts/{regulation → regulatory}/MotifScan.py +1 -1
- biopipen/scripts/scrna/MarkersFinder.R +28 -18
- biopipen/scripts/scrna/SeuratClustering.R +8 -0
- biopipen/scripts/scrna/SeuratPreparing.R +252 -122
- biopipen/scripts/snp/MatrixEQTL.R +2 -2
- biopipen/scripts/snp/PlinkIBD.R +3 -0
- biopipen/scripts/stats/Mediation.R +94 -0
- {biopipen-0.29.0.dist-info → biopipen-0.29.1.dist-info}/METADATA +1 -1
- {biopipen-0.29.0.dist-info → biopipen-0.29.1.dist-info}/RECORD +24 -23
- {biopipen-0.29.0.dist-info → biopipen-0.29.1.dist-info}/entry_points.txt +1 -1
- /biopipen/scripts/{regulation → regulatory}/MotifAffinityTest_AtSNP.R +0 -0
- /biopipen/scripts/{regulation → regulatory}/MotifAffinityTest_MotifBreakR.R +0 -0
- /biopipen/scripts/{regulation → regulatory}/atSNP.R +0 -0
- /biopipen/scripts/{regulation → regulatory}/motifBreakR.R +0 -0
- {biopipen-0.29.0.dist-info → biopipen-0.29.1.dist-info}/WHEEL +0 -0
biopipen/__init__.py
CHANGED
|
@@ -1 +1 @@
|
|
|
1
|
-
__version__ = "0.29.
|
|
1
|
+
__version__ = "0.29.1"
|
biopipen/ns/plot.py
CHANGED
|
@@ -221,7 +221,7 @@ class Manhattan(Proc):
|
|
|
221
221
|
"label_col": None,
|
|
222
222
|
"devpars": {"res": 100, "width": 1000, "height": 500},
|
|
223
223
|
"zoom_devpars": {"width": 500, "height": None, "res": None},
|
|
224
|
-
"title":
|
|
224
|
+
"title": None,
|
|
225
225
|
"ylabel": "-log10(p-value)",
|
|
226
226
|
"rescale": True,
|
|
227
227
|
"rescale_ratio_threshold": 5,
|
|
@@ -245,6 +245,11 @@ class QQPlot(Proc):
|
|
|
245
245
|
infile: The input file for data
|
|
246
246
|
It should contain at least one column of p-values or the values to be
|
|
247
247
|
plotted. Header is required.
|
|
248
|
+
theorfile: The file for theoretical values (optional)
|
|
249
|
+
This file should contain at least one column of theoretical values.
|
|
250
|
+
The values will be passed to `envs.theor_qfunc` to calculate the theoretical
|
|
251
|
+
quantiles.
|
|
252
|
+
Header is required.
|
|
248
253
|
|
|
249
254
|
Output:
|
|
250
255
|
outfile: The output figure file
|
|
@@ -266,33 +271,86 @@ class QQPlot(Proc):
|
|
|
266
271
|
kind (choice): The kind of the plot, `qq` or `pp`
|
|
267
272
|
- qq: QQ-plot
|
|
268
273
|
- pp: PP-plot
|
|
269
|
-
|
|
274
|
+
theor_col: The column for theoretical values in `in.theorfile` if provided,
|
|
275
|
+
otherwise in `in.infile`.
|
|
276
|
+
An integer (1-based) or a string indicating the column name.
|
|
277
|
+
If `distribution` of `band`, `line`, or `point` is `custom`, this column
|
|
278
|
+
must be provided.
|
|
279
|
+
theor_trans: The transformation of the theoretical values.
|
|
280
|
+
The `theor_funs` have default functions to take the theoretical values.
|
|
281
|
+
This transformation will be applied to the theoretical values before
|
|
282
|
+
passing to the `theor_funs`.
|
|
283
|
+
theor_funs (ns): The R functions to generate density, quantile and deviates
|
|
284
|
+
of the theoretical distribution base on the theoretical values
|
|
285
|
+
if `distribution` of `band`, `line`, or `point` is `custom`.
|
|
286
|
+
- dcustom: The density function, used by band
|
|
287
|
+
- qcustom: The quantile function, used by point
|
|
288
|
+
- rcustom: The deviates function, used by line
|
|
289
|
+
args (ns): The common arguments for `envs.band`, `envs.line` and `envs.point`.
|
|
290
|
+
- distribution: The distribution of the theoretical quantiles
|
|
291
|
+
When `custom` is used, the `envs.theor_col` should be provided and
|
|
292
|
+
`values` will be added to `dparams` automatically.
|
|
293
|
+
- dparams (type=json): The parameters for the distribution
|
|
294
|
+
- <more>: Other shared arguments between `stat_*_band`, `stat_*_line`
|
|
295
|
+
and `stat_*_point`.
|
|
296
|
+
band (ns): The arguments for `stat_qq_band()` or `stat_pp_band()`.
|
|
270
297
|
See <https://rdrr.io/cran/qqplotr/man/stat_qq_band.html> and
|
|
271
298
|
<https://rdrr.io/cran/qqplotr/man/stat_pp_band.html>.
|
|
299
|
+
Set to `None` or `band.disabled` to True to disable the band.
|
|
300
|
+
- disabled (flag): Disable the band
|
|
301
|
+
- distribution: The distribution of the theoretical quantiles
|
|
302
|
+
When `custom` is used, the `envs.theor_col` should be provided and
|
|
303
|
+
`values` will be added to `dparams` automatically.
|
|
304
|
+
- dparams (type=json): The parameters for the distribution
|
|
272
305
|
- <more>: Additional arguments for `stat_qq_band()` or `stat_pp_band()`
|
|
273
|
-
line (ns): The arguments for `stat_qq_line()` or `stat_pp_line()
|
|
306
|
+
line (ns): The arguments for `stat_qq_line()` or `stat_pp_line()`.
|
|
274
307
|
See <https://rdrr.io/cran/qqplot/man/stat_qq_line.html> and
|
|
275
308
|
<https://rdrr.io/cran/qqplot/man/stat_pp_line.html>.
|
|
309
|
+
Set to `None` or `line.disabled` to True to disable the line.
|
|
310
|
+
- disabled (flag): Disable the line
|
|
311
|
+
- distribution: The distribution of the theoretical quantiles
|
|
312
|
+
When `custom` is used, the `envs.theor_col` should be provided and
|
|
313
|
+
`values` will be added to `dparams` automatically.
|
|
314
|
+
- dparams (type=json): The parameters for the distribution
|
|
276
315
|
- <more>: Additional arguments for `stat_qq_line()` or `stat_pp_line()`
|
|
277
|
-
point (ns): The arguments for `geom_qq_point()` or `geom_pp_point()
|
|
316
|
+
point (ns): The arguments for `geom_qq_point()` or `geom_pp_point()`.
|
|
278
317
|
See <https://rdrr.io/cran/qqplot/man/stat_qq_point.html> and
|
|
279
318
|
<https://rdrr.io/cran/qqplot/man/stat_pp_point.html>.
|
|
319
|
+
Set to `None` or `point.disabled` to True to disable the point.
|
|
320
|
+
- disabled (flag): Disable the point
|
|
321
|
+
- distribution: The distribution of the theoretical quantiles
|
|
322
|
+
When `custom` is used, the `envs.theor_col` should be provided and
|
|
323
|
+
`values` will be added to `dparams` automatically.
|
|
324
|
+
- dparams (type=json): The parameters for the distribution
|
|
325
|
+
- <more>: Additional arguments for `geom_qq_point()` or `geom_pp_point()`
|
|
280
326
|
ggs (list): Additional ggplot expression to adjust the plot.
|
|
281
327
|
"""
|
|
282
|
-
input = "infile:file"
|
|
328
|
+
input = "infile:file, theorfile:file"
|
|
283
329
|
output = "outfile:file:{{in.infile | stem}}.{{envs.kind}}.png"
|
|
284
330
|
lang = config.lang.rscript
|
|
285
331
|
envs = {
|
|
286
332
|
"val_col": 1,
|
|
333
|
+
"theor_col": None,
|
|
334
|
+
"theor_trans": None,
|
|
335
|
+
"theor_funs": {
|
|
336
|
+
"dcustom": """
|
|
337
|
+
function(x, values, ...) {
|
|
338
|
+
density(values, from = min(values), to = max(values), n = length(x))$y
|
|
339
|
+
}
|
|
340
|
+
""",
|
|
341
|
+
"qcustom": "function(p, values, ...) {quantile(values, probs = p)}",
|
|
342
|
+
"rcustom": "function(n, values, ...) { sample(values, n, replace = TRUE) }",
|
|
343
|
+
},
|
|
344
|
+
"args": {"distribution": "norm", "dparams": {}},
|
|
287
345
|
"devpars": {"res": 100, "width": 1000, "height": 1000},
|
|
288
346
|
"xlabel": "Theoretical Quantiles",
|
|
289
347
|
"ylabel": "Observed Quantiles",
|
|
290
348
|
"title": "QQ-plot",
|
|
291
349
|
"trans": None,
|
|
292
350
|
"kind": "qq",
|
|
293
|
-
"band": {},
|
|
294
|
-
"line": {},
|
|
295
|
-
"point": {},
|
|
351
|
+
"band": {"disabled": False, "distribution": None, "dparams": None},
|
|
352
|
+
"line": {"disabled": False, "distribution": None, "dparams": None},
|
|
353
|
+
"point": {"disabled": False, "distribution": None, "dparams": None},
|
|
296
354
|
"ggs": None,
|
|
297
355
|
}
|
|
298
356
|
script = "file://../scripts/plot/QQPlot.R"
|
|
@@ -1,4 +1,4 @@
|
|
|
1
|
-
"""Provides processes for the
|
|
1
|
+
"""Provides processes for the regulatory related"""
|
|
2
2
|
|
|
3
3
|
from ..core.proc import Proc
|
|
4
4
|
from ..core.config import config
|
|
@@ -86,7 +86,7 @@ class MotifScan(Proc):
|
|
|
86
86
|
"q_cutoff": False,
|
|
87
87
|
"args": {},
|
|
88
88
|
}
|
|
89
|
-
script = "file://../scripts/
|
|
89
|
+
script = "file://../scripts/regulatory/MotifScan.py"
|
|
90
90
|
|
|
91
91
|
|
|
92
92
|
class MotifAffinityTest(Proc):
|
|
@@ -211,4 +211,4 @@ class MotifAffinityTest(Proc):
|
|
|
211
211
|
"motifbreakr_args": {"method": "default"},
|
|
212
212
|
"atsnp_args": {"padj_cutoff": True, "padj": "BH", "p": "pval_diff"},
|
|
213
213
|
}
|
|
214
|
-
script = "file://../scripts/
|
|
214
|
+
script = "file://../scripts/regulatory/MotifAffinityTest.R"
|
biopipen/ns/scrna.py
CHANGED
|
@@ -53,7 +53,7 @@ class SeuratPreparing(Proc):
|
|
|
53
53
|
|
|
54
54
|
See also
|
|
55
55
|
- <https://satijalab.org/seurat/articles/pbmc3k_tutorial.html#standard-pre-processing-workflow-1)>
|
|
56
|
-
- <https://
|
|
56
|
+
- <https://satijalab.org/seurat/articles/integration_introduction>
|
|
57
57
|
|
|
58
58
|
This process will read the scRNA-seq data, based on the information provided by
|
|
59
59
|
`SampleInfo`, specifically, the paths specified by the `RNAData` column.
|
|
@@ -210,6 +210,19 @@ class SeuratPreparing(Proc):
|
|
|
210
210
|
- PCs (type=int): Number of PCs to use for 'doubletFinder' function.
|
|
211
211
|
- doublets (type=float): Number of expected doublets as a proportion of the pool size.
|
|
212
212
|
- pN (type=float): Number of doublets to simulate as a proportion of the pool size.
|
|
213
|
+
- ncores (type=int): Number of cores to use for `DoubletFinder::paramSweep`.
|
|
214
|
+
Set to `None` to use `envs.ncores`.
|
|
215
|
+
Since parallelization of the function usually exhausts memory, if big `envs.ncores` does not work
|
|
216
|
+
for `DoubletFinder`, set this to a smaller number.
|
|
217
|
+
|
|
218
|
+
cache (type=auto): Whether to cache the information at different steps.
|
|
219
|
+
If `True`, the seurat object will be cached in the job output directory, which will be not cleaned up when job is rerunning.
|
|
220
|
+
The cached seurat object will be saved as `<signature>.<kind>.RDS` file, where `<signature>` is the signature determined by
|
|
221
|
+
the input and envs of the process.
|
|
222
|
+
See <https://github.com/satijalab/seurat/issues/7849>, <https://github.com/satijalab/seurat/issues/5358> and
|
|
223
|
+
<https://github.com/satijalab/seurat/issues/6748> for more details also about reproducibility issues.
|
|
224
|
+
To not use the cached seurat object, you can either set `cache` to `False` or delete the cached file at
|
|
225
|
+
`<signature>.RDS` in the cache directory.
|
|
213
226
|
|
|
214
227
|
Requires:
|
|
215
228
|
r-seurat:
|
|
@@ -238,7 +251,8 @@ class SeuratPreparing(Proc):
|
|
|
238
251
|
"min_cells": 5,
|
|
239
252
|
},
|
|
240
253
|
"IntegrateLayers": {"method": "harmony"},
|
|
241
|
-
"DoubletFinder": {"PCs": 0, "pN": 0.25, "doublets": 0.075},
|
|
254
|
+
"DoubletFinder": {"PCs": 0, "pN": 0.25, "doublets": 0.075, "ncores": 1},
|
|
255
|
+
"cache": config.path.tmpdir,
|
|
242
256
|
}
|
|
243
257
|
script = "file://../scripts/scrna/SeuratPreparing.R"
|
|
244
258
|
plugin_opts = {
|
biopipen/ns/stats.py
CHANGED
|
@@ -73,11 +73,103 @@ class ChowTest(Proc):
|
|
|
73
73
|
script = "file://../scripts/stats/ChowTest.R"
|
|
74
74
|
|
|
75
75
|
|
|
76
|
+
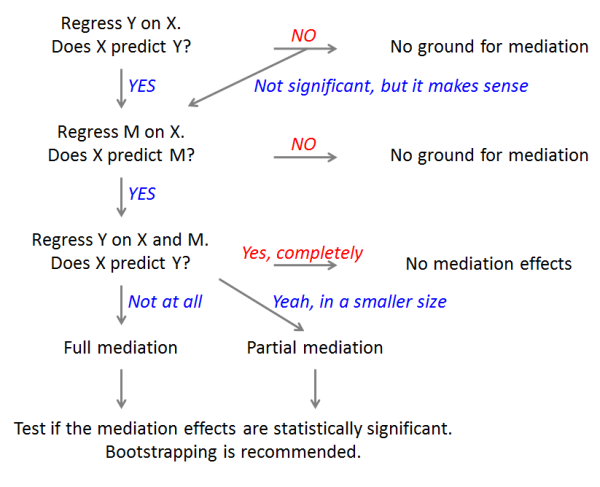
class Mediation(Proc):
|
|
77
|
+
"""Mediation analysis.
|
|
78
|
+
|
|
79
|
+
The flowchart of mediation analysis:
|
|
80
|
+
|
|
81
|
+
|
|
82
|
+
|
|
83
|
+
Reference:
|
|
84
|
+
- <https://library.virginia.edu/data/articles/introduction-to-mediation-analysis>
|
|
85
|
+
- <https://en.wikipedia.org/wiki/Mediation_(statistics)>
|
|
86
|
+
- <https://tilburgsciencehub.com/topics/analyze/regression/linear-regression/mediation-analysis/>
|
|
87
|
+
- <https://ademos.people.uic.edu/Chapter14.html>
|
|
88
|
+
|
|
89
|
+
Input:
|
|
90
|
+
infile: The input data file. The rows are samples and the columns are
|
|
91
|
+
features. It must be tab-delimited.
|
|
92
|
+
```
|
|
93
|
+
Sample F1 F2 F3 ... Fn
|
|
94
|
+
S1 1.2 3.4 5.6 7.8
|
|
95
|
+
S2 2.3 4.5 6.7 8.9
|
|
96
|
+
...
|
|
97
|
+
Sm 5.6 7.8 9.0 1.2
|
|
98
|
+
```
|
|
99
|
+
fmlfile: The formula file.
|
|
100
|
+
```
|
|
101
|
+
Case M Y X Cov Model_M Model_Y
|
|
102
|
+
Case1 F1 F2 F3 F4,F5 glm lm
|
|
103
|
+
...
|
|
104
|
+
```
|
|
105
|
+
Where Y is the outcome variable, X is the predictor variable, M is the
|
|
106
|
+
mediator variable, and Case is the case name. Model_M and Model_Y are the
|
|
107
|
+
models for M and Y, respectively.
|
|
108
|
+
`envs.cases` will be ignored if this is provided.
|
|
109
|
+
|
|
110
|
+
Output:
|
|
111
|
+
outfile: The output file.
|
|
112
|
+
Columns to help understand the results:
|
|
113
|
+
Total Effect: a total effect of X on Y (without M) (`Y ~ X`).
|
|
114
|
+
ADE: A Direct Effect of X on Y after taking into account a mediation effect of M (`Y ~ X + M`).
|
|
115
|
+
ACME: The Mediation Effect, the total effect minus the direct effect,
|
|
116
|
+
which equals to a product of a coefficient of X in the second step and a coefficient of M in the last step.
|
|
117
|
+
The goal of mediation analysis is to obtain this indirect effect and see if it's statistically significant.
|
|
118
|
+
|
|
119
|
+
Envs:
|
|
120
|
+
ncores (type=int): Number of cores to use for parallelization for cases.
|
|
121
|
+
sims (type=int): Number of Monte Carlo draws for nonparametric bootstrap or quasi-Bayesian approximation.
|
|
122
|
+
Will be passed to `mediation::mediate` function.
|
|
123
|
+
args (ns): Other arguments passed to `mediation::mediate` function.
|
|
124
|
+
- <more>: More arguments passed to `mediation::mediate` function.
|
|
125
|
+
See: <https://rdrr.io/cran/mediation/man/mediate.html>
|
|
126
|
+
padj (choice): The method for (ACME) p-value adjustment.
|
|
127
|
+
- none: No p-value adjustment (no Padj column in outfile).
|
|
128
|
+
- holm: Holm-Bonferroni method.
|
|
129
|
+
- hochberg: Hochberg method.
|
|
130
|
+
- hommel: Hommel method.
|
|
131
|
+
- bonferroni: Bonferroni method.
|
|
132
|
+
- BH: Benjamini-Hochberg method.
|
|
133
|
+
- BY: Benjamini-Yekutieli method.
|
|
134
|
+
- fdr: FDR correction method.
|
|
135
|
+
cases (type=json): The cases for mediation analysis.
|
|
136
|
+
Ignored if `in.fmlfile` is provided.
|
|
137
|
+
A json/dict with case names as keys and values as a dict of M, Y, X, Cov, Model_M, Model_Y.
|
|
138
|
+
For example:
|
|
139
|
+
```json
|
|
140
|
+
{
|
|
141
|
+
"Case1": {
|
|
142
|
+
"M": "F1",
|
|
143
|
+
"Y": "F2",
|
|
144
|
+
"X": "F3",
|
|
145
|
+
"Cov": "F4,F5",
|
|
146
|
+
"Model_M": "glm",
|
|
147
|
+
"Model_Y": "lm"
|
|
148
|
+
},
|
|
149
|
+
...
|
|
150
|
+
}
|
|
151
|
+
```
|
|
152
|
+
transpose_input (flag): Whether to transpose the input file.
|
|
153
|
+
""" # noqa: E501
|
|
154
|
+
input = "infile:file, fmlfile:file"
|
|
155
|
+
output = "outfile:file:{{in.infile | stem}}.mediation.txt"
|
|
156
|
+
lang = config.lang.rscript
|
|
157
|
+
envs = {
|
|
158
|
+
"ncores": config.misc.ncores,
|
|
159
|
+
"sims": 1000,
|
|
160
|
+
"args": {},
|
|
161
|
+
"padj": "none",
|
|
162
|
+
"cases": {},
|
|
163
|
+
"transpose_input": False,
|
|
164
|
+
}
|
|
165
|
+
script = "file://../scripts/stats/Mediation.R"
|
|
166
|
+
|
|
167
|
+
|
|
76
168
|
class LiquidAssoc(Proc):
|
|
77
169
|
"""Liquid association tests.
|
|
78
170
|
|
|
79
171
|
See Also https://github.com/gundt/fastLiquidAssociation
|
|
80
|
-
|
|
172
|
+
Requires https://github.com/pwwang/fastLiquidAssociation
|
|
81
173
|
|
|
82
174
|
Input:
|
|
83
175
|
infile: The input data file. The rows are samples and the columns are
|
|
@@ -88,7 +88,11 @@ for (name in names(stats)) {
|
|
|
88
88
|
group <- if (is.null(stat$group)) sym("..group") else sym(stat$group)
|
|
89
89
|
count_on <- paste0("..count.", stat$on)
|
|
90
90
|
if (!is_continuous) {
|
|
91
|
-
|
|
91
|
+
if (!is.null(stat$each)) {
|
|
92
|
+
data <- data %>% add_count(!!group, !!sym(stat$each), name = count_on)
|
|
93
|
+
} else {
|
|
94
|
+
data <- data %>% add_count(!!group, name = count_on)
|
|
95
|
+
}
|
|
92
96
|
}
|
|
93
97
|
|
|
94
98
|
if (is.null(stat$devpars)) {
|
|
@@ -141,18 +145,19 @@ for (name in names(stats)) {
|
|
|
141
145
|
} else {
|
|
142
146
|
data <- data %>%
|
|
143
147
|
distinct(!!group, !!sym(stat$each), .keep_all = TRUE) %>%
|
|
148
|
+
mutate(!!group := factor(!!group, levels = unique(!!group))) %>%
|
|
144
149
|
group_by(!!sym(stat$each))
|
|
145
150
|
}
|
|
146
151
|
p <- ggplot(
|
|
147
|
-
data %>%
|
|
148
|
-
aes(x =
|
|
152
|
+
data %>% mutate(.size = sum(!!sym(count_on))),
|
|
153
|
+
aes(x = sqrt(.size) / 2, width = sqrt(.size), y = !!sym(count_on), fill = !!group, label = !!sym(count_on))
|
|
149
154
|
) +
|
|
150
|
-
geom_bar(stat="identity",
|
|
155
|
+
geom_bar(stat="identity", color="white", position = position_fill(reverse = TRUE)) +
|
|
151
156
|
coord_polar("y", start = 0) +
|
|
152
157
|
theme_void() +
|
|
153
158
|
theme(plot.title = element_text(hjust = 0.5)) +
|
|
154
159
|
geom_label_repel(
|
|
155
|
-
position =
|
|
160
|
+
position = position_fill(reverse = TRUE,vjust = .5),
|
|
156
161
|
color="#333333",
|
|
157
162
|
fill="#EEEEEE",
|
|
158
163
|
size=4
|
|
@@ -105,6 +105,7 @@ args$signif <- signif
|
|
|
105
105
|
args$plot.title <- title
|
|
106
106
|
args$rescale <- rescale
|
|
107
107
|
args$rescale.ratio.threshold <- rescale_ratio_threshold
|
|
108
|
+
args$y.label <- ylabel
|
|
108
109
|
if (!is.null(hicolors)) { args$color.by.highlight <- TRUE }
|
|
109
110
|
if (!is.null(label_col)) { args$label.colname <- ".label" }
|
|
110
111
|
g <- do_call(manhattan_plot, args)
|
|
@@ -114,10 +115,15 @@ print(g)
|
|
|
114
115
|
dev.off()
|
|
115
116
|
|
|
116
117
|
# zoom into chromosomes
|
|
118
|
+
all_chroms <- as.character(unique(mpdata$data[[mpdata$chr.colname]]))
|
|
117
119
|
if (!is.null(zoom)) {
|
|
118
120
|
log_info("Zooming into chromosomes ...")
|
|
119
121
|
zoom <- norm_chroms(zoom)
|
|
120
122
|
for (z in zoom) {
|
|
123
|
+
if (!z %in% all_chroms) {
|
|
124
|
+
log_warn("- {z}: not found in data")
|
|
125
|
+
next
|
|
126
|
+
}
|
|
121
127
|
log_info("- {z}")
|
|
122
128
|
args_z <- args
|
|
123
129
|
args_z$chromosome <- z
|
biopipen/scripts/plot/QQPlot.R
CHANGED
|
@@ -1,5 +1,7 @@
|
|
|
1
1
|
source("{{biopipen_dir}}/utils/misc.R")
|
|
2
2
|
|
|
3
|
+
library(rlang)
|
|
4
|
+
library(stats)
|
|
3
5
|
library(ggplot2)
|
|
4
6
|
library(ggprism)
|
|
5
7
|
library(qqplotr)
|
|
@@ -7,50 +9,132 @@ library(qqplotr)
|
|
|
7
9
|
theme_set(theme_prism())
|
|
8
10
|
|
|
9
11
|
infile <- {{in.infile | r}}
|
|
12
|
+
theorfile <- {{in.theorfile | r}}
|
|
10
13
|
outfile <- {{out.outfile | r}}
|
|
11
14
|
val_col <- {{envs.val_col | r}}
|
|
15
|
+
theor_col <- {{envs.theor_col | r}}
|
|
16
|
+
theor_trans <- {{envs.theor_trans | r}}
|
|
17
|
+
theor_funs <- {{envs.theor_funs | r}}
|
|
12
18
|
devpars <- {{envs.devpars | r}}
|
|
13
19
|
title <- {{envs.title | r}}
|
|
14
20
|
xlabel <- {{envs.xlabel | r}}
|
|
15
21
|
ylabel <- {{envs.ylabel | r}}
|
|
16
22
|
kind <- {{envs.kind | r}}
|
|
17
23
|
trans <- {{envs.trans | r}}
|
|
24
|
+
args <- {{envs.args | r}}
|
|
18
25
|
band_args <- {{envs.band | r}}
|
|
19
26
|
line_args <- {{envs.line | r}}
|
|
20
27
|
point_args <- {{envs.point | r}}
|
|
21
28
|
ggs <- {{envs.ggs | r}}
|
|
22
29
|
|
|
30
|
+
.eval_fun <- function(fun) {
|
|
31
|
+
if (is.character(fun)) {
|
|
32
|
+
fun <- trimws(fun)
|
|
33
|
+
if (grepl("^-\\s*[a-zA-Z\\.][0-9a-zA-Z\\._]*$", fun)) {
|
|
34
|
+
fun <- trimws(substring(fun, 2))
|
|
35
|
+
fun <- eval(parse(text = fun))
|
|
36
|
+
return(function(x) -fun(x))
|
|
37
|
+
} else {
|
|
38
|
+
return(eval(parse(text = fun)))
|
|
39
|
+
}
|
|
40
|
+
} else {
|
|
41
|
+
return(fun)
|
|
42
|
+
}
|
|
43
|
+
}
|
|
44
|
+
|
|
23
45
|
indata <- read.table(infile, header=TRUE, sep="\t", stringsAsFactors=FALSE, check.names = FALSE)
|
|
24
|
-
if (is.numeric(val_col)) {
|
|
46
|
+
if (is.numeric(val_col)) {
|
|
47
|
+
val_col <- colnames(indata)[val_col]
|
|
48
|
+
}
|
|
49
|
+
if (!is.null(trans)) {
|
|
50
|
+
trans <- .eval_fun(trans)
|
|
51
|
+
indata[[val_col]] <- trans(indata[[val_col]])
|
|
52
|
+
}
|
|
53
|
+
|
|
54
|
+
if (!is.null(theor_col)) {
|
|
55
|
+
if (is.numeric(theor_col)) {
|
|
56
|
+
theor_col <- colnames(theor)[theor_col]
|
|
57
|
+
}
|
|
58
|
+
|
|
59
|
+
if (!is.null(theorfile)) {
|
|
60
|
+
theor <- read.table(theorfile, header=TRUE, sep="\t", stringsAsFactors=FALSE, check.names = FALSE)
|
|
61
|
+
theor_vals <- theor[[theor_col]]
|
|
62
|
+
} else {
|
|
63
|
+
theor_vals <- indata[[theor_col]]
|
|
64
|
+
}
|
|
65
|
+
|
|
66
|
+
if (!is.null(theor_trans)) {
|
|
67
|
+
theor_trans <- .eval_fun(theor_trans)
|
|
68
|
+
theor_vals <- theor_trans(theor_vals)
|
|
69
|
+
}
|
|
70
|
+
theor_vals <- sort(na.omit(theor_vals))
|
|
71
|
+
}
|
|
25
72
|
|
|
26
73
|
band_fun <- ifelse(kind == "pp", stat_pp_band, stat_qq_band)
|
|
27
74
|
line_fun <- ifelse(kind == "pp", stat_pp_line, stat_qq_line)
|
|
28
75
|
point_fun <- ifelse(kind == "pp", stat_pp_point, stat_qq_point)
|
|
29
76
|
|
|
30
|
-
|
|
31
|
-
|
|
32
|
-
|
|
77
|
+
for (fun in names(theor_funs)) {
|
|
78
|
+
assign(fun, .eval_fun(theor_funs[[fun]]))
|
|
79
|
+
}
|
|
33
80
|
|
|
34
|
-
if (!is.null(
|
|
35
|
-
|
|
36
|
-
|
|
37
|
-
trans <- function(x) -log10(x)
|
|
81
|
+
if (!is.null(band_args) || isFALSE(band_args)) {
|
|
82
|
+
if (isTRUE(band_args$disabled)) {
|
|
83
|
+
band_args <- NULL
|
|
38
84
|
} else {
|
|
39
|
-
|
|
85
|
+
band_args$disabled <- NULL
|
|
86
|
+
band_args <- list_update(band_args, args)
|
|
87
|
+
if (band_args$distribution == "custom") {
|
|
88
|
+
band_args$dparams <- band_args$dparams %||% list()
|
|
89
|
+
band_args$dparams$values <- theor_vals
|
|
90
|
+
}
|
|
91
|
+
}
|
|
92
|
+
}
|
|
93
|
+
if (!is.null(line_args) || isFALSE(line_args)) {
|
|
94
|
+
if (isTRUE(line_args$disabled)) {
|
|
95
|
+
line_args <- NULL
|
|
96
|
+
} else {
|
|
97
|
+
line_args$disabled <- NULL
|
|
98
|
+
line_args <- list_update(line_args, args)
|
|
99
|
+
if (line_args$distribution == "custom") {
|
|
100
|
+
line_args$dparams <- line_args$dparams %||% list()
|
|
101
|
+
line_args$dparams$values <- theor_vals
|
|
102
|
+
}
|
|
103
|
+
}
|
|
104
|
+
}
|
|
105
|
+
if (!is.null(point_args) || isFALSE(point_args)) {
|
|
106
|
+
if (isTRUE(point_args$disabled)) {
|
|
107
|
+
point_args <- NULL
|
|
108
|
+
} else {
|
|
109
|
+
point_args$disabled <- NULL
|
|
110
|
+
point_args <- list_update(point_args, args)
|
|
111
|
+
if (point_args$distribution == "custom") {
|
|
112
|
+
point_args$dparams <- point_args$dparams %||% list()
|
|
113
|
+
point_args$dparams$values <- theor_vals
|
|
114
|
+
}
|
|
40
115
|
}
|
|
41
|
-
|
|
42
|
-
indata$.trans_val <- trans(indata[[val_col]])
|
|
43
|
-
val_col <- ".trans_val"
|
|
44
116
|
}
|
|
45
117
|
|
|
46
|
-
|
|
118
|
+
title <- title %||% waiver()
|
|
119
|
+
xlabel <- xlabel %||% waiver()
|
|
120
|
+
ylabel <- ylabel %||% waiver()
|
|
121
|
+
|
|
122
|
+
indata <- indata[complete.cases(indata), , drop = FALSE]
|
|
123
|
+
indata <- indata[order(indata[[val_col]]), , drop = FALSE]
|
|
47
124
|
|
|
48
125
|
p <- ggplot(data = indata, mapping = aes(sample = !!sym(val_col))) +
|
|
49
|
-
do_call(band_fun, band_args) +
|
|
50
|
-
do_call(line_fun, line_args) +
|
|
51
|
-
do_call(point_fun, point_args) +
|
|
52
126
|
labs(title = title, x = xlabel, y = ylabel)
|
|
53
127
|
|
|
128
|
+
if (!is.null(band_args)) {
|
|
129
|
+
p <- p + do_call(band_fun, band_args)
|
|
130
|
+
}
|
|
131
|
+
if (!is.null(line_args)) {
|
|
132
|
+
p <- p + do_call(line_fun, line_args)
|
|
133
|
+
}
|
|
134
|
+
if (!is.null(point_args)) {
|
|
135
|
+
p <- p + do_call(point_fun, point_args)
|
|
136
|
+
}
|
|
137
|
+
|
|
54
138
|
if (!is.null(ggs)) {
|
|
55
139
|
for (gg in ggs) {
|
|
56
140
|
p <- p + eval(parse(text = gg))
|
|
@@ -1,4 +1,4 @@
|
|
|
1
|
-
# Script for
|
|
1
|
+
# Script for regulatory.MotifAffinityTest
|
|
2
2
|
|
|
3
3
|
source("{{biopipen_dir}}/utils/misc.R")
|
|
4
4
|
library(BiocParallel)
|
|
@@ -215,12 +215,12 @@ tool <- match.arg(tool, c("motifbreakr", "atsnp"))
|
|
|
215
215
|
|
|
216
216
|
if (tool == "motifbreakr") {
|
|
217
217
|
motifbreakr_args <- {{envs.motifbreakr_args | r}}
|
|
218
|
-
{% set sourcefile = biopipen_dir | joinpaths: "scripts", "
|
|
218
|
+
{% set sourcefile = biopipen_dir | joinpaths: "scripts", "regulatory", "MotifAffinityTest_MotifBreakR.R" %}
|
|
219
219
|
# {{ sourcefile | getmtime }}
|
|
220
220
|
source("{{sourcefile}}")
|
|
221
221
|
} else { # atsnp
|
|
222
222
|
atsnp_args <- {{envs.atsnp_args | r}}
|
|
223
|
-
{% set sourcefile = biopipen_dir | joinpaths: "scripts", "
|
|
223
|
+
{% set sourcefile = biopipen_dir | joinpaths: "scripts", "regulatory", "MotifAffinityTest_AtSNP.R" %}
|
|
224
224
|
# {{ sourcefile | getmtime }}
|
|
225
225
|
source("{{sourcefile}}")
|
|
226
226
|
}
|
|
@@ -65,6 +65,19 @@ if (ncores > 1) {
|
|
|
65
65
|
log_info("- Reading Seurat object ...")
|
|
66
66
|
srtobj <- readRDS(srtfile)
|
|
67
67
|
defassay <- DefaultAssay(srtobj)
|
|
68
|
+
if (defassay == "SCT" && !"PrepSCTFindMarkers" %in% names(srtobj@commands)) {
|
|
69
|
+
log_warn(" SCTransform used but PrepSCTFindMarkers not applied, running ...")
|
|
70
|
+
|
|
71
|
+
srtobj <- PrepSCTFindMarkers(srtobj)
|
|
72
|
+
# compose a new SeuratCommand to record it to srtobj@commands
|
|
73
|
+
scommand <- srtobj@commands$FindClusters
|
|
74
|
+
scommand@name <- "PrepSCTFindMarkers"
|
|
75
|
+
scommand@time.stamp <- Sys.time()
|
|
76
|
+
scommand@assay.used <- "SCT"
|
|
77
|
+
scommand@call.string <- "PrepSCTFindMarkers(object = srtobj)"
|
|
78
|
+
scommand@params <- list()
|
|
79
|
+
srtobj@commands$PrepSCTFindMarkers <- scommand
|
|
80
|
+
}
|
|
68
81
|
|
|
69
82
|
if (!is.null(mutaters) && length(mutaters) > 0) {
|
|
70
83
|
log_info("- Mutating meta data ...")
|
|
@@ -472,33 +485,30 @@ find_markers <- function(findmarkers_args, find_all = FALSE) {
|
|
|
472
485
|
p_val_adj = numeric()
|
|
473
486
|
)
|
|
474
487
|
}
|
|
488
|
+
|
|
489
|
+
call_findmarkers <- function(fn, args) {
|
|
490
|
+
if (find_all) {
|
|
491
|
+
do_call(fn, args)
|
|
492
|
+
} else {
|
|
493
|
+
do_call(fn, args) %>% rownames_to_column("gene")
|
|
494
|
+
}
|
|
495
|
+
}
|
|
475
496
|
markers <- tryCatch({
|
|
476
|
-
|
|
497
|
+
call_findmarkers(fun, findmarkers_args)
|
|
477
498
|
}, error = function(e) {
|
|
478
|
-
|
|
479
|
-
|
|
480
|
-
if (grepl("PrepSCTFindMarkers", e$message)) {
|
|
481
|
-
log_warn(" Running PrepSCTFindMarkers ...")
|
|
482
|
-
findmarkers_args$object <<- PrepSCTFindMarkers(findmarkers_args$object)
|
|
483
|
-
tryCatch({
|
|
484
|
-
do_call(fun, findmarkers_args) %>% rownames_to_column("gene")
|
|
485
|
-
}, error = function(err) {
|
|
486
|
-
log_warn(paste0(" ", err$message))
|
|
487
|
-
empty
|
|
488
|
-
})
|
|
489
|
-
} else {
|
|
490
|
-
log_warn(paste0(" ", e$message))
|
|
491
|
-
empty
|
|
499
|
+
if (!grepl("PrepSCTFindMarkers", e$message) && defassay == "SCT") {
|
|
500
|
+
log_warn(paste0(" ! ", e$message))
|
|
492
501
|
}
|
|
502
|
+
empty
|
|
493
503
|
})
|
|
494
504
|
|
|
495
505
|
if (nrow(markers) == 0 && defassay == "SCT") {
|
|
496
|
-
log_warn(" No markers found from SCT assay, trying recorrect_umi = FALSE")
|
|
506
|
+
log_warn(" ! No markers found from SCT assay, trying recorrect_umi = FALSE")
|
|
497
507
|
findmarkers_args$recorrect_umi <- FALSE
|
|
498
508
|
markers <- tryCatch({
|
|
499
|
-
|
|
509
|
+
call_findmarkers(fun, findmarkers_args)
|
|
500
510
|
}, error = function(e) {
|
|
501
|
-
log_warn(paste0(" ", e$message))
|
|
511
|
+
log_warn(paste0(" ! ", e$message))
|
|
502
512
|
empty
|
|
503
513
|
})
|
|
504
514
|
}
|
|
@@ -202,6 +202,14 @@ if (DefaultAssay(sobj) == "SCT") {
|
|
|
202
202
|
# https://github.com/satijalab/seurat/issues/6968
|
|
203
203
|
log_info("Running PrepSCTFindMarkers ...")
|
|
204
204
|
sobj <- PrepSCTFindMarkers(sobj)
|
|
205
|
+
# compose a new SeuratCommand to record it to sobj@commands
|
|
206
|
+
scommand <- sobj@commands$FindClusters
|
|
207
|
+
scommand@name <- "PrepSCTFindMarkers"
|
|
208
|
+
scommand@time.stamp <- Sys.time()
|
|
209
|
+
scommand@assay.used <- "SCT"
|
|
210
|
+
scommand@call.string <- "PrepSCTFindMarkers(object = sobj)"
|
|
211
|
+
scommand@params <- list()
|
|
212
|
+
sobj@commands$PrepSCTFindMarkers <- scommand
|
|
205
213
|
}
|
|
206
214
|
|
|
207
215
|
log_info("Saving results ...")
|