biopipen 0.27.3__py3-none-any.whl → 0.27.5__py3-none-any.whl
This diff represents the content of publicly available package versions that have been released to one of the supported registries. The information contained in this diff is provided for informational purposes only and reflects changes between package versions as they appear in their respective public registries.
Potentially problematic release.
This version of biopipen might be problematic. Click here for more details.
- biopipen/__init__.py +1 -1
- biopipen/core/testing.py +3 -2
- biopipen/ns/delim.py +1 -1
- biopipen/ns/plot.py +36 -0
- biopipen/ns/scrna.py +18 -11
- biopipen/ns/scrna_metabolic_landscape.py +3 -3
- biopipen/ns/snp.py +65 -0
- biopipen/ns/tcr.py +6 -6
- biopipen/scripts/delim/SampleInfo.R +6 -6
- biopipen/scripts/plot/ROC.R +88 -0
- biopipen/scripts/scrna/SeuratClusterStats-features.R +1 -1
- biopipen/scripts/scrna/SeuratPreparing.R +163 -112
- biopipen/scripts/scrna/SeuratTo10X.R +25 -82
- biopipen/scripts/scrna/Subset10X.R +84 -0
- biopipen/scripts/snp/MatrixEQTL.R +157 -0
- {biopipen-0.27.3.dist-info → biopipen-0.27.5.dist-info}/METADATA +1 -2
- {biopipen-0.27.3.dist-info → biopipen-0.27.5.dist-info}/RECORD +19 -17
- biopipen/scripts/scrna/Write10X.R +0 -11
- {biopipen-0.27.3.dist-info → biopipen-0.27.5.dist-info}/WHEEL +0 -0
- {biopipen-0.27.3.dist-info → biopipen-0.27.5.dist-info}/entry_points.txt +0 -0
biopipen/__init__.py
CHANGED
|
@@ -1 +1 @@
|
|
|
1
|
-
__version__ = "0.27.
|
|
1
|
+
__version__ = "0.27.5"
|
biopipen/core/testing.py
CHANGED
|
@@ -51,15 +51,16 @@ class PipelineSucceeded:
|
|
|
51
51
|
pipen._succeeded = succeeded
|
|
52
52
|
|
|
53
53
|
|
|
54
|
-
def get_pipeline(testfile, loglevel="debug", **kwargs):
|
|
54
|
+
def get_pipeline(testfile, loglevel="debug", enable_report=False, **kwargs):
|
|
55
55
|
"""Get a pipeline for a test file"""
|
|
56
56
|
name, workdir, outdir = _get_test_dirs(testfile, False)
|
|
57
|
+
report_plugin_prefix = "+" if enable_report else "-"
|
|
57
58
|
kws = {
|
|
58
59
|
"name": name,
|
|
59
60
|
"workdir": workdir,
|
|
60
61
|
"outdir": outdir,
|
|
61
62
|
"loglevel": loglevel,
|
|
62
|
-
"plugins": [PipelineSucceeded, "
|
|
63
|
+
"plugins": [PipelineSucceeded, f"{report_plugin_prefix}report"],
|
|
63
64
|
}
|
|
64
65
|
kws.update(kwargs)
|
|
65
66
|
return Pipen(**kws)
|
biopipen/ns/delim.py
CHANGED
biopipen/ns/plot.py
CHANGED
|
@@ -114,3 +114,39 @@ class Heatmap(Proc):
|
|
|
114
114
|
"globals": "",
|
|
115
115
|
}
|
|
116
116
|
script = "file://../scripts/plot/Heatmap.R"
|
|
117
|
+
|
|
118
|
+
|
|
119
|
+
class ROC(Proc):
|
|
120
|
+
"""Plot ROC curve using [`plotROC`](https://cran.r-project.org/web/packages/plotROC/vignettes/examples.html).
|
|
121
|
+
|
|
122
|
+
Input:
|
|
123
|
+
infile: The input file for data, tab-separated.
|
|
124
|
+
The first column should be ids of the records (this is optional if `envs.noids` is True).
|
|
125
|
+
The second column should be the labels of the records (1 for positive, 0 for negative).
|
|
126
|
+
If they are not binary, you can specify the positive label by `envs.pos_label`.
|
|
127
|
+
From the third column, it should be the scores of the different models.
|
|
128
|
+
|
|
129
|
+
Output:
|
|
130
|
+
outfile: The output figure file
|
|
131
|
+
|
|
132
|
+
Envs:
|
|
133
|
+
noids: Whether the input file has ids (first column) or not.
|
|
134
|
+
pos_label: The positive label.
|
|
135
|
+
ci: Whether to use `geom_rocci()` instead of `geom_roc()`.
|
|
136
|
+
devpars: The parameters for `png()`
|
|
137
|
+
args: Additional arguments for `geom_roc()` or `geom_rocci()` if `envs.ci` is True.
|
|
138
|
+
style_roc: Arguments for `style_roc()`
|
|
139
|
+
""" # noqa: E501
|
|
140
|
+
input = "infile:file"
|
|
141
|
+
output = "outfile:file:{{in.infile | stem}}.roc.png"
|
|
142
|
+
lang = config.lang.rscript
|
|
143
|
+
envs = {
|
|
144
|
+
"noids": False,
|
|
145
|
+
"pos_label": 1,
|
|
146
|
+
"ci": False,
|
|
147
|
+
"devpars": {"res": 100, "width": 750, "height": 600},
|
|
148
|
+
"args": {"labels": False},
|
|
149
|
+
"style_roc": {},
|
|
150
|
+
"show_auc": True,
|
|
151
|
+
}
|
|
152
|
+
script = "file://../scripts/plot/ROC.R"
|
biopipen/ns/scrna.py
CHANGED
|
@@ -122,6 +122,9 @@ class SeuratPreparing(Proc):
|
|
|
122
122
|
genes.
|
|
123
123
|
///
|
|
124
124
|
|
|
125
|
+
cell_qc_per_sample (flag): Whether to perform cell QC per sample or not.
|
|
126
|
+
If `True`, the cell QC will be performed per sample, and the QC will be
|
|
127
|
+
applied to each sample before merging.
|
|
125
128
|
gene_qc (ns): Filter genes.
|
|
126
129
|
`gene_qc` is applied after `cell_qc`.
|
|
127
130
|
- min_cells: The minimum number of cells that a gene must be
|
|
@@ -222,6 +225,7 @@ class SeuratPreparing(Proc):
|
|
|
222
225
|
envs = {
|
|
223
226
|
"ncores": config.misc.ncores,
|
|
224
227
|
"cell_qc": None, # "nFeature_RNA > 200 & percent.mt < 5",
|
|
228
|
+
"cell_qc_per_sample": False,
|
|
225
229
|
"gene_qc": {"min_cells": 0, "excludes": []},
|
|
226
230
|
"use_sct": False,
|
|
227
231
|
"no_integration": False,
|
|
@@ -413,7 +417,7 @@ class SeuratClusterStats(Proc):
|
|
|
413
417
|
nCells_All = { }
|
|
414
418
|
```
|
|
415
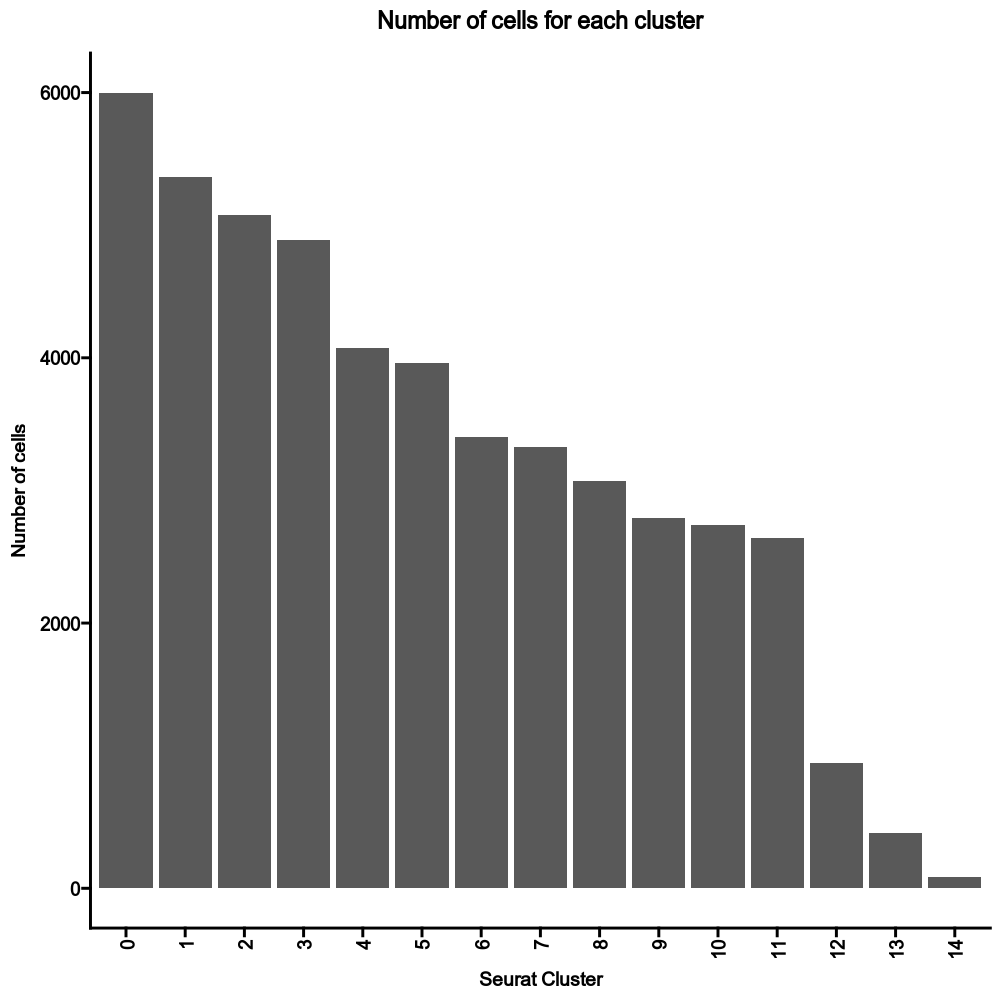
419
|
|
|
416
|
-
{: width="80%" }
|
|
420
|
+
{: width="80%" }
|
|
417
421
|
|
|
418
422
|
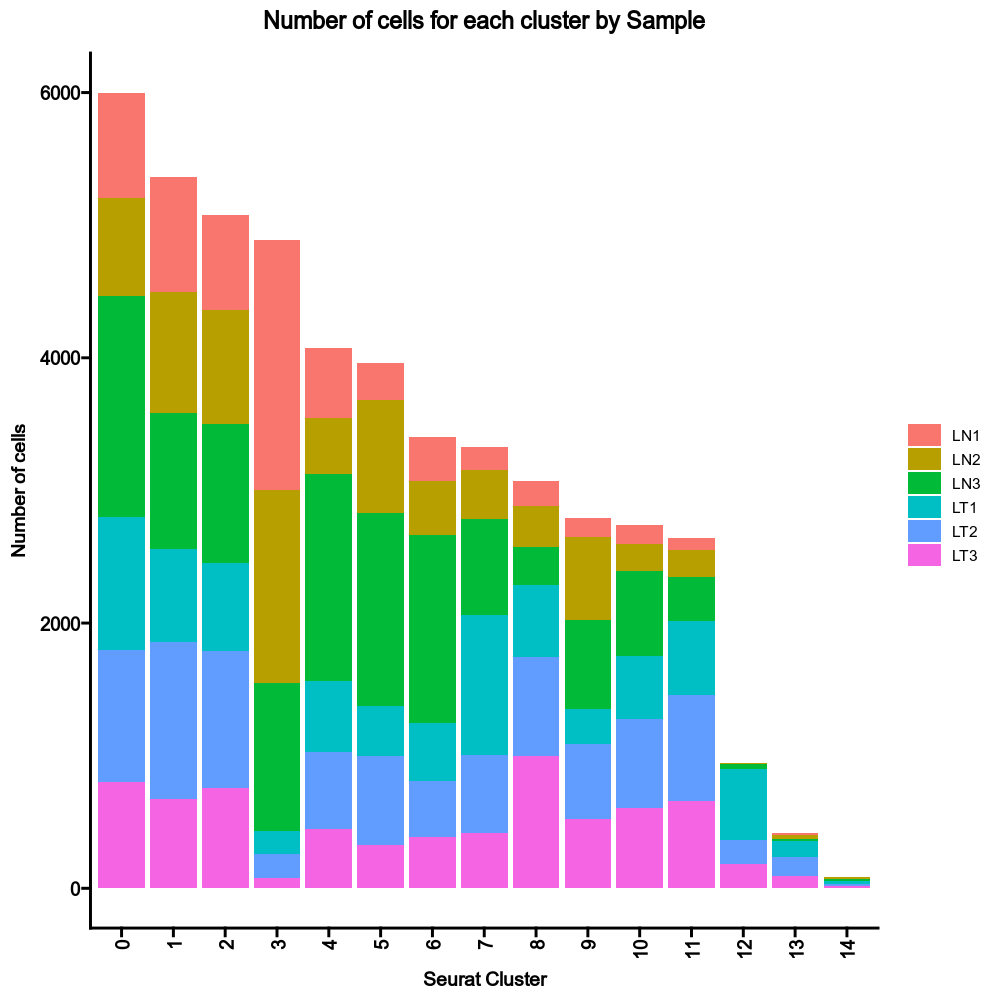
### Number of cells in each cluster by groups
|
|
419
423
|
|
|
@@ -422,7 +426,7 @@ class SeuratClusterStats(Proc):
|
|
|
422
426
|
nCells_Sample = { group-by = "Sample" }
|
|
423
427
|
```
|
|
424
428
|
|
|
425
|
-
{: width="80%" }
|
|
429
|
+
{: width="80%" }
|
|
426
430
|
|
|
427
431
|
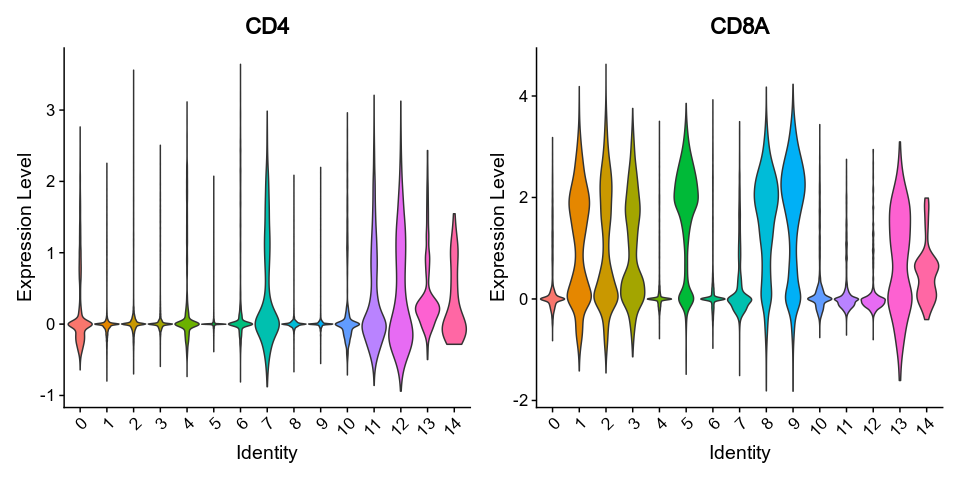
### Violin plots for the gene expressions
|
|
428
432
|
|
|
@@ -435,8 +439,8 @@ class SeuratClusterStats(Proc):
|
|
|
435
439
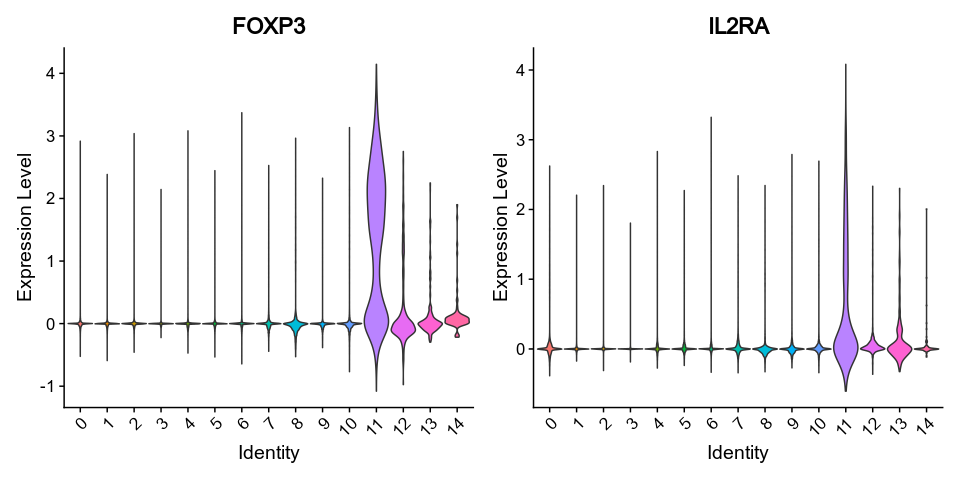
|
vlnplots_1 = { features = ["FOXP3", "IL2RA"], pt-size = 0, kind = "vln" }
|
|
436
440
|
```
|
|
437
441
|
|
|
438
|
-
{: width="80%" }
|
|
439
|
-
{: width="80%" }
|
|
442
|
+
{: width="80%" }
|
|
443
|
+
{: width="80%" }
|
|
440
444
|
|
|
441
445
|
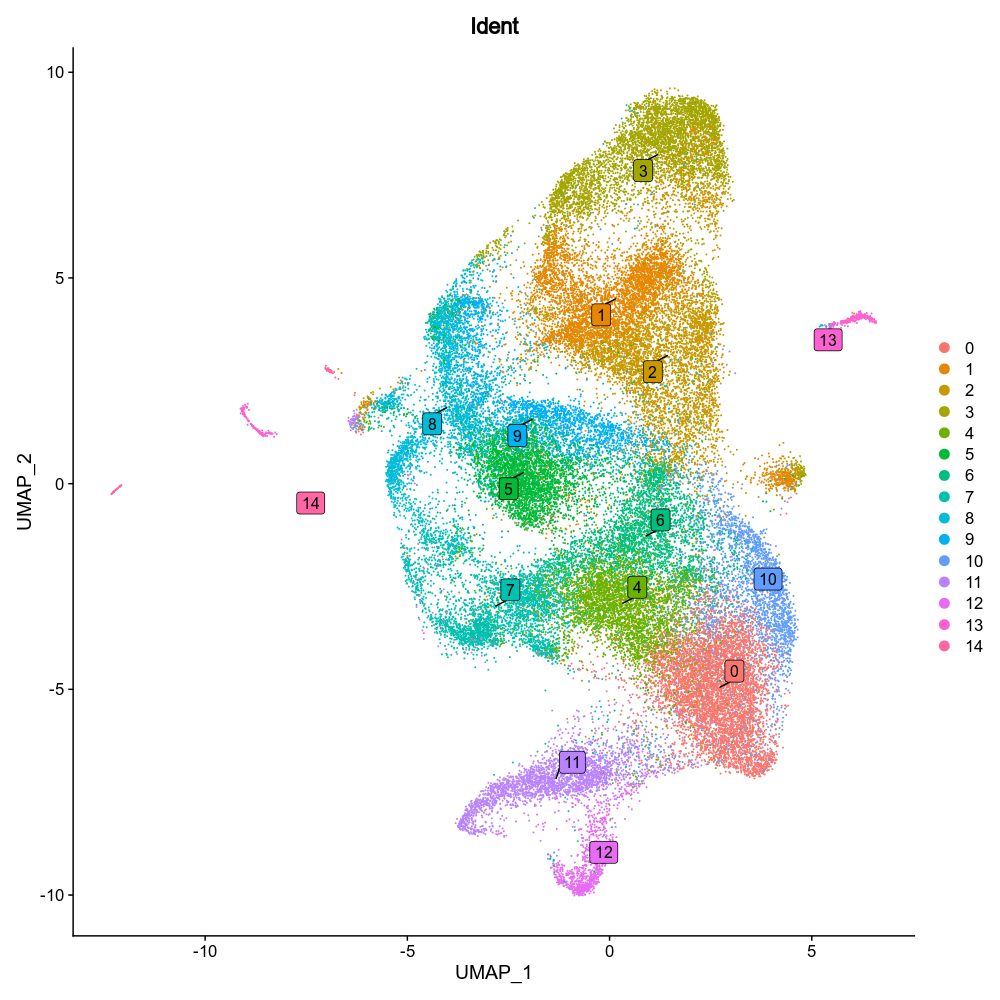
### Dimension reduction plot with labels
|
|
442
446
|
|
|
@@ -447,7 +451,7 @@ class SeuratClusterStats(Proc):
|
|
|
447
451
|
repel = true
|
|
448
452
|
```
|
|
449
453
|
|
|
450
|
-
{: width="80%" }
|
|
454
|
+
{: width="80%" }
|
|
451
455
|
|
|
452
456
|
Input:
|
|
453
457
|
srtobj: The seurat object loaded by `SeuratClustering`
|
|
@@ -857,7 +861,7 @@ class CellsDistribution(Proc):
|
|
|
857
861
|
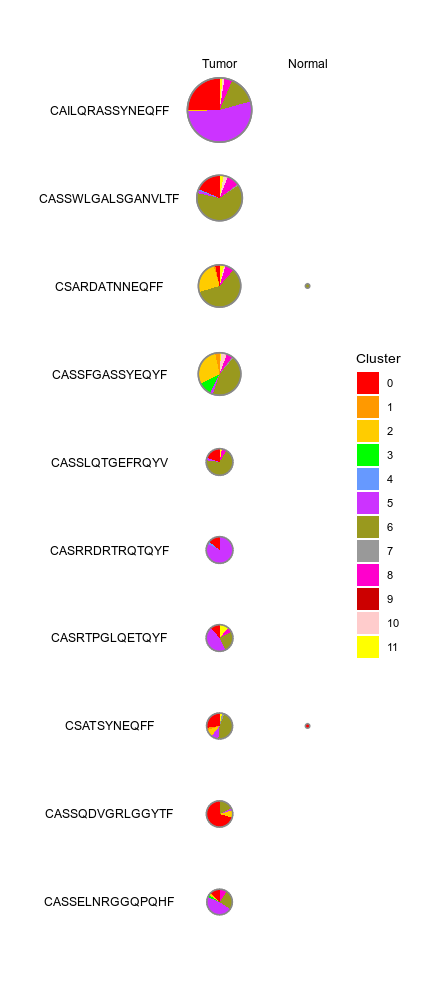
group_order = [ "Tumor", "Normal" ]
|
|
858
862
|
```
|
|
859
863
|
|
|
860
|
-

|
|
864
|
+
|
|
861
865
|
|
|
862
866
|
Input:
|
|
863
867
|
srtobj: The seurat object in RDS format
|
|
@@ -1483,14 +1487,17 @@ class SeuratTo10X(Proc):
|
|
|
1483
1487
|
srtobj: The seurat object in RDS
|
|
1484
1488
|
|
|
1485
1489
|
Output:
|
|
1486
|
-
outdir: The output directory
|
|
1490
|
+
outdir: The output directory.
|
|
1491
|
+
When `envs.split_by` is specified, the subdirectories will be
|
|
1492
|
+
created for each distinct value of the column.
|
|
1493
|
+
Otherwise, the matrices will be written to the output directory.
|
|
1487
1494
|
|
|
1488
1495
|
Envs:
|
|
1489
1496
|
version: The version of 10X format
|
|
1490
1497
|
"""
|
|
1491
1498
|
input = "srtobj:file"
|
|
1492
1499
|
output = "outdir:dir:{{in.srtobj | stem}}"
|
|
1493
|
-
envs = {"version": "3"}
|
|
1500
|
+
envs = {"version": "3", "split_by": None}
|
|
1494
1501
|
lang = config.lang.rscript
|
|
1495
1502
|
script = "file://../scripts/scrna/SeuratTo10X.R"
|
|
1496
1503
|
|
|
@@ -1870,7 +1877,7 @@ class RadarPlots(Proc):
|
|
|
1870
1877
|
|
|
1871
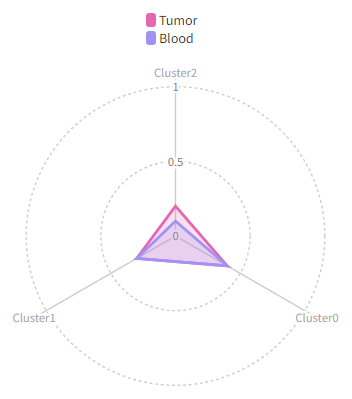
1878
|
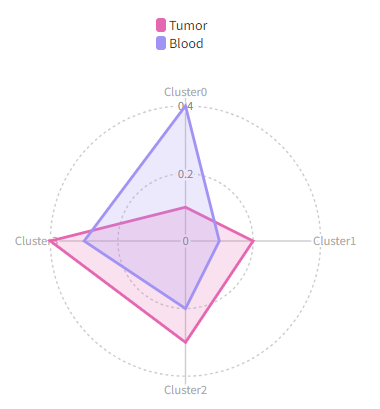
Then we will have a radar plots like this:
|
|
1872
1879
|
|
|
1873
|
-

|
|
1880
|
+
|
|
1874
1881
|
|
|
1875
1882
|
We can use `each` to separate the cells into different cases:
|
|
1876
1883
|
|
|
@@ -1882,7 +1889,7 @@ class RadarPlots(Proc):
|
|
|
1882
1889
|
|
|
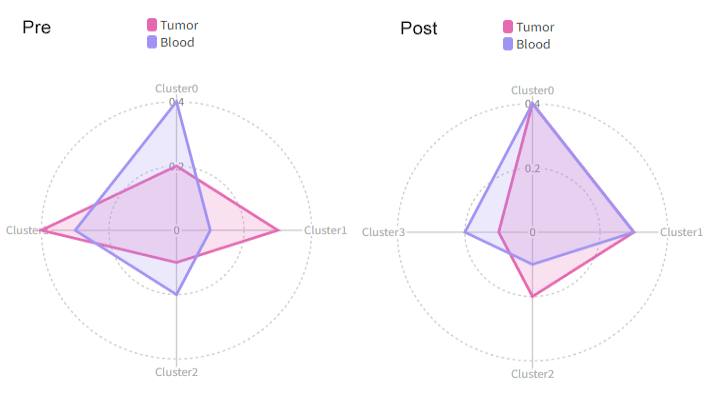
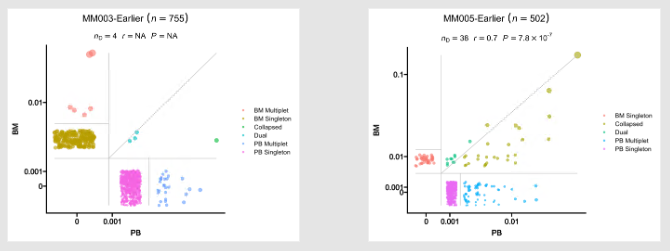
1883
1890
|
Then we will have two radar plots, one for `Pre` and one for `Post`:
|
|
1884
1891
|
|
|
1885
|
-

|
|
1892
|
+
|
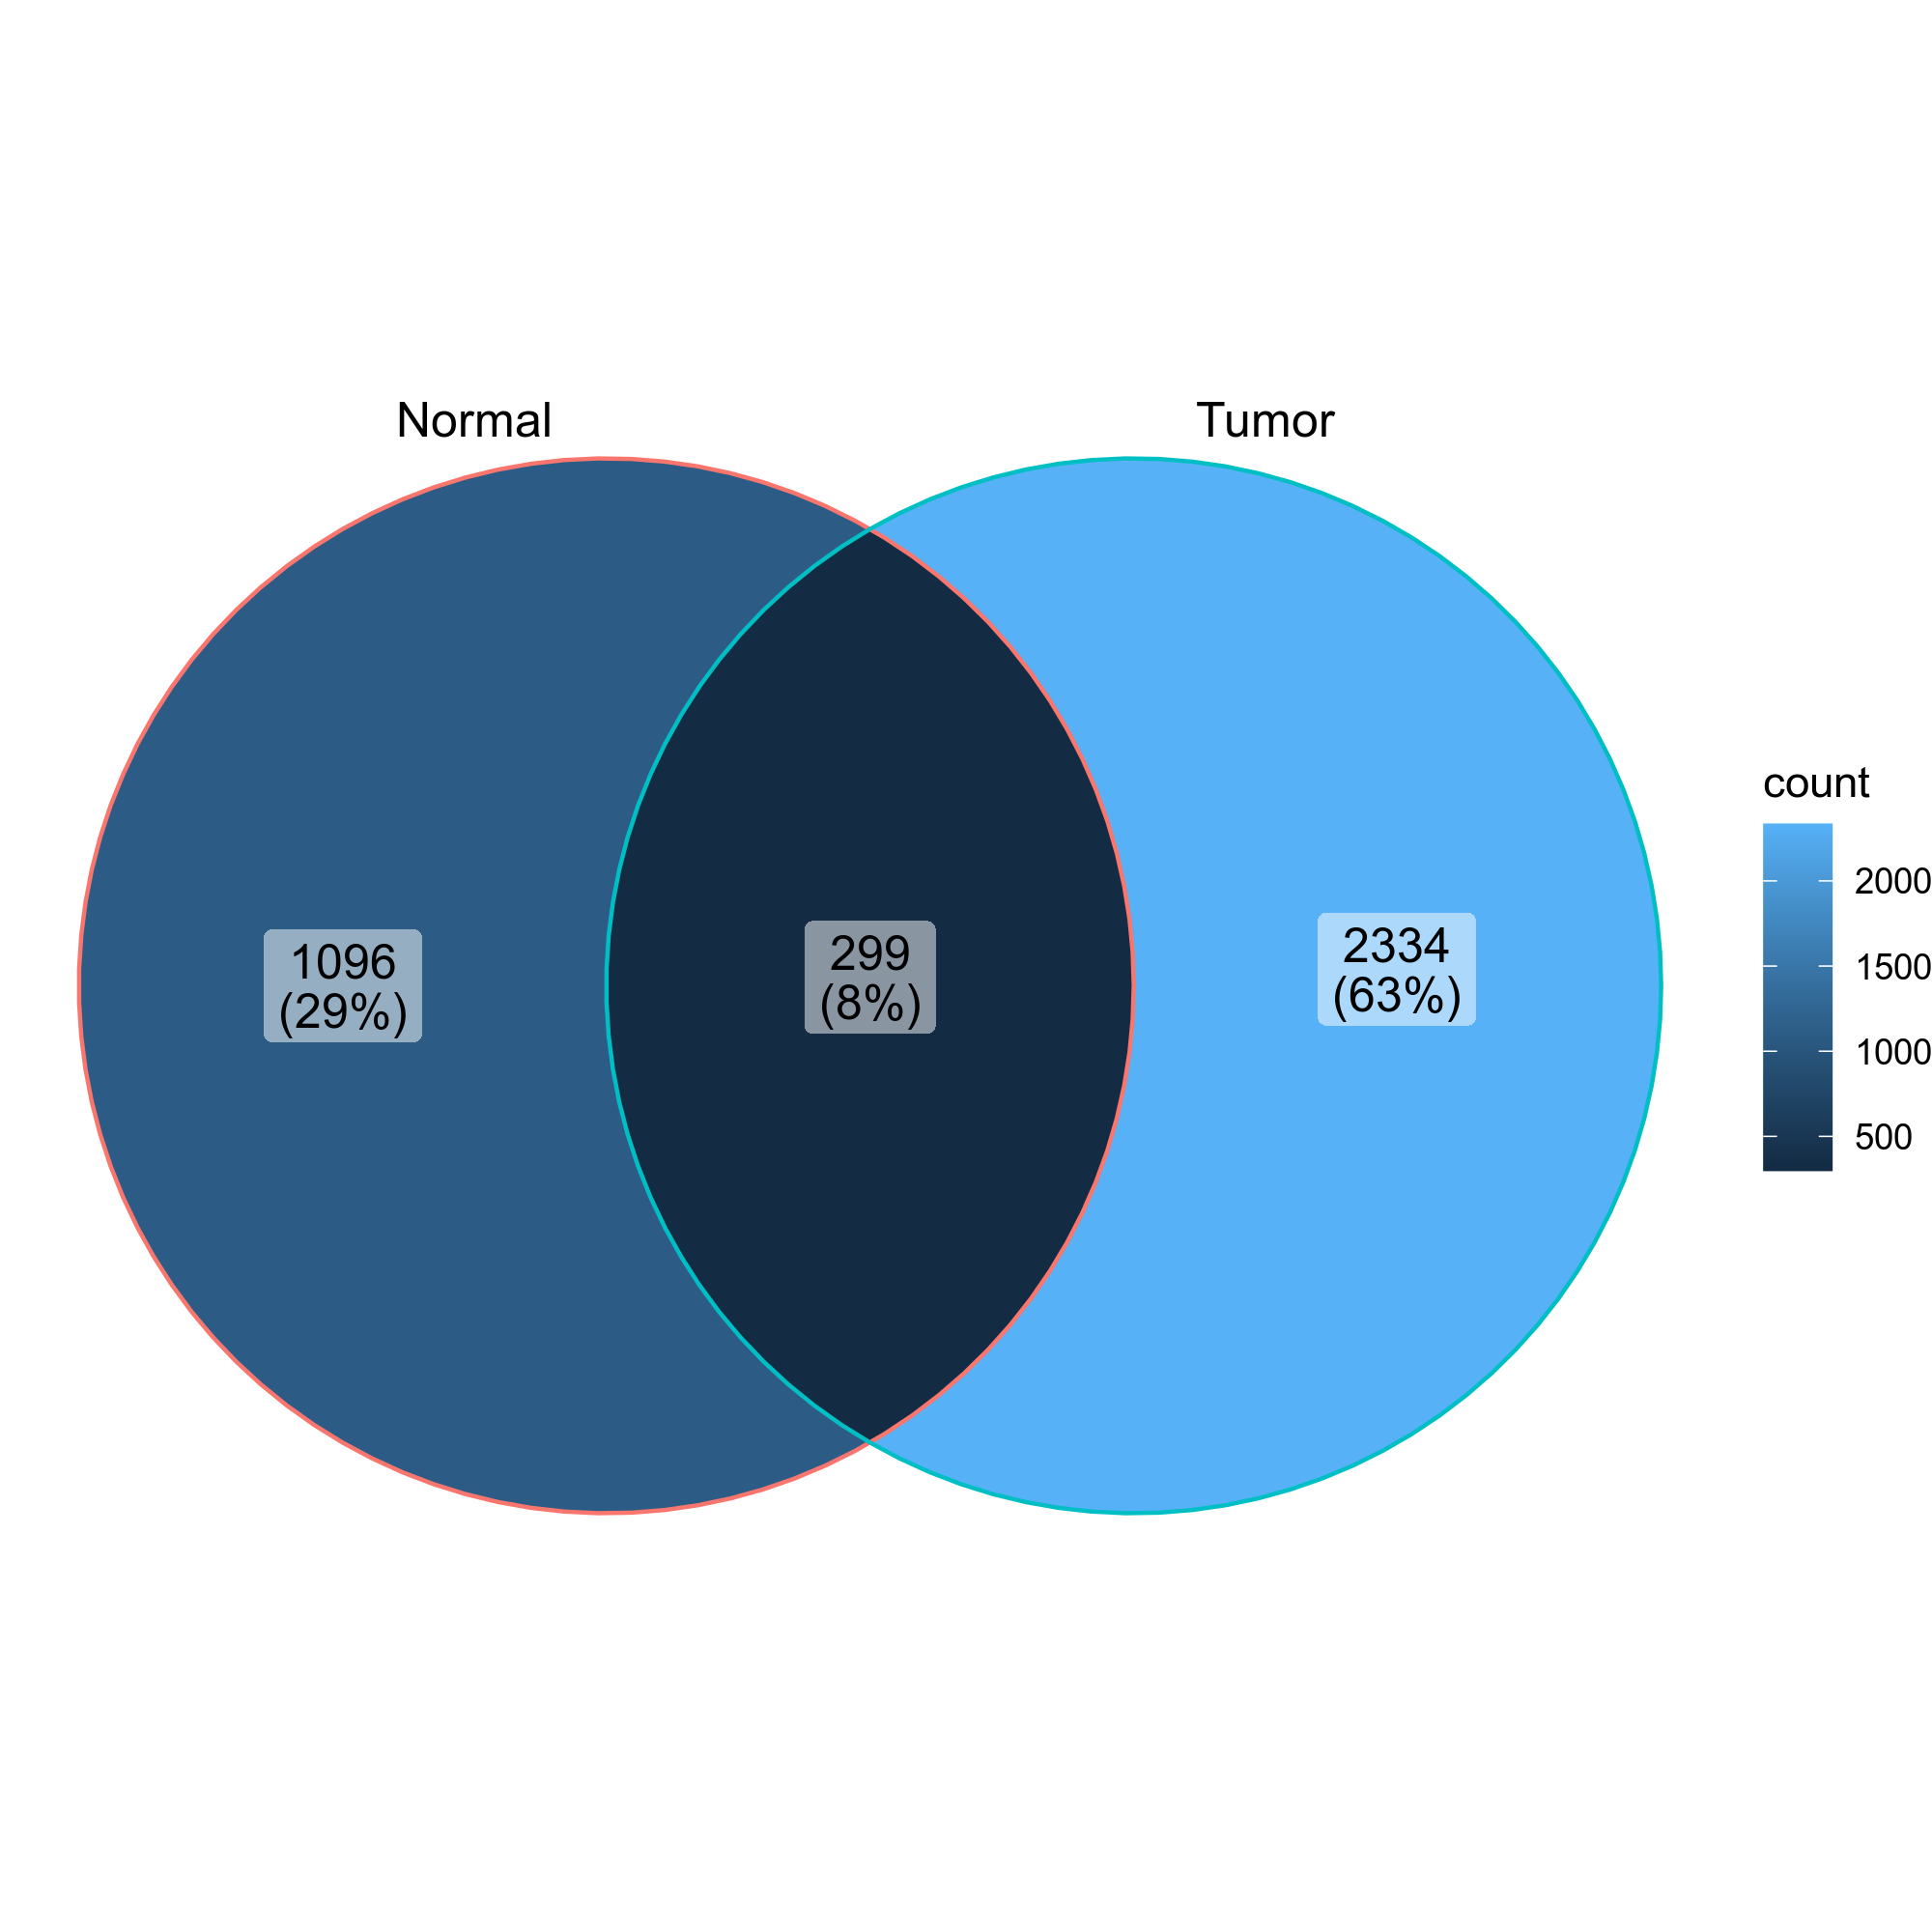
|
1886
1893
|
|
|
1887
1894
|
Using `cluster_order` to change the order of the clusters and show only the first 3 clusters:
|
|
1888
1895
|
|
|
@@ -1893,7 +1900,7 @@ class RadarPlots(Proc):
|
|
|
1893
1900
|
breaks = [0, 50, 100] # also change the breaks
|
|
1894
1901
|
```
|
|
1895
1902
|
|
|
1896
|
-

|
|
1903
|
+
|
|
1897
1904
|
|
|
1898
1905
|
|
|
1899
1906
|
/// Attention
|
|
@@ -22,11 +22,11 @@ class MetabolicPathwayActivity(Proc):
|
|
|
22
22
|
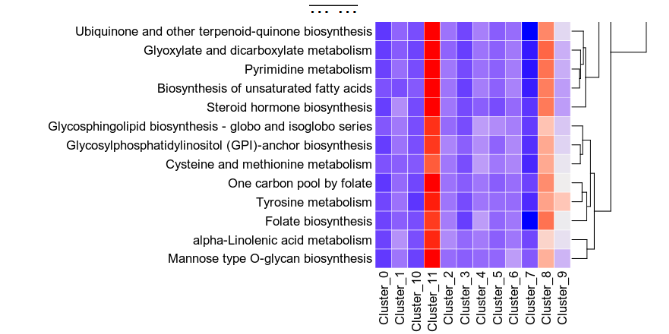
For each subset, a heatmap and a violin plot will be generated.
|
|
23
23
|
The heatmap shows the pathway activities for each group and each metabolic pathway
|
|
24
24
|
|
|
25
|
-
{: width="80%"}
|
|
25
|
+
{: width="80%"}
|
|
26
26
|
|
|
27
27
|
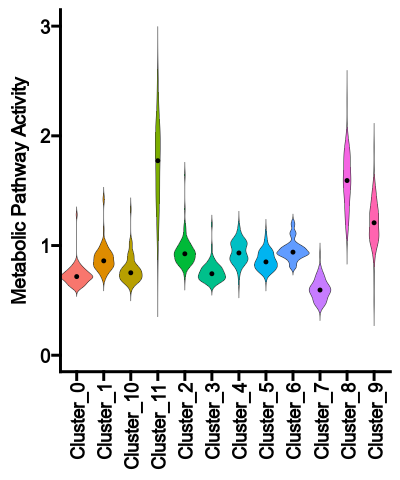
The violin plot shows the distribution of the pathway activities for each group
|
|
28
28
|
|
|
29
|
-
{: width="45%"}
|
|
29
|
+
{: width="45%"}
|
|
30
30
|
|
|
31
31
|
Envs:
|
|
32
32
|
ntimes (type=int): Number of times to do the permutation
|
|
@@ -294,7 +294,7 @@ class MetabolicPathwayHeterogeneity(Proc):
|
|
|
294
294
|
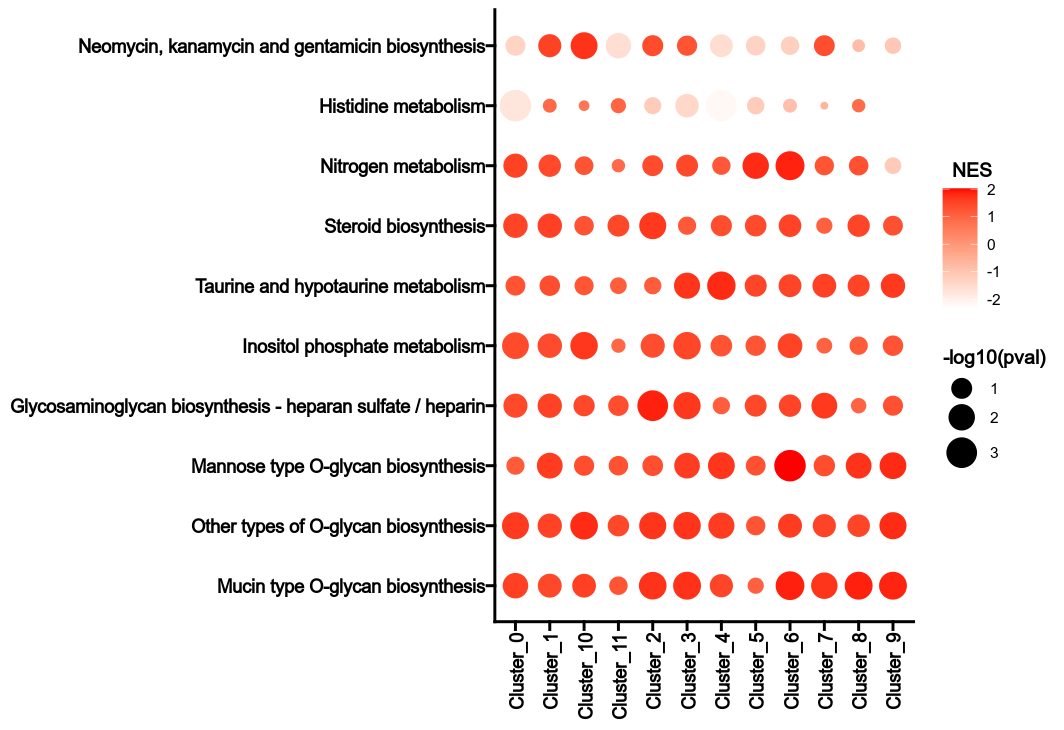
The heterogeneity can be reflected by the NES values and the p-values in
|
|
295
295
|
different groups for the metabolic pathways.
|
|
296
296
|
|
|
297
|
-

|
|
297
|
+
|
|
298
298
|
|
|
299
299
|
|
|
300
300
|
Envs:
|
biopipen/ns/snp.py
CHANGED
|
@@ -71,3 +71,68 @@ class PlinkSimulation(Proc):
|
|
|
71
71
|
"sample_prefix": None,
|
|
72
72
|
}
|
|
73
73
|
script = "file://../scripts/snp/PlinkSimulation.py"
|
|
74
|
+
|
|
75
|
+
|
|
76
|
+
class MatrixEQTL(Proc):
|
|
77
|
+
"""Run Matrix eQTL
|
|
78
|
+
|
|
79
|
+
See also <https://www.bios.unc.edu/research/genomic_software/Matrix_eQTL/>
|
|
80
|
+
|
|
81
|
+
Input:
|
|
82
|
+
geno: Genotype matrix file with rows representing SNPs and columns
|
|
83
|
+
representing samples.
|
|
84
|
+
expr: Expression matrix file with rows representing genes and columns
|
|
85
|
+
representing samples.
|
|
86
|
+
cov: Covariate matrix file with rows representing covariates and columns
|
|
87
|
+
representing samples.
|
|
88
|
+
|
|
89
|
+
Output:
|
|
90
|
+
alleqtls: Matrix eQTL output file
|
|
91
|
+
cisqtls: The cis-eQTL file if `snppos` and `genepos` are provided.
|
|
92
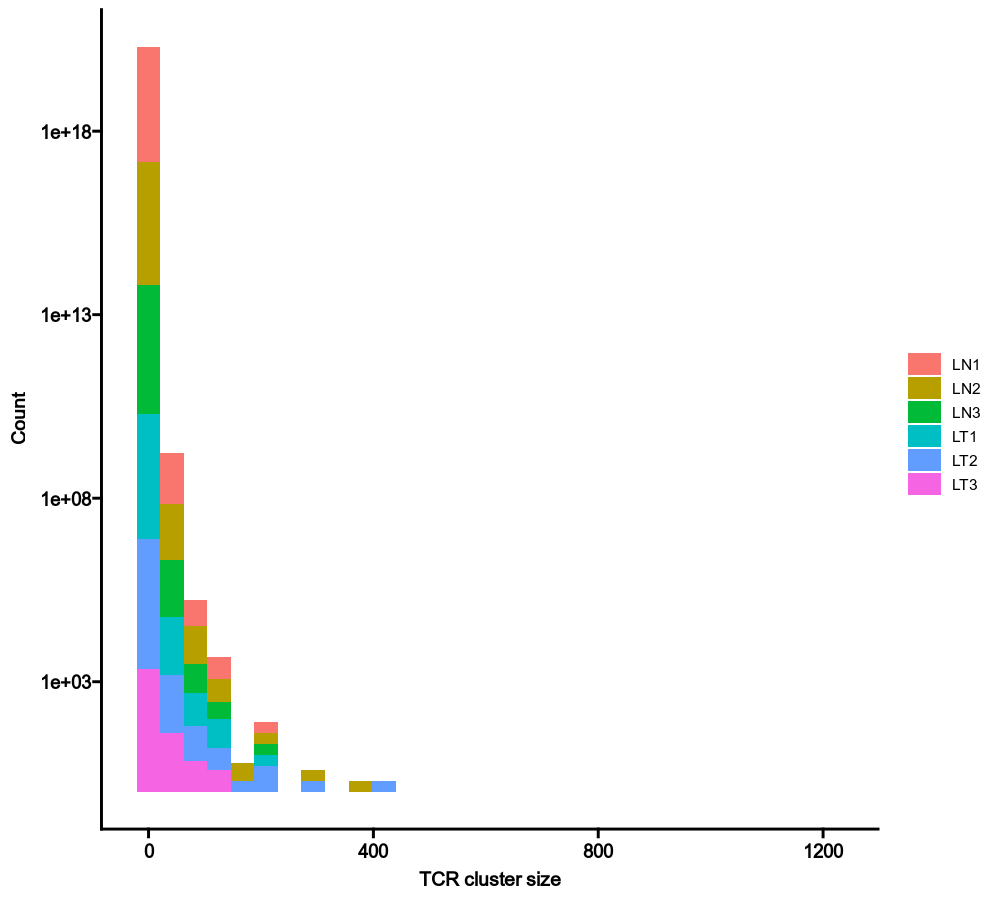
|
+
Otherwise it'll be empty.
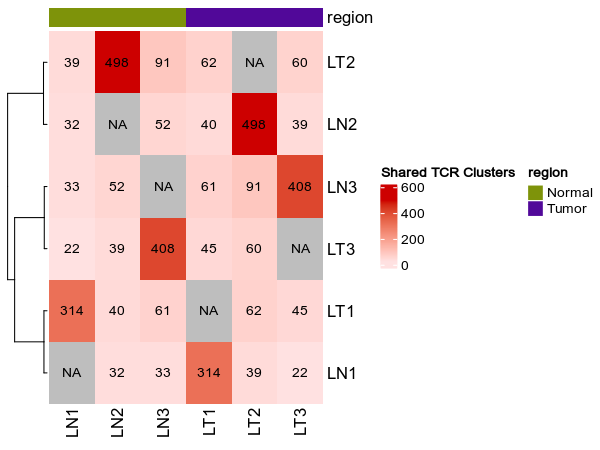
|
|
93
|
+
|
|
94
|
+
Envs:
|
|
95
|
+
model (choice): The model to use.
|
|
96
|
+
- `linear`: Linear model
|
|
97
|
+
- `modelLINEAR`: Same as `linear`
|
|
98
|
+
- `anova`: ANOVA model
|
|
99
|
+
- `modelANOVA`: Same as `anova`
|
|
100
|
+
pval (type=float): P-value threshold for eQTLs
|
|
101
|
+
transp (type=float): P-value threshold for trans-eQTLs.
|
|
102
|
+
If cis-eQTLs are not enabled (`snppos` and `genepos` are not set),
|
|
103
|
+
this defaults to 1e-5.
|
|
104
|
+
If cis-eQTLs are enabled, this defaults to `None`, which will disable
|
|
105
|
+
trans-eQTL analysis.
|
|
106
|
+
fdr (flag): Do FDR calculation or not (save memory if not).
|
|
107
|
+
snppos: The path of the SNP position file.
|
|
108
|
+
It could be a BED, GFF, VCF or a tab-delimited file with
|
|
109
|
+
`snp`, `chr`, `pos` as the first 3 columns.
|
|
110
|
+
genepos: The path of the gene position file.
|
|
111
|
+
It could be a BED or GFF file.
|
|
112
|
+
dist (type=int): Distance threshold for cis-eQTLs.
|
|
113
|
+
transpose_geno (flag): If set, the genotype matrix (`in.geno`)
|
|
114
|
+
will be transposed.
|
|
115
|
+
transpose_expr (flag): If set, the expression matrix (`in.expr`)
|
|
116
|
+
will be transposed.
|
|
117
|
+
transpose_cov (flag): If set, the covariate matrix (`in.cov`)
|
|
118
|
+
will be transposed.
|
|
119
|
+
"""
|
|
120
|
+
input = "geno:file, expr:file, cov:file"
|
|
121
|
+
output = [
|
|
122
|
+
"alleqtls:file:{{in.geno | stem}}.alleqtls.txt",
|
|
123
|
+
"cisqtls:file:{{in.geno | stem}}.cisqtls.txt",
|
|
124
|
+
]
|
|
125
|
+
lang = config.lang.rscript
|
|
126
|
+
envs = {
|
|
127
|
+
"model": "linear",
|
|
128
|
+
"pval": 1e-3,
|
|
129
|
+
"transp": None,
|
|
130
|
+
"fdr": False,
|
|
131
|
+
"snppos": None,
|
|
132
|
+
"genepos": config.ref.refgene,
|
|
133
|
+
"dist": 250000,
|
|
134
|
+
"transpose_geno": False,
|
|
135
|
+
"transpose_expr": False,
|
|
136
|
+
"transpose_cov": False,
|
|
137
|
+
}
|
|
138
|
+
script = "file://../scripts/snp/MatrixEQTL.R"
|
biopipen/ns/tcr.py
CHANGED
|
@@ -923,7 +923,7 @@ class CloneResidency(Proc):
|
|
|
923
923
|
|
|
924
924
|
- Residency plots showing the residency of clones in the two groups
|
|
925
925
|
|
|
926
|
-

|
|
926
|
+
|
|
927
927
|
|
|
928
928
|
The points in the plot are jittered to avoid overplotting. The x-axis is the residency in the first group and
|
|
929
929
|
the y-axis is the residency in the second group. The size of the points are relative to the normalized size of
|
|
@@ -943,7 +943,7 @@ class CloneResidency(Proc):
|
|
|
943
943
|
|
|
944
944
|
- Venn diagrams showing the overlap of the clones in the two groups
|
|
945
945
|
|
|
946
|
-
{: width="60%"}
|
|
946
|
+
{: width="60%"}
|
|
947
947
|
|
|
948
948
|
Input:
|
|
949
949
|
immdata: The data loaded by `immunarch::repLoad()`
|
|
@@ -1259,7 +1259,7 @@ class TCRClusterStats(Proc):
|
|
|
1259
1259
|
by = "Sample"
|
|
1260
1260
|
```
|
|
1261
1261
|
|
|
1262
|
-
{: width="80%"}
|
|
1262
|
+
{: width="80%"}
|
|
1263
1263
|
|
|
1264
1264
|
### Shared clusters
|
|
1265
1265
|
|
|
@@ -1269,7 +1269,7 @@ class TCRClusterStats(Proc):
|
|
|
1269
1269
|
heatmap_meta = ["region"]
|
|
1270
1270
|
```
|
|
1271
1271
|
|
|
1272
|
-
{: width="80%"}
|
|
1272
|
+
{: width="80%"}
|
|
1273
1273
|
|
|
1274
1274
|
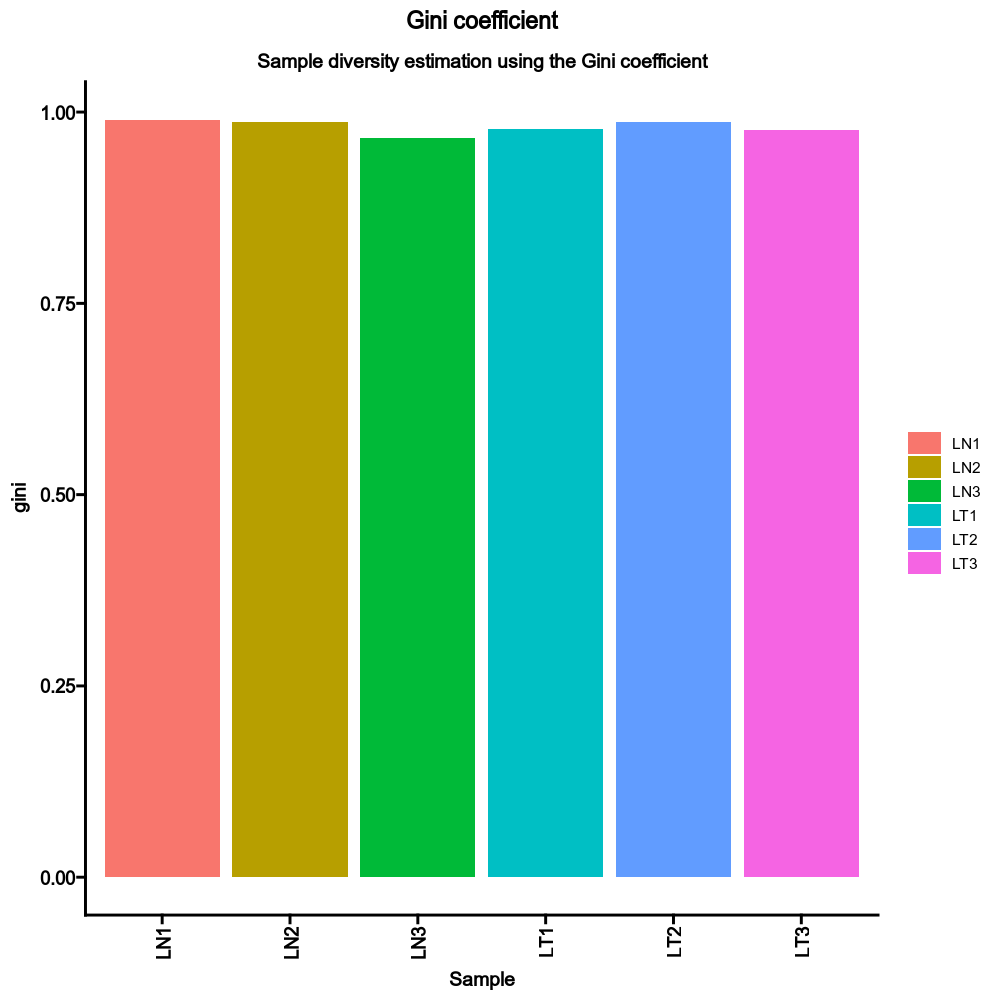
### Sample diversity
|
|
1275
1275
|
|
|
@@ -1278,11 +1278,11 @@ class TCRClusterStats(Proc):
|
|
|
1278
1278
|
method = "gini"
|
|
1279
1279
|
```
|
|
1280
1280
|
|
|
1281
|
-
{: width="80%"}
|
|
1281
|
+
{: width="80%"}
|
|
1282
1282
|
|
|
1283
1283
|
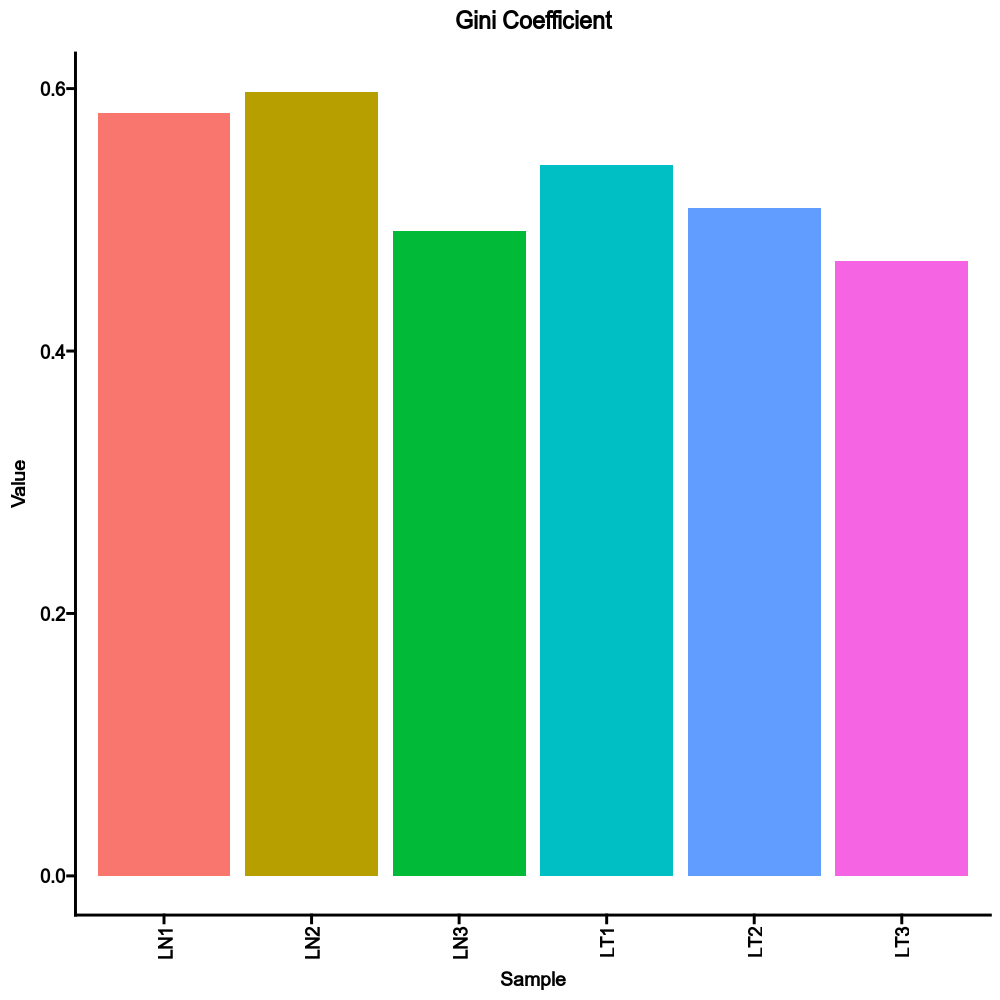
Compared to the sample diversity using TCR clones:
|
|
1284
1284
|
|
|
1285
|
-
{: width="80%"}
|
|
1285
|
+
{: width="80%"}
|
|
1286
1286
|
|
|
1287
1287
|
Input:
|
|
1288
1288
|
immfile: The immunarch object with TCR clusters attached
|
|
@@ -113,14 +113,14 @@ for (name in names(stats)) {
|
|
|
113
113
|
if (stat$plot == "boxplot" || stat$plot == "box") {
|
|
114
114
|
p <- ggplot(data, aes(x=!!group, y=!!sym(stat$on), fill=!!group)) +
|
|
115
115
|
geom_boxplot(position = "dodge") +
|
|
116
|
-
scale_fill_biopipen() +
|
|
116
|
+
scale_fill_biopipen(alpha = .6) +
|
|
117
117
|
xlab("")
|
|
118
118
|
} else if (stat$plot == "violin" ||
|
|
119
119
|
stat$plot == "violinplot" ||
|
|
120
120
|
stat$plot == "vlnplot") {
|
|
121
121
|
p <- ggplot(data, aes(x = !!group, y = !!sym(stat$on), fill=!!group)) +
|
|
122
122
|
geom_violin(position = "dodge") +
|
|
123
|
-
scale_fill_biopipen() +
|
|
123
|
+
scale_fill_biopipen(alpha = .6) +
|
|
124
124
|
xlab("")
|
|
125
125
|
} else if (
|
|
126
126
|
(grepl("violin", stat$plot) || grepl("vln", stat$plot)) &&
|
|
@@ -129,12 +129,12 @@ for (name in names(stats)) {
|
|
|
129
129
|
p <- ggplot(data, aes(x = !!group, y = !!sym(stat$on), fill = !!group)) +
|
|
130
130
|
geom_violin(position = "dodge") +
|
|
131
131
|
geom_boxplot(width = 0.1, position = position_dodge(0.9), fill="white") +
|
|
132
|
-
scale_fill_biopipen() +
|
|
132
|
+
scale_fill_biopipen(alpha = .6) +
|
|
133
133
|
xlab("")
|
|
134
134
|
} else if (stat$plot == "histogram" || stat$plot == "hist") {
|
|
135
135
|
p <- ggplot(data, aes(x = !!sym(stat$on), fill = !!group)) +
|
|
136
136
|
geom_histogram(bins = 10, position = "dodge", alpha = 0.8, color = "white") +
|
|
137
|
-
scale_fill_biopipen()
|
|
137
|
+
scale_fill_biopipen(alpha = .6)
|
|
138
138
|
} else if (stat$plot == "pie" || stat$plot == "piechart") {
|
|
139
139
|
if (is.null(stat$each)) {
|
|
140
140
|
data <- data %>% distinct(!!group, .keep_all = TRUE)
|
|
@@ -157,7 +157,7 @@ for (name in names(stats)) {
|
|
|
157
157
|
fill="#EEEEEE",
|
|
158
158
|
size=4
|
|
159
159
|
) +
|
|
160
|
-
scale_fill_biopipen(name = group) +
|
|
160
|
+
scale_fill_biopipen(alpha = .6, name = group) +
|
|
161
161
|
ggtitle(paste0("# ", stat$on))
|
|
162
162
|
} else if (stat$plot == "bar" || stat$plot == "barplot") {
|
|
163
163
|
if (is.null(stat$each)) {
|
|
@@ -169,7 +169,7 @@ for (name in names(stats)) {
|
|
|
169
169
|
data,
|
|
170
170
|
aes(x = !!group, y = !!sym(count_on), fill = !!group)) +
|
|
171
171
|
geom_bar(stat = "identity") +
|
|
172
|
-
scale_fill_biopipen() +
|
|
172
|
+
scale_fill_biopipen(alpha = .6) +
|
|
173
173
|
ylab(paste0("# ", stat$on))
|
|
174
174
|
} else {
|
|
175
175
|
stop("Unknown plot type: ", stat$plot)
|
|
@@ -0,0 +1,88 @@
|
|
|
1
|
+
|
|
2
|
+
source("{{biopipen_dir}}/utils/misc.R")
|
|
3
|
+
|
|
4
|
+
library(rlang)
|
|
5
|
+
library(ggplot2)
|
|
6
|
+
library(plotROC)
|
|
7
|
+
|
|
8
|
+
infile <- {{in.infile | r}}
|
|
9
|
+
outfile <- {{out.outfile | r}}
|
|
10
|
+
joboutdir <- {{job.outdir | r}}
|
|
11
|
+
noids <- {{envs.noids | r}}
|
|
12
|
+
pos_label <- {{envs.pos_label | r}}
|
|
13
|
+
ci <- {{envs.ci | r}}
|
|
14
|
+
devpars <- {{envs.devpars | r}}
|
|
15
|
+
show_auc <- {{envs.show_auc | r}}
|
|
16
|
+
args <- {{envs.args | r: todot="-"}}
|
|
17
|
+
style_roc_args <- {{envs.style_roc | r: todot="-"}}
|
|
18
|
+
if (!is.null(style_roc_args$theme)) {
|
|
19
|
+
style_roc_args$theme <- eval(parse(text=style_roc_args$theme))
|
|
20
|
+
}
|
|
21
|
+
|
|
22
|
+
data <- read.table(infile, header=TRUE, sep="\t", row.names = NULL, check.names = FALSE, stringsAsFactors=FALSE)
|
|
23
|
+
if (!noids) {
|
|
24
|
+
data <- data[, -1]
|
|
25
|
+
}
|
|
26
|
+
|
|
27
|
+
# Normalize the first column (labels) into 0 and 1.
|
|
28
|
+
# If they are not 0/1, use pos_label to determine the positive class.
|
|
29
|
+
label_col <- colnames(data)[1]
|
|
30
|
+
if (is.character(data[[label_col]])) {
|
|
31
|
+
data[[label_col]] <- as.numeric(data[[label_col]] == pos_label)
|
|
32
|
+
}
|
|
33
|
+
|
|
34
|
+
models <- colnames(data)[2:ncol(data)]
|
|
35
|
+
|
|
36
|
+
if (length(models) > 1) {
|
|
37
|
+
# pivot longer the models, and put the model names into the column 'model'
|
|
38
|
+
data <- melt_roc(data, label_col, colnames(data)[2:ncol(data)])
|
|
39
|
+
} else {
|
|
40
|
+
data <- data.frame(
|
|
41
|
+
D = data[[label_col]],
|
|
42
|
+
M = data[[models]],
|
|
43
|
+
name = rep(models, nrow(data))
|
|
44
|
+
)
|
|
45
|
+
}
|
|
46
|
+
|
|
47
|
+
# Plot the ROC curve
|
|
48
|
+
p <- ggplot(data, aes(d = D, m = M, color = name))
|
|
49
|
+
|
|
50
|
+
if (isTRUE(ci)) {
|
|
51
|
+
p <- p + do.call(geom_rocci, args)
|
|
52
|
+
} else {
|
|
53
|
+
p <- p + do.call(geom_roc, args)
|
|
54
|
+
}
|
|
55
|
+
|
|
56
|
+
p <- p + do.call(style_roc, style_roc_args)
|
|
57
|
+
p <- p + scale_color_biopipen()
|
|
58
|
+
|
|
59
|
+
if (length(models) > 1) {
|
|
60
|
+
p <- p + theme(legend.title = element_blank())
|
|
61
|
+
} else {
|
|
62
|
+
p <- p + theme(legend.position = "none")
|
|
63
|
+
}
|
|
64
|
+
|
|
65
|
+
aucs = calc_auc(p)
|
|
66
|
+
write.table(aucs, file=file.path(joboutdir, "aucs.tsv"), sep="\t", quote=FALSE, row.names=FALSE)
|
|
67
|
+
|
|
68
|
+
if (show_auc) {
|
|
69
|
+
aucs = split(aucs$AUC, aucs$name)
|
|
70
|
+
if (length(aucs) > 1) {
|
|
71
|
+
# Add AUC values to the legend items
|
|
72
|
+
p <- p +
|
|
73
|
+
scale_color_manual(
|
|
74
|
+
values = pal_biopipen()(length(models)),
|
|
75
|
+
labels = sapply(models, function(m) paste(m, " (AUC =", round(aucs[[m]], 2), ")")),
|
|
76
|
+
breaks = models)
|
|
77
|
+
} else {
|
|
78
|
+
p <- p +
|
|
79
|
+
geom_text(
|
|
80
|
+
x = 0.8, y = 0.2, label = paste("AUC =", round(unlist(aucs), 2)),
|
|
81
|
+
color = "black", size = 4)
|
|
82
|
+
}
|
|
83
|
+
}
|
|
84
|
+
|
|
85
|
+
devpars$filename <- outfile
|
|
86
|
+
do.call(png, devpars)
|
|
87
|
+
print(p)
|
|
88
|
+
dev.off()
|
|
@@ -81,7 +81,7 @@ do_one_features = function(name) {
|
|
|
81
81
|
if (case$kind %in% c("ridge", "ridgeplot")) {
|
|
82
82
|
case$kind = "ridge"
|
|
83
83
|
if (is.null(case$cols)) {
|
|
84
|
-
case$cols = pal_biopipen()(
|
|
84
|
+
case$cols = pal_biopipen()(n_uidents)
|
|
85
85
|
}
|
|
86
86
|
excluded_args = c(excluded_args, "split.by", "reduction")
|
|
87
87
|
fn = RidgePlot
|
|
@@ -4,6 +4,7 @@ library(Seurat)
|
|
|
4
4
|
library(future)
|
|
5
5
|
library(bracer)
|
|
6
6
|
library(ggplot2)
|
|
7
|
+
library(dplyr)
|
|
7
8
|
library(tidyseurat)
|
|
8
9
|
|
|
9
10
|
metafile = {{in.metafile | quote}}
|
|
@@ -49,6 +50,19 @@ if (!"RNAData" %in% meta_cols) {
|
|
|
49
50
|
stop("Error: Column `RNAData` is not found in metafile.")
|
|
50
51
|
}
|
|
51
52
|
|
|
53
|
+
samples = as.character(metadata$Sample)
|
|
54
|
+
|
|
55
|
+
# used for plotting
|
|
56
|
+
cell_qc_df = NULL
|
|
57
|
+
|
|
58
|
+
plotsdir = file.path(joboutdir, "plots")
|
|
59
|
+
dir.create(plotsdir, showWarnings = FALSE, recursive = TRUE)
|
|
60
|
+
|
|
61
|
+
# features for cell QC
|
|
62
|
+
feats = c(
|
|
63
|
+
"nFeature_RNA", "nCount_RNA",
|
|
64
|
+
"percent.mt", "percent.ribo", "percent.hb", "percent.plat"
|
|
65
|
+
)
|
|
52
66
|
|
|
53
67
|
rename_files = function(e, sample, path) {
|
|
54
68
|
tmpdatadir = file.path(joboutdir, "renamed", sample)
|
|
@@ -74,6 +88,143 @@ rename_files = function(e, sample, path) {
|
|
|
74
88
|
Read10X(data.dir = tmpdatadir)
|
|
75
89
|
}
|
|
76
90
|
|
|
91
|
+
|
|
92
|
+
perform_cell_qc <- function(sobj, per_sample = FALSE) {
|
|
93
|
+
log_prefix = ifelse(per_sample, " ", "- ")
|
|
94
|
+
log_info("{log_prefix}Adding metadata for QC ...")
|
|
95
|
+
sobj$percent.mt = PercentageFeatureSet(sobj, pattern = "^MT-")
|
|
96
|
+
sobj$percent.ribo = PercentageFeatureSet(sobj, pattern = "^RP[SL]")
|
|
97
|
+
sobj$percent.hb = PercentageFeatureSet(sobj, pattern = "^HB[^(P)]")
|
|
98
|
+
sobj$percent.plat = PercentageFeatureSet(sobj, pattern = "PECAM1|PF4")
|
|
99
|
+
|
|
100
|
+
if (is.null(envs$cell_qc) || length(envs$cell_qc) == 0) {
|
|
101
|
+
log_warn("{log_prefix}No cell QC criteria is provided. All cells will be kept.")
|
|
102
|
+
cell_qc = "TRUE"
|
|
103
|
+
} else {
|
|
104
|
+
cell_qc = envs$cell_qc
|
|
105
|
+
}
|
|
106
|
+
|
|
107
|
+
sobj = sobj %>% mutate(.QC = !!rlang::parse_expr(cell_qc))
|
|
108
|
+
|
|
109
|
+
if (is.null(cell_qc_df)) {
|
|
110
|
+
cell_qc_df <<- sobj@meta.data[, c("Sample", ".QC", feats), drop = FALSE]
|
|
111
|
+
} else {
|
|
112
|
+
cell_qc_df <<- rbind(cell_qc_df, sobj@meta.data[, c("Sample", ".QC", feats), drop = FALSE])
|
|
113
|
+
}
|
|
114
|
+
|
|
115
|
+
# Do the filtering
|
|
116
|
+
log_info("{log_prefix}Filtering cells using QC criteria ...")
|
|
117
|
+
sobj = sobj %>% filter(.QC)
|
|
118
|
+
sobj$.QC = NULL
|
|
119
|
+
|
|
120
|
+
return(sobj)
|
|
121
|
+
}
|
|
122
|
+
|
|
123
|
+
report_cell_qc = function(ngenes) {
|
|
124
|
+
# uses cell_qc_df
|
|
125
|
+
|
|
126
|
+
# Violin plots
|
|
127
|
+
log_info("- Plotting violin plots ...")
|
|
128
|
+
add_report(
|
|
129
|
+
list(
|
|
130
|
+
kind = "descr",
|
|
131
|
+
content = paste(
|
|
132
|
+
"The violin plots for each feature. The cells are grouped by sample.",
|
|
133
|
+
"The cells that fail the QC criteria are colored in red, and",
|
|
134
|
+
"the cells that pass the QC criteria are colored in black.",
|
|
135
|
+
"The cells that fail the QC criteria are filtered out in the returned Seurat object."
|
|
136
|
+
)
|
|
137
|
+
),
|
|
138
|
+
h1 = "Violin Plots"
|
|
139
|
+
)
|
|
140
|
+
for (feat in feats) {
|
|
141
|
+
log_info(" For feature: {feat}")
|
|
142
|
+
vln_p <- ggplot(cell_qc_df, aes(x = Sample, y = !!sym(feat), color = .QC)) +
|
|
143
|
+
geom_violin(fill = "white", width = 0.5) +
|
|
144
|
+
geom_jitter(width = 0.2, height = 0, alpha = 0.5) +
|
|
145
|
+
scale_color_manual(values = c("#181818", pal_biopipen()(1)), breaks = c(TRUE, FALSE)) +
|
|
146
|
+
labs(x = "Sample", y = feat) +
|
|
147
|
+
theme_minimal()
|
|
148
|
+
|
|
149
|
+
vlnplot = file.path(plotsdir, paste0(slugify(feat), ".vln.png"))
|
|
150
|
+
png(
|
|
151
|
+
vlnplot,
|
|
152
|
+
width = 800 + length(samples) * 15, height = 600, res = 100
|
|
153
|
+
)
|
|
154
|
+
print(vln_p)
|
|
155
|
+
dev.off()
|
|
156
|
+
|
|
157
|
+
add_report(
|
|
158
|
+
list(
|
|
159
|
+
src = vlnplot,
|
|
160
|
+
name = feat,
|
|
161
|
+
descr = paste0("Distribution of ", feat, " for each sample.")
|
|
162
|
+
),
|
|
163
|
+
h1 = "Violin Plots",
|
|
164
|
+
ui = "table_of_images"
|
|
165
|
+
)
|
|
166
|
+
}
|
|
167
|
+
|
|
168
|
+
# Scatter plots against nCount_RNA
|
|
169
|
+
log_info("- Plotting scatter plots ...")
|
|
170
|
+
add_report(
|
|
171
|
+
list(
|
|
172
|
+
kind = "descr",
|
|
173
|
+
content = paste(
|
|
174
|
+
"The scatter plots for each feature against nCount_RNA. ",
|
|
175
|
+
"The cells that fail the QC criteria are colored in red, and",
|
|
176
|
+
"the cells that pass the QC criteria are colored in black.",
|
|
177
|
+
"The cells that fail the QC criteria are filtered out in the returned Seurat object."
|
|
178
|
+
)
|
|
179
|
+
),
|
|
180
|
+
h1 = "Scatter Plots"
|
|
181
|
+
)
|
|
182
|
+
for (feat in setdiff(feats, "nCount_RNA")) {
|
|
183
|
+
log_info(" For feature: {feat}, against nCount_RNA")
|
|
184
|
+
scat_p <- ggplot(cell_qc_df, aes(x = nCount_RNA, y = !!sym(feat), color = .QC)) +
|
|
185
|
+
geom_point() +
|
|
186
|
+
scale_color_manual(values = c("#181818", pal_biopipen()(1)), breaks = c(TRUE, FALSE)) +
|
|
187
|
+
labs(x = "nCount_RNA", y = feat) +
|
|
188
|
+
theme_minimal()
|
|
189
|
+
|
|
190
|
+
scatfile = file.path(plotsdir, paste0(slugify(feat), "-nCount_RNA.scatter.png"))
|
|
191
|
+
png(scatfile, width = 800, height = 600, res = 100)
|
|
192
|
+
print(scat_p)
|
|
193
|
+
dev.off()
|
|
194
|
+
|
|
195
|
+
add_report(
|
|
196
|
+
list(
|
|
197
|
+
src = scatfile,
|
|
198
|
+
name = paste0(feat, " vs nCount_RNA"),
|
|
199
|
+
descr = paste0("Scatter plot for ", feat, " against nCount_RNA")
|
|
200
|
+
),
|
|
201
|
+
h1 = "Scatter Plots",
|
|
202
|
+
ui = "table_of_images"
|
|
203
|
+
)
|
|
204
|
+
}
|
|
205
|
+
|
|
206
|
+
# return the dim_df calculated from the cell_qc_df
|
|
207
|
+
rbind(
|
|
208
|
+
cell_qc_df %>%
|
|
209
|
+
# group_by(Sample) %>%
|
|
210
|
+
summarise(
|
|
211
|
+
when = "Before_Cell_QC",
|
|
212
|
+
nCells = dplyr::n(),
|
|
213
|
+
nGenes = ngenes
|
|
214
|
+
) %>%
|
|
215
|
+
ungroup(),
|
|
216
|
+
cell_qc_df %>%
|
|
217
|
+
filter(.QC) %>%
|
|
218
|
+
# group_by(Sample) %>%
|
|
219
|
+
summarise(
|
|
220
|
+
when = "After_Cell_QC",
|
|
221
|
+
nCells = dplyr::n(),
|
|
222
|
+
nGenes = ngenes
|
|
223
|
+
) %>%
|
|
224
|
+
ungroup()
|
|
225
|
+
)
|
|
226
|
+
}
|
|
227
|
+
|
|
77
228
|
load_sample = function(sample) {
|
|
78
229
|
log_info("- Loading sample: {sample} ...")
|
|
79
230
|
mdata = as.data.frame(metadata)[metadata$Sample == sample, , drop=TRUE]
|
|
@@ -114,6 +265,11 @@ load_sample = function(sample) {
|
|
|
114
265
|
obj[[mname]] = mdt
|
|
115
266
|
}
|
|
116
267
|
|
|
268
|
+
if (isTRUE(envs$cell_qc_per_sample)) {
|
|
269
|
+
log_info("- Perform cell QC for sample: {sample} ...")
|
|
270
|
+
obj = perform_cell_qc(obj, TRUE)
|
|
271
|
+
}
|
|
272
|
+
|
|
117
273
|
if (isTRUE(envs$use_sct)) {
|
|
118
274
|
# so that we have data and scale.data layers on RNA assay
|
|
119
275
|
# useful for visualization in case some genes are not in
|
|
@@ -126,125 +282,20 @@ load_sample = function(sample) {
|
|
|
126
282
|
}
|
|
127
283
|
|
|
128
284
|
# Load data
|
|
129
|
-
samples = as.character(metadata$Sample)
|
|
130
|
-
|
|
131
285
|
log_info("Reading samples individually ...")
|
|
132
286
|
obj_list = lapply(samples, load_sample)
|
|
133
287
|
|
|
134
288
|
log_info("Merging samples ...")
|
|
135
289
|
sobj = Reduce(merge, obj_list)
|
|
136
290
|
|
|
137
|
-
|
|
138
|
-
|
|
139
|
-
sobj
|
|
140
|
-
sobj$percent.hb = PercentageFeatureSet(sobj, pattern = "^HB[^(P)]")
|
|
141
|
-
sobj$percent.plat = PercentageFeatureSet(sobj, pattern = "PECAM1|PF4")
|
|
142
|
-
|
|
143
|
-
dim_df = data.frame(When = "Before_QC", nCells = ncol(sobj), nGenes = nrow(sobj))
|
|
144
|
-
|
|
145
|
-
if (is.null(envs$cell_qc) || length(envs$cell_qc) == 0) {
|
|
146
|
-
log_warn("No cell QC criteria is provided. All cells will be kept.")
|
|
147
|
-
envs$cell_qc = "TRUE"
|
|
148
|
-
}
|
|
149
|
-
|
|
150
|
-
sobj = sobj %>% mutate(.QC = !!rlang::parse_expr(envs$cell_qc))
|
|
151
|
-
feats = c("nFeature_RNA", "nCount_RNA", "percent.mt", "percent.ribo", "percent.hb", "percent.plat")
|
|
152
|
-
plotsdir = file.path(joboutdir, "plots")
|
|
153
|
-
dir.create(plotsdir, showWarnings = FALSE)
|
|
154
|
-
|
|
155
|
-
# Violin plots
|
|
156
|
-
log_info("Plotting violin plots ...")
|
|
157
|
-
add_report(
|
|
158
|
-
list(
|
|
159
|
-
kind = "descr",
|
|
160
|
-
content = paste(
|
|
161
|
-
"The violin plots for each feature. The cells are grouped by sample.",
|
|
162
|
-
"The cells that fail the QC criteria are colored in red, and",
|
|
163
|
-
"the cells that pass the QC criteria are colored in black.",
|
|
164
|
-
"The cells that fail the QC criteria are filtered out in the returned Seurat object."
|
|
165
|
-
)
|
|
166
|
-
),
|
|
167
|
-
h1 = "Violin Plots"
|
|
168
|
-
)
|
|
169
|
-
for (feat in feats) {
|
|
170
|
-
log_info("- For feature: {feat}")
|
|
171
|
-
vln_p = VlnPlot(
|
|
172
|
-
sobj,
|
|
173
|
-
cols = rep("white", length(samples)),
|
|
174
|
-
group.by = "Sample",
|
|
175
|
-
features = feat,
|
|
176
|
-
pt.size = 0) + NoLegend()
|
|
177
|
-
vln_p$data$.QC = sobj@meta.data$.QC
|
|
178
|
-
vln_p = vln_p + geom_jitter(
|
|
179
|
-
aes(color = .QC),
|
|
180
|
-
data = vln_p$data,
|
|
181
|
-
position = position_jitterdodge(jitter.width = 0.4, dodge.width = 0.9)
|
|
182
|
-
) + scale_color_manual(values = c("#181818", pal_biopipen()(1)), breaks = c(TRUE, FALSE))
|
|
183
|
-
|
|
184
|
-
vlnplot = file.path(plotsdir, paste0(slugify(feat), ".vln.png"))
|
|
185
|
-
png(
|
|
186
|
-
vlnplot,
|
|
187
|
-
width = 800 + length(samples) * 15, height = 600, res = 100
|
|
188
|
-
)
|
|
189
|
-
print(vln_p)
|
|
190
|
-
dev.off()
|
|
191
|
-
|
|
192
|
-
add_report(
|
|
193
|
-
list(
|
|
194
|
-
src = vlnplot,
|
|
195
|
-
name = feat,
|
|
196
|
-
descr = paste0("Distribution of ", feat, " for each sample.")
|
|
197
|
-
),
|
|
198
|
-
h1 = "Violin Plots",
|
|
199
|
-
ui = "table_of_images"
|
|
200
|
-
)
|
|
201
|
-
}
|
|
202
|
-
|
|
203
|
-
# Scatter plots against nCount_RNA
|
|
204
|
-
log_info("Plotting scatter plots ...")
|
|
205
|
-
add_report(
|
|
206
|
-
list(
|
|
207
|
-
kind = "descr",
|
|
208
|
-
content = paste(
|
|
209
|
-
"The scatter plots for each feature against nCount_RNA. ",
|
|
210
|
-
"The cells that fail the QC criteria are colored in red, and",
|
|
211
|
-
"the cells that pass the QC criteria are colored in black.",
|
|
212
|
-
"The cells that fail the QC criteria are filtered out in the returned Seurat object."
|
|
213
|
-
)
|
|
214
|
-
),
|
|
215
|
-
h1 = "Scatter Plots"
|
|
216
|
-
)
|
|
217
|
-
for (feat in setdiff(feats, "nCount_RNA")) {
|
|
218
|
-
log_info("- For feature: {feat}, against nCount_RNA")
|
|
219
|
-
scat_p = FeatureScatter(
|
|
220
|
-
sobj,
|
|
221
|
-
feature1 = "nCount_RNA",
|
|
222
|
-
feature2 = feat,
|
|
223
|
-
group.by = ".QC"
|
|
224
|
-
) +
|
|
225
|
-
NoLegend() +
|
|
226
|
-
scale_color_manual(values = c("#181818", pal_biopipen()(1)), breaks = c(TRUE, FALSE))
|
|
227
|
-
|
|
228
|
-
scatfile = file.path(plotsdir, paste0(slugify(feat), "-nCount_RNA.scatter.png"))
|
|
229
|
-
png(scatfile, width = 800, height = 600, res = 100)
|
|
230
|
-
print(scat_p)
|
|
231
|
-
dev.off()
|
|
232
|
-
|
|
233
|
-
add_report(
|
|
234
|
-
list(
|
|
235
|
-
src = scatfile,
|
|
236
|
-
name = paste0(feat, " vs nCount_RNA"),
|
|
237
|
-
descr = paste0("Scatter plot for ", feat, " against nCount_RNA")
|
|
238
|
-
),
|
|
239
|
-
h1 = "Scatter Plots",
|
|
240
|
-
ui = "table_of_images"
|
|
241
|
-
)
|
|
291
|
+
if (!envs$cell_qc_per_sample) {
|
|
292
|
+
log_info("Performing cell QC ...")
|
|
293
|
+
sobj = perform_cell_qc(sobj)
|
|
242
294
|
}
|
|
243
295
|
|
|
244
|
-
#
|
|
245
|
-
log_info("
|
|
246
|
-
|
|
247
|
-
sobj$.QC = NULL
|
|
296
|
+
# plot and report the QC
|
|
297
|
+
log_info("Plotting and reporting QC ...")
|
|
298
|
+
dim_df = report_cell_qc(nrow(sobj))
|
|
248
299
|
|
|
249
300
|
log_info("Filtering genes ...")
|
|
250
301
|
if (is.list(envs$gene_qc)) {
|
|
@@ -271,7 +322,7 @@ if (is.list(envs$gene_qc)) {
|
|
|
271
322
|
dim_df = rbind(
|
|
272
323
|
dim_df,
|
|
273
324
|
data.frame(
|
|
274
|
-
|
|
325
|
+
when = "After_Gene_QC",
|
|
275
326
|
nCells = ncol(sobj),
|
|
276
327
|
nGenes = nrow(sobj)
|
|
277
328
|
)
|
|
@@ -1,84 +1,27 @@
|
|
|
1
|
-
library(
|
|
2
|
-
|
|
3
|
-
|
|
4
|
-
|
|
5
|
-
|
|
6
|
-
|
|
7
|
-
|
|
8
|
-
|
|
9
|
-
|
|
10
|
-
|
|
11
|
-
|
|
12
|
-
|
|
13
|
-
|
|
14
|
-
|
|
15
|
-
|
|
16
|
-
|
|
17
|
-
|
|
18
|
-
|
|
19
|
-
)
|
|
20
|
-
|
|
21
|
-
|
|
22
|
-
|
|
23
|
-
}
|
|
24
|
-
if (length(mtx_file) > 1) {
|
|
25
|
-
warning(paste("Multiple matrix files found in", indir, ", using the first one."))
|
|
26
|
-
}
|
|
27
|
-
if (length(feat_file) == 0) {
|
|
28
|
-
stop("No feature file found in", indir)
|
|
29
|
-
}
|
|
30
|
-
if (length(feat_file) > 1) {
|
|
31
|
-
warning(paste("Multiple feature files found in", indir, ", using the first one."))
|
|
32
|
-
}
|
|
33
|
-
if (length(barcode_file) == 0) {
|
|
34
|
-
stop("No barcode file found in", indir)
|
|
35
|
-
}
|
|
36
|
-
if (length(barcode_file) > 1) {
|
|
37
|
-
warning(paste("Multiple barcode files found in", indir, ", using the first one."))
|
|
38
|
-
}
|
|
39
|
-
|
|
40
|
-
mtx = readMM(mtx_file)
|
|
41
|
-
n_feats = nrow(mtx)
|
|
42
|
-
n_cells = ncol(mtx)
|
|
43
|
-
logger("- Dimension: Features:", n_feats, ", Cells:", n_cells)
|
|
44
|
-
|
|
45
|
-
if (envs$nfeats <= 1) {
|
|
46
|
-
nfeats = as.integer(n_feats * envs$nfeats)
|
|
1
|
+
library(DropletUtils)
|
|
2
|
+
library(Seurat)
|
|
3
|
+
|
|
4
|
+
srtobjfile = {{in.srtobj | r}}
|
|
5
|
+
outdir = {{out.outdir | r}}
|
|
6
|
+
version = {{envs.version | r}}
|
|
7
|
+
split_by = {{envs.split_by | r}}
|
|
8
|
+
|
|
9
|
+
srtobj = readRDS(srtobjfile)
|
|
10
|
+
if (!is.null(split_by)) {
|
|
11
|
+
# check if split_by is a valid column
|
|
12
|
+
if (is.null(srtobj[[split_by]])) {
|
|
13
|
+
stop(paste0("Column ", split_by, " not found in Seurat object"))
|
|
14
|
+
}
|
|
15
|
+
|
|
16
|
+
# split Seurat object by split_by column
|
|
17
|
+
objs <- SplitObject(srtobj, split.by = split_by)
|
|
18
|
+
for (s in names(objs)) {
|
|
19
|
+
counts <- GetAssayData(object = objs[[s]], layer = "counts")
|
|
20
|
+
odir <- file.path(outdir, s)
|
|
21
|
+
dir.create(odir, recursive = TRUE, showWarnings = FALSE)
|
|
22
|
+
write10xCounts(odir, counts, version = version, overwrite = TRUE)
|
|
23
|
+
}
|
|
47
24
|
} else {
|
|
48
|
-
|
|
49
|
-
|
|
50
|
-
if (envs$ncells <= 1) {
|
|
51
|
-
ncells = as.integer(n_cells * envs$ncells)
|
|
52
|
-
} else {
|
|
53
|
-
ncells = envs$ncells
|
|
54
|
-
}
|
|
55
|
-
|
|
56
|
-
logger("- Identifying features to keep ...")
|
|
57
|
-
feats = read.table(feat_file, header=FALSE, row.names=NULL, check.names=FALSE)
|
|
58
|
-
feats_to_keep = c()
|
|
59
|
-
if (length(envs$feats_to_keep) > 0) {
|
|
60
|
-
feats_to_keep = match(envs$feats_to_keep, feats[,2])
|
|
25
|
+
counts = GetAssayData(object = srtobj, layer = "counts")
|
|
26
|
+
write10xCounts(outdir, counts, version = version, overwrite = TRUE)
|
|
61
27
|
}
|
|
62
|
-
|
|
63
|
-
out_feats = unique(c(sample(1:n_feats, nfeats), feats_to_keep))
|
|
64
|
-
out_cells = sample(1:n_cells, ncells)
|
|
65
|
-
logger("- Resulting in", length(out_feats), "features and", ncells, "cells")
|
|
66
|
-
|
|
67
|
-
logger("- Subsetting matrix and saving it ...")
|
|
68
|
-
out_mtx = mtx[out_feats, out_cells, drop=FALSE]
|
|
69
|
-
out_mtx_file = file.path(outdir, "matrix.mtx")
|
|
70
|
-
writeMM(out_mtx, out_mtx_file)
|
|
71
|
-
system(paste("gzip", out_mtx_file))
|
|
72
|
-
|
|
73
|
-
logger("- Subsetting features and saving it ...")
|
|
74
|
-
out_feats = feats[out_feats, , drop=FALSE]
|
|
75
|
-
out_feats_file = gzfile(file.path(outdir, "features.tsv.gz"), "w")
|
|
76
|
-
write.table(out_feats, out_feats_file, sep="\t", row.names=FALSE, col.names=FALSE, quote=FALSE)
|
|
77
|
-
close(out_feats_file)
|
|
78
|
-
|
|
79
|
-
logger("- Subsetting barcodes and saving it ...")
|
|
80
|
-
barcodes = read.table(barcode_file, header=FALSE, row.names=NULL, check.names=FALSE)
|
|
81
|
-
out_barcodes = barcodes[out_cells, , drop=FALSE]
|
|
82
|
-
out_barcodes_file = gzfile(file.path(outdir, "barcodes.tsv.gz"), "w")
|
|
83
|
-
write.table(out_barcodes, out_barcodes_file, sep="\t", row.names=FALSE, col.names=FALSE, quote=FALSE)
|
|
84
|
-
close(out_barcodes_file)
|
|
@@ -0,0 +1,84 @@
|
|
|
1
|
+
library(Matrix)
|
|
2
|
+
|
|
3
|
+
indir = {{in.indir | quote}}
|
|
4
|
+
outdir = {{out.outdir | quote}}
|
|
5
|
+
envs = {{envs | r}}
|
|
6
|
+
|
|
7
|
+
set.seed(envs$seed)
|
|
8
|
+
setwd(outdir)
|
|
9
|
+
|
|
10
|
+
logger <- function(...) {
|
|
11
|
+
cat(paste(..., "\n"), file=stderr())
|
|
12
|
+
}
|
|
13
|
+
|
|
14
|
+
# Find the data files
|
|
15
|
+
mtx_file = Sys.glob(file.path(indir, "*matrix.mtx.gz"))
|
|
16
|
+
feat_file = c(
|
|
17
|
+
Sys.glob(file.path(indir, "*genes.tsv.gz")),
|
|
18
|
+
Sys.glob(file.path(indir, "*features.tsv.gz"))
|
|
19
|
+
)
|
|
20
|
+
barcode_file = Sys.glob(file.path(indir, "*barcodes.tsv.gz"))
|
|
21
|
+
if (length(mtx_file) == 0) {
|
|
22
|
+
stop("No matrix file found in", indir)
|
|
23
|
+
}
|
|
24
|
+
if (length(mtx_file) > 1) {
|
|
25
|
+
warning(paste("Multiple matrix files found in", indir, ", using the first one."))
|
|
26
|
+
}
|
|
27
|
+
if (length(feat_file) == 0) {
|
|
28
|
+
stop("No feature file found in", indir)
|
|
29
|
+
}
|
|
30
|
+
if (length(feat_file) > 1) {
|
|
31
|
+
warning(paste("Multiple feature files found in", indir, ", using the first one."))
|
|
32
|
+
}
|
|
33
|
+
if (length(barcode_file) == 0) {
|
|
34
|
+
stop("No barcode file found in", indir)
|
|
35
|
+
}
|
|
36
|
+
if (length(barcode_file) > 1) {
|
|
37
|
+
warning(paste("Multiple barcode files found in", indir, ", using the first one."))
|
|
38
|
+
}
|
|
39
|
+
|
|
40
|
+
mtx = readMM(mtx_file)
|
|
41
|
+
n_feats = nrow(mtx)
|
|
42
|
+
n_cells = ncol(mtx)
|
|
43
|
+
logger("- Dimension: Features:", n_feats, ", Cells:", n_cells)
|
|
44
|
+
|
|
45
|
+
if (envs$nfeats <= 1) {
|
|
46
|
+
nfeats = as.integer(n_feats * envs$nfeats)
|
|
47
|
+
} else {
|
|
48
|
+
nfeats = envs$nfeats
|
|
49
|
+
}
|
|
50
|
+
if (envs$ncells <= 1) {
|
|
51
|
+
ncells = as.integer(n_cells * envs$ncells)
|
|
52
|
+
} else {
|
|
53
|
+
ncells = envs$ncells
|
|
54
|
+
}
|
|
55
|
+
|
|
56
|
+
logger("- Identifying features to keep ...")
|
|
57
|
+
feats = read.table(feat_file, header=FALSE, row.names=NULL, check.names=FALSE)
|
|
58
|
+
feats_to_keep = c()
|
|
59
|
+
if (length(envs$feats_to_keep) > 0) {
|
|
60
|
+
feats_to_keep = match(envs$feats_to_keep, feats[,2])
|
|
61
|
+
}
|
|
62
|
+
|
|
63
|
+
out_feats = unique(c(sample(1:n_feats, nfeats), feats_to_keep))
|
|
64
|
+
out_cells = sample(1:n_cells, ncells)
|
|
65
|
+
logger("- Resulting in", length(out_feats), "features and", ncells, "cells")
|
|
66
|
+
|
|
67
|
+
logger("- Subsetting matrix and saving it ...")
|
|
68
|
+
out_mtx = mtx[out_feats, out_cells, drop=FALSE]
|
|
69
|
+
out_mtx_file = file.path(outdir, "matrix.mtx")
|
|
70
|
+
writeMM(out_mtx, out_mtx_file)
|
|
71
|
+
system(paste("gzip", out_mtx_file))
|
|
72
|
+
|
|
73
|
+
logger("- Subsetting features and saving it ...")
|
|
74
|
+
out_feats = feats[out_feats, , drop=FALSE]
|
|
75
|
+
out_feats_file = gzfile(file.path(outdir, "features.tsv.gz"), "w")
|
|
76
|
+
write.table(out_feats, out_feats_file, sep="\t", row.names=FALSE, col.names=FALSE, quote=FALSE)
|
|
77
|
+
close(out_feats_file)
|
|
78
|
+
|
|
79
|
+
logger("- Subsetting barcodes and saving it ...")
|
|
80
|
+
barcodes = read.table(barcode_file, header=FALSE, row.names=NULL, check.names=FALSE)
|
|
81
|
+
out_barcodes = barcodes[out_cells, , drop=FALSE]
|
|
82
|
+
out_barcodes_file = gzfile(file.path(outdir, "barcodes.tsv.gz"), "w")
|
|
83
|
+
write.table(out_barcodes, out_barcodes_file, sep="\t", row.names=FALSE, col.names=FALSE, quote=FALSE)
|
|
84
|
+
close(out_barcodes_file)
|
|
@@ -0,0 +1,157 @@
|
|
|
1
|
+
source("{{biopipen_dir}}/utils/misc.R")
|
|
2
|
+
library(rlang)
|
|
3
|
+
library(MatrixEQTL)
|
|
4
|
+
|
|
5
|
+
snpfile = {{in.geno | r}}
|
|
6
|
+
expfile = {{in.expr | r}}
|
|
7
|
+
covfile = {{in.cov | r}}
|
|
8
|
+
joboutdir = {{job.outdir | r}}
|
|
9
|
+
alleqtl = {{out.alleqtls | r}}
|
|
10
|
+
outfile = {{out.cisqtls | r}}
|
|
11
|
+
|
|
12
|
+
model = {{envs.model | r}}
|
|
13
|
+
pval = {{envs.pval | r}}
|
|
14
|
+
transp = {{envs.transp | r}}
|
|
15
|
+
fdr = {{envs.fdr | r}}
|
|
16
|
+
snppos = {{envs.snppos | r}}
|
|
17
|
+
genepos = {{envs.genepos | r}}
|
|
18
|
+
dist = {{envs.dist | r}}
|
|
19
|
+
|
|
20
|
+
transpose_geno = {{envs.transpose_geno | r}}
|
|
21
|
+
transpose_expr = {{envs.transpose_expr | r}}
|
|
22
|
+
transpose_cov = {{envs.transpose_cov | r}}
|
|
23
|
+
|
|
24
|
+
arg_match(model, c("modelANOVA", "modelLINEAR", "linear", "anova"))
|
|
25
|
+
if (model == "linear") model = "modelLINEAR"
|
|
26
|
+
if (model == "anova") model = "modelANOVA"
|
|
27
|
+
model = get(model)
|
|
28
|
+
|
|
29
|
+
trans_enabled = !is.null(transp)
|
|
30
|
+
cis_enabled = !is.null(snppos) && !is.null(genepos) && dist > 0
|
|
31
|
+
|
|
32
|
+
# if trans is disabled, all files needed for cis should be provided
|
|
33
|
+
if (!trans_enabled && !cis_enabled) {
|
|
34
|
+
log_warn("Using `envs.transp = 1e-5` since cis-eQTL is disabled.")
|
|
35
|
+
trans_enabled <- TRUE
|
|
36
|
+
transp <- 1e-5
|
|
37
|
+
}
|
|
38
|
+
|
|
39
|
+
transpose_file <- function(file) {
|
|
40
|
+
out <- file.path(joboutdir, paste0(
|
|
41
|
+
tools::file_path_sans_ext(basename(file)),
|
|
42
|
+
".transposed.",
|
|
43
|
+
tools::file_ext(file))
|
|
44
|
+
)
|
|
45
|
+
data <- read.table(file, header=TRUE, stringsAsFactors=FALSE, row.names=1, sep="\t", quote="", check.names=FALSE)
|
|
46
|
+
write.table(t(data), file=out, sep="\t", quote=FALSE, row.names=TRUE, col.names=TRUE)
|
|
47
|
+
out
|
|
48
|
+
}
|
|
49
|
+
|
|
50
|
+
if (transpose_geno) snpfile = transpose_file(snpfile)
|
|
51
|
+
if (transpose_expr) expfile = transpose_file(expfile)
|
|
52
|
+
if (transpose_cov) covfile = transpose_file(covfile)
|
|
53
|
+
|
|
54
|
+
snps = SlicedData$new();
|
|
55
|
+
snps$fileDelimiter = "\t"; # the TAB character
|
|
56
|
+
snps$fileOmitCharacters = "NA"; # denote missing values;
|
|
57
|
+
snps$fileSkipRows = 1; # one row of column labels
|
|
58
|
+
snps$fileSkipColumns = 1; # one column of row labels
|
|
59
|
+
snps$fileSliceSize = 10000; # read file in pieces of 2,000 rows
|
|
60
|
+
snps$LoadFile( snpfile );
|
|
61
|
+
|
|
62
|
+
gene = SlicedData$new();
|
|
63
|
+
gene$fileDelimiter = "\t"; # the TAB character
|
|
64
|
+
gene$fileOmitCharacters = "NA"; # denote missing values;
|
|
65
|
+
gene$fileSkipRows = 1; # one row of column labels
|
|
66
|
+
gene$fileSkipColumns = 1; # one column of row labels
|
|
67
|
+
gene$fileSliceSize = 10000; # read file in pieces of 2,000 rows
|
|
68
|
+
gene$LoadFile( expfile );
|
|
69
|
+
|
|
70
|
+
cvrt = SlicedData$new();
|
|
71
|
+
if (!is.null(covfile) && file.exists(covfile)) {
|
|
72
|
+
covmatrix = t(read.table.inopts(covfile, list(cnames=TRUE, rnames=TRUE)))
|
|
73
|
+
cvrt$CreateFromMatrix( as.matrix(covmatrix) )
|
|
74
|
+
}
|
|
75
|
+
|
|
76
|
+
engine_params = list()
|
|
77
|
+
engine_params$snps = snps
|
|
78
|
+
engine_params$gene = gene
|
|
79
|
+
engine_params$cvrt = cvrt
|
|
80
|
+
engine_params$output_file_name = ifelse(trans_enabled, alleqtl, NULL)
|
|
81
|
+
engine_params$pvOutputThreshold = ifelse(trans_enabled, transp, 0)
|
|
82
|
+
engine_params$useModel = model
|
|
83
|
+
engine_params$errorCovariance = numeric()
|
|
84
|
+
engine_params$verbose = TRUE
|
|
85
|
+
engine_params$noFDRsaveMemory = !fdr
|
|
86
|
+
|
|
87
|
+
noq = function(s) {
|
|
88
|
+
gsub('^\"|\"$', "", s)
|
|
89
|
+
}
|
|
90
|
+
|
|
91
|
+
if (cis_enabled) {
|
|
92
|
+
if (endsWith(snppos, ".bed")) {
|
|
93
|
+
snppos_data = read.table.inopts(snppos,
|
|
94
|
+
list(cnames=FALSE, rnames=FALSE))
|
|
95
|
+
snppos_data = snppos_data[, c(4, 1, 2)]
|
|
96
|
+
colnames(snppos_data) = c("snp", "chr", "pos")
|
|
97
|
+
} else if (endsWith(snppos, ".gff") || endsWith(snppos, ".gtf")) {
|
|
98
|
+
snppos_data = read.table.inopts(snppos,
|
|
99
|
+
list(cnames=FALSE, rnames=FALSE));
|
|
100
|
+
snppos_data = snppos_data[, c(9, 1, 4)]
|
|
101
|
+
colnames(snppos_data) = c("snp", "chr", "pos")
|
|
102
|
+
snppos_data$snp = unlist(lapply(snppos_data$snp, function(x) {
|
|
103
|
+
for (s in unlist(strsplit(x, '; ', fixed=T))) {
|
|
104
|
+
if (startsWith(s, "snp_id "))
|
|
105
|
+
return(noq(substring(s, 8)))
|
|
106
|
+
else if (startsWith(s, "rs_id "))
|
|
107
|
+
return(noq(substring(s, 7)))
|
|
108
|
+
else if (startsWith(s, "rs "))
|
|
109
|
+
return(noq(substring(s, 4)))
|
|
110
|
+
}
|
|
111
|
+
}))
|
|
112
|
+
} else if (endsWith(snppos, ".vcf") || endsWith(snppos, ".vcf.gz")) {
|
|
113
|
+
snppos_data = read.table.inopts(snppos,
|
|
114
|
+
list(cnames=FALSE, rnames=FALSE))
|
|
115
|
+
snppos_data = snppos_data[, c(3, 1, 2)]
|
|
116
|
+
colnames(snppos_data) = c("snp", "chr", "pos")
|
|
117
|
+
} else {
|
|
118
|
+
snppos_data = read.table.inopts(snppos, list(cnames=TRUE))
|
|
119
|
+
colnames(snppos_data) = c("snp", "chr", "pos")
|
|
120
|
+
}
|
|
121
|
+
|
|
122
|
+
if (endsWith(genepos, ".bed")) {
|
|
123
|
+
genepos_data = read.table.inopts(genepos,
|
|
124
|
+
list(cnames=FALSE, rnames=FALSE))
|
|
125
|
+
genepos_data = genepos_data[, c(4, 1:3)]
|
|
126
|
+
colnames(genepos_data) = c("geneid", "chr", "s1", "s2")
|
|
127
|
+
} else if (endsWith(genepos, ".gff") || endsWith(genepos, ".gtf")) {
|
|
128
|
+
genepos_data = read.table.inopts(genepos,
|
|
129
|
+
list(cnames=FALSE, rnames=FALSE))
|
|
130
|
+
genepos_data = genepos_data[, c(9, 1, 4, 5)]
|
|
131
|
+
colnames(genepos_data) = c("geneid", "chr", "s1", "s2")
|
|
132
|
+
genepos_data$geneid = noquote(unlist(lapply(genepos_data$geneid, function(x) {
|
|
133
|
+
for (s in unlist(strsplit(x, '; ', fixed=T))) {
|
|
134
|
+
if (startsWith(s, "gene_id "))
|
|
135
|
+
return(noq(substring(s, 9)))
|
|
136
|
+
}
|
|
137
|
+
})))
|
|
138
|
+
} else {
|
|
139
|
+
genepos_data = read.table(genepos, header = TRUE, stringsAsFactors = FALSE);
|
|
140
|
+
colnames(genepos_data) = c("geneid", "chr", "s1", "s2")
|
|
141
|
+
}
|
|
142
|
+
|
|
143
|
+
engine_params$output_file_name.cis = outfile
|
|
144
|
+
engine_params$pvOutputThreshold.cis = pval
|
|
145
|
+
engine_params$cisDist = dist
|
|
146
|
+
engine_params$snpspos = snppos_data
|
|
147
|
+
engine_params$genepos = genepos_data
|
|
148
|
+
do_call(Matrix_eQTL_main, engine_params)
|
|
149
|
+
} else {
|
|
150
|
+
do_call(Matrix_eQTL_engine, engine_params)
|
|
151
|
+
file.create(outfile)
|
|
152
|
+
}
|
|
153
|
+
|
|
154
|
+
if (pval == 0) {
|
|
155
|
+
if (!file.exists(outfile)) file.create(outfile)
|
|
156
|
+
if (!file.exists(alleqtl)) file.create(alleqtl)
|
|
157
|
+
}
|
|
@@ -1,6 +1,6 @@
|
|
|
1
1
|
Metadata-Version: 2.1
|
|
2
2
|
Name: biopipen
|
|
3
|
-
Version: 0.27.
|
|
3
|
+
Version: 0.27.5
|
|
4
4
|
Summary: Bioinformatics processes/pipelines that can be run from `pipen run`
|
|
5
5
|
License: MIT
|
|
6
6
|
Author: pwwang
|
|
@@ -20,4 +20,3 @@ Requires-Dist: pipen-filters (>=0.12,<0.13)
|
|
|
20
20
|
Requires-Dist: pipen-poplog (>=0.1.2,<0.2.0)
|
|
21
21
|
Requires-Dist: pipen-runinfo (>=0.6,<0.7) ; extra == "runinfo"
|
|
22
22
|
Requires-Dist: pipen-verbose (>=0.11,<0.12)
|
|
23
|
-
Requires-Dist: pyyaml-include (==1.*)
|
|
@@ -1,11 +1,11 @@
|
|
|
1
|
-
biopipen/__init__.py,sha256=
|
|
1
|
+
biopipen/__init__.py,sha256=E1FuUUku2gzKP9EaIByX13BXhDU2SYE99gN_s2YdX7s,23
|
|
2
2
|
biopipen/core/__init__.py,sha256=47DEQpj8HBSa-_TImW-5JCeuQeRkm5NMpJWZG3hSuFU,0
|
|
3
3
|
biopipen/core/config.py,sha256=edK5xnDhM8j27srDzsxubi934NMrglLoKrdcC8qsEPk,1069
|
|
4
4
|
biopipen/core/config.toml,sha256=20RCI30Peee1EQdfb_UbV3Hf74XUPndJnYZlUThytsw,1781
|
|
5
5
|
biopipen/core/defaults.py,sha256=yPeehPLk_OYCf71IgRVCWuQRxLAMixDF81Ium0HtPKI,344
|
|
6
6
|
biopipen/core/filters.py,sha256=HLrjXGsvvjRtTWIAmg_f4IMymWaRD769HlDwsCTh170,12424
|
|
7
7
|
biopipen/core/proc.py,sha256=60lUP3PcUAaKbDETo9N5PEIoeOYrLgcSmuytmrhcx8g,912
|
|
8
|
-
biopipen/core/testing.py,sha256=
|
|
8
|
+
biopipen/core/testing.py,sha256=fZ8lzLwM5AhYapx0LDdYZPumqC0dj7GZpQuabhlqyGI,3665
|
|
9
9
|
biopipen/ns/__init__.py,sha256=47DEQpj8HBSa-_TImW-5JCeuQeRkm5NMpJWZG3hSuFU,0
|
|
10
10
|
biopipen/ns/bam.py,sha256=5AsYrB0mtr_mH6mCL6gjJ5rC4NywpjFkpFjUrBGp7Fk,9301
|
|
11
11
|
biopipen/ns/bcftools.py,sha256=puCDfIL-1z6cz2y1Rlz-ESNIr8xJgeIjEQ440qicCvM,3467
|
|
@@ -15,18 +15,18 @@ biopipen/ns/cellranger_pipeline.py,sha256=D6gvIeasHjDCdro7f4wjomxRYTtsJT77Ld47Xz
|
|
|
15
15
|
biopipen/ns/cnv.py,sha256=vq6dZfEOyuVuqg3nP6FQtNmQ-JocpBJMX9IYlZ0OPD0,6803
|
|
16
16
|
biopipen/ns/cnvkit.py,sha256=5mA2Q8-YDs4g1HoxtpB_NWnyZYwEThNr3s3wlubLQrQ,31130
|
|
17
17
|
biopipen/ns/cnvkit_pipeline.py,sha256=2fJLn70L2jJ81ZMNdnU84Sf3HoKA2CSnHuDzLGR8jmw,36854
|
|
18
|
-
biopipen/ns/delim.py,sha256=
|
|
18
|
+
biopipen/ns/delim.py,sha256=fejsh4KW1TG5oMZzAC238LvQhBz7brXkfl3BHfnLK5M,5612
|
|
19
19
|
biopipen/ns/gene.py,sha256=Q5FzRByfnRITXRNRZR65ApG09FRyiihRC3TcIXxufzE,2228
|
|
20
20
|
biopipen/ns/gsea.py,sha256=EsNRAPYsagaV2KYgr4Jv0KCnZGqayM209v4yOGGTIOI,7423
|
|
21
21
|
biopipen/ns/misc.py,sha256=fzn0pXvdghMkQhu-e3MMapPNMyO6IAJbtTzVU3GbFa0,3246
|
|
22
|
-
biopipen/ns/plot.py,sha256=
|
|
22
|
+
biopipen/ns/plot.py,sha256=fzJAKKl4a_tsVkLREGCQTFVHP049m33LdWgeYRb6v7M,5483
|
|
23
23
|
biopipen/ns/rnaseq.py,sha256=bKAa6friFWof4yDTWZQahm1MS-lrdetO1GqDKdfxXYc,7708
|
|
24
|
-
biopipen/ns/scrna.py,sha256=
|
|
25
|
-
biopipen/ns/scrna_metabolic_landscape.py,sha256=
|
|
26
|
-
biopipen/ns/snp.py,sha256=
|
|
24
|
+
biopipen/ns/scrna.py,sha256=7Gs1xxQoGM3TKxaQvbgKNyMDEsgatFopImzC-RcOEoA,103946
|
|
25
|
+
biopipen/ns/scrna_metabolic_landscape.py,sha256=EhOtHQyoH-jRpzDoOI_06UbjEg6mhvbDEHKhek01bPk,28334
|
|
26
|
+
biopipen/ns/snp.py,sha256=EQ2FS0trQ7YThPmBVTpS66lc2OSfgQ6lCh6WnyP-C2g,5499
|
|
27
27
|
biopipen/ns/stats.py,sha256=yJ6C1CXF84T7DDs9mgufqUOr89Rl6kybE5ji8Vnx6cw,13693
|
|
28
28
|
biopipen/ns/tcgamaf.py,sha256=AFbUJIxiMSvsVY3RcHgjRFuMnNh2DG3Mr5slLNEyz6o,1455
|
|
29
|
-
biopipen/ns/tcr.py,sha256=
|
|
29
|
+
biopipen/ns/tcr.py,sha256=7F_FulZ3UGouuvgH_ylZwJybr_310f9BTz_kouO1SjY,87905
|
|
30
30
|
biopipen/ns/vcf.py,sha256=cdkKroii0_nl_bSP2cnO09qESUAhHqu6btOiTSKS79Y,15314
|
|
31
31
|
biopipen/ns/web.py,sha256=3zucrDo-IVsSnIvlw-deoScuxqWa6OMTm8Vo-R4E44Q,2224
|
|
32
32
|
biopipen/reports/bam/CNAClinic.svelte,sha256=D4IxQcgDCPQZMbXog-aZP5iJEQTK2N4i0C60e_iXyfs,213
|
|
@@ -102,7 +102,7 @@ biopipen/scripts/cnvkit/CNVkitScatter.py,sha256=7DhTiXPHEHbdXn0VFcDOR-wTP6sks08N
|
|
|
102
102
|
biopipen/scripts/cnvkit/CNVkitSegment.py,sha256=q5iGAjY6-yIehPcJpi3hX6EuGre0YgWTPkG_d5LEV48,1629
|
|
103
103
|
biopipen/scripts/cnvkit/guess_baits.py,sha256=7OCMtSMHIJWWZv9qEYVXnB0N4hU_JaGEesKdkr6tvJc,10586
|
|
104
104
|
biopipen/scripts/delim/RowsBinder.R,sha256=yp960u7Ui_jFCL8WDvODa-0vhJvyLo64ll35PzXYUbI,1444
|
|
105
|
-
biopipen/scripts/delim/SampleInfo.R,sha256=
|
|
105
|
+
biopipen/scripts/delim/SampleInfo.R,sha256=1EYlqoVpIEl9l2eBaCLETuI_Ma3HjihS9tRbGmOPiBk,6397
|
|
106
106
|
biopipen/scripts/gene/GeneNameConversion.py,sha256=2RveardTsLv2K1XSj3G0ERYLiln9bcR74bjkRdKcChc,1880
|
|
107
107
|
biopipen/scripts/gsea/Enrichr.R,sha256=tr4vInlVIeiGXumh22ARuTQmy0-Qq869RiX7d7ERqCg,661
|
|
108
108
|
biopipen/scripts/gsea/FGSEA.R,sha256=RLqDgrqnYEacHfzEEuZ3d29lxNqWehigOnGuu248SRg,1483
|
|
@@ -111,6 +111,7 @@ biopipen/scripts/gsea/PreRank.R,sha256=onZK1FQa6yDO0Fz4juy56XQjpzyw3zBdZv7edY9ac
|
|
|
111
111
|
biopipen/scripts/misc/Config2File.py,sha256=NUio0uOEuZtUBpuByDSItYu9Kwu5mosb4pdPq5-QAmE,440
|
|
112
112
|
biopipen/scripts/misc/Str2File.py,sha256=99oQNxChxChNJ9vmD77b48cu-r_P_heSpx7A5wi3qTE,212
|
|
113
113
|
biopipen/scripts/plot/Heatmap.R,sha256=4v_oRME8ZiwczIlBIp-OP_YPWLAvBKzbHiwNBCZ0Xog,1982
|
|
114
|
+
biopipen/scripts/plot/ROC.R,sha256=Cr-mHQx6c748fQYkOWO2xIKWwiVAUxGuxn6lYEhNH78,2430
|
|
114
115
|
biopipen/scripts/plot/VennDiagram.R,sha256=GVc-kyHqnXrbXZvy-evcxI1XGtlLSChBiVnMjPywNMA,731
|
|
115
116
|
biopipen/scripts/rnaseq/Simulation-ESCO.R,sha256=68cEHDdJclX8P8Q7ey9yBOfK09M_kxlL6zgYXsEL2Rs,6378
|
|
116
117
|
biopipen/scripts/rnaseq/Simulation-RUVcorr.R,sha256=6C6Ke5RLF0fC2V9WQPoFEdqoDabCnhslZBIyB6zhIxc,1155
|
|
@@ -137,7 +138,7 @@ biopipen/scripts/scrna/SCImpute.R,sha256=dSJOHhmJ3x_72LBRXT72dbCti5oiB85CJ-OjWtq
|
|
|
137
138
|
biopipen/scripts/scrna/ScFGSEA.R,sha256=2UCTCIydVkPGvn7WP-_fcE7857iKKDxY56-j-ruyO8o,6254
|
|
138
139
|
biopipen/scripts/scrna/Seurat2AnnData.R,sha256=qz4u-B5J3GMwttubnNnByJXreziFbrP5Mak0L0q7eG0,1557
|
|
139
140
|
biopipen/scripts/scrna/SeuratClusterStats-dimplots.R,sha256=gViDgQ8NorYD64iK0FgcODOrDOw0tExZmhuPRuLNp4g,2354
|
|
140
|
-
biopipen/scripts/scrna/SeuratClusterStats-features.R,sha256=
|
|
141
|
+
biopipen/scripts/scrna/SeuratClusterStats-features.R,sha256=W7iYhaFsC5EMZLO50QukYPLYGK4bq9kQc1VT5FwvI68,15496
|
|
141
142
|
biopipen/scripts/scrna/SeuratClusterStats-hists.R,sha256=YhuD-GePjJPSkR0iLRgV_hiGHD_bnOIKp-LB6GCwquo,5037
|
|
142
143
|
biopipen/scripts/scrna/SeuratClusterStats-ngenes.R,sha256=GVKIXFNS_syCuSN8oxoBkjxxAeI5LdSxh-qLVkUsbDA,2146
|
|
143
144
|
biopipen/scripts/scrna/SeuratClusterStats-stats.R,sha256=TxQ0OcLwXwIgwL1mTLArboK0ATJIJhxWiv9DV_jBlhE,9255
|
|
@@ -147,19 +148,20 @@ biopipen/scripts/scrna/SeuratFilter.R,sha256=BrYK0MLdaTtQvInMaQsmOt7oH_hlks0M1zy
|
|
|
147
148
|
biopipen/scripts/scrna/SeuratLoading.R,sha256=ekWKnHIqtQb3kHVQiVymAHXXqiUxs6KKefjZKjaykmk,900
|
|
148
149
|
biopipen/scripts/scrna/SeuratMap2Ref.R,sha256=Xn3VnvKqShuC0Ju05380wjuLVSdW0uWVzntdxjme244,4359
|
|
149
150
|
biopipen/scripts/scrna/SeuratMetadataMutater.R,sha256=Pp4GsF3hZ6ZC2vroC3LSBmVa4B1p2L3hbh981yaAIeQ,1093
|
|
150
|
-
biopipen/scripts/scrna/SeuratPreparing.R,sha256=
|
|
151
|
+
biopipen/scripts/scrna/SeuratPreparing.R,sha256=t6GOcc9ZNwpRLeES7uBWja9RF6u6k5I_TXcdK4Ve7d0,18683
|
|
151
152
|
biopipen/scripts/scrna/SeuratSplit.R,sha256=vdK11V39_Uo_NaOh76QWCtxObGaEr5Ynxqq0hTiSvsU,754
|
|
152
153
|
biopipen/scripts/scrna/SeuratSubClustering.R,sha256=L1SwKhNNKvsQGrcj0ZjScW9BLuvdO2pg7U48Ospsot8,6096
|
|
153
154
|
biopipen/scripts/scrna/SeuratSubset.R,sha256=yVA11NVE2FSSw-DhxQcJRapns0tNNHdyDYi5epO6SKM,1776
|
|
154
|
-
biopipen/scripts/scrna/SeuratTo10X.R,sha256=
|
|
155
|
+
biopipen/scripts/scrna/SeuratTo10X.R,sha256=1mh1R0Qlo1iHVrpMLUXyLDOA92QKJ4GzTMURTFRqsWg,901
|
|
156
|
+
biopipen/scripts/scrna/Subset10X.R,sha256=T2nJBTwOe12AIKC2FZsMSv6xx3s-67CYZokpz5wshqY,2679
|
|
155
157
|
biopipen/scripts/scrna/TopExpressingGenes.R,sha256=kXMCYHVytgVgO_Uq66fKKFCFV2PPXE8VREy_0yYPLpU,7475
|
|
156
|
-
biopipen/scripts/scrna/Write10X.R,sha256=OMhXvJwvaH-aWsMpijKrvXQVabc1qUu5ZEwiLAhkDeY,285
|
|
157
158
|
biopipen/scripts/scrna/celltypist-wrapper.py,sha256=f5M8f4rU5nC7l17RS0YVmUPpLLz4D6PIcgWtA77UExM,1722
|
|
158
159
|
biopipen/scripts/scrna/sctype.R,sha256=NaUJkABwF5G1UVm1CCtcMbwLSj94Mo24mbYCKFqo1Bw,6524
|
|
159
160
|
biopipen/scripts/scrna_metabolic_landscape/MetabolicFeatures.R,sha256=b77yG5FeRse3bNfFgLIEYGHNZzydAn1OeyyR_n5Ju60,4790
|
|
160
161
|
biopipen/scripts/scrna_metabolic_landscape/MetabolicFeaturesIntraSubset.R,sha256=ic8Fy8QqYDGh_izmvZVJ3KL66podg_CSF5ITL3FZsvo,5196
|
|
161
162
|
biopipen/scripts/scrna_metabolic_landscape/MetabolicPathwayActivity.R,sha256=95DLX1Rz0tobOuDZ8V9YdGgO0KiNthhccoeeOK21tno,16216
|
|
162
163
|
biopipen/scripts/scrna_metabolic_landscape/MetabolicPathwayHeterogeneity.R,sha256=rQ9iwGh9FNRZlJJzM4QItdyXmebfzLAq05ZAjb1kGUw,9831
|
|
164
|
+
biopipen/scripts/snp/MatrixEQTL.R,sha256=zOR_mhn_sUXuxqgV82TPvDp-E1i5aJVA45QixyRP8no,5930
|
|
163
165
|
biopipen/scripts/snp/PlinkSimulation.py,sha256=mSSoGGG6sbEPBcUGdHgbebUrg4DiHeyNyc7jLPjV5pY,4169
|
|
164
166
|
biopipen/scripts/stats/ChowTest.R,sha256=4p7NULmfOZSfeBSQ04els0h3cXOK5yeCJJ4-gEBPOGk,3617
|
|
165
167
|
biopipen/scripts/stats/DiffCoexpr.R,sha256=5hQDV2_7bKdKUsOGMZUa0GS5rc7kFspxonNyFEPmtbc,4516
|
|
@@ -238,7 +240,7 @@ biopipen/utils/reference.py,sha256=6bPSwQa-GiDfr7xLR9a5T64Ey40y24yn3QfQ5wDFZkU,4
|
|
|
238
240
|
biopipen/utils/rnaseq.R,sha256=Ro2B2dG-Z2oVaT5tkwp9RHBz4dp_RF-JcizlM5GYXFs,1298
|
|
239
241
|
biopipen/utils/single_cell.R,sha256=pJjYP8bIZpNAtTQ32rOXhZxaM1Y-6D-xUcK3pql9tbk,4316
|
|
240
242
|
biopipen/utils/vcf.py,sha256=ajXs0M_QghEctlvUlSRjWQIABVF02wPdYd-0LP4mIsU,9377
|
|
241
|
-
biopipen-0.27.
|
|
242
|
-
biopipen-0.27.
|
|
243
|
-
biopipen-0.27.
|
|
244
|
-
biopipen-0.27.
|
|
243
|
+
biopipen-0.27.5.dist-info/METADATA,sha256=V-P-6i9I4Q1OE-KDY39Nkki_Iv_5jpP-65kxeUuCc88,882
|
|
244
|
+
biopipen-0.27.5.dist-info/WHEEL,sha256=sP946D7jFCHeNz5Iq4fL4Lu-PrWrFsgfLXbbkciIZwg,88
|
|
245
|
+
biopipen-0.27.5.dist-info/entry_points.txt,sha256=wu70aoBcv1UahVbB_5237MY-9M9_mzqmWjDD-oi3yz0,621
|
|
246
|
+
biopipen-0.27.5.dist-info/RECORD,,
|
|
@@ -1,11 +0,0 @@
|
|
|
1
|
-
library(DropletUtils)
|
|
2
|
-
library(Seurat)
|
|
3
|
-
|
|
4
|
-
srtobjfile = {{in.srtobj | r}}
|
|
5
|
-
outdir = {{out.outdir | r}}
|
|
6
|
-
version = {{envs.version | r}}
|
|
7
|
-
|
|
8
|
-
srtobj = readRDS(srtobjfile)
|
|
9
|
-
counts = GetAssayData(object = srtobj, layer = "counts")
|
|
10
|
-
|
|
11
|
-
write10xCounts(outdir, counts, version = version, overwrite = TRUE)
|
|
File without changes
|
|
File without changes
|