trading-signals 6.9.1 → 7.1.0
This diff represents the content of publicly available package versions that have been released to one of the supported registries. The information contained in this diff is provided for informational purposes only and reflects changes between package versions as they appear in their respective public registries.
- package/README.md +86 -96
- package/dist/index.cjs +809 -2148
- package/dist/index.d.cts +266 -635
- package/dist/index.d.ts +266 -635
- package/dist/index.js +799 -2096
- package/package.json +17 -28
package/README.md
CHANGED
|
@@ -6,12 +6,20 @@ Technical indicators and overlays to run technical analysis with JavaScript / Ty
|
|
|
6
6
|
|
|
7
7
|
## Motivation
|
|
8
8
|
|
|
9
|
-
The "trading-signals" library provides a TypeScript implementation for common technical indicators
|
|
10
|
-
|
|
11
|
-
The main focus of this library is on the accuracy of calculations, but using the provided [faster implementations][2] you can also use it where performance is important.
|
|
9
|
+
The "trading-signals" library provides a TypeScript implementation for common technical indicators. It is well-suited for algorithmic trading, allowing developers to perform signal computations for automated trading strategies.
|
|
12
10
|
|
|
13
11
|
All indicators can be updated over time by streaming data (prices or [candles](https://en.wikipedia.org/wiki/Candlestick_chart)) to the `add` method. Some indicators also provide `static` batch methods for further performance improvements when providing data up-front during a backtest or historical data import. You can try it out streaming input data by running the provided [demo script](./src/start/demo.ts) with `npm start`, which uses a keyboard input stream.
|
|
14
12
|
|
|
13
|
+
## Features
|
|
14
|
+
|
|
15
|
+
- **Streaming Updates:** No need to reprocess historical data
|
|
16
|
+
- **Replace Mode:** Efficient live chart updates
|
|
17
|
+
- **Lazy Evaluation:** Indicators only calculate when stable
|
|
18
|
+
- **Memory Efficiency:** Rolling windows, not full history storage
|
|
19
|
+
- **Excellent Test Coverage:** 100% across all metrics
|
|
20
|
+
- **Zero Runtime Dependencies:** Minimal bundle size
|
|
21
|
+
- **Type Safety:** Full TypeScript with strict mode
|
|
22
|
+
|
|
15
23
|
## Installation
|
|
16
24
|
|
|
17
25
|
```bash
|
|
@@ -23,19 +31,19 @@ npm install trading-signals
|
|
|
23
31
|
**CommonJS:**
|
|
24
32
|
|
|
25
33
|
```ts
|
|
26
|
-
const {
|
|
34
|
+
const {SMA} = require('trading-signals');
|
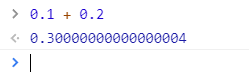
|
27
35
|
```
|
|
28
36
|
|
|
29
37
|
**ESM:**
|
|
30
38
|
|
|
31
39
|
```ts
|
|
32
|
-
import {
|
|
40
|
+
import {SMA} from 'trading-signals';
|
|
33
41
|
```
|
|
34
42
|
|
|
35
43
|
**Example:**
|
|
36
44
|
|
|
37
45
|
```typescript
|
|
38
|
-
import {
|
|
46
|
+
import {SMA} from 'trading-signals';
|
|
39
47
|
|
|
40
48
|
const sma = new SMA(3);
|
|
41
49
|
|
|
@@ -47,23 +55,17 @@ sma.add(20);
|
|
|
47
55
|
// You can add multiple values at once:
|
|
48
56
|
sma.updates([20, 40, 80]);
|
|
49
57
|
|
|
50
|
-
// You can add stringified values:
|
|
51
|
-
sma.add('10');
|
|
52
|
-
|
|
53
58
|
// You can replace a previous value (useful for live charting):
|
|
54
|
-
sma.replace(
|
|
55
|
-
|
|
56
|
-
// You can add arbitrary-precision decimals:
|
|
57
|
-
sma.add(new Big(30.0009));
|
|
59
|
+
sma.replace(40);
|
|
58
60
|
|
|
59
61
|
// You can check if an indicator is stable:
|
|
60
62
|
console.log(sma.isStable); // true
|
|
61
63
|
|
|
62
64
|
// If an indicator is stable, you can get its result:
|
|
63
|
-
console.log(sma.getResult()
|
|
65
|
+
console.log(sma.getResult()); // 50.0003
|
|
64
66
|
|
|
65
67
|
// You can also get the result without optional chaining:
|
|
66
|
-
console.log(sma.getResultOrThrow()
|
|
68
|
+
console.log(sma.getResultOrThrow()); // 50.0003
|
|
67
69
|
|
|
68
70
|
// Various precisions are available too:
|
|
69
71
|
console.log(sma.getResultOrThrow().toFixed(2)); // "50.00"
|
|
@@ -80,7 +82,7 @@ To input data, you need to call the indicator's `add` method. Depending on wheth
|
|
|
80
82
|
|
|
81
83
|
### When to use `getResultOrThrow()`?
|
|
82
84
|
|
|
83
|
-
You can call `getResultOrThrow()` at any point in time, but it throws errors unless an indicator has received the minimum amount of data. If you call `getResultOrThrow()
|
|
85
|
+
You can call `getResultOrThrow()` at any point in time, but it throws errors unless an indicator has received the minimum amount of data. If you call `getResultOrThrow()` before an indicator has received the required amount of input values, a `NotEnoughDataError` will be thrown.
|
|
84
86
|
|
|
85
87
|
**Example:**
|
|
86
88
|
|
|
@@ -91,8 +93,8 @@ import {SMA} from 'trading-signals';
|
|
|
91
93
|
const sma = new SMA(3);
|
|
92
94
|
|
|
93
95
|
// We supply 2 input values
|
|
94
|
-
sma.
|
|
95
|
-
sma.
|
|
96
|
+
sma.add(10);
|
|
97
|
+
sma.add(40);
|
|
96
98
|
|
|
97
99
|
try {
|
|
98
100
|
// We will get an error, because the minimum amount of inputs is 3
|
|
@@ -102,104 +104,83 @@ try {
|
|
|
102
104
|
}
|
|
103
105
|
|
|
104
106
|
// We will supply the 3rd input value
|
|
105
|
-
sma.
|
|
107
|
+
sma.add(70);
|
|
106
108
|
|
|
107
109
|
// Now, we will receive a proper result
|
|
108
|
-
console.log(sma.getResultOrThrow()
|
|
110
|
+
console.log(sma.getResultOrThrow()); // 40
|
|
109
111
|
```
|
|
110
112
|
|
|
111
|
-
Most of the time, the minimum amount of data depends on the interval / time period used.
|
|
113
|
+
Most of the time, the minimum amount of data depends on the interval / time period used. If you’re not sure, take a look at the test files for the indicator to see examples of correct usage.
|
|
112
114
|
|
|
113
115
|
## Technical Indicator Types
|
|
114
116
|
|
|
117
|
+
- Exhaustion indicators: Identify trend exhaustion and potential reversal.
|
|
118
|
+
- Momentum indicators: Measure the speed and strength of price movements in a particular direction
|
|
115
119
|
- Trend indicators: Measure the direction of a trend (uptrend, downtrend or sideways trend)
|
|
116
|
-
- Volume indicators: Measure the strength of a trend based on volume
|
|
117
120
|
- Volatility indicators: Measure the degree of variation in prices over time, regardless of direction
|
|
118
|
-
-
|
|
121
|
+
- Volume indicators: Measure the strength of a trend based on volume
|
|
119
122
|
|
|
120
123
|
## Supported Technical Indicators
|
|
121
124
|
|
|
122
|
-
1.
|
|
123
|
-
1.
|
|
124
|
-
1.
|
|
125
|
-
1.
|
|
126
|
-
1.
|
|
127
|
-
1.
|
|
128
|
-
1.
|
|
129
|
-
1.
|
|
130
|
-
1.
|
|
131
|
-
1.
|
|
132
|
-
1.
|
|
133
|
-
1.
|
|
134
|
-
1.
|
|
135
|
-
1.
|
|
136
|
-
1.
|
|
137
|
-
1.
|
|
138
|
-
1.
|
|
139
|
-
1.
|
|
140
|
-
1.
|
|
141
|
-
1.
|
|
142
|
-
1.
|
|
143
|
-
1.
|
|
144
|
-
1.
|
|
145
|
-
1.
|
|
146
|
-
1.
|
|
147
|
-
1.
|
|
148
|
-
1.
|
|
149
|
-
1.
|
|
150
|
-
1.
|
|
151
|
-
1.
|
|
152
|
-
1.
|
|
153
|
-
1.
|
|
154
|
-
1.
|
|
155
|
-
1.
|
|
125
|
+
1. Acceleration Bands (ABANDS)
|
|
126
|
+
1. Accelerator Oscillator (AC)
|
|
127
|
+
1. Average Directional Index (ADX)
|
|
128
|
+
1. Average True Range (ATR)
|
|
129
|
+
1. Awesome Oscillator (AO)
|
|
130
|
+
1. Bollinger Bands (BBANDS)
|
|
131
|
+
1. Bollinger Bands Width (BBW)
|
|
132
|
+
1. Center of Gravity (CG)
|
|
133
|
+
1. Commodity Channel Index (CCI)
|
|
134
|
+
1. Directional Movement Index (DMI / DX)
|
|
135
|
+
1. Double Exponential Moving Average (DEMA)
|
|
136
|
+
1. Dual Moving Average (DMA)
|
|
137
|
+
1. Exponential Moving Average (EMA)
|
|
138
|
+
1. Interquartile Range (IQR)
|
|
139
|
+
1. Linear Regression (LINREG)
|
|
140
|
+
1. Mean Absolute Deviation (MAD)
|
|
141
|
+
1. Momentum (MOM / MTM)
|
|
142
|
+
1. Moving Average Convergence Divergence (MACD)
|
|
143
|
+
1. On-Balance Volume (OBV)
|
|
144
|
+
1. Parabolic SAR (PSAR)
|
|
145
|
+
1. Range Expansion Index (REI)
|
|
146
|
+
1. Rate-of-Change (ROC)
|
|
147
|
+
1. Relative Moving Average (RMA)
|
|
148
|
+
1. Relative Strength Index (RSI)
|
|
149
|
+
1. Simple Moving Average (SMA)
|
|
150
|
+
1. Spencer's 15-Point Moving Average (SMA15)
|
|
151
|
+
1. Stochastic Oscillator (STOCH)
|
|
152
|
+
1. Stochastic RSI (STOCHRSI)
|
|
153
|
+
1. Tom Demark's Sequential Indicator (TDS)
|
|
154
|
+
1. True Range (TR)
|
|
155
|
+
1. Volume-Weighted Average Price (VWAP)
|
|
156
|
+
1. Weighted Moving Average (WMA)
|
|
157
|
+
1. Wilder's Smoothed Moving Average (WSMA / WWS / SMMA / MEMA)
|
|
158
|
+
1. Williams %R (WILLR)
|
|
159
|
+
1. Zig Zag Indicator (ZigZag)
|
|
156
160
|
|
|
157
161
|
Utility Methods:
|
|
158
162
|
|
|
159
|
-
1.
|
|
160
|
-
1. [
|
|
161
|
-
1.
|
|
162
|
-
1.
|
|
163
|
-
1.
|
|
163
|
+
1. Average / Mean
|
|
164
|
+
1. Grid Sizing (for [grid trading bots](https://b2broker.com/news/understanding-grid-trading-purpose-pros-cons/))
|
|
165
|
+
1. Maximum
|
|
166
|
+
1. Median
|
|
167
|
+
1. Minimum
|
|
168
|
+
1. Quartile
|
|
169
|
+
1. Standard Deviation
|
|
170
|
+
1. Streaks
|
|
171
|
+
1. Weekday
|
|
164
172
|
|
|
165
173
|
## Performance
|
|
166
174
|
|
|
167
|
-
###
|
|
175
|
+
### Floating-point arithmetic caveats
|
|
168
176
|
|
|
169
|
-
JavaScript
|
|
177
|
+
JavaScript uses double-precision floating-point arithmetic. For example, `0.1 + 0.2` yields `0.30000000000000004` due to binary floating-point representation.
|
|
170
178
|
|
|
171
179
|
|
|
172
180
|
|
|
173
|
-
|
|
181
|
+
While this isn’t perfectly accurate, it usually doesn’t matter in practice since indicators often work with averages, which already smooth out precision. In test cases, you can control precision by using Vitest’s [toBeCloseTo](https://vitest.dev/api/expect.html#tobecloseto) assertion.
|
|
174
182
|
|
|
175
|
-
|
|
176
|
-
|
|
177
|
-
To get the best of both worlds (high accuracy & high performance), you will find two implementations of each indicator (e.g. `SMA` & `FasterSMA`). The standard implementation uses [big.js][1] and the `Faster`-prefixed version uses common `number` types. Use the standard one when you need high accuracy and use the `Faster`-one when you need high performance:
|
|
178
|
-
|
|
179
|
-
```ts
|
|
180
|
-
import {FasterSMA} from './SMA/SMA';
|
|
181
|
-
|
|
182
|
-
const fasterSMA = new FasterSMA(5);
|
|
183
|
-
console.log(fasterSMA.updates([1, 2, 3, 4, 5]));
|
|
184
|
-
```
|
|
185
|
-
|
|
186
|
-
```ts
|
|
187
|
-
import {FasterStochasticRSI, FasterSMA} from 'trading-signals';
|
|
188
|
-
|
|
189
|
-
const fasterStochRSI = new FasterStochasticRSI(3, FasterSMA);
|
|
190
|
-
fasterStochRSI.update(1);
|
|
191
|
-
fasterStochRSI.update(2);
|
|
192
|
-
fasterStochRSI.update(3);
|
|
193
|
-
fasterStochRSI.update(4);
|
|
194
|
-
fasterStochRSI.update(5);
|
|
195
|
-
fasterStochRSI.update(6);
|
|
196
|
-
|
|
197
|
-
console.log(fasterStochRSI.getResultOrThrow());
|
|
198
|
-
```
|
|
199
|
-
|
|
200
|
-
### Benchmarks
|
|
201
|
-
|
|
202
|
-
You can run `npm run start:benchmark` to see the runtime performance of each technical indicator on your machine. This will give you an understanding of which indicators can be calculated faster than others.
|
|
183
|
+
Earlier versions of this library (up to version 6) used [big.js][1] for arbitrary-precision arithmetic, but that made calculations about 100x slower on average. For this reason, support for [big.js][1] was removed starting with version 7.
|
|
203
184
|
|
|
204
185
|
## Disclaimer
|
|
205
186
|
|
|
@@ -211,6 +192,7 @@ It is very important to do your own analysis before making any investment based
|
|
|
211
192
|
|
|
212
193
|
- [Cloud9Trader Indicators (JavaScript)](https://github.com/Cloud9Trader/TechnicalIndicators)
|
|
213
194
|
- [Crypto Trading Hub Indicators (TypeScript)](https://github.com/anandanand84/technicalindicators)
|
|
195
|
+
- [Highcharts Indicators (TypeScript)](https://github.com/highcharts/highcharts/tree/v12.3.0/ts/Stock/Indicators)
|
|
214
196
|
- [Indicator TS (TypeScript)](https://github.com/cinar/indicatorts)
|
|
215
197
|
- [Jesse Trading Bot Indicators (Python)](https://docs.jesse.trade/docs/indicators/reference.html)
|
|
216
198
|
- [LEAN Indicators (C#)](https://github.com/QuantConnect/Lean/tree/master/Indicators)
|
|
@@ -218,24 +200,32 @@ It is very important to do your own analysis before making any investment based
|
|
|
218
200
|
- [Pandas TA (Python)](https://github.com/twopirllc/pandas-ta)
|
|
219
201
|
- [Stock Indicators for .NET (C#)](https://github.com/DaveSkender/Stock.Indicators)
|
|
220
202
|
- [StockSharp (C#)](https://github.com/StockSharp/StockSharp)
|
|
221
|
-
- [ta-
|
|
203
|
+
- [ta-lib (C)](https://github.com/TA-Lib/ta-lib/tree/main/src/ta_func)
|
|
204
|
+
- [ta-math (TypeScript)](https://github.com/munrocket/ta-math)
|
|
222
205
|
- [ta4j (Java)](https://github.com/ta4j/ta4j)
|
|
223
206
|
- [Technical Analysis for Rust (Rust)](https://github.com/greyblake/ta-rs)
|
|
224
207
|
- [Technical Analysis Library using Pandas and Numpy (Python)](https://github.com/bukosabino/ta)
|
|
225
208
|
- [Tulip Indicators (ANSI C)](https://github.com/TulipCharts/tulipindicators)
|
|
226
209
|
|
|
210
|
+
## Documentation
|
|
211
|
+
|
|
212
|
+
Build and run the documentation:
|
|
213
|
+
|
|
214
|
+
```bash
|
|
215
|
+
npm run docs
|
|
216
|
+
```
|
|
217
|
+
|
|
227
218
|
## Maintainers
|
|
228
219
|
|
|
229
220
|
[![Benny Neugebauer on Stack Exchange][stack_exchange_bennycode_badge]][stack_exchange_bennycode_url]
|
|
230
221
|
|
|
231
222
|
## ⭐️ Become a TypeScript rockstar! ⭐️
|
|
232
223
|
|
|
233
|
-
This package was built by Benny
|
|
224
|
+
This package was built by Benny Neugebauer. Checkout my [**TypeScript course**](https://typescript.tv/) to become a coding rockstar!
|
|
234
225
|
|
|
235
226
|
[<img src="https://raw.githubusercontent.com/bennycode/trading-signals/main/tstv.png">](https://typescript.tv/)
|
|
236
227
|
|
|
237
228
|
[1]: http://mikemcl.github.io/big.js/
|
|
238
|
-
[2]: #faster-implementations
|
|
239
229
|
[stack_exchange_bennycode_badge]: https://stackexchange.com/users/flair/203782.png?theme=default
|
|
240
230
|
[stack_exchange_bennycode_url]: https://stackexchange.com/users/203782/benny-neugebauer?tab=accounts
|
|
241
231
|
|