toad-eye 2.6.1 → 2.8.0
This diff represents the content of publicly available package versions that have been released to one of the supported registries. The information contained in this diff is provided for informational purposes only and reflects changes between package versions as they appear in their respective public registries.
- package/README.md +80 -402
- package/dist/alerts/conditions.js +31 -6
- package/dist/alerts/grafana.js +6 -1
- package/dist/cli.js +11 -4
- package/dist/core/tracer.js +22 -2
- package/dist/instrumentations/mcp.d.ts +12 -0
- package/dist/instrumentations/mcp.js +85 -0
- package/dist/mcp/client.d.ts +9 -0
- package/dist/mcp/client.js +137 -0
- package/dist/mcp/index.d.ts +4 -2
- package/dist/mcp/index.js +2 -0
- package/dist/mcp/metrics.d.ts +5 -1
- package/dist/mcp/metrics.js +36 -5
- package/dist/mcp/middleware.d.ts +11 -1
- package/dist/mcp/middleware.js +54 -9
- package/dist/mcp/spans.d.ts +18 -5
- package/dist/mcp/spans.js +44 -24
- package/dist/mcp/types.d.ts +4 -18
- package/dist/types/metrics.d.ts +1 -0
- package/dist/types/metrics.js +1 -0
- package/dist/types/providers.d.ts +3 -1
- package/package.json +13 -4
- package/templates/alerts.example.yml +21 -0
- package/templates/grafana/dashboards/mcp-analytics.json +295 -0
- package/templates/grafana/dashboards/mcp-e2e.json +323 -0
- package/templates/grafana/dashboards/mcp-server.json +32 -12
- package/templates/otel-collector.yml +2 -2
package/README.md
CHANGED
|
@@ -1,165 +1,98 @@
|
|
|
1
|
-
# toad-eye
|
|
1
|
+
# toad-eye 🐸👁️
|
|
2
2
|
|
|
3
|
+
**Observability for MCP servers and LLM applications.**
|
|
4
|
+
|
|
5
|
+
One line of code. Full traces, metrics, and Grafana dashboards.
|
|
6
|
+
Self-hosted. Privacy-first. No vendor lock-in.
|
|
7
|
+
|
|
8
|
+
[](https://www.npmjs.com/package/toad-eye)
|
|
3
9
|

|
|
4
10
|

|
|
5
|
-

|
|
6
|
-

|
|
7
|
-

|
|
8
|
-

|
|
9
|
-
[](https://www.npmjs.com/package/toad-eye)
|
|
10
11
|

|
|
11
12
|

|
|
12
13
|
|
|
13
|
-
**LLM observability in 3 commands. Auto-instrument, trace, alert, save money.**
|
|
14
|
-
|
|
15
|
-
You don't know what your LLMs cost, how slow they are, or why they fail. toad-eye gives you complete visibility with zero manual instrumentation.
|
|
16
|
-
|
|
17
14
|
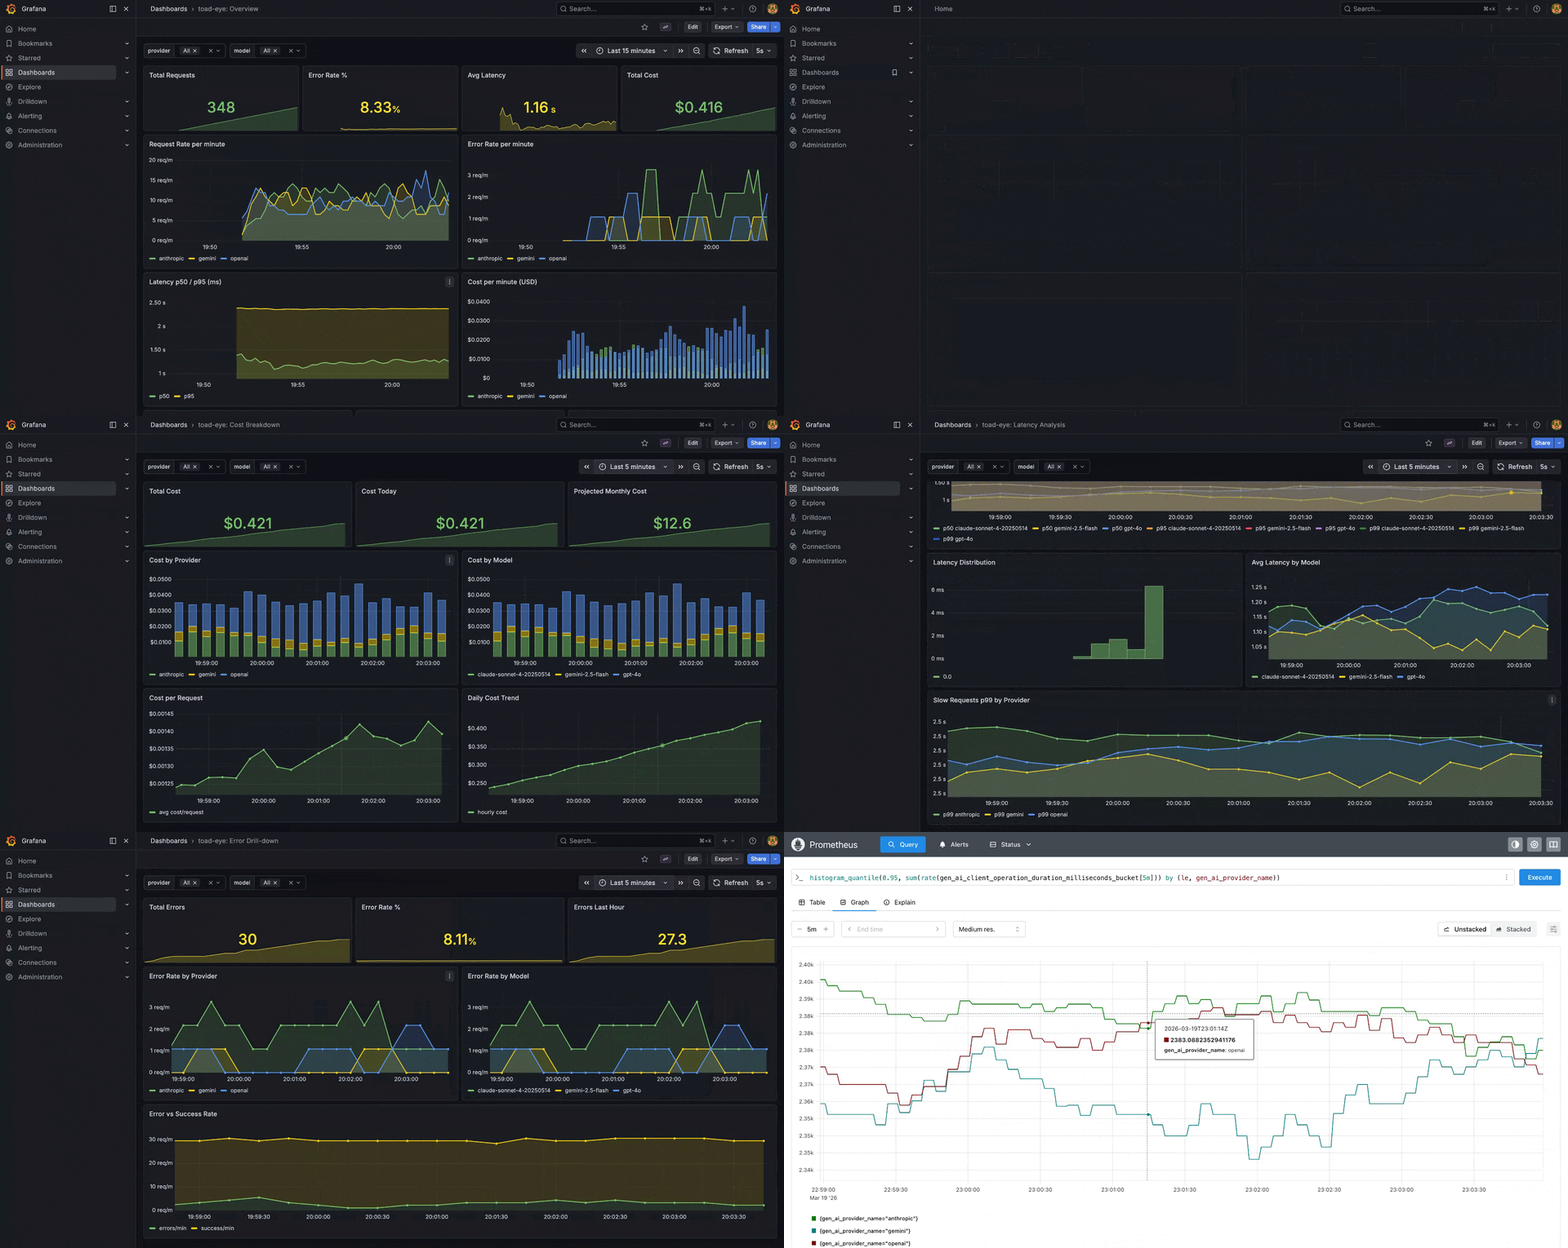
|
|
18
15
|
|
|
19
|
-
|
|
20
|
-
|
|
21
|
-
**Prerequisites:** [Docker Desktop](https://docs.docker.com/get-started/get-docker/) (or Docker Engine + Compose plugin)
|
|
16
|
+
---
|
|
22
17
|
|
|
23
|
-
|
|
24
|
-
npm install toad-eye
|
|
25
|
-
npx toad-eye init # scaffold observability stack
|
|
26
|
-
npx toad-eye up # start Grafana + Prometheus + Jaeger
|
|
27
|
-
npx toad-eye demo # send mock LLM traffic, see data immediately
|
|
28
|
-
```
|
|
18
|
+
## Quick Start — MCP Server
|
|
29
19
|
|
|
30
|
-
|
|
20
|
+
Add observability to any MCP server in 2 lines:
|
|
31
21
|
|
|
32
22
|
```typescript
|
|
23
|
+
import { McpServer } from "@modelcontextprotocol/sdk/server/mcp.js";
|
|
33
24
|
import { initObservability } from "toad-eye";
|
|
25
|
+
import { toadEyeMiddleware } from "toad-eye/mcp";
|
|
34
26
|
|
|
35
|
-
initObservability({
|
|
36
|
-
serviceName: "my-app",
|
|
37
|
-
instrument: ["openai", "anthropic"],
|
|
38
|
-
});
|
|
39
|
-
|
|
40
|
-
// That's it. Every SDK call is auto-traced — including streaming.
|
|
41
|
-
```
|
|
42
|
-
|
|
43
|
-
> ⚠️ By default, toad-eye records prompt and completion text in spans. Set `recordContent: false` for PII-sensitive workloads (healthcare, finance, legal).
|
|
44
|
-
|
|
45
|
-
Open [localhost:3100](http://localhost:3100) (Grafana, admin/admin) to see your dashboards.
|
|
27
|
+
initObservability({ serviceName: "my-mcp-server" });
|
|
46
28
|
|
|
47
|
-
|
|
29
|
+
const server = new McpServer({ name: "my-server", version: "1.0.0" });
|
|
30
|
+
toadEyeMiddleware(server);
|
|
48
31
|
|
|
49
|
-
|
|
50
|
-
|
|
51
|
-
|
|
52
|
-
| **8 Grafana dashboards** | Overview, Cost, Latency, Errors, Model Comparison, FinOps, Provider Health, Agent Workflow |
|
|
53
|
-
| **Cost tracking** | Per-request USD cost, daily totals, projected monthly spend |
|
|
54
|
-
| **Budget guards** | Daily/per-user/per-model spend limits — warn, block, or auto-downgrade |
|
|
55
|
-
| **Privacy controls** | Built-in PII redaction (email, SSN, CC, phone), hashing, content masking |
|
|
32
|
+
// Every tool call, resource read, and prompt is now traced.
|
|
33
|
+
// Spans appear in Jaeger. Metrics flow to Prometheus. Dashboards ready in Grafana.
|
|
34
|
+
```
|
|
56
35
|
|
|
57
|
-
|
|
58
|
-
<summary>Advanced features</summary>
|
|
36
|
+
Privacy by default — tool arguments and results are NOT recorded unless you opt in:
|
|
59
37
|
|
|
60
|
-
|
|
61
|
-
|
|
62
|
-
|
|
63
|
-
|
|
64
|
-
|
|
65
|
-
|
|
66
|
-
| **Tail sampling** | Keep 100% errors + slow traces, sample healthy traffic via OTel Collector |
|
|
67
|
-
| **Alerting** | Cost spikes, latency anomalies, error rate — via Telegram, Slack, email, webhook |
|
|
68
|
-
| **FinOps attribution** | Break down costs by team, user, feature, environment |
|
|
69
|
-
| **TTFT metric** | Time To First Token for streaming — separate from total duration |
|
|
70
|
-
| **Trace export** | Convert production Jaeger traces into regression test cases |
|
|
38
|
+
```typescript
|
|
39
|
+
toadEyeMiddleware(server, {
|
|
40
|
+
recordInputs: true,
|
|
41
|
+
redactKeys: ["apiKey", "token"],
|
|
42
|
+
});
|
|
43
|
+
```
|
|
71
44
|
|
|
72
|
-
|
|
45
|
+
Safe for stdio transport — OTel diagnostics are redirected to stderr.
|
|
73
46
|
|
|
74
|
-
##
|
|
47
|
+
## Quick Start — LLM Calls
|
|
75
48
|
|
|
76
|
-
|
|
49
|
+
Auto-instrument OpenAI, Anthropic, Gemini, and Vercel AI SDK — zero wrappers:
|
|
77
50
|
|
|
78
51
|
```typescript
|
|
52
|
+
import { initObservability } from "toad-eye";
|
|
53
|
+
|
|
79
54
|
initObservability({
|
|
80
55
|
serviceName: "my-app",
|
|
81
56
|
instrument: ["openai", "anthropic"],
|
|
82
57
|
});
|
|
83
|
-
```
|
|
84
|
-
|
|
85
|
-
**Supported SDKs:** OpenAI (`openai`), Anthropic (`@anthropic-ai/sdk`), Google GenAI (`@google/generative-ai`), Vercel AI SDK (`ai`)
|
|
86
|
-
|
|
87
|
-
Both regular and **streaming** calls are fully instrumented — spans, metrics, and cost tracking work transparently for `stream: true`.
|
|
88
|
-
|
|
89
|
-
Vercel AI SDK uses a SpanProcessor (not monkey-patching) — add `instrument: ['ai']` and `experimental_telemetry: withToadEye()` to your calls.
|
|
90
|
-
|
|
91
|
-
<details>
|
|
92
|
-
<summary>Manual instrumentation (custom providers)</summary>
|
|
93
|
-
|
|
94
|
-
Use `traceLLMCall` when you need to instrument a provider not in the auto-instrument list, or want explicit control over span data:
|
|
95
58
|
|
|
96
|
-
|
|
97
|
-
import OpenAI from "openai";
|
|
98
|
-
import { initObservability, traceLLMCall } from "toad-eye";
|
|
99
|
-
|
|
100
|
-
initObservability({ serviceName: "my-app" });
|
|
101
|
-
|
|
102
|
-
const openai = new OpenAI();
|
|
103
|
-
|
|
104
|
-
const result = await traceLLMCall(
|
|
105
|
-
{ provider: "openai", model: "gpt-4o", prompt: "Hello" },
|
|
106
|
-
async () => {
|
|
107
|
-
const res = await openai.chat.completions.create({
|
|
108
|
-
model: "gpt-4o",
|
|
109
|
-
messages: [{ role: "user", content: "Hello" }],
|
|
110
|
-
});
|
|
111
|
-
return {
|
|
112
|
-
completion: res.choices[0]?.message.content ?? "",
|
|
113
|
-
inputTokens: res.usage?.prompt_tokens ?? 0,
|
|
114
|
-
outputTokens: res.usage?.completion_tokens ?? 0,
|
|
115
|
-
// cost is auto-calculated from model + tokens if omitted
|
|
116
|
-
};
|
|
117
|
-
},
|
|
118
|
-
);
|
|
59
|
+
// Every SDK call is auto-traced — including streaming.
|
|
119
60
|
```
|
|
120
61
|
|
|
121
|
-
|
|
62
|
+
## Set Up the Stack
|
|
122
63
|
|
|
123
|
-
|
|
64
|
+
```bash
|
|
65
|
+
npm install toad-eye
|
|
66
|
+
npx toad-eye init # scaffold observability configs
|
|
67
|
+
npx toad-eye up # start Grafana + Prometheus + Jaeger + OTel Collector
|
|
68
|
+
npx toad-eye demo # send mock traffic — see data in Grafana immediately
|
|
69
|
+
```
|
|
124
70
|
|
|
125
|
-
|
|
71
|
+
Open [localhost:3100](http://localhost:3100) (Grafana, admin/admin). 11 dashboards are pre-built and ready.
|
|
126
72
|
|
|
127
|
-
|
|
128
|
-
<summary>MCP Server observability</summary>
|
|
73
|
+
> **Requires:** [Docker Desktop](https://docs.docker.com/get-started/get-docker/) (or Docker Engine + Compose plugin)
|
|
129
74
|
|
|
130
|
-
|
|
75
|
+
<!-- TODO: add Grafana dashboard screenshot here -->
|
|
131
76
|
|
|
132
|
-
|
|
133
|
-
import { McpServer } from "@modelcontextprotocol/sdk/server/index.js";
|
|
134
|
-
import { toadEyeMiddleware } from "toad-eye/mcp";
|
|
77
|
+
## What You Get
|
|
135
78
|
|
|
136
|
-
|
|
137
|
-
toadEyeMiddleware(server);
|
|
79
|
+
**Instrumentation:** auto-instrument OpenAI, Anthropic, Gemini, Vercel AI SDK, and MCP servers — regular and streaming calls, with full cost tracking.
|
|
138
80
|
|
|
139
|
-
|
|
140
|
-
server.tool("calculate", { expression: z.string() }, async ({ expression }) => {
|
|
141
|
-
return { content: [{ type: "text", text: String(eval(expression)) }] };
|
|
142
|
-
});
|
|
143
|
-
```
|
|
81
|
+
**11 Grafana dashboards:** Overview, Cost Breakdown, Latency Analysis, Errors, Model Comparison, FinOps Attribution, Provider Health, Agent Workflow, MCP Server, MCP End-to-End, MCP Tool Analytics.
|
|
144
82
|
|
|
145
|
-
|
|
83
|
+
**Budget guards:** daily, per-user, per-model spend limits. Three modes — warn, block, or auto-downgrade to a cheaper model.
|
|
146
84
|
|
|
147
|
-
|
|
85
|
+
**Agent tracing:** structured ReAct tracing with multi-agent support, handoffs, and loop detection. Follows OTel GenAI semantic conventions.
|
|
148
86
|
|
|
149
|
-
|
|
150
|
-
toadEyeMiddleware(server, {
|
|
151
|
-
recordInputs: true,
|
|
152
|
-
redactKeys: ["apiKey", "token"],
|
|
153
|
-
});
|
|
154
|
-
```
|
|
87
|
+
**Privacy controls:** `recordContent: false` to disable prompt/completion recording, built-in PII redaction (email, SSN, CC, phone), SHA-256 hashing, key redaction.
|
|
155
88
|
|
|
156
|
-
|
|
89
|
+
**Alerting:** cost spikes, latency anomalies, error rate alerts via Telegram, Slack, email, or webhook.
|
|
157
90
|
|
|
158
|
-
|
|
91
|
+
**Semantic drift detection:** catch silent LLM quality degradation by comparing responses to a saved baseline via embeddings.
|
|
159
92
|
|
|
160
|
-
|
|
93
|
+
**Trace export:** convert production Jaeger traces into regression test cases for [toad-eval](https://github.com/vola-trebla/toad-eval).
|
|
161
94
|
|
|
162
|
-
|
|
95
|
+
## Budget Guards
|
|
163
96
|
|
|
164
97
|
```typescript
|
|
165
98
|
initObservability({
|
|
@@ -169,326 +102,71 @@ initObservability({
|
|
|
169
102
|
perUser: 5, // $5/day per user
|
|
170
103
|
perModel: { "gpt-4o": 30 }, // $30/day on GPT-4o
|
|
171
104
|
},
|
|
172
|
-
onBudgetExceeded: "block", //
|
|
105
|
+
onBudgetExceeded: "block", // or "warn" or "downgrade"
|
|
173
106
|
});
|
|
174
107
|
```
|
|
175
108
|
|
|
176
|
-
|
|
177
|
-
| ----------- | --------------------------------------------------- |
|
|
178
|
-
| `warn` | Log warning, continue normally |
|
|
179
|
-
| `block` | Throw `ToadBudgetExceededError` before LLM call |
|
|
180
|
-
| `downgrade` | Call `downgradeCallback` to switch to cheaper model |
|
|
181
|
-
|
|
182
|
-
## Agent observability
|
|
183
|
-
|
|
184
|
-
Structured tracing for ReAct agents with multi-agent support, handoffs, and loop detection. Span names follow [OTel GenAI semantic conventions](https://opentelemetry.io/docs/specs/semconv/gen-ai/gen-ai-agent-spans/).
|
|
109
|
+
## Agent Observability
|
|
185
110
|
|
|
186
111
|
```typescript
|
|
187
112
|
import { traceAgentQuery } from "toad-eye";
|
|
188
113
|
|
|
189
114
|
const result = await traceAgentQuery(
|
|
190
|
-
{
|
|
191
|
-
query: "What's the weather like?",
|
|
192
|
-
agentName: "weather-bot", // → gen_ai.agent.name (OTel semconv)
|
|
193
|
-
},
|
|
115
|
+
{ query: "What's the weather?", agentName: "weather-bot" },
|
|
194
116
|
async (step) => {
|
|
195
117
|
step({ type: "think", stepNumber: 1, content: "Need weather data" });
|
|
196
118
|
const data = await getWeather();
|
|
197
|
-
step({
|
|
198
|
-
type: "act",
|
|
199
|
-
stepNumber: 2,
|
|
200
|
-
toolName: "get_weather",
|
|
201
|
-
toolType: "function",
|
|
202
|
-
});
|
|
119
|
+
step({ type: "act", stepNumber: 2, toolName: "get_weather" });
|
|
203
120
|
step({ type: "answer", stepNumber: 3, content: data.summary });
|
|
204
121
|
return { answer: data.summary };
|
|
205
122
|
},
|
|
206
123
|
);
|
|
207
|
-
// Produces
|
|
208
|
-
```
|
|
209
|
-
|
|
210
|
-
<details>
|
|
211
|
-
<summary>Full ReAct pattern (think → act → observe → answer)</summary>
|
|
212
|
-
|
|
213
|
-
```typescript
|
|
214
|
-
const result = await traceAgentQuery(
|
|
215
|
-
"Is anything dangerous near Earth?",
|
|
216
|
-
async (step) => {
|
|
217
|
-
step({
|
|
218
|
-
type: "think",
|
|
219
|
-
stepNumber: 1,
|
|
220
|
-
content: "I need to check asteroids",
|
|
221
|
-
});
|
|
222
|
-
const data = await callTool("near-earth-asteroids");
|
|
223
|
-
step({ type: "act", stepNumber: 2, toolName: "near-earth-asteroids" });
|
|
224
|
-
step({
|
|
225
|
-
type: "observe",
|
|
226
|
-
stepNumber: 3,
|
|
227
|
-
content: `${data.length} asteroids found`,
|
|
228
|
-
});
|
|
229
|
-
step({
|
|
230
|
-
type: "answer",
|
|
231
|
-
stepNumber: 4,
|
|
232
|
-
content: "7 asteroids passing safely",
|
|
233
|
-
});
|
|
234
|
-
return { answer: "7 asteroids passing safely" };
|
|
235
|
-
},
|
|
236
|
-
);
|
|
237
|
-
```
|
|
238
|
-
|
|
239
|
-
</details>
|
|
240
|
-
|
|
241
|
-
## FinOps attribution
|
|
242
|
-
|
|
243
|
-
Track costs by team, user, feature, or any business dimension:
|
|
244
|
-
|
|
245
|
-
```typescript
|
|
246
|
-
initObservability({
|
|
247
|
-
serviceName: "my-app",
|
|
248
|
-
attributes: { team: "checkout", environment: "production" },
|
|
249
|
-
});
|
|
250
|
-
|
|
251
|
-
await traceLLMCall(
|
|
252
|
-
{
|
|
253
|
-
provider: "openai",
|
|
254
|
-
model: "gpt-4o",
|
|
255
|
-
prompt: "Summarize order",
|
|
256
|
-
attributes: { userId: "user-123", feature: "order-summary" },
|
|
257
|
-
},
|
|
258
|
-
() => callLLM(),
|
|
259
|
-
);
|
|
260
|
-
```
|
|
261
|
-
|
|
262
|
-
<details>
|
|
263
|
-
<summary>More features</summary>
|
|
264
|
-
|
|
265
|
-
### Shadow guardrails
|
|
266
|
-
|
|
267
|
-
Record what _would_ have been blocked without blocking. Tune thresholds on live traffic.
|
|
268
|
-
|
|
269
|
-
```typescript
|
|
270
|
-
import { recordGuardResult } from "toad-eye";
|
|
271
|
-
|
|
272
|
-
recordGuardResult({
|
|
273
|
-
mode: "shadow",
|
|
274
|
-
passed: false,
|
|
275
|
-
ruleName: "pii_filter",
|
|
276
|
-
failureReason: "SSN detected in response",
|
|
277
|
-
});
|
|
278
|
-
```
|
|
279
|
-
|
|
280
|
-
### Semantic drift monitoring
|
|
281
|
-
|
|
282
|
-
Detect silent LLM quality degradation by comparing responses to a saved baseline via embeddings.
|
|
283
|
-
|
|
284
|
-
```typescript
|
|
285
|
-
import { createDriftMonitor } from "toad-eye";
|
|
286
|
-
|
|
287
|
-
const monitor = createDriftMonitor({
|
|
288
|
-
embedding: { provider: "openai", apiKey: process.env.OPENAI_API_KEY! },
|
|
289
|
-
baselinePath: "./baseline.json",
|
|
290
|
-
sampleRate: 10,
|
|
291
|
-
});
|
|
292
|
-
|
|
293
|
-
monitor.checkInBackground(response, "openai", "gpt-4o");
|
|
294
|
-
```
|
|
295
|
-
|
|
296
|
-
### Privacy controls
|
|
297
|
-
|
|
298
|
-
| Goal | Config |
|
|
299
|
-
| --------------------------- | -------------------------------- |
|
|
300
|
-
| Don't store text at all | `recordContent: false` |
|
|
301
|
-
| Remove common PII | `redactDefaults: true` |
|
|
302
|
-
| Remove custom patterns | `redactPatterns: [/regex/g]` |
|
|
303
|
-
| Store hashes only (no text) | `hashContent: true, salt: "..."` |
|
|
304
|
-
| Audit what was masked | `auditMasking: true` |
|
|
305
|
-
|
|
306
|
-
```typescript
|
|
307
|
-
initObservability({
|
|
308
|
-
serviceName: "my-app",
|
|
309
|
-
redactDefaults: true, // built-in PII patterns (email, SSN, CC, phone)
|
|
310
|
-
recordContent: false, // disable prompt/completion recording
|
|
311
|
-
hashContent: true, // SHA-256 hash instead of plain text
|
|
312
|
-
salt: "my-secret", // prevent rainbow table attacks
|
|
313
|
-
auditMasking: true, // log what was masked (debug only)
|
|
314
|
-
redactPatterns: [/custom-pattern/g], // additional regex redaction
|
|
315
|
-
});
|
|
316
|
-
```
|
|
317
|
-
|
|
318
|
-
### Session tracking
|
|
319
|
-
|
|
320
|
-
```typescript
|
|
321
|
-
initObservability({
|
|
322
|
-
serviceName: "my-app",
|
|
323
|
-
sessionId: "static-session-id",
|
|
324
|
-
sessionExtractor: () => getCurrentSessionId(), // or dynamic
|
|
325
|
-
});
|
|
326
|
-
```
|
|
327
|
-
|
|
328
|
-
### Built-in cost tracking
|
|
329
|
-
|
|
330
|
-
```typescript
|
|
331
|
-
import { setCustomPricing } from "toad-eye";
|
|
332
|
-
|
|
333
|
-
setCustomPricing({
|
|
334
|
-
"my-fine-tuned-model": { inputPer1M: 5, outputPer1M: 15 },
|
|
335
|
-
});
|
|
124
|
+
// Produces: invoke_agent weather-bot → execute_tool get_weather
|
|
336
125
|
```
|
|
337
126
|
|
|
338
|
-
|
|
339
|
-
|
|
340
|
-
```yaml
|
|
341
|
-
alerts:
|
|
342
|
-
- name: cost_spike
|
|
343
|
-
metric: gen_ai.client.request.cost
|
|
344
|
-
condition: sum_1h > 10
|
|
345
|
-
channels: [slack]
|
|
127
|
+
## CLI
|
|
346
128
|
|
|
347
|
-
- name: error_rate
|
|
348
|
-
metric: gen_ai.client.errors
|
|
349
|
-
condition: ratio_15m > 0.05
|
|
350
|
-
channels: [telegram]
|
|
351
129
|
```
|
|
352
|
-
|
|
353
|
-
|
|
354
|
-
|
|
355
|
-
|
|
356
|
-
|
|
357
|
-
|
|
358
|
-
|
|
359
|
-
```bash
|
|
360
|
-
npx toad-eye export-trace <trace_id> --output ./evals/
|
|
130
|
+
npx toad-eye init [--force] Scaffold Docker Compose + observability configs
|
|
131
|
+
npx toad-eye up Start the stack
|
|
132
|
+
npx toad-eye down Stop the stack
|
|
133
|
+
npx toad-eye status Show running services and URLs
|
|
134
|
+
npx toad-eye demo Send mock LLM traffic to Grafana
|
|
135
|
+
npx toad-eye export-trace <id> Export a Jaeger trace to toad-eval YAML
|
|
361
136
|
```
|
|
362
137
|
|
|
363
|
-
|
|
364
|
-
|
|
365
|
-
No Docker needed. Send telemetry to toad-eye cloud with one line:
|
|
366
|
-
|
|
367
|
-
```typescript
|
|
368
|
-
initObservability({
|
|
369
|
-
serviceName: "my-app",
|
|
370
|
-
apiKey: "toad_xxxxxxxx",
|
|
371
|
-
instrument: ["openai"],
|
|
372
|
-
});
|
|
373
|
-
```
|
|
374
|
-
|
|
375
|
-
Self-hosted mode remains the default. Cloud mode activates automatically when `apiKey` is set.
|
|
376
|
-
|
|
377
|
-
</details>
|
|
378
|
-
|
|
379
|
-
## Grafana dashboards
|
|
380
|
-
|
|
381
|
-
8 pre-built dashboards auto-provisioned on `npx toad-eye init`:
|
|
382
|
-
|
|
383
|
-
| Dashboard | What it shows |
|
|
384
|
-
| ---------------------- | ---------------------------------------------------------------- |
|
|
385
|
-
| **Overview** | Request rate, error rate, latency p50/p95, cost, totals |
|
|
386
|
-
| **Cost Breakdown** | Spend by provider/model, daily trend, projected monthly |
|
|
387
|
-
| **Latency Analysis** | p50/p95/p99 by model, distribution histogram, TTFT |
|
|
388
|
-
| **Error Drill-down** | Error rate by provider/model, error vs success |
|
|
389
|
-
| **Model Comparison** | Latency vs cost vs error rate vs throughput per model |
|
|
390
|
-
| **FinOps Attribution** | Cost by team/user/feature, projected spend, what-if table |
|
|
391
|
-
| **Provider Health** | Provider status (healthy/degraded/down), uptime, error breakdown |
|
|
392
|
-
| **Agent Workflow** | Steps per query, tool usage frequency, step type breakdown |
|
|
138
|
+
## Architecture
|
|
393
139
|
|
|
394
|
-
|
|
140
|
+

|
|
395
141
|
|
|
396
|
-
|
|
142
|
+
## Imports
|
|
397
143
|
|
|
398
144
|
```typescript
|
|
399
145
|
import { initObservability, traceLLMCall } from "toad-eye"; // core
|
|
400
|
-
import {
|
|
146
|
+
import { toadEyeMiddleware } from "toad-eye/mcp"; // MCP server middleware
|
|
147
|
+
import { AlertManager } from "toad-eye/alerts"; // alerting engine
|
|
401
148
|
import { createDriftMonitor } from "toad-eye/drift"; // semantic drift
|
|
402
149
|
import { exportTrace } from "toad-eye/export"; // trace → YAML
|
|
403
150
|
import { ToadEyeAISpanProcessor, withToadEye } from "toad-eye/vercel"; // Vercel AI SDK
|
|
404
151
|
```
|
|
405
152
|
|
|
406
|
-
> Everything is also re-exported from the main `"toad-eye"` entry point for convenience.
|
|
407
|
-
|
|
408
|
-
## CLI
|
|
409
|
-
|
|
410
|
-
| Command | Description |
|
|
411
|
-
| -------------------------------- | ----------------------------------------------- |
|
|
412
|
-
| `npx toad-eye init [--force]` | Scaffold Docker Compose + observability configs |
|
|
413
|
-
| `npx toad-eye up` | Start the stack |
|
|
414
|
-
| `npx toad-eye down` | Stop the stack |
|
|
415
|
-
| `npx toad-eye status` | Show running services and URLs |
|
|
416
|
-
| `npx toad-eye demo` | Send mock LLM traffic to see data in Grafana |
|
|
417
|
-
| `npx toad-eye export-trace <id>` | Export a Jaeger trace to toad-eval YAML |
|
|
418
|
-
|
|
419
|
-
## Architecture
|
|
420
|
-
|
|
421
|
-

|
|
422
|
-
|
|
423
|
-
## What it tracks
|
|
424
|
-
|
|
425
|
-
<details>
|
|
426
|
-
<summary>Metrics & span attributes</summary>
|
|
427
|
-
|
|
428
|
-
### Metrics (OTel GenAI semconv)
|
|
429
|
-
|
|
430
|
-
| Metric | Type | Description |
|
|
431
|
-
| -------------------------------------------- | --------- | --------------------------- |
|
|
432
|
-
| `gen_ai.client.operation.duration` | Histogram | Request latency (ms) |
|
|
433
|
-
| `gen_ai.client.time_to_first_token` | Histogram | TTFT for streaming (ms) |
|
|
434
|
-
| `gen_ai.client.request.cost` | Histogram | Cost per request (USD) |
|
|
435
|
-
| `gen_ai.client.token.usage` | Counter | Total tokens consumed |
|
|
436
|
-
| `gen_ai.client.requests` | Counter | Total requests |
|
|
437
|
-
| `gen_ai.client.errors` | Counter | Total failed requests |
|
|
438
|
-
| `gen_ai.agent.steps_per_query` | Histogram | Agent steps per query |
|
|
439
|
-
| `gen_ai.agent.tool_usage` | Counter | Agent tool invocations |
|
|
440
|
-
| `gen_ai.toad_eye.guard.evaluations` | Counter | Guard evaluations per rule |
|
|
441
|
-
| `gen_ai.toad_eye.guard.would_block` | Counter | Would-have-blocked per rule |
|
|
442
|
-
| `gen_ai.toad_eye.semantic_drift` | Histogram | Drift from baseline (0..1) |
|
|
443
|
-
| `gen_ai.toad_eye.budget.exceeded` | Counter | Budget exceeded events |
|
|
444
|
-
| `gen_ai.toad_eye.budget.blocked` | Counter | LLM calls blocked by budget |
|
|
445
|
-
| `gen_ai.toad_eye.budget.downgraded` | Counter | LLM calls downgraded |
|
|
446
|
-
| `gen_ai.toad_eye.response.empty` | Counter | Empty/whitespace responses |
|
|
447
|
-
| `gen_ai.toad_eye.response.latency_per_token` | Histogram | Generation speed (ms/token) |
|
|
448
|
-
|
|
449
|
-
### Span attributes (OTel GenAI semconv)
|
|
450
|
-
|
|
451
|
-
| Attribute | Description |
|
|
452
|
-
| ---------------------------------- | ----------------------------------------------- |
|
|
453
|
-
| `gen_ai.operation.name` | `chat`, `invoke_agent`, `execute_tool` |
|
|
454
|
-
| `gen_ai.provider.name` | `anthropic`, `gemini`, `openai` |
|
|
455
|
-
| `gen_ai.request.model` | Model identifier |
|
|
456
|
-
| `gen_ai.usage.input_tokens` | Tokens in the prompt |
|
|
457
|
-
| `gen_ai.usage.output_tokens` | Tokens in the completion |
|
|
458
|
-
| `gen_ai.request.temperature` | Temperature parameter |
|
|
459
|
-
| `gen_ai.agent.name` | Agent name (for agent spans) |
|
|
460
|
-
| `gen_ai.agent.id` | Agent identifier |
|
|
461
|
-
| `gen_ai.tool.name` | Tool name for execute_tool spans |
|
|
462
|
-
| `gen_ai.tool.type` | `function`, `extension`, `retrieval`, `builtin` |
|
|
463
|
-
| `gen_ai.toad_eye.cost` | Cost in USD |
|
|
464
|
-
| `gen_ai.toad_eye.agent.step.type` | ReAct step: think/act/observe/answer/handoff |
|
|
465
|
-
| `gen_ai.toad_eye.agent.handoff.to` | Target agent for handoff steps |
|
|
466
|
-
| `gen_ai.toad_eye.agent.loop_count` | Agent loop iterations (observe→think) |
|
|
467
|
-
| `gen_ai.toad_eye.guard.mode` | Guard mode: shadow/enforce |
|
|
468
|
-
| `session.id` | Session identifier (if configured) |
|
|
469
|
-
|
|
470
|
-
</details>
|
|
471
|
-
|
|
472
153
|
## Services
|
|
473
154
|
|
|
474
|
-
|
|
475
|
-
| -------------- | ------------------------------------------------------- |
|
|
476
|
-
| Grafana | [localhost:3100](http://localhost:3100) (admin / admin) |
|
|
477
|
-
| Jaeger UI | [localhost:16686](http://localhost:16686) |
|
|
478
|
-
| Prometheus | [localhost:9090](http://localhost:9090) |
|
|
479
|
-
| OTel Collector | [localhost:4318](http://localhost:4318) |
|
|
155
|
+
After `npx toad-eye up`:
|
|
480
156
|
|
|
481
|
-
|
|
157
|
+
```
|
|
158
|
+
Grafana http://localhost:3100 (admin / admin)
|
|
159
|
+
Jaeger UI http://localhost:16686
|
|
160
|
+
Prometheus http://localhost:9090
|
|
161
|
+
OTel Collector http://localhost:4318
|
|
162
|
+
```
|
|
482
163
|
|
|
483
|
-
|
|
164
|
+
## OTel Compatibility
|
|
484
165
|
|
|
485
|
-
|
|
166
|
+
toad-eye follows [OTel GenAI semantic conventions](https://opentelemetry.io/docs/specs/semconv/gen-ai/). Traces work natively with Jaeger, Datadog, Grafana Tempo, Honeycomb, SigNoz, Arize Phoenix, and any OTel-compatible backend.
|
|
486
167
|
|
|
487
|
-
|
|
168
|
+
Full metrics and span attribute reference: [COMPATIBILITY.md](https://github.com/vola-trebla/toad-eye/blob/main/packages/instrumentation/COMPATIBILITY.md)
|
|
488
169
|
|
|
489
|
-
## Tech
|
|
170
|
+
## Tech Stack
|
|
490
171
|
|
|
491
|
-
|
|
492
|
-
- Hono (demo server + cloud ingestion server)
|
|
493
|
-
- Docker Compose (Prometheus, Jaeger, Grafana, OTel Collector)
|
|
494
|
-
- Vitest (252+ tests)
|
|
172
|
+
TypeScript · OpenTelemetry SDK 2.x · Hono · Docker Compose (Prometheus, Jaeger, Grafana, OTel Collector) · Vitest (273+ tests)
|
|
@@ -5,6 +5,12 @@ const METRIC_MAP = {
|
|
|
5
5
|
"gen_ai.client.requests": "gen_ai_client_requests_total",
|
|
6
6
|
"gen_ai.client.errors": "gen_ai_client_errors_total",
|
|
7
7
|
"gen_ai.client.token.usage": "gen_ai_client_token_usage_total",
|
|
8
|
+
// MCP metrics
|
|
9
|
+
"gen_ai.mcp.tool.calls": "gen_ai_mcp_tool_calls_total",
|
|
10
|
+
"gen_ai.mcp.tool.errors": "gen_ai_mcp_tool_errors_total",
|
|
11
|
+
"gen_ai.mcp.tool.duration": "gen_ai_mcp_tool_duration",
|
|
12
|
+
"gen_ai.mcp.resource.reads": "gen_ai_mcp_resource_reads_total",
|
|
13
|
+
"gen_ai.mcp.tool.callers": "gen_ai_mcp_tool_callers_total",
|
|
8
14
|
// Legacy names (backward compat)
|
|
9
15
|
"llm.request.cost": "gen_ai_client_request_cost_USD_sum",
|
|
10
16
|
"llm.request.duration": "gen_ai_client_operation_duration_milliseconds",
|
|
@@ -15,6 +21,9 @@ const METRIC_MAP = {
|
|
|
15
21
|
function toPromMetric(metric) {
|
|
16
22
|
return METRIC_MAP[metric] ?? metric.replace(/\./g, "_");
|
|
17
23
|
}
|
|
24
|
+
function isMcpMetric(metric) {
|
|
25
|
+
return metric.startsWith("gen_ai.mcp.");
|
|
26
|
+
}
|
|
18
27
|
/**
|
|
19
28
|
* Parse condition string into structured form.
|
|
20
29
|
*
|
|
@@ -65,7 +74,10 @@ function buildPromQL(metric, operator, window) {
|
|
|
65
74
|
}
|
|
66
75
|
function buildTopModelsQuery(metric, window) {
|
|
67
76
|
const m = toPromMetric(metric);
|
|
68
|
-
|
|
77
|
+
const groupBy = isMcpMetric(metric)
|
|
78
|
+
? "gen_ai_tool_name"
|
|
79
|
+
: "gen_ai_request_model";
|
|
80
|
+
return `topk(5, sum by (${groupBy}) (increase(${m}[${window}])))`;
|
|
69
81
|
}
|
|
70
82
|
function matches(value, comparator, threshold) {
|
|
71
83
|
switch (comparator) {
|
|
@@ -94,10 +106,13 @@ async function queryTopModels(prometheusUrl, metric, window) {
|
|
|
94
106
|
const res = await fetch(url);
|
|
95
107
|
if (!res.ok)
|
|
96
108
|
return [];
|
|
109
|
+
const labelKey = isMcpMetric(metric)
|
|
110
|
+
? "gen_ai_tool_name"
|
|
111
|
+
: "gen_ai_request_model";
|
|
97
112
|
const data = (await res.json());
|
|
98
113
|
return data.data.result
|
|
99
114
|
.map((r) => ({
|
|
100
|
-
model: r.metric
|
|
115
|
+
model: r.metric[labelKey] ?? "unknown",
|
|
101
116
|
value: parseFloat(r.value[1]),
|
|
102
117
|
}))
|
|
103
118
|
.sort((a, b) => b.value - a.value);
|
|
@@ -113,9 +128,19 @@ async function evalP95Baseline(prometheusUrl, metric, window, baselineWindow) {
|
|
|
113
128
|
return ((currentP95 - baselineP95) / baselineP95) * 100;
|
|
114
129
|
}
|
|
115
130
|
/** Evaluate error ratio: errors / requests over window */
|
|
116
|
-
async function evalErrorRatio(prometheusUrl, window) {
|
|
117
|
-
|
|
118
|
-
|
|
131
|
+
async function evalErrorRatio(prometheusUrl, metric, window) {
|
|
132
|
+
let errorMetric;
|
|
133
|
+
let requestMetric;
|
|
134
|
+
if (isMcpMetric(metric)) {
|
|
135
|
+
errorMetric = "gen_ai_mcp_tool_errors_total";
|
|
136
|
+
requestMetric = "gen_ai_mcp_tool_calls_total";
|
|
137
|
+
}
|
|
138
|
+
else {
|
|
139
|
+
errorMetric = "gen_ai_client_errors_total";
|
|
140
|
+
requestMetric = "gen_ai_client_requests_total";
|
|
141
|
+
}
|
|
142
|
+
const errors = await queryScalar(prometheusUrl, `sum(increase(${errorMetric}[${window}]))`);
|
|
143
|
+
const requests = await queryScalar(prometheusUrl, `sum(increase(${requestMetric}[${window}]))`);
|
|
119
144
|
if (requests === 0)
|
|
120
145
|
return 0;
|
|
121
146
|
return errors / requests;
|
|
@@ -128,7 +153,7 @@ export async function evaluateCondition(prometheusUrl, rule) {
|
|
|
128
153
|
value = await evalP95Baseline(prometheusUrl, rule.metric, parsed.window, parsed.baselineWindow);
|
|
129
154
|
}
|
|
130
155
|
else if (parsed.operator === "ratio") {
|
|
131
|
-
value = await evalErrorRatio(prometheusUrl, parsed.window);
|
|
156
|
+
value = await evalErrorRatio(prometheusUrl, rule.metric, parsed.window);
|
|
132
157
|
}
|
|
133
158
|
else {
|
|
134
159
|
const promql = buildPromQL(rule.metric, parsed.operator, parsed.window);
|
package/dist/alerts/grafana.js
CHANGED
|
@@ -2,8 +2,13 @@ export async function postGrafanaAnnotation(grafanaUrl, alert, apiKey) {
|
|
|
2
2
|
const headers = {
|
|
3
3
|
"Content-Type": "application/json",
|
|
4
4
|
};
|
|
5
|
-
if (apiKey)
|
|
5
|
+
if (apiKey) {
|
|
6
6
|
headers["Authorization"] = `Bearer ${apiKey}`;
|
|
7
|
+
}
|
|
8
|
+
else {
|
|
9
|
+
// Fall back to Basic Auth with default Grafana credentials
|
|
10
|
+
headers["Authorization"] = `Basic ${btoa("admin:admin")}`;
|
|
11
|
+
}
|
|
7
12
|
const res = await fetch(`${grafanaUrl}/api/annotations`, {
|
|
8
13
|
method: "POST",
|
|
9
14
|
headers,
|