toad-eye 2.1.0 → 2.2.0
This diff represents the content of publicly available package versions that have been released to one of the supported registries. The information contained in this diff is provided for informational purposes only and reflects changes between package versions as they appear in their respective public registries.
- package/README.md +290 -109
- package/dist/core/metrics.d.ts +1 -0
- package/dist/core/metrics.js +11 -0
- package/dist/core/pricing.js +2 -0
- package/dist/core/spans.js +8 -2
- package/dist/core/tracer.js +4 -1
- package/dist/drift/monitor.js +5 -1
- package/dist/drift/openai-embeddings.js +5 -1
- package/dist/export.js +1 -1
- package/dist/guard.d.ts +6 -8
- package/dist/guard.js +19 -21
- package/dist/instrumentations/anthropic.js +10 -17
- package/dist/instrumentations/create.d.ts +0 -4
- package/dist/instrumentations/create.js +61 -30
- package/dist/instrumentations/gemini.js +35 -2
- package/dist/instrumentations/openai.js +8 -16
- package/dist/instrumentations/types.d.ts +8 -6
- package/dist/types/metrics.d.ts +1 -0
- package/dist/types/metrics.js +2 -0
- package/package.json +1 -1
- package/templates/grafana/dashboards/provider-health.json +191 -0
package/README.md
CHANGED
|
@@ -1,171 +1,352 @@
|
|
|
1
|
-
# toad-eye
|
|
1
|
+
# toad-eye
|
|
2
2
|
|
|
3
|
-
|
|
4
|
-
|
|
5
|
-
|
|
6
|
-
|
|
3
|
+

|
|
4
|
+

|
|
5
|
+

|
|
6
|
+

|
|
7
|
+

|
|
8
|
+

|
|
9
|
+
[](https://www.npmjs.com/package/toad-eye)
|
|
10
|
+

|
|
11
|
+

|
|
7
12
|
|
|
8
|
-
|
|
13
|
+
OpenTelemetry-based observability toolkit for LLM systems.
|
|
9
14
|
|
|
10
|
-
|
|
11
|
-
> toad-eye gives you complete visibility with zero manual instrumentation.
|
|
15
|
+
Auto-instrument any LLM SDK (including streaming), get traces, metrics, cost tracking, budget guards, agent observability, guardrail monitoring, and 6 Grafana dashboards out of the box. Self-hosted or cloud mode.
|
|
12
16
|
|
|
13
|
-
|
|
14
|
-
<!--  -->
|
|
17
|
+
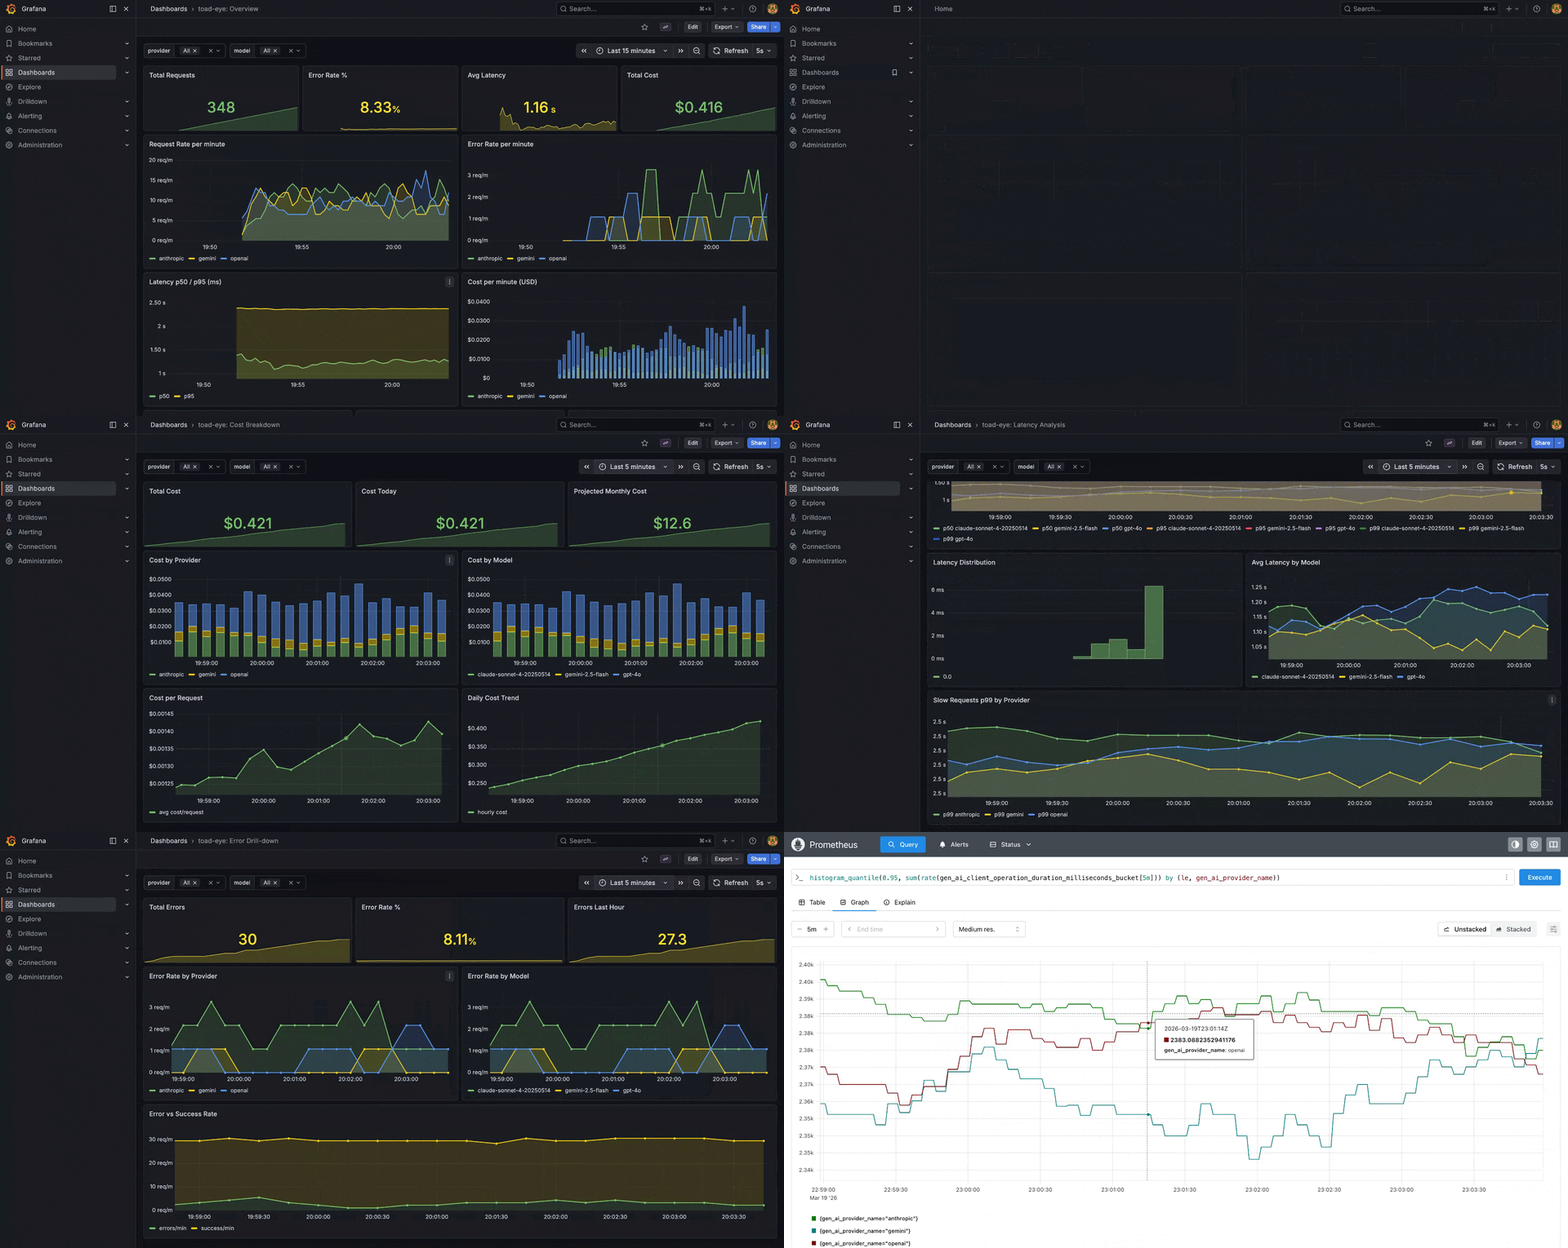
|
|
15
18
|
|
|
16
|
-
|
|
17
|
-
|
|
18
|
-
## Quick Start
|
|
19
|
+
## Quick start
|
|
19
20
|
|
|
20
21
|
```bash
|
|
21
22
|
npm install toad-eye
|
|
22
|
-
npx toad-eye init
|
|
23
|
-
npx toad-eye up
|
|
23
|
+
npx toad-eye init # scaffold observability stack
|
|
24
|
+
npx toad-eye up # start Grafana + Prometheus + Jaeger
|
|
25
|
+
npx toad-eye demo # send mock LLM traffic, see data immediately
|
|
24
26
|
```
|
|
25
27
|
|
|
28
|
+
Open [localhost:3100](http://localhost:3100) (Grafana, admin/admin) to see your dashboards.
|
|
29
|
+
|
|
30
|
+
### Cloud mode
|
|
31
|
+
|
|
32
|
+
No Docker needed. Send telemetry to toad-eye cloud with one line:
|
|
33
|
+
|
|
34
|
+
```typescript
|
|
35
|
+
initObservability({
|
|
36
|
+
serviceName: "my-app",
|
|
37
|
+
apiKey: "toad_xxxxxxxx",
|
|
38
|
+
instrument: ["openai"],
|
|
39
|
+
});
|
|
40
|
+
```
|
|
41
|
+
|
|
42
|
+
Self-hosted mode remains the default. Cloud mode activates automatically when `apiKey` is set.
|
|
43
|
+
|
|
44
|
+
## Auto-instrumentation
|
|
45
|
+
|
|
46
|
+
Zero-code instrumentation for popular LLM SDKs. No wrappers needed.
|
|
47
|
+
|
|
26
48
|
```typescript
|
|
27
49
|
import { initObservability } from "toad-eye";
|
|
28
50
|
|
|
29
51
|
initObservability({
|
|
30
52
|
serviceName: "my-app",
|
|
31
|
-
instrument: ["
|
|
53
|
+
instrument: ["openai", "anthropic"],
|
|
54
|
+
});
|
|
55
|
+
|
|
56
|
+
// That's it. Every SDK call is auto-traced.
|
|
57
|
+
const result = await openai.chat.completions.create({
|
|
58
|
+
model: "gpt-4o",
|
|
59
|
+
messages: [{ role: "user", content: "Hello" }],
|
|
32
60
|
});
|
|
33
|
-
// Every LLM call is now automatically traced. Open http://localhost:3100
|
|
34
61
|
```
|
|
35
62
|
|
|
36
|
-
|
|
63
|
+
**Supported SDKs:** OpenAI (`openai`), Anthropic (`@anthropic-ai/sdk`), Google GenAI (`@google/generative-ai`)
|
|
37
64
|
|
|
38
|
-
|
|
65
|
+
Both regular and **streaming** calls are fully instrumented — spans, metrics, and cost tracking work transparently for `stream: true`.
|
|
39
66
|
|
|
40
|
-
|
|
67
|
+
### Manual instrumentation
|
|
41
68
|
|
|
42
|
-
|
|
69
|
+
For custom providers or fine-grained control:
|
|
70
|
+
|
|
71
|
+
```typescript
|
|
72
|
+
import { initObservability, traceLLMCall } from "toad-eye";
|
|
43
73
|
|
|
44
|
-
|
|
45
|
-
| ------------------------ | --------------------------------------------------------------------------------- |
|
|
46
|
-
| **Auto-instrumentation** | Patches Anthropic, OpenAI, Gemini SDKs — no code changes needed |
|
|
47
|
-
| **5 Grafana dashboards** | Overview · Cost Breakdown · Latency Analysis · Model Comparison · Error Drilldown |
|
|
48
|
-
| **Cost tracking** | Per-request USD cost, hourly/daily totals, top models by spend |
|
|
49
|
-
| **Cost alerts** | Threshold alerts via Telegram, Slack, email, or webhook |
|
|
50
|
-
| **Distributed traces** | Full spans in Jaeger with prompts, completions, tokens |
|
|
51
|
-
| **One-command stack** | `npx toad-eye up` starts the entire observability stack |
|
|
74
|
+
initObservability({ serviceName: "my-app" });
|
|
52
75
|
|
|
53
|
-
|
|
76
|
+
const result = await traceLLMCall(
|
|
77
|
+
{ provider: "anthropic", model: "claude-sonnet-4-20250514", prompt: "hello" },
|
|
78
|
+
() => callYourLLM(),
|
|
79
|
+
);
|
|
80
|
+
```
|
|
54
81
|
|
|
55
|
-
##
|
|
82
|
+
## Agent observability
|
|
56
83
|
|
|
57
|
-
|
|
58
|
-
flowchart LR
|
|
59
|
-
app["Your LLM App\n(toad-eye SDK)"]
|
|
60
|
-
col["OTel Collector\n:4318"]
|
|
61
|
-
prom["Prometheus\n:9090"]
|
|
62
|
-
jaeger["Jaeger\n:16686"]
|
|
63
|
-
grafana["Grafana\n:3100"]
|
|
84
|
+
Structured tracing for ReAct agents (think / act / observe / answer) as nested OpenTelemetry spans.
|
|
64
85
|
|
|
65
|
-
|
|
66
|
-
|
|
67
|
-
|
|
68
|
-
|
|
69
|
-
|
|
86
|
+
```typescript
|
|
87
|
+
import { traceAgentQuery } from "toad-eye";
|
|
88
|
+
|
|
89
|
+
const result = await traceAgentQuery(
|
|
90
|
+
"Is anything dangerous near Earth?",
|
|
91
|
+
async (step) => {
|
|
92
|
+
step({
|
|
93
|
+
type: "think",
|
|
94
|
+
stepNumber: 1,
|
|
95
|
+
content: "I need to check asteroids",
|
|
96
|
+
});
|
|
97
|
+
const data = await callTool("near-earth-asteroids");
|
|
98
|
+
step({ type: "act", stepNumber: 2, toolName: "near-earth-asteroids" });
|
|
99
|
+
step({
|
|
100
|
+
type: "observe",
|
|
101
|
+
stepNumber: 3,
|
|
102
|
+
content: `${data.length} asteroids found`,
|
|
103
|
+
});
|
|
104
|
+
step({
|
|
105
|
+
type: "answer",
|
|
106
|
+
stepNumber: 4,
|
|
107
|
+
content: "7 asteroids passing safely",
|
|
108
|
+
});
|
|
109
|
+
return { answer: "7 asteroids passing safely" };
|
|
110
|
+
},
|
|
111
|
+
);
|
|
70
112
|
```
|
|
71
113
|
|
|
72
|
-
|
|
73
|
-
| ---------- | ------------------------------------- |
|
|
74
|
-
| Grafana | http://localhost:3100 (admin / admin) |
|
|
75
|
-
| Jaeger | http://localhost:16686 |
|
|
76
|
-
| Prometheus | http://localhost:9090 |
|
|
77
|
-
|
|
78
|
-
---
|
|
114
|
+
Metrics: steps per query (histogram), tool usage frequency (counter per tool name).
|
|
79
115
|
|
|
80
|
-
##
|
|
116
|
+
## Shadow guardrails
|
|
81
117
|
|
|
82
|
-
|
|
83
|
-
| ---------------------- | --------- | ------------------------------------------- |
|
|
84
|
-
| `llm.request.duration` | Histogram | Request latency (ms), by provider + model |
|
|
85
|
-
| `llm.request.cost` | Histogram | Cost per request (USD), by provider + model |
|
|
86
|
-
| `llm.tokens` | Counter | Total tokens consumed (input + output) |
|
|
87
|
-
| `llm.requests` | Counter | Total requests made |
|
|
88
|
-
| `llm.errors` | Counter | Total failed requests |
|
|
118
|
+
Validate LLM responses without blocking them. Record what _would_ have been blocked, then decide when to enforce.
|
|
89
119
|
|
|
90
|
-
|
|
120
|
+
```typescript
|
|
121
|
+
import { recordGuardResult } from "toad-eye";
|
|
122
|
+
|
|
123
|
+
// toad-guard validates, toad-eye records
|
|
124
|
+
const result = guard.validate(response);
|
|
125
|
+
recordGuardResult({
|
|
126
|
+
mode: "shadow",
|
|
127
|
+
passed: false,
|
|
128
|
+
ruleName: "pii_filter",
|
|
129
|
+
failureReason: "SSN detected in response",
|
|
130
|
+
});
|
|
131
|
+
```
|
|
91
132
|
|
|
92
|
-
|
|
133
|
+
Metrics: `guard.evaluations` (total checks), `guard.would_block` (would-have-blocked count) per rule name.
|
|
93
134
|
|
|
94
|
-
|
|
135
|
+
## Semantic drift monitoring
|
|
95
136
|
|
|
96
|
-
|
|
137
|
+
Detect silent LLM quality degradation by comparing current responses to a saved baseline via embeddings.
|
|
97
138
|
|
|
98
139
|
```typescript
|
|
99
|
-
import {
|
|
140
|
+
import { createDriftMonitor, saveBaseline } from "toad-eye";
|
|
100
141
|
|
|
101
|
-
const
|
|
102
|
-
{ provider: "
|
|
103
|
-
|
|
104
|
-
|
|
105
|
-
|
|
106
|
-
|
|
107
|
-
|
|
108
|
-
|
|
109
|
-
|
|
110
|
-
|
|
142
|
+
const monitor = createDriftMonitor({
|
|
143
|
+
embedding: { provider: "openai", apiKey: process.env.OPENAI_API_KEY! },
|
|
144
|
+
baselinePath: "./baseline.json",
|
|
145
|
+
sampleRate: 10, // check every 10th response
|
|
146
|
+
});
|
|
147
|
+
|
|
148
|
+
// In your LLM call handler:
|
|
149
|
+
const drift = await monitor.check(response, "openai", "gpt-4o");
|
|
150
|
+
// drift = 0 → identical to baseline
|
|
151
|
+
// drift > 0.3 → significant deviation
|
|
111
152
|
```
|
|
112
153
|
|
|
113
|
-
|
|
154
|
+
## Trace-to-dataset export
|
|
155
|
+
|
|
156
|
+
Convert production Jaeger traces into test cases. Production failure becomes a regression test.
|
|
114
157
|
|
|
115
|
-
|
|
158
|
+
```bash
|
|
159
|
+
npx toad-eye export-trace <trace_id> --output ./evals/
|
|
160
|
+
```
|
|
161
|
+
|
|
162
|
+
Generates YAML in toad-eval format with auto-generated assertions (max length, refusal detection, JSON validation).
|
|
163
|
+
|
|
164
|
+
## Features
|
|
165
|
+
|
|
166
|
+
### Built-in cost tracking
|
|
167
|
+
|
|
168
|
+
Automatic cost calculation for major models (GPT-4o, Claude, Gemini) based on token usage. Custom pricing for enterprise contracts:
|
|
116
169
|
|
|
117
170
|
```typescript
|
|
118
|
-
|
|
171
|
+
import { setCustomPricing } from "toad-eye";
|
|
172
|
+
|
|
173
|
+
setCustomPricing({
|
|
174
|
+
"my-fine-tuned-model": { inputPer1M: 5, outputPer1M: 15 },
|
|
175
|
+
});
|
|
119
176
|
```
|
|
120
177
|
|
|
121
|
-
###
|
|
178
|
+
### Privacy controls
|
|
122
179
|
|
|
123
|
-
|
|
180
|
+
```typescript
|
|
181
|
+
initObservability({
|
|
182
|
+
serviceName: "my-app",
|
|
183
|
+
recordContent: false, // disable prompt/completion recording
|
|
184
|
+
hashContent: true, // SHA-256 hash instead of plain text
|
|
185
|
+
redactPatterns: [/\b\S+@\S+\.\S+\b/g], // regex redaction
|
|
186
|
+
});
|
|
187
|
+
```
|
|
188
|
+
|
|
189
|
+
### Session tracking
|
|
190
|
+
|
|
191
|
+
Group traces by conversation session:
|
|
124
192
|
|
|
125
193
|
```typescript
|
|
126
|
-
|
|
127
|
-
|
|
128
|
-
|
|
129
|
-
|
|
130
|
-
|
|
131
|
-
telegram: {
|
|
132
|
-
type: "telegram",
|
|
133
|
-
token: process.env.TG_TOKEN!,
|
|
134
|
-
chatId: process.env.TG_CHAT!,
|
|
135
|
-
},
|
|
136
|
-
},
|
|
137
|
-
alerts: [
|
|
138
|
-
{
|
|
139
|
-
name: "cost_spike",
|
|
140
|
-
metric: "llm.request.cost",
|
|
141
|
-
condition: "sum_1h > 10",
|
|
142
|
-
channels: ["telegram"],
|
|
143
|
-
},
|
|
144
|
-
],
|
|
194
|
+
initObservability({
|
|
195
|
+
serviceName: "my-app",
|
|
196
|
+
sessionId: "static-session-id",
|
|
197
|
+
// or dynamic:
|
|
198
|
+
sessionExtractor: () => getCurrentSessionId(),
|
|
145
199
|
});
|
|
200
|
+
```
|
|
146
201
|
|
|
147
|
-
|
|
202
|
+
### Alerting
|
|
203
|
+
|
|
204
|
+
Cost spikes, latency anomalies, error rate monitoring via YAML config:
|
|
205
|
+
|
|
206
|
+
```yaml
|
|
207
|
+
alerts:
|
|
208
|
+
- name: cost_spike
|
|
209
|
+
metric: gen_ai.client.request.cost
|
|
210
|
+
condition: sum_1h > 10
|
|
211
|
+
channels: [slack]
|
|
212
|
+
|
|
213
|
+
- name: latency_anomaly
|
|
214
|
+
metric: gen_ai.client.operation.duration
|
|
215
|
+
condition: p95_pct_5m_7d > 50
|
|
216
|
+
channels: [slack]
|
|
217
|
+
|
|
218
|
+
- name: error_rate
|
|
219
|
+
metric: gen_ai.client.errors
|
|
220
|
+
condition: ratio_15m > 0.05
|
|
221
|
+
channels: [slack]
|
|
148
222
|
```
|
|
149
223
|
|
|
150
|
-
|
|
224
|
+
Delivery channels: Telegram, Slack webhook, generic HTTP webhook, email (SMTP).
|
|
151
225
|
|
|
152
|
-
###
|
|
226
|
+
### Budget guards
|
|
227
|
+
|
|
228
|
+
Prevent cost overruns at runtime. Three modes: warn, block, or auto-downgrade to a cheaper model.
|
|
153
229
|
|
|
154
230
|
```typescript
|
|
155
231
|
initObservability({
|
|
156
232
|
serviceName: "my-app",
|
|
157
|
-
|
|
233
|
+
budgets: {
|
|
234
|
+
daily: 50, // $50/day max
|
|
235
|
+
perUser: 5, // $5/day per user
|
|
236
|
+
perModel: { "gpt-4o": 30 }, // $30/day on GPT-4o
|
|
237
|
+
},
|
|
238
|
+
onBudgetExceeded: "block", // throws ToadBudgetExceededError
|
|
158
239
|
});
|
|
159
240
|
```
|
|
160
241
|
|
|
161
|
-
|
|
242
|
+
| Mode | Behavior |
|
|
243
|
+
| ----------- | --------------------------------------------------- |
|
|
244
|
+
| `warn` | Log warning, continue normally |
|
|
245
|
+
| `block` | Throw `ToadBudgetExceededError` before LLM call |
|
|
246
|
+
| `downgrade` | Call `downgradeCallback` to switch to cheaper model |
|
|
162
247
|
|
|
163
|
-
##
|
|
248
|
+
## FinOps attribution
|
|
164
249
|
|
|
165
|
-
|
|
166
|
-
|
|
167
|
-
|
|
168
|
-
|
|
169
|
-
|
|
170
|
-
|
|
250
|
+
Track costs by team, user, feature, or any business dimension:
|
|
251
|
+
|
|
252
|
+
```typescript
|
|
253
|
+
// Global attributes — applied to all spans/metrics
|
|
254
|
+
initObservability({
|
|
255
|
+
serviceName: "my-app",
|
|
256
|
+
attributes: { team: "checkout", environment: "production" },
|
|
257
|
+
});
|
|
258
|
+
|
|
259
|
+
// Per-request attributes — override or extend global
|
|
260
|
+
await traceLLMCall(
|
|
261
|
+
{
|
|
262
|
+
provider: "openai",
|
|
263
|
+
model: "gpt-4o",
|
|
264
|
+
prompt: "Summarize order",
|
|
265
|
+
attributes: { userId: "user-123", feature: "order-summary" },
|
|
266
|
+
},
|
|
267
|
+
() => callLLM(),
|
|
268
|
+
);
|
|
171
269
|
```
|
|
270
|
+
|
|
271
|
+
## Grafana dashboards
|
|
272
|
+
|
|
273
|
+
6 pre-built dashboards auto-provisioned on `npx toad-eye init`:
|
|
274
|
+
|
|
275
|
+
| Dashboard | What it shows |
|
|
276
|
+
| ---------------------- | --------------------------------------------------------- |
|
|
277
|
+
| **Overview** | Request rate, error rate, latency p50/p95, cost, totals |
|
|
278
|
+
| **Cost Breakdown** | Spend by provider/model, daily trend, projected monthly |
|
|
279
|
+
| **Latency Analysis** | p50/p95/p99 by model, distribution histogram |
|
|
280
|
+
| **Error Drill-down** | Error rate by provider/model, error vs success |
|
|
281
|
+
| **Model Comparison** | Latency vs cost vs error rate vs throughput per model |
|
|
282
|
+
| **FinOps Attribution** | Cost by team/user/feature, projected spend, what-if table |
|
|
283
|
+
|
|
284
|
+
All dashboards have template variables for filtering (`$provider`, `$model`, `$team`, `$feature`).
|
|
285
|
+
|
|
286
|
+
## CLI
|
|
287
|
+
|
|
288
|
+
| Command | Description |
|
|
289
|
+
| -------------------------------- | ----------------------------------------------- |
|
|
290
|
+
| `npx toad-eye init` | Scaffold Docker Compose + observability configs |
|
|
291
|
+
| `npx toad-eye up` | Start the stack |
|
|
292
|
+
| `npx toad-eye down` | Stop the stack |
|
|
293
|
+
| `npx toad-eye status` | Show running services and URLs |
|
|
294
|
+
| `npx toad-eye demo` | Send mock LLM traffic to see data in Grafana |
|
|
295
|
+
| `npx toad-eye export-trace <id>` | Export a Jaeger trace to toad-eval YAML |
|
|
296
|
+
|
|
297
|
+
## Architecture
|
|
298
|
+
|
|
299
|
+

|
|
300
|
+
|
|
301
|
+
## What it tracks
|
|
302
|
+
|
|
303
|
+
### Metrics (OTel GenAI semconv)
|
|
304
|
+
|
|
305
|
+
| Metric | Type | Description |
|
|
306
|
+
| ----------------------------------- | --------- | ----------------------------------- |
|
|
307
|
+
| `gen_ai.client.operation.duration` | Histogram | Request latency (ms) |
|
|
308
|
+
| `gen_ai.client.request.cost` | Histogram | Cost per request (USD) |
|
|
309
|
+
| `gen_ai.client.token.usage` | Counter | Total tokens consumed |
|
|
310
|
+
| `gen_ai.client.requests` | Counter | Total requests |
|
|
311
|
+
| `gen_ai.client.errors` | Counter | Total failed requests |
|
|
312
|
+
| `gen_ai.agent.steps_per_query` | Histogram | Agent steps per query |
|
|
313
|
+
| `gen_ai.agent.tool_usage` | Counter | Agent tool invocations by tool name |
|
|
314
|
+
| `gen_ai.toad_eye.guard.evaluations` | Counter | Guard evaluations per rule |
|
|
315
|
+
| `gen_ai.toad_eye.guard.would_block` | Counter | Would-have-blocked per rule |
|
|
316
|
+
| `gen_ai.toad_eye.semantic_drift` | Histogram | Semantic drift from baseline (0..1) |
|
|
317
|
+
| `gen_ai.toad_eye.budget.exceeded` | Counter | Budget limit exceeded events |
|
|
318
|
+
| `gen_ai.toad_eye.budget.blocked` | Counter | LLM calls blocked by budget |
|
|
319
|
+
| `gen_ai.toad_eye.budget.downgraded` | Counter | LLM calls downgraded by budget |
|
|
320
|
+
|
|
321
|
+
All metrics labeled with `gen_ai.provider.name` and `gen_ai.request.model`.
|
|
322
|
+
|
|
323
|
+
### Span attributes
|
|
324
|
+
|
|
325
|
+
| Attribute | Description |
|
|
326
|
+
| ---------------------------- | ------------------------------------ |
|
|
327
|
+
| `gen_ai.provider.name` | `anthropic`, `gemini`, `openai` |
|
|
328
|
+
| `gen_ai.request.model` | Model identifier |
|
|
329
|
+
| `gen_ai.usage.input_tokens` | Tokens in the prompt |
|
|
330
|
+
| `gen_ai.usage.output_tokens` | Tokens in the completion |
|
|
331
|
+
| `gen_ai.request.temperature` | Temperature parameter |
|
|
332
|
+
| `gen_ai.toad_eye.cost` | Cost in USD |
|
|
333
|
+
| `gen_ai.agent.step.type` | Agent step: think/act/observe/answer |
|
|
334
|
+
| `gen_ai.agent.tool.name` | Tool name for agent act steps |
|
|
335
|
+
| `gen_ai.toad_eye.guard.mode` | Guard mode: shadow/enforce |
|
|
336
|
+
| `session.id` | Session identifier (if configured) |
|
|
337
|
+
|
|
338
|
+
## Services
|
|
339
|
+
|
|
340
|
+
| Service | URL |
|
|
341
|
+
| -------------- | ------------------------------------------------------- |
|
|
342
|
+
| Grafana | [localhost:3100](http://localhost:3100) (admin / admin) |
|
|
343
|
+
| Jaeger UI | [localhost:16686](http://localhost:16686) |
|
|
344
|
+
| Prometheus | [localhost:9090](http://localhost:9090) |
|
|
345
|
+
| OTel Collector | [localhost:4318](http://localhost:4318) |
|
|
346
|
+
|
|
347
|
+
## Tech stack
|
|
348
|
+
|
|
349
|
+
- TypeScript, OpenTelemetry SDK 2.x, OTel GenAI semantic conventions
|
|
350
|
+
- Hono (demo server + cloud ingestion server)
|
|
351
|
+
- Docker Compose (Prometheus, Jaeger, Grafana, OTel Collector)
|
|
352
|
+
- Vitest (154 tests)
|
package/dist/core/metrics.d.ts
CHANGED
|
@@ -9,6 +9,7 @@ export declare function recordAgentToolUsage(toolName: string): void;
|
|
|
9
9
|
export declare function recordGuardEvaluation(ruleName: string): void;
|
|
10
10
|
export declare function recordGuardWouldBlock(ruleName: string): void;
|
|
11
11
|
export declare function recordSemanticDrift(drift: number, provider: string, model: string): void;
|
|
12
|
+
export declare function recordTimeToFirstToken(ms: number, provider: string, model: string): void;
|
|
12
13
|
export declare function recordBudgetExceeded(budgetType: string): void;
|
|
13
14
|
export declare function recordBudgetBlocked(budgetType: string): void;
|
|
14
15
|
export declare function recordBudgetDowngraded(budgetType: string): void;
|
package/dist/core/metrics.js
CHANGED
|
@@ -10,6 +10,7 @@ let agentToolUsage;
|
|
|
10
10
|
let guardEvaluations;
|
|
11
11
|
let guardWouldBlock;
|
|
12
12
|
let semanticDrift;
|
|
13
|
+
let timeToFirstToken;
|
|
13
14
|
let budgetExceeded;
|
|
14
15
|
let budgetBlocked;
|
|
15
16
|
let budgetDowngraded;
|
|
@@ -50,6 +51,10 @@ export function initMetrics() {
|
|
|
50
51
|
semanticDrift = meter.createHistogram(GEN_AI_METRICS.SEMANTIC_DRIFT, {
|
|
51
52
|
description: "Semantic drift from baseline (0 = identical, 1 = completely different)",
|
|
52
53
|
});
|
|
54
|
+
timeToFirstToken = meter.createHistogram(GEN_AI_METRICS.TIME_TO_FIRST_TOKEN, {
|
|
55
|
+
description: "Time from request start to first streaming token (ms)",
|
|
56
|
+
unit: "ms",
|
|
57
|
+
});
|
|
53
58
|
budgetExceeded = meter.createCounter(GEN_AI_METRICS.BUDGET_EXCEEDED, {
|
|
54
59
|
description: "Number of times a budget limit was exceeded",
|
|
55
60
|
});
|
|
@@ -108,6 +113,12 @@ export function recordSemanticDrift(drift, provider, model) {
|
|
|
108
113
|
[GEN_AI_ATTRS.REQUEST_MODEL]: model,
|
|
109
114
|
});
|
|
110
115
|
}
|
|
116
|
+
export function recordTimeToFirstToken(ms, provider, model) {
|
|
117
|
+
timeToFirstToken.record(ms, {
|
|
118
|
+
[GEN_AI_ATTRS.PROVIDER]: provider,
|
|
119
|
+
[GEN_AI_ATTRS.REQUEST_MODEL]: model,
|
|
120
|
+
});
|
|
121
|
+
}
|
|
111
122
|
export function recordBudgetExceeded(budgetType) {
|
|
112
123
|
budgetExceeded.add(1, { budget_type: budgetType });
|
|
113
124
|
}
|
package/dist/core/pricing.js
CHANGED
|
@@ -43,6 +43,8 @@ export function getModelPricing(model) {
|
|
|
43
43
|
* Returns 0 if model pricing is not found.
|
|
44
44
|
*/
|
|
45
45
|
export function calculateCost(model, inputTokens, outputTokens) {
|
|
46
|
+
if (inputTokens < 0 || outputTokens < 0)
|
|
47
|
+
return 0;
|
|
46
48
|
const pricing = getModelPricing(model);
|
|
47
49
|
if (!pricing)
|
|
48
50
|
return 0;
|
package/dist/core/spans.js
CHANGED
|
@@ -1,12 +1,18 @@
|
|
|
1
1
|
import { createHash } from "node:crypto";
|
|
2
|
-
import { trace, SpanStatusCode } from "@opentelemetry/api";
|
|
2
|
+
import { trace, diag, SpanStatusCode } from "@opentelemetry/api";
|
|
3
3
|
import { GEN_AI_ATTRS, INSTRUMENTATION_NAME } from "../types/index.js";
|
|
4
4
|
import { recordRequestDuration, recordRequestCost, recordTokens, recordRequest, recordError, recordBudgetExceeded, recordBudgetBlocked, recordBudgetDowngraded, } from "./metrics.js";
|
|
5
5
|
import { getConfig, getBudgetTracker } from "./tracer.js";
|
|
6
6
|
import { GEN_AI_ATTRS as ATTRS } from "../types/index.js";
|
|
7
7
|
const tracer = trace.getTracer(INSTRUMENTATION_NAME);
|
|
8
|
+
let saltWarningEmitted = false;
|
|
8
9
|
function sha256(text) {
|
|
9
|
-
const
|
|
10
|
+
const config = getConfig();
|
|
11
|
+
const salt = config?.salt ?? "";
|
|
12
|
+
if (config?.hashContent && !config.salt && !saltWarningEmitted) {
|
|
13
|
+
diag.warn("toad-eye: hashContent is enabled without salt — short strings may be reversible. Set salt in config for stronger privacy.");
|
|
14
|
+
saltWarningEmitted = true;
|
|
15
|
+
}
|
|
10
16
|
return createHash("sha256")
|
|
11
17
|
.update(salt + text)
|
|
12
18
|
.digest("hex");
|
package/dist/core/tracer.js
CHANGED
|
@@ -73,7 +73,10 @@ export function initObservability(config) {
|
|
|
73
73
|
currentConfig = config;
|
|
74
74
|
initMetrics();
|
|
75
75
|
if (isCloudMode) {
|
|
76
|
-
|
|
76
|
+
const masked = config.apiKey
|
|
77
|
+
? config.apiKey.slice(0, 8) + "..." + config.apiKey.slice(-4)
|
|
78
|
+
: "";
|
|
79
|
+
console.log(`toad-eye: cloud mode enabled (${masked}) → sending telemetry to ${endpoint}`);
|
|
77
80
|
}
|
|
78
81
|
if (config.budgets) {
|
|
79
82
|
budgetTracker = new BudgetTracker(config.budgets, config.onBudgetExceeded ?? "warn", config.downgradeCallback);
|
package/dist/drift/monitor.js
CHANGED
|
@@ -39,7 +39,11 @@ export function createDriftMonitor(config) {
|
|
|
39
39
|
return {
|
|
40
40
|
check: performCheck,
|
|
41
41
|
checkInBackground(response, providerName, model) {
|
|
42
|
-
|
|
42
|
+
const timeout = new Promise((_, reject) => setTimeout(() => reject(new Error("Drift check timeout (5s)")), 5000));
|
|
43
|
+
void Promise.race([
|
|
44
|
+
performCheck(response, providerName, model),
|
|
45
|
+
timeout,
|
|
46
|
+
]).catch((err) => {
|
|
43
47
|
console.warn(`[toad-eye] Drift check failed (non-blocking): ${err instanceof Error ? err.message : String(err)}`);
|
|
44
48
|
});
|
|
45
49
|
},
|
|
@@ -20,7 +20,11 @@ export function createOpenAIEmbeddingProvider(apiKey, model = DEFAULT_MODEL) {
|
|
|
20
20
|
throw new Error(`OpenAI Embeddings API error: ${response.status} ${response.statusText}`);
|
|
21
21
|
}
|
|
22
22
|
const body = (await response.json());
|
|
23
|
-
|
|
23
|
+
const embedding = body.data?.[0]?.embedding;
|
|
24
|
+
if (!embedding) {
|
|
25
|
+
throw new Error("OpenAI Embeddings API returned no embeddings");
|
|
26
|
+
}
|
|
27
|
+
return embedding;
|
|
24
28
|
},
|
|
25
29
|
};
|
|
26
30
|
}
|
package/dist/export.js
CHANGED
|
@@ -31,7 +31,7 @@ function buildAssertions(completion) {
|
|
|
31
31
|
value: Math.ceil(completion.length * LENGTH_BUFFER_MULTIPLIER),
|
|
32
32
|
});
|
|
33
33
|
if (!completion.toLowerCase().includes(REFUSAL_MARKER)) {
|
|
34
|
-
assertions.push({ type: "not_contains", value:
|
|
34
|
+
assertions.push({ type: "not_contains", value: REFUSAL_MARKER });
|
|
35
35
|
}
|
|
36
36
|
if (isJson(completion)) {
|
|
37
37
|
assertions.push({ type: "is_json", value: true });
|
package/dist/guard.d.ts
CHANGED
|
@@ -2,10 +2,9 @@
|
|
|
2
2
|
* Shadow Guardrails integration — records toad-guard validation results
|
|
3
3
|
* as span attributes and metrics without blocking LLM responses.
|
|
4
4
|
*
|
|
5
|
-
*
|
|
6
|
-
*
|
|
7
|
-
*
|
|
8
|
-
* production traffic before switching to enforce mode.
|
|
5
|
+
* Results are recorded as attributes on the currently active span
|
|
6
|
+
* (typically the LLM call span from traceLLMCall). This avoids
|
|
7
|
+
* trace bloat — no extra child spans per guard rule.
|
|
9
8
|
*
|
|
10
9
|
* Usage from toad-guard:
|
|
11
10
|
* ```ts
|
|
@@ -17,10 +16,9 @@
|
|
|
17
16
|
*/
|
|
18
17
|
import type { GuardResult } from "./types/index.js";
|
|
19
18
|
/**
|
|
20
|
-
* Record a guard validation result as
|
|
19
|
+
* Record a guard validation result as attributes on the active span.
|
|
21
20
|
*
|
|
22
|
-
* Attaches guard attributes to
|
|
23
|
-
*
|
|
24
|
-
* useful for measuring how often shadow guardrails would have blocked.
|
|
21
|
+
* Attaches guard attributes directly to the current span (no child span created).
|
|
22
|
+
* Increments guard evaluation counter, and would_block counter if failed.
|
|
25
23
|
*/
|
|
26
24
|
export declare function recordGuardResult(result: GuardResult): void;
|
package/dist/guard.js
CHANGED
|
@@ -2,10 +2,9 @@
|
|
|
2
2
|
* Shadow Guardrails integration — records toad-guard validation results
|
|
3
3
|
* as span attributes and metrics without blocking LLM responses.
|
|
4
4
|
*
|
|
5
|
-
*
|
|
6
|
-
*
|
|
7
|
-
*
|
|
8
|
-
* production traffic before switching to enforce mode.
|
|
5
|
+
* Results are recorded as attributes on the currently active span
|
|
6
|
+
* (typically the LLM call span from traceLLMCall). This avoids
|
|
7
|
+
* trace bloat — no extra child spans per guard rule.
|
|
9
8
|
*
|
|
10
9
|
* Usage from toad-guard:
|
|
11
10
|
* ```ts
|
|
@@ -16,28 +15,27 @@
|
|
|
16
15
|
* ```
|
|
17
16
|
*/
|
|
18
17
|
import { trace } from "@opentelemetry/api";
|
|
19
|
-
import { GEN_AI_ATTRS
|
|
18
|
+
import { GEN_AI_ATTRS } from "./types/index.js";
|
|
20
19
|
import { recordGuardEvaluation, recordGuardWouldBlock, } from "./core/metrics.js";
|
|
21
|
-
const tracer = trace.getTracer(INSTRUMENTATION_NAME);
|
|
22
20
|
/**
|
|
23
|
-
* Record a guard validation result as
|
|
21
|
+
* Record a guard validation result as attributes on the active span.
|
|
24
22
|
*
|
|
25
|
-
* Attaches guard attributes to
|
|
26
|
-
*
|
|
27
|
-
* useful for measuring how often shadow guardrails would have blocked.
|
|
23
|
+
* Attaches guard attributes directly to the current span (no child span created).
|
|
24
|
+
* Increments guard evaluation counter, and would_block counter if failed.
|
|
28
25
|
*/
|
|
29
26
|
export function recordGuardResult(result) {
|
|
30
|
-
const
|
|
31
|
-
|
|
32
|
-
|
|
33
|
-
|
|
34
|
-
|
|
35
|
-
|
|
36
|
-
result.
|
|
37
|
-
|
|
38
|
-
|
|
39
|
-
|
|
40
|
-
|
|
27
|
+
const activeSpan = trace.getActiveSpan();
|
|
28
|
+
if (activeSpan) {
|
|
29
|
+
activeSpan.setAttributes({
|
|
30
|
+
[GEN_AI_ATTRS.GUARD_MODE]: result.mode,
|
|
31
|
+
[GEN_AI_ATTRS.GUARD_PASSED]: result.passed,
|
|
32
|
+
[GEN_AI_ATTRS.GUARD_RULE_NAME]: result.ruleName,
|
|
33
|
+
...(!result.passed &&
|
|
34
|
+
result.failureReason !== undefined && {
|
|
35
|
+
[GEN_AI_ATTRS.GUARD_FAILURE_REASON]: result.failureReason,
|
|
36
|
+
}),
|
|
37
|
+
});
|
|
38
|
+
}
|
|
41
39
|
recordGuardEvaluation(result.ruleName);
|
|
42
40
|
if (!result.passed) {
|
|
43
41
|
recordGuardWouldBlock(result.ruleName);
|
|
@@ -46,24 +46,17 @@ const messagesCreate = {
|
|
|
46
46
|
};
|
|
47
47
|
},
|
|
48
48
|
isStreaming: (body) => !!body?.stream,
|
|
49
|
-
|
|
50
|
-
|
|
51
|
-
|
|
52
|
-
|
|
53
|
-
|
|
54
|
-
|
|
55
|
-
|
|
56
|
-
|
|
57
|
-
|
|
58
|
-
|
|
59
|
-
if (event.type === "message_start" && event.message?.usage) {
|
|
60
|
-
inputTokens = event.message.usage.input_tokens ?? 0;
|
|
61
|
-
}
|
|
62
|
-
if (event.type === "message_delta" && event.usage) {
|
|
63
|
-
outputTokens = event.usage.output_tokens ?? 0;
|
|
64
|
-
}
|
|
49
|
+
accumulateChunk: (acc, chunk) => {
|
|
50
|
+
const event = chunk;
|
|
51
|
+
if (event.type === "content_block_delta" && event.delta?.text) {
|
|
52
|
+
acc.completion += event.delta.text;
|
|
53
|
+
}
|
|
54
|
+
if (event.type === "message_start" && event.message?.usage) {
|
|
55
|
+
acc.inputTokens = event.message.usage.input_tokens ?? 0;
|
|
56
|
+
}
|
|
57
|
+
if (event.type === "message_delta" && event.usage) {
|
|
58
|
+
acc.outputTokens = event.usage.output_tokens ?? 0;
|
|
65
59
|
}
|
|
66
|
-
return { completion, inputTokens, outputTokens };
|
|
67
60
|
},
|
|
68
61
|
};
|
|
69
62
|
register(createInstrumentation({
|
|
@@ -1,9 +1,5 @@
|
|
|
1
1
|
import type { LLMProvider } from "../types/index.js";
|
|
2
2
|
import type { Instrumentation, PatchTarget } from "./types.js";
|
|
3
|
-
/**
|
|
4
|
-
* Factory for creating SDK instrumentations.
|
|
5
|
-
* Eliminates boilerplate: SDK resolution, prototype patching, error handling, cleanup.
|
|
6
|
-
*/
|
|
7
3
|
export declare function createInstrumentation(config: {
|
|
8
4
|
name: LLMProvider;
|
|
9
5
|
moduleName: string;
|
|
@@ -1,8 +1,8 @@
|
|
|
1
1
|
import { createRequire } from "node:module";
|
|
2
|
-
import { trace, diag, SpanStatusCode } from "@opentelemetry/api";
|
|
2
|
+
import { trace, context, diag, SpanStatusCode, } from "@opentelemetry/api";
|
|
3
3
|
import { traceLLMCall } from "../core/spans.js";
|
|
4
4
|
import { calculateCost } from "../core/pricing.js";
|
|
5
|
-
import { recordRequestDuration, recordRequestCost, recordTokens, recordRequest, recordError, } from "../core/metrics.js";
|
|
5
|
+
import { recordRequestDuration, recordRequestCost, recordTokens, recordRequest, recordError, recordTimeToFirstToken, } from "../core/metrics.js";
|
|
6
6
|
import { GEN_AI_ATTRS, INSTRUMENTATION_NAME } from "../types/index.js";
|
|
7
7
|
const require = createRequire(import.meta.url);
|
|
8
8
|
function isModuleInstalled(moduleName) {
|
|
@@ -21,24 +21,43 @@ function loadModule(moduleName) {
|
|
|
21
21
|
return sdk.default ?? sdk;
|
|
22
22
|
}
|
|
23
23
|
/**
|
|
24
|
-
* Wrap an async iterable stream
|
|
25
|
-
* Yields every chunk transparently
|
|
26
|
-
* On stream end, calls onComplete with
|
|
24
|
+
* Wrap an async iterable stream with an accumulator.
|
|
25
|
+
* Yields every chunk transparently. Accumulates only extracted data (no raw chunks stored).
|
|
26
|
+
* On stream end, calls onComplete with the accumulated result.
|
|
27
|
+
* onFirstChunk is called once when the first chunk arrives (for TTFT tracking).
|
|
27
28
|
*/
|
|
28
|
-
async function* wrapAsyncIterable(stream,
|
|
29
|
-
const
|
|
29
|
+
async function* wrapAsyncIterable(stream, accumulate, onFirstChunk, onComplete, onError) {
|
|
30
|
+
const acc = {
|
|
31
|
+
completion: "",
|
|
32
|
+
inputTokens: 0,
|
|
33
|
+
outputTokens: 0,
|
|
34
|
+
};
|
|
35
|
+
let firstChunk = true;
|
|
36
|
+
let completed = false;
|
|
37
|
+
let errored = false;
|
|
30
38
|
try {
|
|
31
39
|
for await (const chunk of stream) {
|
|
32
|
-
|
|
33
|
-
|
|
40
|
+
if (firstChunk) {
|
|
41
|
+
onFirstChunk();
|
|
42
|
+
firstChunk = false;
|
|
43
|
+
}
|
|
44
|
+
accumulate(acc, chunk);
|
|
34
45
|
yield chunk;
|
|
35
46
|
}
|
|
36
|
-
|
|
47
|
+
completed = true;
|
|
48
|
+
onComplete(acc);
|
|
37
49
|
}
|
|
38
50
|
catch (err) {
|
|
51
|
+
errored = true;
|
|
39
52
|
onError(err);
|
|
40
53
|
throw err;
|
|
41
54
|
}
|
|
55
|
+
finally {
|
|
56
|
+
// If stream was abandoned (consumer broke out), still record what we have
|
|
57
|
+
if (!completed && !errored) {
|
|
58
|
+
onComplete(acc);
|
|
59
|
+
}
|
|
60
|
+
}
|
|
42
61
|
}
|
|
43
62
|
function createStreamingHandler(
|
|
44
63
|
// eslint-disable-next-line @typescript-eslint/no-explicit-any
|
|
@@ -48,32 +67,45 @@ original, patch, providerName) {
|
|
|
48
67
|
const req = patch.extractRequest(body);
|
|
49
68
|
const start = performance.now();
|
|
50
69
|
const response = await original.call(thisArg, body, ...rest);
|
|
51
|
-
// The response should be an async iterable (Stream, MessageStream, etc.)
|
|
52
|
-
// We wrap it to intercept chunks
|
|
53
70
|
const span = tracer.startSpan(`gen_ai.${providerName}.${req.model}`);
|
|
71
|
+
const ctx = trace.setSpan(context.active(), span);
|
|
54
72
|
span.setAttributes({
|
|
55
73
|
[GEN_AI_ATTRS.PROVIDER]: providerName,
|
|
56
74
|
[GEN_AI_ATTRS.REQUEST_MODEL]: req.model,
|
|
57
75
|
[GEN_AI_ATTRS.TEMPERATURE]: req.temperature ?? 1.0,
|
|
58
76
|
[GEN_AI_ATTRS.OPERATION]: "chat",
|
|
59
77
|
});
|
|
60
|
-
|
|
78
|
+
// Some SDKs (Gemini) return { stream: AsyncIterable } instead of a direct AsyncIterable
|
|
79
|
+
const resp = response;
|
|
80
|
+
const hasStreamProp = resp != null &&
|
|
81
|
+
typeof resp === "object" &&
|
|
82
|
+
"stream" in resp &&
|
|
83
|
+
resp["stream"] != null &&
|
|
84
|
+
typeof resp["stream"] === "object" &&
|
|
85
|
+
Symbol.asyncIterator in resp["stream"];
|
|
86
|
+
const streamIterable = hasStreamProp
|
|
87
|
+
? resp["stream"]
|
|
88
|
+
: response;
|
|
89
|
+
const wrapped = context.bind(ctx, wrapAsyncIterable(streamIterable, (acc, chunk) => patch.accumulateChunk(acc, chunk), () => {
|
|
90
|
+
const ttft = performance.now() - start;
|
|
91
|
+
recordTimeToFirstToken(ttft, providerName, req.model);
|
|
92
|
+
}, (acc) => {
|
|
61
93
|
const duration = performance.now() - start;
|
|
62
|
-
const
|
|
63
|
-
const cost = calculateCost(req.model, res.inputTokens, res.outputTokens);
|
|
94
|
+
const cost = calculateCost(req.model, acc.inputTokens, acc.outputTokens);
|
|
64
95
|
span.setAttributes({
|
|
65
96
|
[GEN_AI_ATTRS.RESPONSE_MODEL]: req.model,
|
|
66
|
-
[GEN_AI_ATTRS.INPUT_TOKENS]:
|
|
67
|
-
[GEN_AI_ATTRS.OUTPUT_TOKENS]:
|
|
97
|
+
[GEN_AI_ATTRS.INPUT_TOKENS]: acc.inputTokens,
|
|
98
|
+
[GEN_AI_ATTRS.OUTPUT_TOKENS]: acc.outputTokens,
|
|
68
99
|
[GEN_AI_ATTRS.COST]: cost,
|
|
69
100
|
[GEN_AI_ATTRS.STATUS]: "success",
|
|
101
|
+
[GEN_AI_ATTRS.FINISH_REASONS]: ["stop"],
|
|
70
102
|
});
|
|
71
103
|
span.setStatus({ code: SpanStatusCode.OK });
|
|
72
104
|
span.end();
|
|
73
105
|
recordRequest(providerName, req.model);
|
|
74
106
|
recordRequestDuration(duration, providerName, req.model);
|
|
75
107
|
recordRequestCost(cost, providerName, req.model);
|
|
76
|
-
recordTokens(
|
|
108
|
+
recordTokens(acc.inputTokens + acc.outputTokens, providerName, req.model);
|
|
77
109
|
}, (err) => {
|
|
78
110
|
const duration = performance.now() - start;
|
|
79
111
|
const message = err instanceof Error ? err.message : String(err);
|
|
@@ -86,26 +118,29 @@ original, patch, providerName) {
|
|
|
86
118
|
recordRequest(providerName, req.model);
|
|
87
119
|
recordRequestDuration(duration, providerName, req.model);
|
|
88
120
|
recordError(providerName, req.model);
|
|
121
|
+
}));
|
|
122
|
+
// Proxy preserves the original object shape (getters, private fields, methods)
|
|
123
|
+
// while intercepting only the async iterator for instrumentation
|
|
124
|
+
return new Proxy(response, {
|
|
125
|
+
get(target, prop, receiver) {
|
|
126
|
+
if (prop === Symbol.asyncIterator) {
|
|
127
|
+
return () => wrapped[Symbol.asyncIterator]();
|
|
128
|
+
}
|
|
129
|
+
return Reflect.get(target, prop, receiver);
|
|
130
|
+
},
|
|
89
131
|
});
|
|
90
|
-
// Return an object that looks like the original stream but with our wrapper
|
|
91
|
-
// Preserve the original object shape — SDKs may have extra methods/properties
|
|
92
|
-
// eslint-disable-next-line @typescript-eslint/no-explicit-any
|
|
93
|
-
const proxy = Object.create(response);
|
|
94
|
-
proxy[Symbol.asyncIterator] = () => wrapped[Symbol.asyncIterator]();
|
|
95
|
-
return proxy;
|
|
96
132
|
};
|
|
97
133
|
}
|
|
98
134
|
function createPatchedMethod(
|
|
99
135
|
// eslint-disable-next-line @typescript-eslint/no-explicit-any
|
|
100
136
|
original, patch, providerName) {
|
|
101
|
-
const streamHandler = patch.isStreaming && patch.
|
|
137
|
+
const streamHandler = patch.isStreaming && patch.accumulateChunk
|
|
102
138
|
? createStreamingHandler(original, patch, providerName)
|
|
103
139
|
: null;
|
|
104
140
|
return function patchedMethod(body, ...rest) {
|
|
105
141
|
if (patch.shouldSkip?.(body)) {
|
|
106
142
|
return original.call(this, body, ...rest);
|
|
107
143
|
}
|
|
108
|
-
// Handle streaming calls
|
|
109
144
|
if (streamHandler && patch.isStreaming?.(body)) {
|
|
110
145
|
return streamHandler(this, body, rest);
|
|
111
146
|
}
|
|
@@ -127,10 +162,6 @@ original, patch, providerName) {
|
|
|
127
162
|
});
|
|
128
163
|
};
|
|
129
164
|
}
|
|
130
|
-
/**
|
|
131
|
-
* Factory for creating SDK instrumentations.
|
|
132
|
-
* Eliminates boilerplate: SDK resolution, prototype patching, error handling, cleanup.
|
|
133
|
-
*/
|
|
134
165
|
export function createInstrumentation(config) {
|
|
135
166
|
const activePatches = [];
|
|
136
167
|
return {
|
|
@@ -21,7 +21,6 @@ const generateContent = {
|
|
|
21
21
|
extractRequest(body) {
|
|
22
22
|
return {
|
|
23
23
|
prompt: extractPrompt(body),
|
|
24
|
-
// model comes from `this.model` — injected by create.ts via the patched function's `this`
|
|
25
24
|
model: "unknown",
|
|
26
25
|
};
|
|
27
26
|
},
|
|
@@ -41,8 +40,42 @@ const generateContent = {
|
|
|
41
40
|
};
|
|
42
41
|
},
|
|
43
42
|
};
|
|
43
|
+
const generateContentStream = {
|
|
44
|
+
getPrototype: (sdk) => sdk?.GenerativeModel?.prototype,
|
|
45
|
+
method: "generateContentStream",
|
|
46
|
+
extractRequest(body) {
|
|
47
|
+
return {
|
|
48
|
+
prompt: extractPrompt(body),
|
|
49
|
+
model: "unknown",
|
|
50
|
+
};
|
|
51
|
+
},
|
|
52
|
+
extractResponse: () => ({
|
|
53
|
+
completion: "",
|
|
54
|
+
inputTokens: 0,
|
|
55
|
+
outputTokens: 0,
|
|
56
|
+
}),
|
|
57
|
+
// generateContentStream always returns a stream
|
|
58
|
+
isStreaming: () => true,
|
|
59
|
+
accumulateChunk: (acc, chunk) => {
|
|
60
|
+
// Gemini stream chunks are GenerateContentResponse objects
|
|
61
|
+
const c = chunk;
|
|
62
|
+
try {
|
|
63
|
+
const text = c?.text?.();
|
|
64
|
+
if (text)
|
|
65
|
+
acc.completion += text;
|
|
66
|
+
}
|
|
67
|
+
catch {
|
|
68
|
+
// text() may throw if content is blocked
|
|
69
|
+
}
|
|
70
|
+
if (c?.usageMetadata) {
|
|
71
|
+
acc.inputTokens = c.usageMetadata.promptTokenCount ?? acc.inputTokens;
|
|
72
|
+
acc.outputTokens =
|
|
73
|
+
c.usageMetadata.candidatesTokenCount ?? acc.outputTokens;
|
|
74
|
+
}
|
|
75
|
+
},
|
|
76
|
+
};
|
|
44
77
|
register(createInstrumentation({
|
|
45
78
|
name: "gemini",
|
|
46
79
|
moduleName: "@google/generative-ai",
|
|
47
|
-
patches: [generateContent],
|
|
80
|
+
patches: [generateContent, generateContentStream],
|
|
48
81
|
}));
|
|
@@ -46,23 +46,15 @@ const chatCompletions = {
|
|
|
46
46
|
};
|
|
47
47
|
},
|
|
48
48
|
isStreaming: (body) => !!body?.stream,
|
|
49
|
-
|
|
50
|
-
|
|
51
|
-
|
|
52
|
-
|
|
53
|
-
|
|
54
|
-
|
|
55
|
-
|
|
56
|
-
|
|
57
|
-
if (delta)
|
|
58
|
-
completion += delta;
|
|
59
|
-
// Usage is typically in the final chunk (when stream_options.include_usage is set)
|
|
60
|
-
if (c?.usage) {
|
|
61
|
-
inputTokens = c.usage.prompt_tokens ?? inputTokens;
|
|
62
|
-
outputTokens = c.usage.completion_tokens ?? outputTokens;
|
|
63
|
-
}
|
|
49
|
+
accumulateChunk: (acc, chunk) => {
|
|
50
|
+
const c = chunk;
|
|
51
|
+
const delta = c?.choices?.[0]?.delta?.content;
|
|
52
|
+
if (delta)
|
|
53
|
+
acc.completion += delta;
|
|
54
|
+
if (c?.usage) {
|
|
55
|
+
acc.inputTokens = c.usage.prompt_tokens ?? acc.inputTokens;
|
|
56
|
+
acc.outputTokens = c.usage.completion_tokens ?? acc.outputTokens;
|
|
64
57
|
}
|
|
65
|
-
return { completion, inputTokens, outputTokens };
|
|
66
58
|
},
|
|
67
59
|
};
|
|
68
60
|
const embeddings = {
|
|
@@ -6,6 +6,12 @@ export interface Instrumentation {
|
|
|
6
6
|
/** Restore original methods. */
|
|
7
7
|
disable(): void;
|
|
8
8
|
}
|
|
9
|
+
/** Accumulated stream data — only primitives, no raw SDK objects. */
|
|
10
|
+
export interface StreamAccumulator {
|
|
11
|
+
completion: string;
|
|
12
|
+
inputTokens: number;
|
|
13
|
+
outputTokens: number;
|
|
14
|
+
}
|
|
9
15
|
/** Describes a single method to monkey-patch on an SDK prototype. */
|
|
10
16
|
export interface PatchTarget {
|
|
11
17
|
/** How to find the prototype from the loaded SDK module */
|
|
@@ -28,10 +34,6 @@ export interface PatchTarget {
|
|
|
28
34
|
shouldSkip?: (body: unknown) => boolean;
|
|
29
35
|
/** Return true if this call is a streaming request */
|
|
30
36
|
isStreaming?: (body: unknown) => boolean;
|
|
31
|
-
/**
|
|
32
|
-
|
|
33
|
-
completion: string;
|
|
34
|
-
inputTokens: number;
|
|
35
|
-
outputTokens: number;
|
|
36
|
-
};
|
|
37
|
+
/** Process one stream chunk — extract only the data we need into the accumulator. */
|
|
38
|
+
accumulateChunk?: (acc: StreamAccumulator, chunk: unknown) => void;
|
|
37
39
|
}
|
package/dist/types/metrics.d.ts
CHANGED
|
@@ -17,6 +17,7 @@ export declare const GEN_AI_METRICS: {
|
|
|
17
17
|
readonly GUARD_EVALUATIONS: "gen_ai.toad_eye.guard.evaluations";
|
|
18
18
|
readonly GUARD_WOULD_BLOCK: "gen_ai.toad_eye.guard.would_block";
|
|
19
19
|
readonly SEMANTIC_DRIFT: "gen_ai.toad_eye.semantic_drift";
|
|
20
|
+
readonly TIME_TO_FIRST_TOKEN: "gen_ai.client.time_to_first_token";
|
|
20
21
|
readonly BUDGET_EXCEEDED: "gen_ai.toad_eye.budget.exceeded";
|
|
21
22
|
readonly BUDGET_BLOCKED: "gen_ai.toad_eye.budget.blocked";
|
|
22
23
|
readonly BUDGET_DOWNGRADED: "gen_ai.toad_eye.budget.downgraded";
|
package/dist/types/metrics.js
CHANGED
|
@@ -20,6 +20,8 @@ export const GEN_AI_METRICS = {
|
|
|
20
20
|
GUARD_WOULD_BLOCK: "gen_ai.toad_eye.guard.would_block",
|
|
21
21
|
// Drift metrics
|
|
22
22
|
SEMANTIC_DRIFT: "gen_ai.toad_eye.semantic_drift",
|
|
23
|
+
// Streaming metrics
|
|
24
|
+
TIME_TO_FIRST_TOKEN: "gen_ai.client.time_to_first_token",
|
|
23
25
|
// Budget metrics
|
|
24
26
|
BUDGET_EXCEEDED: "gen_ai.toad_eye.budget.exceeded",
|
|
25
27
|
BUDGET_BLOCKED: "gen_ai.toad_eye.budget.blocked",
|
package/package.json
CHANGED
|
@@ -0,0 +1,191 @@
|
|
|
1
|
+
{
|
|
2
|
+
"annotations": { "list": [] },
|
|
3
|
+
"editable": true,
|
|
4
|
+
"fiscalYearStartMonth": 0,
|
|
5
|
+
"graphTooltip": 1,
|
|
6
|
+
"id": null,
|
|
7
|
+
"links": [],
|
|
8
|
+
"panels": [
|
|
9
|
+
{
|
|
10
|
+
"title": "Provider Status",
|
|
11
|
+
"description": "healthy (< 10% errors) / degraded (10-50%) / down (> 50%)",
|
|
12
|
+
"type": "stat",
|
|
13
|
+
"gridPos": { "h": 6, "w": 8, "x": 0, "y": 0 },
|
|
14
|
+
"datasource": { "type": "prometheus", "uid": "prometheus" },
|
|
15
|
+
"targets": [
|
|
16
|
+
{
|
|
17
|
+
"expr": "sum by (gen_ai_provider_name) (rate(gen_ai_client_errors_total{gen_ai_provider_name=~\"$provider\"}[5m])) / sum by (gen_ai_provider_name) (rate(gen_ai_client_requests_total{gen_ai_provider_name=~\"$provider\"}[5m]))",
|
|
18
|
+
"legendFormat": "{{gen_ai_provider_name}}",
|
|
19
|
+
"refId": "A"
|
|
20
|
+
}
|
|
21
|
+
],
|
|
22
|
+
"fieldConfig": {
|
|
23
|
+
"defaults": {
|
|
24
|
+
"unit": "percentunit",
|
|
25
|
+
"thresholds": {
|
|
26
|
+
"mode": "absolute",
|
|
27
|
+
"steps": [
|
|
28
|
+
{ "color": "green", "value": null },
|
|
29
|
+
{ "color": "yellow", "value": 0.1 },
|
|
30
|
+
{ "color": "red", "value": 0.5 }
|
|
31
|
+
]
|
|
32
|
+
},
|
|
33
|
+
"mappings": [
|
|
34
|
+
{
|
|
35
|
+
"type": "range",
|
|
36
|
+
"options": {
|
|
37
|
+
"from": 0,
|
|
38
|
+
"to": 0.1,
|
|
39
|
+
"result": { "text": "HEALTHY", "color": "green" }
|
|
40
|
+
}
|
|
41
|
+
},
|
|
42
|
+
{
|
|
43
|
+
"type": "range",
|
|
44
|
+
"options": {
|
|
45
|
+
"from": 0.1,
|
|
46
|
+
"to": 0.5,
|
|
47
|
+
"result": { "text": "DEGRADED", "color": "yellow" }
|
|
48
|
+
}
|
|
49
|
+
},
|
|
50
|
+
{
|
|
51
|
+
"type": "range",
|
|
52
|
+
"options": {
|
|
53
|
+
"from": 0.5,
|
|
54
|
+
"to": 1,
|
|
55
|
+
"result": { "text": "DOWN", "color": "red" }
|
|
56
|
+
}
|
|
57
|
+
}
|
|
58
|
+
]
|
|
59
|
+
},
|
|
60
|
+
"overrides": []
|
|
61
|
+
}
|
|
62
|
+
},
|
|
63
|
+
{
|
|
64
|
+
"title": "Request Volume by Provider",
|
|
65
|
+
"type": "timeseries",
|
|
66
|
+
"gridPos": { "h": 6, "w": 16, "x": 8, "y": 0 },
|
|
67
|
+
"datasource": { "type": "prometheus", "uid": "prometheus" },
|
|
68
|
+
"targets": [
|
|
69
|
+
{
|
|
70
|
+
"expr": "sum by (gen_ai_provider_name) (rate(gen_ai_client_requests_total{gen_ai_provider_name=~\"$provider\"}[5m]))",
|
|
71
|
+
"legendFormat": "{{gen_ai_provider_name}}",
|
|
72
|
+
"refId": "A"
|
|
73
|
+
}
|
|
74
|
+
],
|
|
75
|
+
"fieldConfig": {
|
|
76
|
+
"defaults": {
|
|
77
|
+
"unit": "reqps",
|
|
78
|
+
"custom": { "fillOpacity": 15 }
|
|
79
|
+
},
|
|
80
|
+
"overrides": []
|
|
81
|
+
}
|
|
82
|
+
},
|
|
83
|
+
{
|
|
84
|
+
"title": "Error Rate by Provider (5m window)",
|
|
85
|
+
"type": "timeseries",
|
|
86
|
+
"gridPos": { "h": 8, "w": 12, "x": 0, "y": 6 },
|
|
87
|
+
"datasource": { "type": "prometheus", "uid": "prometheus" },
|
|
88
|
+
"targets": [
|
|
89
|
+
{
|
|
90
|
+
"expr": "sum by (gen_ai_provider_name) (rate(gen_ai_client_errors_total{gen_ai_provider_name=~\"$provider\"}[5m])) / sum by (gen_ai_provider_name) (rate(gen_ai_client_requests_total{gen_ai_provider_name=~\"$provider\"}[5m]))",
|
|
91
|
+
"legendFormat": "{{gen_ai_provider_name}} error rate",
|
|
92
|
+
"refId": "A"
|
|
93
|
+
}
|
|
94
|
+
],
|
|
95
|
+
"fieldConfig": {
|
|
96
|
+
"defaults": {
|
|
97
|
+
"unit": "percentunit",
|
|
98
|
+
"custom": { "fillOpacity": 10 },
|
|
99
|
+
"thresholds": {
|
|
100
|
+
"mode": "absolute",
|
|
101
|
+
"steps": [
|
|
102
|
+
{ "color": "green", "value": null },
|
|
103
|
+
{ "color": "yellow", "value": 0.1 },
|
|
104
|
+
{ "color": "red", "value": 0.5 }
|
|
105
|
+
]
|
|
106
|
+
}
|
|
107
|
+
},
|
|
108
|
+
"overrides": []
|
|
109
|
+
}
|
|
110
|
+
},
|
|
111
|
+
{
|
|
112
|
+
"title": "Error Breakdown by Type",
|
|
113
|
+
"type": "timeseries",
|
|
114
|
+
"gridPos": { "h": 8, "w": 12, "x": 12, "y": 6 },
|
|
115
|
+
"datasource": { "type": "prometheus", "uid": "prometheus" },
|
|
116
|
+
"targets": [
|
|
117
|
+
{
|
|
118
|
+
"expr": "sum by (gen_ai_provider_name, error_type) (rate(gen_ai_client_errors_total{gen_ai_provider_name=~\"$provider\"}[5m]))",
|
|
119
|
+
"legendFormat": "{{gen_ai_provider_name}} — {{error_type}}",
|
|
120
|
+
"refId": "A"
|
|
121
|
+
}
|
|
122
|
+
],
|
|
123
|
+
"fieldConfig": {
|
|
124
|
+
"defaults": {
|
|
125
|
+
"unit": "reqps",
|
|
126
|
+
"custom": { "fillOpacity": 20, "stacking": { "mode": "normal" } }
|
|
127
|
+
},
|
|
128
|
+
"overrides": []
|
|
129
|
+
}
|
|
130
|
+
},
|
|
131
|
+
{
|
|
132
|
+
"title": "Provider Availability (24h / 7d / 30d)",
|
|
133
|
+
"description": "Percentage of time with error rate below 10%",
|
|
134
|
+
"type": "table",
|
|
135
|
+
"gridPos": { "h": 6, "w": 24, "x": 0, "y": 14 },
|
|
136
|
+
"datasource": { "type": "prometheus", "uid": "prometheus" },
|
|
137
|
+
"targets": [
|
|
138
|
+
{
|
|
139
|
+
"expr": "1 - (sum by (gen_ai_provider_name) (rate(gen_ai_client_errors_total[24h])) / sum by (gen_ai_provider_name) (rate(gen_ai_client_requests_total[24h])))",
|
|
140
|
+
"format": "table",
|
|
141
|
+
"instant": true,
|
|
142
|
+
"refId": "uptime_24h"
|
|
143
|
+
},
|
|
144
|
+
{
|
|
145
|
+
"expr": "1 - (sum by (gen_ai_provider_name) (rate(gen_ai_client_errors_total[7d])) / sum by (gen_ai_provider_name) (rate(gen_ai_client_requests_total[7d])))",
|
|
146
|
+
"format": "table",
|
|
147
|
+
"instant": true,
|
|
148
|
+
"refId": "uptime_7d"
|
|
149
|
+
}
|
|
150
|
+
],
|
|
151
|
+
"transformations": [
|
|
152
|
+
{
|
|
153
|
+
"id": "organize",
|
|
154
|
+
"options": {
|
|
155
|
+
"renameByName": {
|
|
156
|
+
"gen_ai_provider_name": "Provider",
|
|
157
|
+
"Value #uptime_24h": "Uptime 24h",
|
|
158
|
+
"Value #uptime_7d": "Uptime 7d"
|
|
159
|
+
}
|
|
160
|
+
}
|
|
161
|
+
}
|
|
162
|
+
],
|
|
163
|
+
"fieldConfig": {
|
|
164
|
+
"defaults": { "unit": "percentunit", "decimals": 2 },
|
|
165
|
+
"overrides": []
|
|
166
|
+
}
|
|
167
|
+
}
|
|
168
|
+
],
|
|
169
|
+
"schemaVersion": 39,
|
|
170
|
+
"tags": ["toad-eye", "provider-health"],
|
|
171
|
+
"templating": {
|
|
172
|
+
"list": [
|
|
173
|
+
{
|
|
174
|
+
"name": "provider",
|
|
175
|
+
"type": "query",
|
|
176
|
+
"datasource": { "type": "prometheus", "uid": "prometheus" },
|
|
177
|
+
"query": "label_values(gen_ai_client_requests_total, gen_ai_provider_name)",
|
|
178
|
+
"includeAll": true,
|
|
179
|
+
"multi": true,
|
|
180
|
+
"current": { "text": "All", "value": "$__all" },
|
|
181
|
+
"regex": ""
|
|
182
|
+
}
|
|
183
|
+
]
|
|
184
|
+
},
|
|
185
|
+
"time": { "from": "now-6h", "to": "now" },
|
|
186
|
+
"timepicker": {},
|
|
187
|
+
"timezone": "utc",
|
|
188
|
+
"title": "toad-eye / Provider Health",
|
|
189
|
+
"uid": "toad-eye-provider-health",
|
|
190
|
+
"version": 1
|
|
191
|
+
}
|