toad-eye 2.1.0 → 2.1.1
This diff represents the content of publicly available package versions that have been released to one of the supported registries. The information contained in this diff is provided for informational purposes only and reflects changes between package versions as they appear in their respective public registries.
- package/README.md +290 -109
- package/package.json +1 -1
package/README.md
CHANGED
|
@@ -1,171 +1,352 @@
|
|
|
1
|
-
# toad-eye
|
|
1
|
+
# toad-eye
|
|
2
2
|
|
|
3
|
-
|
|
4
|
-
|
|
5
|
-
|
|
6
|
-
|
|
3
|
+

|
|
4
|
+

|
|
5
|
+

|
|
6
|
+

|
|
7
|
+

|
|
8
|
+

|
|
9
|
+
[](https://www.npmjs.com/package/toad-eye)
|
|
10
|
+

|
|
11
|
+

|
|
7
12
|
|
|
8
|
-
|
|
13
|
+
OpenTelemetry-based observability toolkit for LLM systems.
|
|
9
14
|
|
|
10
|
-
|
|
11
|
-
> toad-eye gives you complete visibility with zero manual instrumentation.
|
|
15
|
+
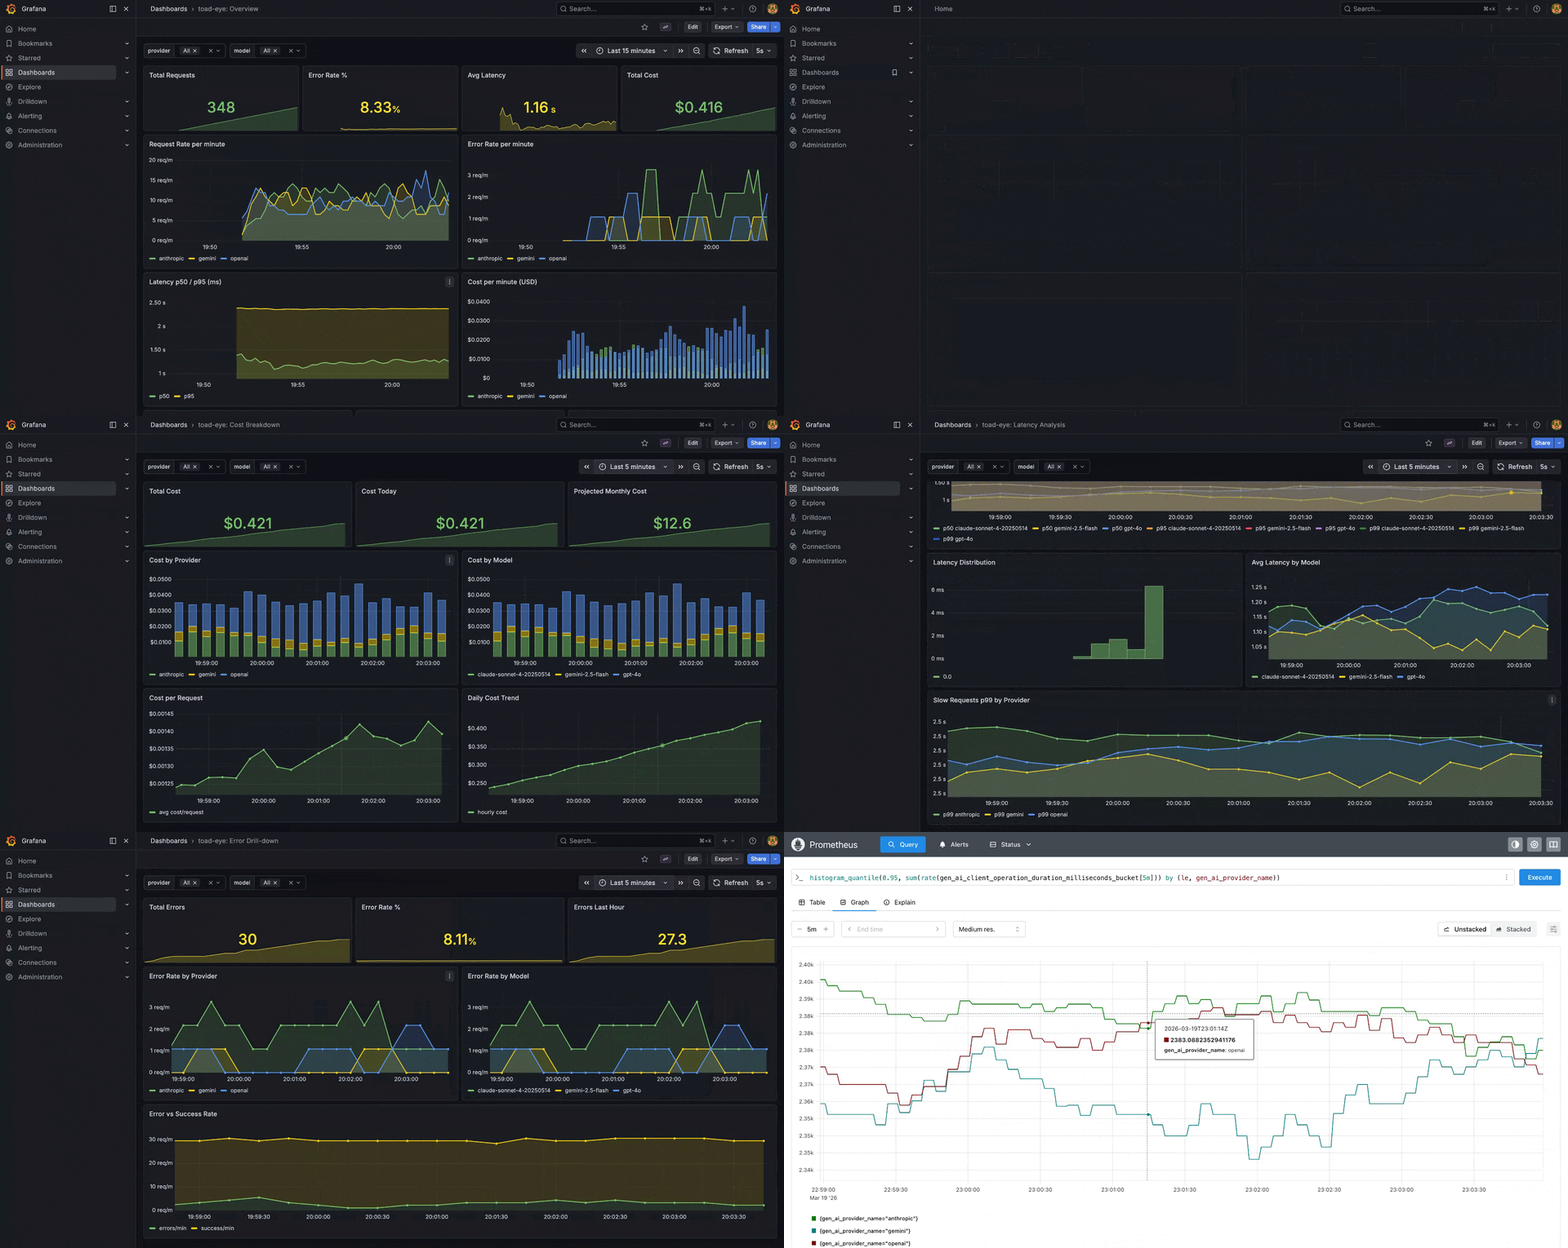
Auto-instrument any LLM SDK (including streaming), get traces, metrics, cost tracking, budget guards, agent observability, guardrail monitoring, and 6 Grafana dashboards out of the box. Self-hosted or cloud mode.
|
|
12
16
|
|
|
13
|
-
|
|
14
|
-
<!--  -->
|
|
17
|
+
|
|
15
18
|
|
|
16
|
-
|
|
17
|
-
|
|
18
|
-
## Quick Start
|
|
19
|
+
## Quick start
|
|
19
20
|
|
|
20
21
|
```bash
|
|
21
22
|
npm install toad-eye
|
|
22
|
-
npx toad-eye init
|
|
23
|
-
npx toad-eye up
|
|
23
|
+
npx toad-eye init # scaffold observability stack
|
|
24
|
+
npx toad-eye up # start Grafana + Prometheus + Jaeger
|
|
25
|
+
npx toad-eye demo # send mock LLM traffic, see data immediately
|
|
24
26
|
```
|
|
25
27
|
|
|
28
|
+
Open [localhost:3100](http://localhost:3100) (Grafana, admin/admin) to see your dashboards.
|
|
29
|
+
|
|
30
|
+
### Cloud mode
|
|
31
|
+
|
|
32
|
+
No Docker needed. Send telemetry to toad-eye cloud with one line:
|
|
33
|
+
|
|
34
|
+
```typescript
|
|
35
|
+
initObservability({
|
|
36
|
+
serviceName: "my-app",
|
|
37
|
+
apiKey: "toad_xxxxxxxx",
|
|
38
|
+
instrument: ["openai"],
|
|
39
|
+
});
|
|
40
|
+
```
|
|
41
|
+
|
|
42
|
+
Self-hosted mode remains the default. Cloud mode activates automatically when `apiKey` is set.
|
|
43
|
+
|
|
44
|
+
## Auto-instrumentation
|
|
45
|
+
|
|
46
|
+
Zero-code instrumentation for popular LLM SDKs. No wrappers needed.
|
|
47
|
+
|
|
26
48
|
```typescript
|
|
27
49
|
import { initObservability } from "toad-eye";
|
|
28
50
|
|
|
29
51
|
initObservability({
|
|
30
52
|
serviceName: "my-app",
|
|
31
|
-
instrument: ["
|
|
53
|
+
instrument: ["openai", "anthropic"],
|
|
54
|
+
});
|
|
55
|
+
|
|
56
|
+
// That's it. Every SDK call is auto-traced.
|
|
57
|
+
const result = await openai.chat.completions.create({
|
|
58
|
+
model: "gpt-4o",
|
|
59
|
+
messages: [{ role: "user", content: "Hello" }],
|
|
32
60
|
});
|
|
33
|
-
// Every LLM call is now automatically traced. Open http://localhost:3100
|
|
34
61
|
```
|
|
35
62
|
|
|
36
|
-
|
|
63
|
+
**Supported SDKs:** OpenAI (`openai`), Anthropic (`@anthropic-ai/sdk`), Google GenAI (`@google/generative-ai`)
|
|
37
64
|
|
|
38
|
-
|
|
65
|
+
Both regular and **streaming** calls are fully instrumented — spans, metrics, and cost tracking work transparently for `stream: true`.
|
|
39
66
|
|
|
40
|
-
|
|
67
|
+
### Manual instrumentation
|
|
41
68
|
|
|
42
|
-
|
|
69
|
+
For custom providers or fine-grained control:
|
|
70
|
+
|
|
71
|
+
```typescript
|
|
72
|
+
import { initObservability, traceLLMCall } from "toad-eye";
|
|
43
73
|
|
|
44
|
-
|
|
45
|
-
| ------------------------ | --------------------------------------------------------------------------------- |
|
|
46
|
-
| **Auto-instrumentation** | Patches Anthropic, OpenAI, Gemini SDKs — no code changes needed |
|
|
47
|
-
| **5 Grafana dashboards** | Overview · Cost Breakdown · Latency Analysis · Model Comparison · Error Drilldown |
|
|
48
|
-
| **Cost tracking** | Per-request USD cost, hourly/daily totals, top models by spend |
|
|
49
|
-
| **Cost alerts** | Threshold alerts via Telegram, Slack, email, or webhook |
|
|
50
|
-
| **Distributed traces** | Full spans in Jaeger with prompts, completions, tokens |
|
|
51
|
-
| **One-command stack** | `npx toad-eye up` starts the entire observability stack |
|
|
74
|
+
initObservability({ serviceName: "my-app" });
|
|
52
75
|
|
|
53
|
-
|
|
76
|
+
const result = await traceLLMCall(
|
|
77
|
+
{ provider: "anthropic", model: "claude-sonnet-4-20250514", prompt: "hello" },
|
|
78
|
+
() => callYourLLM(),
|
|
79
|
+
);
|
|
80
|
+
```
|
|
54
81
|
|
|
55
|
-
##
|
|
82
|
+
## Agent observability
|
|
56
83
|
|
|
57
|
-
|
|
58
|
-
flowchart LR
|
|
59
|
-
app["Your LLM App\n(toad-eye SDK)"]
|
|
60
|
-
col["OTel Collector\n:4318"]
|
|
61
|
-
prom["Prometheus\n:9090"]
|
|
62
|
-
jaeger["Jaeger\n:16686"]
|
|
63
|
-
grafana["Grafana\n:3100"]
|
|
84
|
+
Structured tracing for ReAct agents (think / act / observe / answer) as nested OpenTelemetry spans.
|
|
64
85
|
|
|
65
|
-
|
|
66
|
-
|
|
67
|
-
|
|
68
|
-
|
|
69
|
-
|
|
86
|
+
```typescript
|
|
87
|
+
import { traceAgentQuery } from "toad-eye";
|
|
88
|
+
|
|
89
|
+
const result = await traceAgentQuery(
|
|
90
|
+
"Is anything dangerous near Earth?",
|
|
91
|
+
async (step) => {
|
|
92
|
+
step({
|
|
93
|
+
type: "think",
|
|
94
|
+
stepNumber: 1,
|
|
95
|
+
content: "I need to check asteroids",
|
|
96
|
+
});
|
|
97
|
+
const data = await callTool("near-earth-asteroids");
|
|
98
|
+
step({ type: "act", stepNumber: 2, toolName: "near-earth-asteroids" });
|
|
99
|
+
step({
|
|
100
|
+
type: "observe",
|
|
101
|
+
stepNumber: 3,
|
|
102
|
+
content: `${data.length} asteroids found`,
|
|
103
|
+
});
|
|
104
|
+
step({
|
|
105
|
+
type: "answer",
|
|
106
|
+
stepNumber: 4,
|
|
107
|
+
content: "7 asteroids passing safely",
|
|
108
|
+
});
|
|
109
|
+
return { answer: "7 asteroids passing safely" };
|
|
110
|
+
},
|
|
111
|
+
);
|
|
70
112
|
```
|
|
71
113
|
|
|
72
|
-
|
|
73
|
-
| ---------- | ------------------------------------- |
|
|
74
|
-
| Grafana | http://localhost:3100 (admin / admin) |
|
|
75
|
-
| Jaeger | http://localhost:16686 |
|
|
76
|
-
| Prometheus | http://localhost:9090 |
|
|
77
|
-
|
|
78
|
-
---
|
|
114
|
+
Metrics: steps per query (histogram), tool usage frequency (counter per tool name).
|
|
79
115
|
|
|
80
|
-
##
|
|
116
|
+
## Shadow guardrails
|
|
81
117
|
|
|
82
|
-
|
|
83
|
-
| ---------------------- | --------- | ------------------------------------------- |
|
|
84
|
-
| `llm.request.duration` | Histogram | Request latency (ms), by provider + model |
|
|
85
|
-
| `llm.request.cost` | Histogram | Cost per request (USD), by provider + model |
|
|
86
|
-
| `llm.tokens` | Counter | Total tokens consumed (input + output) |
|
|
87
|
-
| `llm.requests` | Counter | Total requests made |
|
|
88
|
-
| `llm.errors` | Counter | Total failed requests |
|
|
118
|
+
Validate LLM responses without blocking them. Record what _would_ have been blocked, then decide when to enforce.
|
|
89
119
|
|
|
90
|
-
|
|
120
|
+
```typescript
|
|
121
|
+
import { recordGuardResult } from "toad-eye";
|
|
122
|
+
|
|
123
|
+
// toad-guard validates, toad-eye records
|
|
124
|
+
const result = guard.validate(response);
|
|
125
|
+
recordGuardResult({
|
|
126
|
+
mode: "shadow",
|
|
127
|
+
passed: false,
|
|
128
|
+
ruleName: "pii_filter",
|
|
129
|
+
failureReason: "SSN detected in response",
|
|
130
|
+
});
|
|
131
|
+
```
|
|
91
132
|
|
|
92
|
-
|
|
133
|
+
Metrics: `guard.evaluations` (total checks), `guard.would_block` (would-have-blocked count) per rule name.
|
|
93
134
|
|
|
94
|
-
|
|
135
|
+
## Semantic drift monitoring
|
|
95
136
|
|
|
96
|
-
|
|
137
|
+
Detect silent LLM quality degradation by comparing current responses to a saved baseline via embeddings.
|
|
97
138
|
|
|
98
139
|
```typescript
|
|
99
|
-
import {
|
|
140
|
+
import { createDriftMonitor, saveBaseline } from "toad-eye";
|
|
100
141
|
|
|
101
|
-
const
|
|
102
|
-
{ provider: "
|
|
103
|
-
|
|
104
|
-
|
|
105
|
-
|
|
106
|
-
|
|
107
|
-
|
|
108
|
-
|
|
109
|
-
|
|
110
|
-
|
|
142
|
+
const monitor = createDriftMonitor({
|
|
143
|
+
embedding: { provider: "openai", apiKey: process.env.OPENAI_API_KEY! },
|
|
144
|
+
baselinePath: "./baseline.json",
|
|
145
|
+
sampleRate: 10, // check every 10th response
|
|
146
|
+
});
|
|
147
|
+
|
|
148
|
+
// In your LLM call handler:
|
|
149
|
+
const drift = await monitor.check(response, "openai", "gpt-4o");
|
|
150
|
+
// drift = 0 → identical to baseline
|
|
151
|
+
// drift > 0.3 → significant deviation
|
|
111
152
|
```
|
|
112
153
|
|
|
113
|
-
|
|
154
|
+
## Trace-to-dataset export
|
|
155
|
+
|
|
156
|
+
Convert production Jaeger traces into test cases. Production failure becomes a regression test.
|
|
114
157
|
|
|
115
|
-
|
|
158
|
+
```bash
|
|
159
|
+
npx toad-eye export-trace <trace_id> --output ./evals/
|
|
160
|
+
```
|
|
161
|
+
|
|
162
|
+
Generates YAML in toad-eval format with auto-generated assertions (max length, refusal detection, JSON validation).
|
|
163
|
+
|
|
164
|
+
## Features
|
|
165
|
+
|
|
166
|
+
### Built-in cost tracking
|
|
167
|
+
|
|
168
|
+
Automatic cost calculation for major models (GPT-4o, Claude, Gemini) based on token usage. Custom pricing for enterprise contracts:
|
|
116
169
|
|
|
117
170
|
```typescript
|
|
118
|
-
|
|
171
|
+
import { setCustomPricing } from "toad-eye";
|
|
172
|
+
|
|
173
|
+
setCustomPricing({
|
|
174
|
+
"my-fine-tuned-model": { inputPer1M: 5, outputPer1M: 15 },
|
|
175
|
+
});
|
|
119
176
|
```
|
|
120
177
|
|
|
121
|
-
###
|
|
178
|
+
### Privacy controls
|
|
122
179
|
|
|
123
|
-
|
|
180
|
+
```typescript
|
|
181
|
+
initObservability({
|
|
182
|
+
serviceName: "my-app",
|
|
183
|
+
recordContent: false, // disable prompt/completion recording
|
|
184
|
+
hashContent: true, // SHA-256 hash instead of plain text
|
|
185
|
+
redactPatterns: [/\b\S+@\S+\.\S+\b/g], // regex redaction
|
|
186
|
+
});
|
|
187
|
+
```
|
|
188
|
+
|
|
189
|
+
### Session tracking
|
|
190
|
+
|
|
191
|
+
Group traces by conversation session:
|
|
124
192
|
|
|
125
193
|
```typescript
|
|
126
|
-
|
|
127
|
-
|
|
128
|
-
|
|
129
|
-
|
|
130
|
-
|
|
131
|
-
telegram: {
|
|
132
|
-
type: "telegram",
|
|
133
|
-
token: process.env.TG_TOKEN!,
|
|
134
|
-
chatId: process.env.TG_CHAT!,
|
|
135
|
-
},
|
|
136
|
-
},
|
|
137
|
-
alerts: [
|
|
138
|
-
{
|
|
139
|
-
name: "cost_spike",
|
|
140
|
-
metric: "llm.request.cost",
|
|
141
|
-
condition: "sum_1h > 10",
|
|
142
|
-
channels: ["telegram"],
|
|
143
|
-
},
|
|
144
|
-
],
|
|
194
|
+
initObservability({
|
|
195
|
+
serviceName: "my-app",
|
|
196
|
+
sessionId: "static-session-id",
|
|
197
|
+
// or dynamic:
|
|
198
|
+
sessionExtractor: () => getCurrentSessionId(),
|
|
145
199
|
});
|
|
200
|
+
```
|
|
146
201
|
|
|
147
|
-
|
|
202
|
+
### Alerting
|
|
203
|
+
|
|
204
|
+
Cost spikes, latency anomalies, error rate monitoring via YAML config:
|
|
205
|
+
|
|
206
|
+
```yaml
|
|
207
|
+
alerts:
|
|
208
|
+
- name: cost_spike
|
|
209
|
+
metric: gen_ai.client.request.cost
|
|
210
|
+
condition: sum_1h > 10
|
|
211
|
+
channels: [slack]
|
|
212
|
+
|
|
213
|
+
- name: latency_anomaly
|
|
214
|
+
metric: gen_ai.client.operation.duration
|
|
215
|
+
condition: p95_pct_5m_7d > 50
|
|
216
|
+
channels: [slack]
|
|
217
|
+
|
|
218
|
+
- name: error_rate
|
|
219
|
+
metric: gen_ai.client.errors
|
|
220
|
+
condition: ratio_15m > 0.05
|
|
221
|
+
channels: [slack]
|
|
148
222
|
```
|
|
149
223
|
|
|
150
|
-
|
|
224
|
+
Delivery channels: Telegram, Slack webhook, generic HTTP webhook, email (SMTP).
|
|
151
225
|
|
|
152
|
-
###
|
|
226
|
+
### Budget guards
|
|
227
|
+
|
|
228
|
+
Prevent cost overruns at runtime. Three modes: warn, block, or auto-downgrade to a cheaper model.
|
|
153
229
|
|
|
154
230
|
```typescript
|
|
155
231
|
initObservability({
|
|
156
232
|
serviceName: "my-app",
|
|
157
|
-
|
|
233
|
+
budgets: {
|
|
234
|
+
daily: 50, // $50/day max
|
|
235
|
+
perUser: 5, // $5/day per user
|
|
236
|
+
perModel: { "gpt-4o": 30 }, // $30/day on GPT-4o
|
|
237
|
+
},
|
|
238
|
+
onBudgetExceeded: "block", // throws ToadBudgetExceededError
|
|
158
239
|
});
|
|
159
240
|
```
|
|
160
241
|
|
|
161
|
-
|
|
242
|
+
| Mode | Behavior |
|
|
243
|
+
| ----------- | --------------------------------------------------- |
|
|
244
|
+
| `warn` | Log warning, continue normally |
|
|
245
|
+
| `block` | Throw `ToadBudgetExceededError` before LLM call |
|
|
246
|
+
| `downgrade` | Call `downgradeCallback` to switch to cheaper model |
|
|
162
247
|
|
|
163
|
-
##
|
|
248
|
+
## FinOps attribution
|
|
164
249
|
|
|
165
|
-
|
|
166
|
-
|
|
167
|
-
|
|
168
|
-
|
|
169
|
-
|
|
170
|
-
|
|
250
|
+
Track costs by team, user, feature, or any business dimension:
|
|
251
|
+
|
|
252
|
+
```typescript
|
|
253
|
+
// Global attributes — applied to all spans/metrics
|
|
254
|
+
initObservability({
|
|
255
|
+
serviceName: "my-app",
|
|
256
|
+
attributes: { team: "checkout", environment: "production" },
|
|
257
|
+
});
|
|
258
|
+
|
|
259
|
+
// Per-request attributes — override or extend global
|
|
260
|
+
await traceLLMCall(
|
|
261
|
+
{
|
|
262
|
+
provider: "openai",
|
|
263
|
+
model: "gpt-4o",
|
|
264
|
+
prompt: "Summarize order",
|
|
265
|
+
attributes: { userId: "user-123", feature: "order-summary" },
|
|
266
|
+
},
|
|
267
|
+
() => callLLM(),
|
|
268
|
+
);
|
|
171
269
|
```
|
|
270
|
+
|
|
271
|
+
## Grafana dashboards
|
|
272
|
+
|
|
273
|
+
6 pre-built dashboards auto-provisioned on `npx toad-eye init`:
|
|
274
|
+
|
|
275
|
+
| Dashboard | What it shows |
|
|
276
|
+
| ---------------------- | --------------------------------------------------------- |
|
|
277
|
+
| **Overview** | Request rate, error rate, latency p50/p95, cost, totals |
|
|
278
|
+
| **Cost Breakdown** | Spend by provider/model, daily trend, projected monthly |
|
|
279
|
+
| **Latency Analysis** | p50/p95/p99 by model, distribution histogram |
|
|
280
|
+
| **Error Drill-down** | Error rate by provider/model, error vs success |
|
|
281
|
+
| **Model Comparison** | Latency vs cost vs error rate vs throughput per model |
|
|
282
|
+
| **FinOps Attribution** | Cost by team/user/feature, projected spend, what-if table |
|
|
283
|
+
|
|
284
|
+
All dashboards have template variables for filtering (`$provider`, `$model`, `$team`, `$feature`).
|
|
285
|
+
|
|
286
|
+
## CLI
|
|
287
|
+
|
|
288
|
+
| Command | Description |
|
|
289
|
+
| -------------------------------- | ----------------------------------------------- |
|
|
290
|
+
| `npx toad-eye init` | Scaffold Docker Compose + observability configs |
|
|
291
|
+
| `npx toad-eye up` | Start the stack |
|
|
292
|
+
| `npx toad-eye down` | Stop the stack |
|
|
293
|
+
| `npx toad-eye status` | Show running services and URLs |
|
|
294
|
+
| `npx toad-eye demo` | Send mock LLM traffic to see data in Grafana |
|
|
295
|
+
| `npx toad-eye export-trace <id>` | Export a Jaeger trace to toad-eval YAML |
|
|
296
|
+
|
|
297
|
+
## Architecture
|
|
298
|
+
|
|
299
|
+

|
|
300
|
+
|
|
301
|
+
## What it tracks
|
|
302
|
+
|
|
303
|
+
### Metrics (OTel GenAI semconv)
|
|
304
|
+
|
|
305
|
+
| Metric | Type | Description |
|
|
306
|
+
| ----------------------------------- | --------- | ----------------------------------- |
|
|
307
|
+
| `gen_ai.client.operation.duration` | Histogram | Request latency (ms) |
|
|
308
|
+
| `gen_ai.client.request.cost` | Histogram | Cost per request (USD) |
|
|
309
|
+
| `gen_ai.client.token.usage` | Counter | Total tokens consumed |
|
|
310
|
+
| `gen_ai.client.requests` | Counter | Total requests |
|
|
311
|
+
| `gen_ai.client.errors` | Counter | Total failed requests |
|
|
312
|
+
| `gen_ai.agent.steps_per_query` | Histogram | Agent steps per query |
|
|
313
|
+
| `gen_ai.agent.tool_usage` | Counter | Agent tool invocations by tool name |
|
|
314
|
+
| `gen_ai.toad_eye.guard.evaluations` | Counter | Guard evaluations per rule |
|
|
315
|
+
| `gen_ai.toad_eye.guard.would_block` | Counter | Would-have-blocked per rule |
|
|
316
|
+
| `gen_ai.toad_eye.semantic_drift` | Histogram | Semantic drift from baseline (0..1) |
|
|
317
|
+
| `gen_ai.toad_eye.budget.exceeded` | Counter | Budget limit exceeded events |
|
|
318
|
+
| `gen_ai.toad_eye.budget.blocked` | Counter | LLM calls blocked by budget |
|
|
319
|
+
| `gen_ai.toad_eye.budget.downgraded` | Counter | LLM calls downgraded by budget |
|
|
320
|
+
|
|
321
|
+
All metrics labeled with `gen_ai.provider.name` and `gen_ai.request.model`.
|
|
322
|
+
|
|
323
|
+
### Span attributes
|
|
324
|
+
|
|
325
|
+
| Attribute | Description |
|
|
326
|
+
| ---------------------------- | ------------------------------------ |
|
|
327
|
+
| `gen_ai.provider.name` | `anthropic`, `gemini`, `openai` |
|
|
328
|
+
| `gen_ai.request.model` | Model identifier |
|
|
329
|
+
| `gen_ai.usage.input_tokens` | Tokens in the prompt |
|
|
330
|
+
| `gen_ai.usage.output_tokens` | Tokens in the completion |
|
|
331
|
+
| `gen_ai.request.temperature` | Temperature parameter |
|
|
332
|
+
| `gen_ai.toad_eye.cost` | Cost in USD |
|
|
333
|
+
| `gen_ai.agent.step.type` | Agent step: think/act/observe/answer |
|
|
334
|
+
| `gen_ai.agent.tool.name` | Tool name for agent act steps |
|
|
335
|
+
| `gen_ai.toad_eye.guard.mode` | Guard mode: shadow/enforce |
|
|
336
|
+
| `session.id` | Session identifier (if configured) |
|
|
337
|
+
|
|
338
|
+
## Services
|
|
339
|
+
|
|
340
|
+
| Service | URL |
|
|
341
|
+
| -------------- | ------------------------------------------------------- |
|
|
342
|
+
| Grafana | [localhost:3100](http://localhost:3100) (admin / admin) |
|
|
343
|
+
| Jaeger UI | [localhost:16686](http://localhost:16686) |
|
|
344
|
+
| Prometheus | [localhost:9090](http://localhost:9090) |
|
|
345
|
+
| OTel Collector | [localhost:4318](http://localhost:4318) |
|
|
346
|
+
|
|
347
|
+
## Tech stack
|
|
348
|
+
|
|
349
|
+
- TypeScript, OpenTelemetry SDK 2.x, OTel GenAI semantic conventions
|
|
350
|
+
- Hono (demo server + cloud ingestion server)
|
|
351
|
+
- Docker Compose (Prometheus, Jaeger, Grafana, OTel Collector)
|
|
352
|
+
- Vitest (154 tests)
|