tinybase 8.5.0-beta.2 → 8.5.0-beta.3
This diff represents the content of publicly available package versions that have been released to one of the supported registries. The information contained in this diff is provided for informational purposes only and reflects changes between package versions as they appear in their respective public registries.
- package/@types/ui-react-dom-charts/index.d.ts +223 -36
- package/@types/ui-react-dom-charts/with-schemas/index.d.ts +244 -57
- package/min/ui-react-dom-charts/index.js +1 -1
- package/min/ui-react-dom-charts/index.js.gz +0 -0
- package/min/ui-react-dom-charts/with-schemas/index.js +1 -1
- package/min/ui-react-dom-charts/with-schemas/index.js.gz +0 -0
- package/package.json +9 -9
- package/readme.md +13 -13
- package/releases.md +57 -57
- package/ui-react-dom-charts/index.js +119 -36
- package/ui-react-dom-charts/with-schemas/index.js +119 -36
|
@@ -1,14 +1,14 @@
|
|
|
1
1
|
/**
|
|
2
|
-
* The ui-react-dom-charts module of the TinyBase project provides components
|
|
3
|
-
*
|
|
2
|
+
* The ui-react-dom-charts module of the TinyBase project provides components to
|
|
3
|
+
* make it easy to create web-based reactive charts with Store and Queries
|
|
4
4
|
* objects.
|
|
5
5
|
*
|
|
6
6
|
* The components in this module use the react-dom module and so are not
|
|
7
7
|
* appropriate for environments like React Native (although those in the
|
|
8
8
|
* lower-level ui-react module are).
|
|
9
9
|
*
|
|
10
|
-
* For a full list of SVG class names that can be styled with CSS, see the
|
|
11
|
-
*
|
|
10
|
+
* For a full list of SVG class names that can be styled with CSS, see the Using
|
|
11
|
+
* Charts guide.
|
|
12
12
|
* @packageDocumentation
|
|
13
13
|
* @module ui-react-dom-charts
|
|
14
14
|
* @since v8.5.0
|
|
@@ -22,8 +22,8 @@ import type {
|
|
|
22
22
|
} from '../ui-react/index.d.ts';
|
|
23
23
|
|
|
24
24
|
/**
|
|
25
|
-
* The ChartProps type describes the props that are used to configure the
|
|
26
|
-
*
|
|
25
|
+
* The ChartProps type describes the props that are used to configure the chart
|
|
26
|
+
* element that renders a chart.
|
|
27
27
|
* @category Configuration
|
|
28
28
|
* @since v8.5.0
|
|
29
29
|
*/
|
|
@@ -39,12 +39,12 @@ export type ChartProps = {
|
|
|
39
39
|
};
|
|
40
40
|
|
|
41
41
|
/**
|
|
42
|
-
* The
|
|
42
|
+
* The TableSourceProps type describes the props that bind a chart to a
|
|
43
43
|
* Table in a Store.
|
|
44
44
|
* @category Configuration
|
|
45
45
|
* @since v8.5.0
|
|
46
46
|
*/
|
|
47
|
-
export type
|
|
47
|
+
export type TableSourceProps = {
|
|
48
48
|
/**
|
|
49
49
|
* The Id of the Table in the Store to chart.
|
|
50
50
|
* @category Prop
|
|
@@ -73,12 +73,12 @@ export type ChartTableSourceProps = {
|
|
|
73
73
|
};
|
|
74
74
|
|
|
75
75
|
/**
|
|
76
|
-
* The
|
|
76
|
+
* The QuerySourceProps type describes the props that bind a chart to a
|
|
77
77
|
* Query in a Queries object.
|
|
78
78
|
* @category Configuration
|
|
79
79
|
* @since v8.5.0
|
|
80
80
|
*/
|
|
81
|
-
export type
|
|
81
|
+
export type QuerySourceProps = {
|
|
82
82
|
/**
|
|
83
83
|
* The Id of the query in the Queries object to chart.
|
|
84
84
|
* @category Prop
|
|
@@ -107,13 +107,14 @@ export type ChartQuerySourceProps = {
|
|
|
107
107
|
};
|
|
108
108
|
|
|
109
109
|
/**
|
|
110
|
-
* The
|
|
111
|
-
* BarChart component to Cell values in TinyBase data. An x Cell
|
|
112
|
-
* finite number, string, or boolean. A y Cell value must be a
|
|
110
|
+
* The BindingProps type describes the props that bind a LineChart
|
|
111
|
+
* component or BarChart component to Cell values in TinyBase data. An x Cell
|
|
112
|
+
* value can be a finite number, string, or boolean. A y Cell value must be a
|
|
113
|
+
* finite number.
|
|
113
114
|
* @category Configuration
|
|
114
115
|
* @since v8.5.0
|
|
115
116
|
*/
|
|
116
|
-
export type
|
|
117
|
+
export type BindingProps = {
|
|
117
118
|
/**
|
|
118
119
|
* The Id of the Cell that provides each data point's x value. Finite numbers
|
|
119
120
|
* can be used as continuous x values in line charts, while strings and
|
|
@@ -158,13 +159,13 @@ export type ChartBindingProps = {
|
|
|
158
159
|
};
|
|
159
160
|
|
|
160
161
|
/**
|
|
161
|
-
* The
|
|
162
|
-
*
|
|
163
|
-
*
|
|
162
|
+
* The SeriesProps type describes the props that bind a chart series to Cell
|
|
163
|
+
* values in TinyBase data. An x Cell value can be a finite number, string, or
|
|
164
|
+
* boolean. A y Cell value must be a finite number.
|
|
164
165
|
* @category Configuration
|
|
165
166
|
* @since v8.5.0
|
|
166
167
|
*/
|
|
167
|
-
export type
|
|
168
|
+
export type SeriesProps = {
|
|
168
169
|
/**
|
|
169
170
|
* An optional string that will be added to the class attribute of the series'
|
|
170
171
|
* SVG group element.
|
|
@@ -222,16 +223,154 @@ export type ChartSeriesProps = {
|
|
|
222
223
|
readonly limit?: number;
|
|
223
224
|
};
|
|
224
225
|
|
|
226
|
+
/**
|
|
227
|
+
* The XAxisProps type describes the props that configure the x axis of a
|
|
228
|
+
* CartesianChart component.
|
|
229
|
+
*
|
|
230
|
+
* The x axis is inferred by default. Use an XAxis component child when you want
|
|
231
|
+
* to override its title, numeric bounds, tick values, tick count, tick labels,
|
|
232
|
+
* or SVG class name.
|
|
233
|
+
* @category Configuration
|
|
234
|
+
* @since v8.5.0
|
|
235
|
+
*/
|
|
236
|
+
export type XAxisProps = {
|
|
237
|
+
/**
|
|
238
|
+
* An optional string that will be added to the class attribute of the x-axis
|
|
239
|
+
* SVG group element.
|
|
240
|
+
* @category Prop
|
|
241
|
+
* @since v8.5.0
|
|
242
|
+
*/
|
|
243
|
+
readonly className?: string;
|
|
244
|
+
/**
|
|
245
|
+
* An optional title to use for the x axis, defaulting to the x Cell Id, or to
|
|
246
|
+
* a combined title when multiple series use different x Cell Ids.
|
|
247
|
+
* @category Prop
|
|
248
|
+
* @since v8.5.0
|
|
249
|
+
*/
|
|
250
|
+
readonly title?: string;
|
|
251
|
+
/**
|
|
252
|
+
* An optional minimum x-axis bound for continuous numeric x values.
|
|
253
|
+
*
|
|
254
|
+
* This prop is ignored when the x axis is categorical.
|
|
255
|
+
* @category Prop
|
|
256
|
+
* @since v8.5.0
|
|
257
|
+
*/
|
|
258
|
+
readonly min?: number;
|
|
259
|
+
/**
|
|
260
|
+
* An optional maximum x-axis bound for continuous numeric x values.
|
|
261
|
+
*
|
|
262
|
+
* This prop is ignored when the x axis is categorical.
|
|
263
|
+
* @category Prop
|
|
264
|
+
* @since v8.5.0
|
|
265
|
+
*/
|
|
266
|
+
readonly max?: number;
|
|
267
|
+
/**
|
|
268
|
+
* Optional numeric tick values to use for a continuous x axis.
|
|
269
|
+
*
|
|
270
|
+
* This prop is ignored when the x axis is categorical.
|
|
271
|
+
* @category Prop
|
|
272
|
+
* @since v8.5.0
|
|
273
|
+
*/
|
|
274
|
+
readonly ticks?: readonly number[];
|
|
275
|
+
/**
|
|
276
|
+
* An optional preferred number of ticks to render on a continuous x axis.
|
|
277
|
+
*
|
|
278
|
+
* The actual number of ticks may vary so that labels remain readable.
|
|
279
|
+
* @category Prop
|
|
280
|
+
* @since v8.5.0
|
|
281
|
+
*/
|
|
282
|
+
readonly tickCount?: number;
|
|
283
|
+
/**
|
|
284
|
+
* An optional function for formatting x-axis tick labels.
|
|
285
|
+
*
|
|
286
|
+
* It receives the original tick value, which can be a finite number, string,
|
|
287
|
+
* or boolean.
|
|
288
|
+
* @category Prop
|
|
289
|
+
* @since v8.5.0
|
|
290
|
+
*/
|
|
291
|
+
readonly tickFormatter?: (tick: boolean | number | string) => string;
|
|
292
|
+
};
|
|
293
|
+
|
|
294
|
+
/**
|
|
295
|
+
* The YAxisProps type describes the props that configure the y axis of a
|
|
296
|
+
* CartesianChart component.
|
|
297
|
+
*
|
|
298
|
+
* The y axis is inferred by default. Use a YAxis component child when you want
|
|
299
|
+
* to override its title, numeric bounds, tick values, tick count, tick labels,
|
|
300
|
+
* or SVG class name.
|
|
301
|
+
* @category Configuration
|
|
302
|
+
* @since v8.5.0
|
|
303
|
+
*/
|
|
304
|
+
export type YAxisProps = {
|
|
305
|
+
/**
|
|
306
|
+
* An optional string that will be added to the class attribute of the y-axis
|
|
307
|
+
* SVG group element.
|
|
308
|
+
* @category Prop
|
|
309
|
+
* @since v8.5.0
|
|
310
|
+
*/
|
|
311
|
+
readonly className?: string;
|
|
312
|
+
/**
|
|
313
|
+
* An optional title to use for the y axis, defaulting to the y Cell Id, y
|
|
314
|
+
* series label, or a combined title when multiple series use different y Cell
|
|
315
|
+
* Ids or labels.
|
|
316
|
+
* @category Prop
|
|
317
|
+
* @since v8.5.0
|
|
318
|
+
*/
|
|
319
|
+
readonly title?: string;
|
|
320
|
+
/**
|
|
321
|
+
* An optional minimum y-axis bound.
|
|
322
|
+
* @category Prop
|
|
323
|
+
* @since v8.5.0
|
|
324
|
+
*/
|
|
325
|
+
readonly min?: number;
|
|
326
|
+
/**
|
|
327
|
+
* An optional maximum y-axis bound.
|
|
328
|
+
* @category Prop
|
|
329
|
+
* @since v8.5.0
|
|
330
|
+
*/
|
|
331
|
+
readonly max?: number;
|
|
332
|
+
/**
|
|
333
|
+
* Optional numeric tick values to use for the y axis.
|
|
334
|
+
* @category Prop
|
|
335
|
+
* @since v8.5.0
|
|
336
|
+
*/
|
|
337
|
+
readonly ticks?: readonly number[];
|
|
338
|
+
/**
|
|
339
|
+
* An optional preferred number of ticks to render on the y axis.
|
|
340
|
+
*
|
|
341
|
+
* The actual number of ticks may vary so that labels remain readable.
|
|
342
|
+
* @category Prop
|
|
343
|
+
* @since v8.5.0
|
|
344
|
+
*/
|
|
345
|
+
readonly tickCount?: number;
|
|
346
|
+
/**
|
|
347
|
+
* An optional function for formatting y-axis tick labels.
|
|
348
|
+
*
|
|
349
|
+
* It receives the numeric tick value.
|
|
350
|
+
* @category Prop
|
|
351
|
+
* @since v8.5.0
|
|
352
|
+
*/
|
|
353
|
+
readonly tickFormatter?: (tick: number) => string;
|
|
354
|
+
};
|
|
355
|
+
|
|
225
356
|
/**
|
|
226
357
|
* The CartesianChart component renders a chart frame and provides TinyBase
|
|
227
|
-
* source and layout context to
|
|
358
|
+
* source and layout context to LineSeries component and BarSeries component
|
|
359
|
+
* children.
|
|
360
|
+
*
|
|
361
|
+
* See the Composing Charts (React) demo for this component in action:
|
|
228
362
|
*
|
|
229
|
-
*
|
|
363
|
+
* 
|
|
365
|
+
*
|
|
366
|
+
* The series children declare their own xCellId and yCellId bindings. The
|
|
367
|
+
* optional XAxis component and YAxis component children can be used to
|
|
368
|
+
* configure axis titles, bounds, ticks, and tick formatting.
|
|
230
369
|
* @category Store components
|
|
231
370
|
* @since v8.5.0
|
|
232
371
|
* @example
|
|
233
|
-
* This example creates a Store and renders two LineSeries
|
|
234
|
-
* CartesianChart.
|
|
372
|
+
* This example creates a Store and renders two LineSeries component children
|
|
373
|
+
* in a CartesianChart component.
|
|
235
374
|
*
|
|
236
375
|
* ```jsx
|
|
237
376
|
* import React from 'react';
|
|
@@ -266,35 +405,82 @@ export type ChartSeriesProps = {
|
|
|
266
405
|
* ```
|
|
267
406
|
*/
|
|
268
407
|
export function CartesianChart(
|
|
269
|
-
props: (
|
|
408
|
+
props: (TableSourceProps | QuerySourceProps) &
|
|
270
409
|
ChartProps & {readonly children?: ReactNode},
|
|
271
410
|
): ComponentReturnType;
|
|
272
411
|
|
|
273
412
|
/**
|
|
274
|
-
* The
|
|
275
|
-
*
|
|
276
|
-
*
|
|
277
|
-
*
|
|
278
|
-
*
|
|
413
|
+
* The XAxis component configures the x axis of a CartesianChart component.
|
|
414
|
+
*
|
|
415
|
+
* It is a configuration child rather than a separately rendered SVG element:
|
|
416
|
+
* include zero or one XAxis component in a CartesianChart component's children.
|
|
417
|
+
* If omitted, the x axis is inferred from the chart's series.
|
|
418
|
+
*
|
|
419
|
+
* See the Axis Overrides (React) demo for this component in action:
|
|
420
|
+
*
|
|
421
|
+
* 
|
|
279
423
|
* @category Store components
|
|
280
424
|
* @since v8.5.0
|
|
281
425
|
*/
|
|
282
|
-
export function
|
|
426
|
+
export function XAxis(props: XAxisProps): ComponentReturnType;
|
|
427
|
+
|
|
428
|
+
/**
|
|
429
|
+
* The YAxis component configures the y axis of a CartesianChart component.
|
|
430
|
+
*
|
|
431
|
+
* It is a configuration child rather than a separately rendered SVG element:
|
|
432
|
+
* include zero or one YAxis component in a CartesianChart component's children.
|
|
433
|
+
* If omitted, the y axis is inferred from the chart's series.
|
|
434
|
+
*
|
|
435
|
+
* See the Axis Overrides (React) demo for this component in action:
|
|
436
|
+
*
|
|
437
|
+
* 
|
|
439
|
+
* @category Store components
|
|
440
|
+
* @since v8.5.0
|
|
441
|
+
*/
|
|
442
|
+
export function YAxis(props: YAxisProps): ComponentReturnType;
|
|
443
|
+
|
|
444
|
+
/**
|
|
445
|
+
* The LineSeries component renders a line series in a CartesianChart component.
|
|
446
|
+
* If every x value in every series is a finite number, the x axis is rendered
|
|
447
|
+
* as a continuous numeric scale. If any x value is a string or boolean, the x
|
|
448
|
+
* axis is rendered categorically. When sortCellId is omitted, rows are sorted
|
|
449
|
+
* by xCellId.
|
|
450
|
+
*
|
|
451
|
+
* See the Composing Charts (React) demo for this component in action:
|
|
452
|
+
*
|
|
453
|
+
* 
|
|
455
|
+
* @category Store components
|
|
456
|
+
* @since v8.5.0
|
|
457
|
+
*/
|
|
458
|
+
export function LineSeries(props: SeriesProps): ComponentReturnType;
|
|
283
459
|
|
|
284
460
|
/**
|
|
285
461
|
* The BarSeries component renders a bar series in a CartesianChart component.
|
|
286
462
|
* Its x values are always rendered categorically, even when they are finite
|
|
287
463
|
* numbers. Boolean category labels are rendered as `true` and `false`.
|
|
464
|
+
*
|
|
465
|
+
* See the Composing Charts (React) demo for this component in action:
|
|
466
|
+
*
|
|
467
|
+
* 
|
|
288
469
|
* @category Store components
|
|
289
470
|
* @since v8.5.0
|
|
290
471
|
*/
|
|
291
|
-
export function BarSeries(props:
|
|
472
|
+
export function BarSeries(props: SeriesProps): ComponentReturnType;
|
|
292
473
|
|
|
293
474
|
/**
|
|
294
475
|
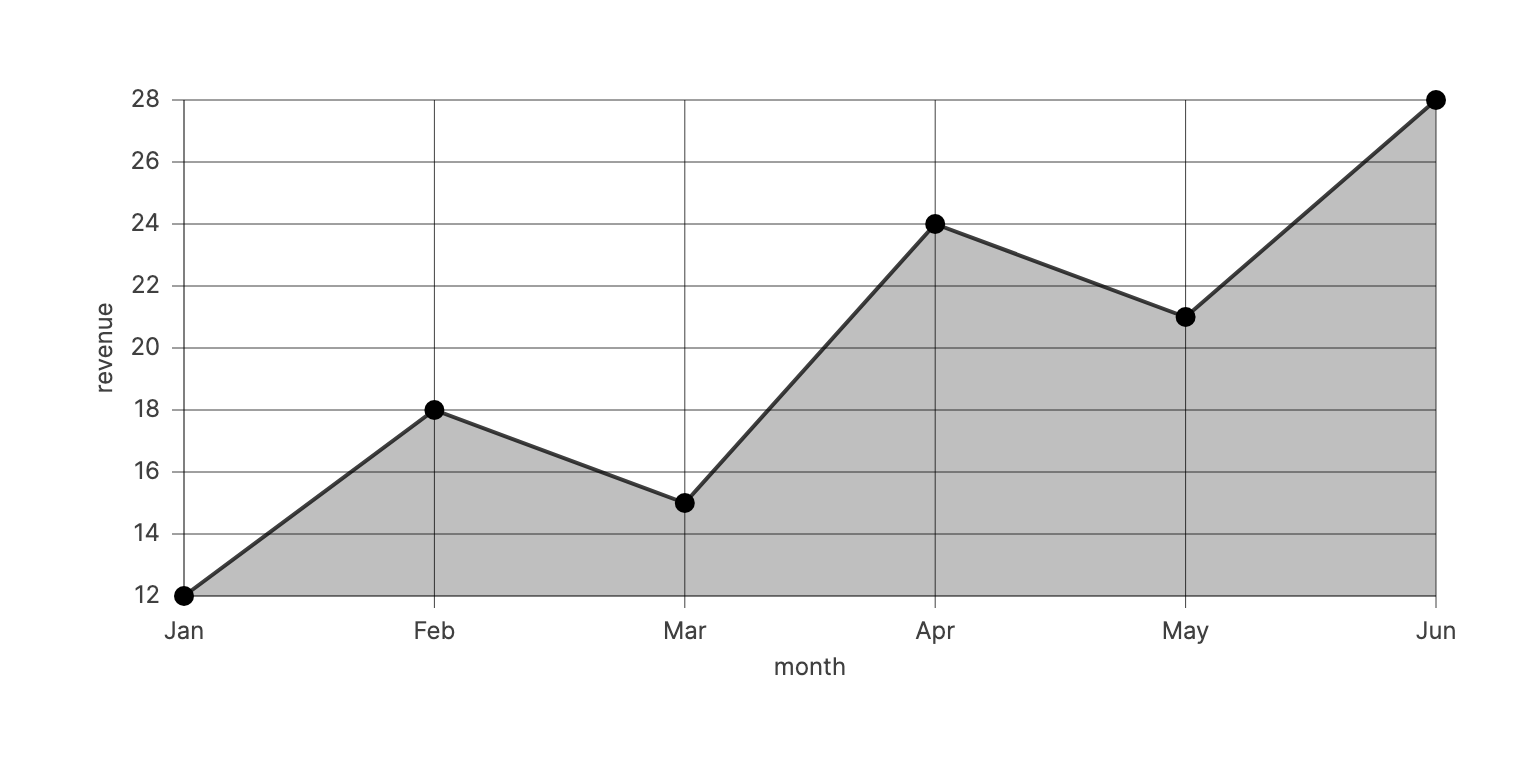
* The LineChart component renders a line chart from TinyBase data. If every x
|
|
295
476
|
* value is a finite number, the x axis is rendered as a continuous numeric
|
|
296
477
|
* scale. If any x value is a string or boolean, the x axis is rendered
|
|
297
478
|
* categorically. When sortCellId is omitted, rows are sorted by xCellId.
|
|
479
|
+
*
|
|
480
|
+
* See the <LineChart /> (React) demo for this component in action:
|
|
481
|
+
*
|
|
482
|
+
* 
|
|
298
484
|
* @category Store components
|
|
299
485
|
* @since v8.5.0
|
|
300
486
|
* @example
|
|
@@ -333,15 +519,18 @@ export function BarSeries(props: ChartSeriesProps): ComponentReturnType;
|
|
|
333
519
|
* ```
|
|
334
520
|
*/
|
|
335
521
|
export function LineChart(
|
|
336
|
-
props: (
|
|
337
|
-
ChartBindingProps &
|
|
338
|
-
ChartProps,
|
|
522
|
+
props: (TableSourceProps | QuerySourceProps) & BindingProps & ChartProps,
|
|
339
523
|
): ComponentReturnType;
|
|
340
524
|
|
|
341
525
|
/**
|
|
342
526
|
* The BarChart component renders a bar chart from TinyBase data. Its x values
|
|
343
527
|
* are always rendered categorically, even when they are finite numbers. Boolean
|
|
344
528
|
* category labels are rendered as `true` and `false`.
|
|
529
|
+
*
|
|
530
|
+
* See the Sorting And Types (React) demo for this component in action:
|
|
531
|
+
*
|
|
532
|
+
* 
|
|
345
534
|
* @category Store components
|
|
346
535
|
* @since v8.5.0
|
|
347
536
|
* @example
|
|
@@ -381,7 +570,5 @@ export function LineChart(
|
|
|
381
570
|
* ```
|
|
382
571
|
*/
|
|
383
572
|
export function BarChart(
|
|
384
|
-
props: (
|
|
385
|
-
ChartBindingProps &
|
|
386
|
-
ChartProps,
|
|
573
|
+
props: (TableSourceProps | QuerySourceProps) & BindingProps & ChartProps,
|
|
387
574
|
): ComponentReturnType;
|