tinybase 8.5.0-beta.1 → 8.5.0-beta.3
This diff represents the content of publicly available package versions that have been released to one of the supported registries. The information contained in this diff is provided for informational purposes only and reflects changes between package versions as they appear in their respective public registries.
- package/@types/ui-react-dom-charts/index.d.ts +355 -23
- package/@types/ui-react-dom-charts/with-schemas/index.d.ts +406 -39
- package/min/ui-react/index.js +1 -1
- package/min/ui-react/index.js.gz +0 -0
- package/min/ui-react/with-schemas/index.js +1 -1
- package/min/ui-react/with-schemas/index.js.gz +0 -0
- package/min/ui-react-dom/index.js +1 -1
- package/min/ui-react-dom/index.js.gz +0 -0
- package/min/ui-react-dom/with-schemas/index.js +1 -1
- package/min/ui-react-dom/with-schemas/index.js.gz +0 -0
- package/min/ui-react-dom-charts/index.js +1 -1
- package/min/ui-react-dom-charts/index.js.gz +0 -0
- package/min/ui-react-dom-charts/with-schemas/index.js +1 -1
- package/min/ui-react-dom-charts/with-schemas/index.js.gz +0 -0
- package/min/ui-react-inspector/index.js +1 -1
- package/min/ui-react-inspector/index.js.gz +0 -0
- package/min/ui-react-inspector/with-schemas/index.js +1 -1
- package/min/ui-react-inspector/with-schemas/index.js.gz +0 -0
- package/package.json +13 -13
- package/readme.md +2 -6
- package/releases.md +56 -26
- package/ui-react/index.js +3 -0
- package/ui-react/with-schemas/index.js +3 -0
- package/ui-react-dom/index.js +8 -5
- package/ui-react-dom/with-schemas/index.js +8 -5
- package/ui-react-dom-charts/index.js +1360 -723
- package/ui-react-dom-charts/with-schemas/index.js +1360 -723
- package/ui-react-inspector/index.js +13 -10
- package/ui-react-inspector/with-schemas/index.js +13 -10
- package/ui-svelte/index.js +1 -1
- package/ui-svelte/with-schemas/index.js +1 -1
- package/ui-svelte-dom/index.js +2 -2
- package/ui-svelte-dom/with-schemas/index.js +2 -2
- package/ui-svelte-inspector/index.js +2 -2
- package/ui-svelte-inspector/with-schemas/index.js +2 -2
|
@@ -1,18 +1,19 @@
|
|
|
1
1
|
/**
|
|
2
|
-
* The ui-react-dom-charts module of the TinyBase project provides components
|
|
3
|
-
*
|
|
2
|
+
* The ui-react-dom-charts module of the TinyBase project provides components to
|
|
3
|
+
* make it easy to create web-based reactive charts with Store and Queries
|
|
4
4
|
* objects.
|
|
5
5
|
*
|
|
6
6
|
* The components in this module use the react-dom module and so are not
|
|
7
7
|
* appropriate for environments like React Native (although those in the
|
|
8
8
|
* lower-level ui-react module are).
|
|
9
9
|
*
|
|
10
|
-
* For a full list of SVG class names that can be styled with CSS, see the
|
|
11
|
-
*
|
|
10
|
+
* For a full list of SVG class names that can be styled with CSS, see the Using
|
|
11
|
+
* Charts guide.
|
|
12
12
|
* @packageDocumentation
|
|
13
13
|
* @module ui-react-dom-charts
|
|
14
14
|
* @since v8.5.0
|
|
15
15
|
*/
|
|
16
|
+
import type {ReactNode} from 'react';
|
|
16
17
|
import type {Id} from '../common/index.d.ts';
|
|
17
18
|
import type {
|
|
18
19
|
ComponentReturnType,
|
|
@@ -21,8 +22,8 @@ import type {
|
|
|
21
22
|
} from '../ui-react/index.d.ts';
|
|
22
23
|
|
|
23
24
|
/**
|
|
24
|
-
* The ChartProps type describes the props that are used to configure the
|
|
25
|
-
*
|
|
25
|
+
* The ChartProps type describes the props that are used to configure the chart
|
|
26
|
+
* element that renders a chart.
|
|
26
27
|
* @category Configuration
|
|
27
28
|
* @since v8.5.0
|
|
28
29
|
*/
|
|
@@ -38,12 +39,12 @@ export type ChartProps = {
|
|
|
38
39
|
};
|
|
39
40
|
|
|
40
41
|
/**
|
|
41
|
-
* The
|
|
42
|
+
* The TableSourceProps type describes the props that bind a chart to a
|
|
42
43
|
* Table in a Store.
|
|
43
44
|
* @category Configuration
|
|
44
45
|
* @since v8.5.0
|
|
45
46
|
*/
|
|
46
|
-
export type
|
|
47
|
+
export type TableSourceProps = {
|
|
47
48
|
/**
|
|
48
49
|
* The Id of the Table in the Store to chart.
|
|
49
50
|
* @category Prop
|
|
@@ -72,12 +73,12 @@ export type ChartTableSourceProps = {
|
|
|
72
73
|
};
|
|
73
74
|
|
|
74
75
|
/**
|
|
75
|
-
* The
|
|
76
|
+
* The QuerySourceProps type describes the props that bind a chart to a
|
|
76
77
|
* Query in a Queries object.
|
|
77
78
|
* @category Configuration
|
|
78
79
|
* @since v8.5.0
|
|
79
80
|
*/
|
|
80
|
-
export type
|
|
81
|
+
export type QuerySourceProps = {
|
|
81
82
|
/**
|
|
82
83
|
* The Id of the query in the Queries object to chart.
|
|
83
84
|
* @category Prop
|
|
@@ -106,20 +107,27 @@ export type ChartQuerySourceProps = {
|
|
|
106
107
|
};
|
|
107
108
|
|
|
108
109
|
/**
|
|
109
|
-
* The
|
|
110
|
-
* values in TinyBase data.
|
|
110
|
+
* The BindingProps type describes the props that bind a LineChart
|
|
111
|
+
* component or BarChart component to Cell values in TinyBase data. An x Cell
|
|
112
|
+
* value can be a finite number, string, or boolean. A y Cell value must be a
|
|
113
|
+
* finite number.
|
|
111
114
|
* @category Configuration
|
|
112
115
|
* @since v8.5.0
|
|
113
116
|
*/
|
|
114
|
-
export type
|
|
117
|
+
export type BindingProps = {
|
|
115
118
|
/**
|
|
116
|
-
* The Id of the Cell that provides each data point's x value.
|
|
119
|
+
* The Id of the Cell that provides each data point's x value. Finite numbers
|
|
120
|
+
* can be used as continuous x values in line charts, while strings and
|
|
121
|
+
* booleans are used as category values. Boolean category labels are rendered
|
|
122
|
+
* as `true` and `false`.
|
|
117
123
|
* @category Prop
|
|
118
124
|
* @since v8.5.0
|
|
119
125
|
*/
|
|
120
126
|
readonly xCellId: Id;
|
|
121
127
|
/**
|
|
122
|
-
* The Id of the Cell that provides each data point's y value.
|
|
128
|
+
* The Id of the Cell that provides each data point's y value. Only finite
|
|
129
|
+
* numbers are charted; rows with missing, non-numeric, or non-finite y values
|
|
130
|
+
* are ignored.
|
|
123
131
|
* @category Prop
|
|
124
132
|
* @since v8.5.0
|
|
125
133
|
*/
|
|
@@ -151,7 +159,328 @@ export type ChartBindingProps = {
|
|
|
151
159
|
};
|
|
152
160
|
|
|
153
161
|
/**
|
|
154
|
-
* The
|
|
162
|
+
* The SeriesProps type describes the props that bind a chart series to Cell
|
|
163
|
+
* values in TinyBase data. An x Cell value can be a finite number, string, or
|
|
164
|
+
* boolean. A y Cell value must be a finite number.
|
|
165
|
+
* @category Configuration
|
|
166
|
+
* @since v8.5.0
|
|
167
|
+
*/
|
|
168
|
+
export type SeriesProps = {
|
|
169
|
+
/**
|
|
170
|
+
* An optional string that will be added to the class attribute of the series'
|
|
171
|
+
* SVG group element.
|
|
172
|
+
* @category Prop
|
|
173
|
+
* @since v8.5.0
|
|
174
|
+
*/
|
|
175
|
+
readonly className?: string;
|
|
176
|
+
/**
|
|
177
|
+
* The Id of the Cell that provides each data point's x value. Finite numbers
|
|
178
|
+
* can be used as continuous x values in line series, while strings and
|
|
179
|
+
* booleans are used as category values. Boolean category labels are rendered
|
|
180
|
+
* as `true` and `false`.
|
|
181
|
+
* @category Prop
|
|
182
|
+
* @since v8.5.0
|
|
183
|
+
*/
|
|
184
|
+
readonly xCellId: Id;
|
|
185
|
+
/**
|
|
186
|
+
* The Id of the Cell that provides each data point's y value. Only finite
|
|
187
|
+
* numbers are charted; rows with missing, non-numeric, or non-finite y values
|
|
188
|
+
* are ignored.
|
|
189
|
+
* @category Prop
|
|
190
|
+
* @since v8.5.0
|
|
191
|
+
*/
|
|
192
|
+
readonly yCellId: Id;
|
|
193
|
+
/**
|
|
194
|
+
* An optional label to use for the series in axis titles and tooltips,
|
|
195
|
+
* defaulting to the y Cell Id.
|
|
196
|
+
* @category Prop
|
|
197
|
+
* @since v8.5.0
|
|
198
|
+
*/
|
|
199
|
+
readonly label?: string;
|
|
200
|
+
/**
|
|
201
|
+
* The Id of the Cell used to sort the charted rows.
|
|
202
|
+
* @category Prop
|
|
203
|
+
* @since v8.5.0
|
|
204
|
+
*/
|
|
205
|
+
readonly sortCellId?: Id;
|
|
206
|
+
/**
|
|
207
|
+
* Whether the charted rows should be sorted in descending order.
|
|
208
|
+
* @category Prop
|
|
209
|
+
* @since v8.5.0
|
|
210
|
+
*/
|
|
211
|
+
readonly descending?: boolean;
|
|
212
|
+
/**
|
|
213
|
+
* The number of sorted rows to skip before charting.
|
|
214
|
+
* @category Prop
|
|
215
|
+
* @since v8.5.0
|
|
216
|
+
*/
|
|
217
|
+
readonly offset?: number;
|
|
218
|
+
/**
|
|
219
|
+
* The maximum number of sorted rows to chart.
|
|
220
|
+
* @category Prop
|
|
221
|
+
* @since v8.5.0
|
|
222
|
+
*/
|
|
223
|
+
readonly limit?: number;
|
|
224
|
+
};
|
|
225
|
+
|
|
226
|
+
/**
|
|
227
|
+
* The XAxisProps type describes the props that configure the x axis of a
|
|
228
|
+
* CartesianChart component.
|
|
229
|
+
*
|
|
230
|
+
* The x axis is inferred by default. Use an XAxis component child when you want
|
|
231
|
+
* to override its title, numeric bounds, tick values, tick count, tick labels,
|
|
232
|
+
* or SVG class name.
|
|
233
|
+
* @category Configuration
|
|
234
|
+
* @since v8.5.0
|
|
235
|
+
*/
|
|
236
|
+
export type XAxisProps = {
|
|
237
|
+
/**
|
|
238
|
+
* An optional string that will be added to the class attribute of the x-axis
|
|
239
|
+
* SVG group element.
|
|
240
|
+
* @category Prop
|
|
241
|
+
* @since v8.5.0
|
|
242
|
+
*/
|
|
243
|
+
readonly className?: string;
|
|
244
|
+
/**
|
|
245
|
+
* An optional title to use for the x axis, defaulting to the x Cell Id, or to
|
|
246
|
+
* a combined title when multiple series use different x Cell Ids.
|
|
247
|
+
* @category Prop
|
|
248
|
+
* @since v8.5.0
|
|
249
|
+
*/
|
|
250
|
+
readonly title?: string;
|
|
251
|
+
/**
|
|
252
|
+
* An optional minimum x-axis bound for continuous numeric x values.
|
|
253
|
+
*
|
|
254
|
+
* This prop is ignored when the x axis is categorical.
|
|
255
|
+
* @category Prop
|
|
256
|
+
* @since v8.5.0
|
|
257
|
+
*/
|
|
258
|
+
readonly min?: number;
|
|
259
|
+
/**
|
|
260
|
+
* An optional maximum x-axis bound for continuous numeric x values.
|
|
261
|
+
*
|
|
262
|
+
* This prop is ignored when the x axis is categorical.
|
|
263
|
+
* @category Prop
|
|
264
|
+
* @since v8.5.0
|
|
265
|
+
*/
|
|
266
|
+
readonly max?: number;
|
|
267
|
+
/**
|
|
268
|
+
* Optional numeric tick values to use for a continuous x axis.
|
|
269
|
+
*
|
|
270
|
+
* This prop is ignored when the x axis is categorical.
|
|
271
|
+
* @category Prop
|
|
272
|
+
* @since v8.5.0
|
|
273
|
+
*/
|
|
274
|
+
readonly ticks?: readonly number[];
|
|
275
|
+
/**
|
|
276
|
+
* An optional preferred number of ticks to render on a continuous x axis.
|
|
277
|
+
*
|
|
278
|
+
* The actual number of ticks may vary so that labels remain readable.
|
|
279
|
+
* @category Prop
|
|
280
|
+
* @since v8.5.0
|
|
281
|
+
*/
|
|
282
|
+
readonly tickCount?: number;
|
|
283
|
+
/**
|
|
284
|
+
* An optional function for formatting x-axis tick labels.
|
|
285
|
+
*
|
|
286
|
+
* It receives the original tick value, which can be a finite number, string,
|
|
287
|
+
* or boolean.
|
|
288
|
+
* @category Prop
|
|
289
|
+
* @since v8.5.0
|
|
290
|
+
*/
|
|
291
|
+
readonly tickFormatter?: (tick: boolean | number | string) => string;
|
|
292
|
+
};
|
|
293
|
+
|
|
294
|
+
/**
|
|
295
|
+
* The YAxisProps type describes the props that configure the y axis of a
|
|
296
|
+
* CartesianChart component.
|
|
297
|
+
*
|
|
298
|
+
* The y axis is inferred by default. Use a YAxis component child when you want
|
|
299
|
+
* to override its title, numeric bounds, tick values, tick count, tick labels,
|
|
300
|
+
* or SVG class name.
|
|
301
|
+
* @category Configuration
|
|
302
|
+
* @since v8.5.0
|
|
303
|
+
*/
|
|
304
|
+
export type YAxisProps = {
|
|
305
|
+
/**
|
|
306
|
+
* An optional string that will be added to the class attribute of the y-axis
|
|
307
|
+
* SVG group element.
|
|
308
|
+
* @category Prop
|
|
309
|
+
* @since v8.5.0
|
|
310
|
+
*/
|
|
311
|
+
readonly className?: string;
|
|
312
|
+
/**
|
|
313
|
+
* An optional title to use for the y axis, defaulting to the y Cell Id, y
|
|
314
|
+
* series label, or a combined title when multiple series use different y Cell
|
|
315
|
+
* Ids or labels.
|
|
316
|
+
* @category Prop
|
|
317
|
+
* @since v8.5.0
|
|
318
|
+
*/
|
|
319
|
+
readonly title?: string;
|
|
320
|
+
/**
|
|
321
|
+
* An optional minimum y-axis bound.
|
|
322
|
+
* @category Prop
|
|
323
|
+
* @since v8.5.0
|
|
324
|
+
*/
|
|
325
|
+
readonly min?: number;
|
|
326
|
+
/**
|
|
327
|
+
* An optional maximum y-axis bound.
|
|
328
|
+
* @category Prop
|
|
329
|
+
* @since v8.5.0
|
|
330
|
+
*/
|
|
331
|
+
readonly max?: number;
|
|
332
|
+
/**
|
|
333
|
+
* Optional numeric tick values to use for the y axis.
|
|
334
|
+
* @category Prop
|
|
335
|
+
* @since v8.5.0
|
|
336
|
+
*/
|
|
337
|
+
readonly ticks?: readonly number[];
|
|
338
|
+
/**
|
|
339
|
+
* An optional preferred number of ticks to render on the y axis.
|
|
340
|
+
*
|
|
341
|
+
* The actual number of ticks may vary so that labels remain readable.
|
|
342
|
+
* @category Prop
|
|
343
|
+
* @since v8.5.0
|
|
344
|
+
*/
|
|
345
|
+
readonly tickCount?: number;
|
|
346
|
+
/**
|
|
347
|
+
* An optional function for formatting y-axis tick labels.
|
|
348
|
+
*
|
|
349
|
+
* It receives the numeric tick value.
|
|
350
|
+
* @category Prop
|
|
351
|
+
* @since v8.5.0
|
|
352
|
+
*/
|
|
353
|
+
readonly tickFormatter?: (tick: number) => string;
|
|
354
|
+
};
|
|
355
|
+
|
|
356
|
+
/**
|
|
357
|
+
* The CartesianChart component renders a chart frame and provides TinyBase
|
|
358
|
+
* source and layout context to LineSeries component and BarSeries component
|
|
359
|
+
* children.
|
|
360
|
+
*
|
|
361
|
+
* See the Composing Charts (React) demo for this component in action:
|
|
362
|
+
*
|
|
363
|
+
* 
|
|
365
|
+
*
|
|
366
|
+
* The series children declare their own xCellId and yCellId bindings. The
|
|
367
|
+
* optional XAxis component and YAxis component children can be used to
|
|
368
|
+
* configure axis titles, bounds, ticks, and tick formatting.
|
|
369
|
+
* @category Store components
|
|
370
|
+
* @since v8.5.0
|
|
371
|
+
* @example
|
|
372
|
+
* This example creates a Store and renders two LineSeries component children
|
|
373
|
+
* in a CartesianChart component.
|
|
374
|
+
*
|
|
375
|
+
* ```jsx
|
|
376
|
+
* import React from 'react';
|
|
377
|
+
* import {createRoot} from 'react-dom/client';
|
|
378
|
+
* import {createStore} from 'tinybase';
|
|
379
|
+
* import {CartesianChart, LineSeries} from 'tinybase/ui-react-dom-charts';
|
|
380
|
+
*
|
|
381
|
+
* const store = createStore().setTable('pets', {
|
|
382
|
+
* hamsters: {order: 1, sold: 12, returned: 1},
|
|
383
|
+
* rabbits: {order: 2, sold: 9, returned: 2},
|
|
384
|
+
* });
|
|
385
|
+
* const App = () => (
|
|
386
|
+
* <CartesianChart store={store} tableId="pets">
|
|
387
|
+
* <LineSeries
|
|
388
|
+
* className="sold"
|
|
389
|
+
* label="Sold pets"
|
|
390
|
+
* xCellId="order"
|
|
391
|
+
* yCellId="sold"
|
|
392
|
+
* />
|
|
393
|
+
* <LineSeries
|
|
394
|
+
* className="returned"
|
|
395
|
+
* label="Returned pets"
|
|
396
|
+
* xCellId="order"
|
|
397
|
+
* yCellId="returned"
|
|
398
|
+
* />
|
|
399
|
+
* </CartesianChart>
|
|
400
|
+
* );
|
|
401
|
+
* const app = document.createElement('div');
|
|
402
|
+
* createRoot(app).render(<App />); // !act
|
|
403
|
+
* console.log(app.firstChild?.nodeName.toLowerCase());
|
|
404
|
+
* // -> 'svg'
|
|
405
|
+
* ```
|
|
406
|
+
*/
|
|
407
|
+
export function CartesianChart(
|
|
408
|
+
props: (TableSourceProps | QuerySourceProps) &
|
|
409
|
+
ChartProps & {readonly children?: ReactNode},
|
|
410
|
+
): ComponentReturnType;
|
|
411
|
+
|
|
412
|
+
/**
|
|
413
|
+
* The XAxis component configures the x axis of a CartesianChart component.
|
|
414
|
+
*
|
|
415
|
+
* It is a configuration child rather than a separately rendered SVG element:
|
|
416
|
+
* include zero or one XAxis component in a CartesianChart component's children.
|
|
417
|
+
* If omitted, the x axis is inferred from the chart's series.
|
|
418
|
+
*
|
|
419
|
+
* See the Axis Overrides (React) demo for this component in action:
|
|
420
|
+
*
|
|
421
|
+
* 
|
|
423
|
+
* @category Store components
|
|
424
|
+
* @since v8.5.0
|
|
425
|
+
*/
|
|
426
|
+
export function XAxis(props: XAxisProps): ComponentReturnType;
|
|
427
|
+
|
|
428
|
+
/**
|
|
429
|
+
* The YAxis component configures the y axis of a CartesianChart component.
|
|
430
|
+
*
|
|
431
|
+
* It is a configuration child rather than a separately rendered SVG element:
|
|
432
|
+
* include zero or one YAxis component in a CartesianChart component's children.
|
|
433
|
+
* If omitted, the y axis is inferred from the chart's series.
|
|
434
|
+
*
|
|
435
|
+
* See the Axis Overrides (React) demo for this component in action:
|
|
436
|
+
*
|
|
437
|
+
* 
|
|
439
|
+
* @category Store components
|
|
440
|
+
* @since v8.5.0
|
|
441
|
+
*/
|
|
442
|
+
export function YAxis(props: YAxisProps): ComponentReturnType;
|
|
443
|
+
|
|
444
|
+
/**
|
|
445
|
+
* The LineSeries component renders a line series in a CartesianChart component.
|
|
446
|
+
* If every x value in every series is a finite number, the x axis is rendered
|
|
447
|
+
* as a continuous numeric scale. If any x value is a string or boolean, the x
|
|
448
|
+
* axis is rendered categorically. When sortCellId is omitted, rows are sorted
|
|
449
|
+
* by xCellId.
|
|
450
|
+
*
|
|
451
|
+
* See the Composing Charts (React) demo for this component in action:
|
|
452
|
+
*
|
|
453
|
+
* 
|
|
455
|
+
* @category Store components
|
|
456
|
+
* @since v8.5.0
|
|
457
|
+
*/
|
|
458
|
+
export function LineSeries(props: SeriesProps): ComponentReturnType;
|
|
459
|
+
|
|
460
|
+
/**
|
|
461
|
+
* The BarSeries component renders a bar series in a CartesianChart component.
|
|
462
|
+
* Its x values are always rendered categorically, even when they are finite
|
|
463
|
+
* numbers. Boolean category labels are rendered as `true` and `false`.
|
|
464
|
+
*
|
|
465
|
+
* See the Composing Charts (React) demo for this component in action:
|
|
466
|
+
*
|
|
467
|
+
* 
|
|
469
|
+
* @category Store components
|
|
470
|
+
* @since v8.5.0
|
|
471
|
+
*/
|
|
472
|
+
export function BarSeries(props: SeriesProps): ComponentReturnType;
|
|
473
|
+
|
|
474
|
+
/**
|
|
475
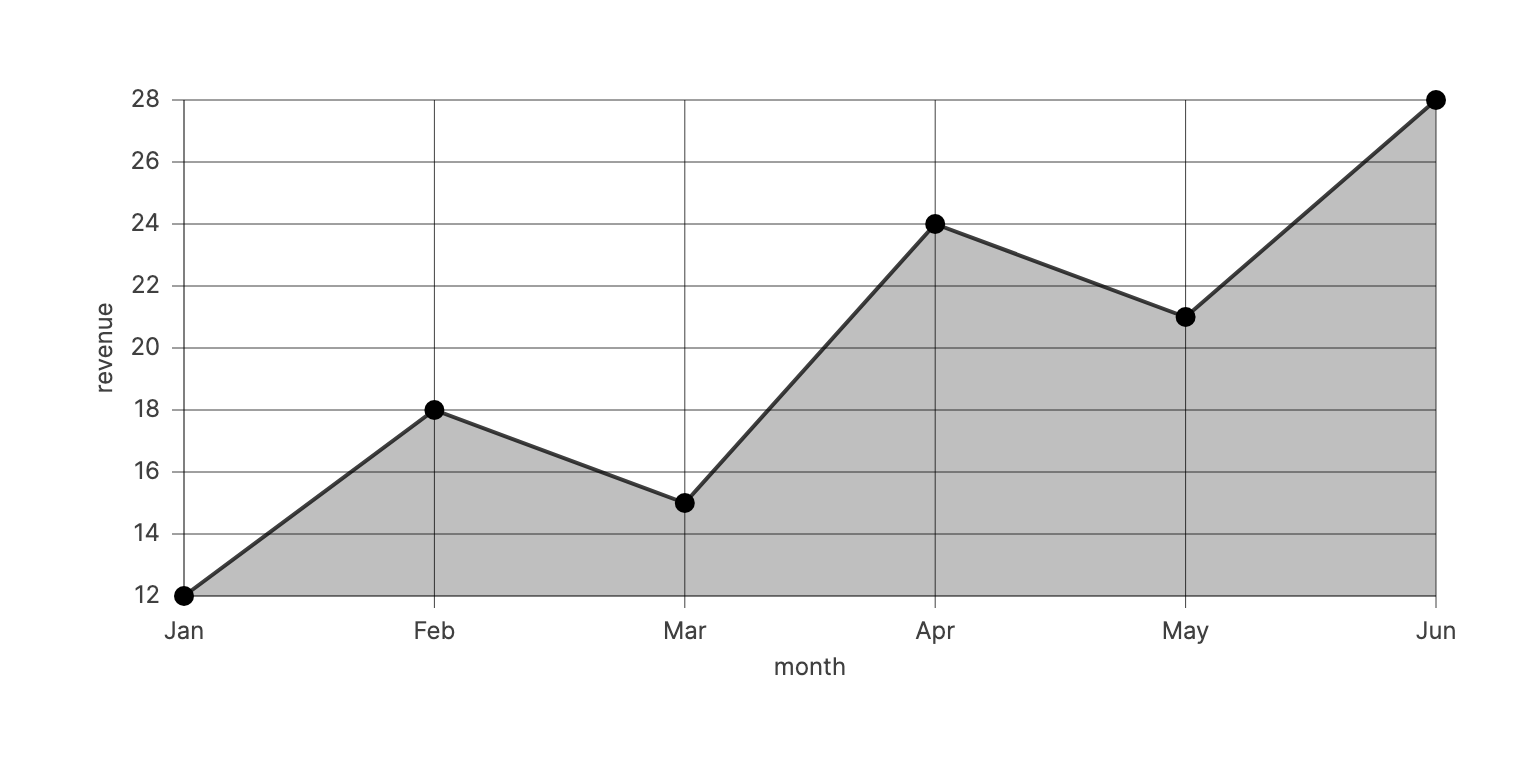
|
+
* The LineChart component renders a line chart from TinyBase data. If every x
|
|
476
|
+
* value is a finite number, the x axis is rendered as a continuous numeric
|
|
477
|
+
* scale. If any x value is a string or boolean, the x axis is rendered
|
|
478
|
+
* categorically. When sortCellId is omitted, rows are sorted by xCellId.
|
|
479
|
+
*
|
|
480
|
+
* See the <LineChart /> (React) demo for this component in action:
|
|
481
|
+
*
|
|
482
|
+
* 
|
|
155
484
|
* @category Store components
|
|
156
485
|
* @since v8.5.0
|
|
157
486
|
* @example
|
|
@@ -190,13 +519,18 @@ export type ChartBindingProps = {
|
|
|
190
519
|
* ```
|
|
191
520
|
*/
|
|
192
521
|
export function LineChart(
|
|
193
|
-
props: (
|
|
194
|
-
ChartBindingProps &
|
|
195
|
-
ChartProps,
|
|
522
|
+
props: (TableSourceProps | QuerySourceProps) & BindingProps & ChartProps,
|
|
196
523
|
): ComponentReturnType;
|
|
197
524
|
|
|
198
525
|
/**
|
|
199
|
-
* The BarChart component renders a bar chart from TinyBase data.
|
|
526
|
+
* The BarChart component renders a bar chart from TinyBase data. Its x values
|
|
527
|
+
* are always rendered categorically, even when they are finite numbers. Boolean
|
|
528
|
+
* category labels are rendered as `true` and `false`.
|
|
529
|
+
*
|
|
530
|
+
* See the Sorting And Types (React) demo for this component in action:
|
|
531
|
+
*
|
|
532
|
+
* 
|
|
200
534
|
* @category Store components
|
|
201
535
|
* @since v8.5.0
|
|
202
536
|
* @example
|
|
@@ -236,7 +570,5 @@ export function LineChart(
|
|
|
236
570
|
* ```
|
|
237
571
|
*/
|
|
238
572
|
export function BarChart(
|
|
239
|
-
props: (
|
|
240
|
-
ChartBindingProps &
|
|
241
|
-
ChartProps,
|
|
573
|
+
props: (TableSourceProps | QuerySourceProps) & BindingProps & ChartProps,
|
|
242
574
|
): ComponentReturnType;
|