smithkit 0.5.0 → 0.7.0
This diff represents the content of publicly available package versions that have been released to one of the supported registries. The information contained in this diff is provided for informational purposes only and reflects changes between package versions as they appear in their respective public registries.
- package/README.md +47 -938
- package/dist/lib/OptionsValidation.d.ts +3 -3
- package/dist/lib/OptionsValidation.js +17 -13
- package/dist/lib/Smith.d.ts +3 -0
- package/dist/lib/Smith.js +42 -14
- package/dist/lib/appearance/SvgTheme.d.ts +1 -0
- package/dist/lib/appearance/SvgTheme.js +8 -7
- package/dist/lib/appearance/Theme.js +49 -52
- package/dist/lib/appearance/types.d.ts +75 -31
- package/dist/lib/grid/CircleLayerControl.d.ts +2 -2
- package/dist/lib/grid/CircleLayerControl.js +4 -4
- package/dist/lib/grid/ConstCircles.js +6 -6
- package/dist/lib/grid/ConstQCircles.js +4 -1
- package/dist/lib/grid/ConstSwrCircles.js +4 -1
- package/dist/lib/grid/GridLayerControl.d.ts +2 -2
- package/dist/lib/grid/GridLayerControl.js +10 -11
- package/dist/lib/grid/SmithGridLayer.js +3 -1
- package/dist/lib/index.d.ts +2 -2
- package/dist/lib/interaction/SmithCursor.js +6 -6
- package/dist/lib/layers.d.ts +28 -14
- package/dist/lib/math/Complex.d.ts +1 -1
- package/dist/lib/math/Complex.js +2 -2
- package/dist/lib/measurements.d.ts +20 -8
- package/dist/lib/options.d.ts +4 -4
- package/dist/lib/rendering/ChartHost.d.ts +5 -0
- package/dist/lib/rendering/ChartHost.js +14 -0
- package/dist/lib/rendering/SvgChartRenderer.d.ts +2 -2
- package/dist/lib/rendering/SvgChartRenderer.js +2 -2
- package/dist/lib/scales/SmithPeripheralScales.js +11 -11
- package/dist/lib/scales/SmithScales.d.ts +3 -0
- package/dist/lib/scales/SmithScales.js +39 -18
- package/dist/lib/svg/LabelLayout.js +9 -2
- package/dist/lib/traces/SmithData.d.ts +3 -3
- package/dist/lib/traces/SmithMarker.js +6 -5
- package/dist/lib/traces/TraceRenderer.d.ts +3 -3
- package/dist/lib/traces/TraceRenderer.js +19 -18
- package/package.json +24 -6
package/README.md
CHANGED
|
@@ -3,27 +3,13 @@
|
|
|
3
3
|
**`smithkit`** is a framework-independent JavaScript and TypeScript library for
|
|
4
4
|
interactive SVG Smith charts, RF calculations, and S11 measurement exploration.
|
|
5
5
|
|
|
6
|
-
[
|
|
6
|
+
[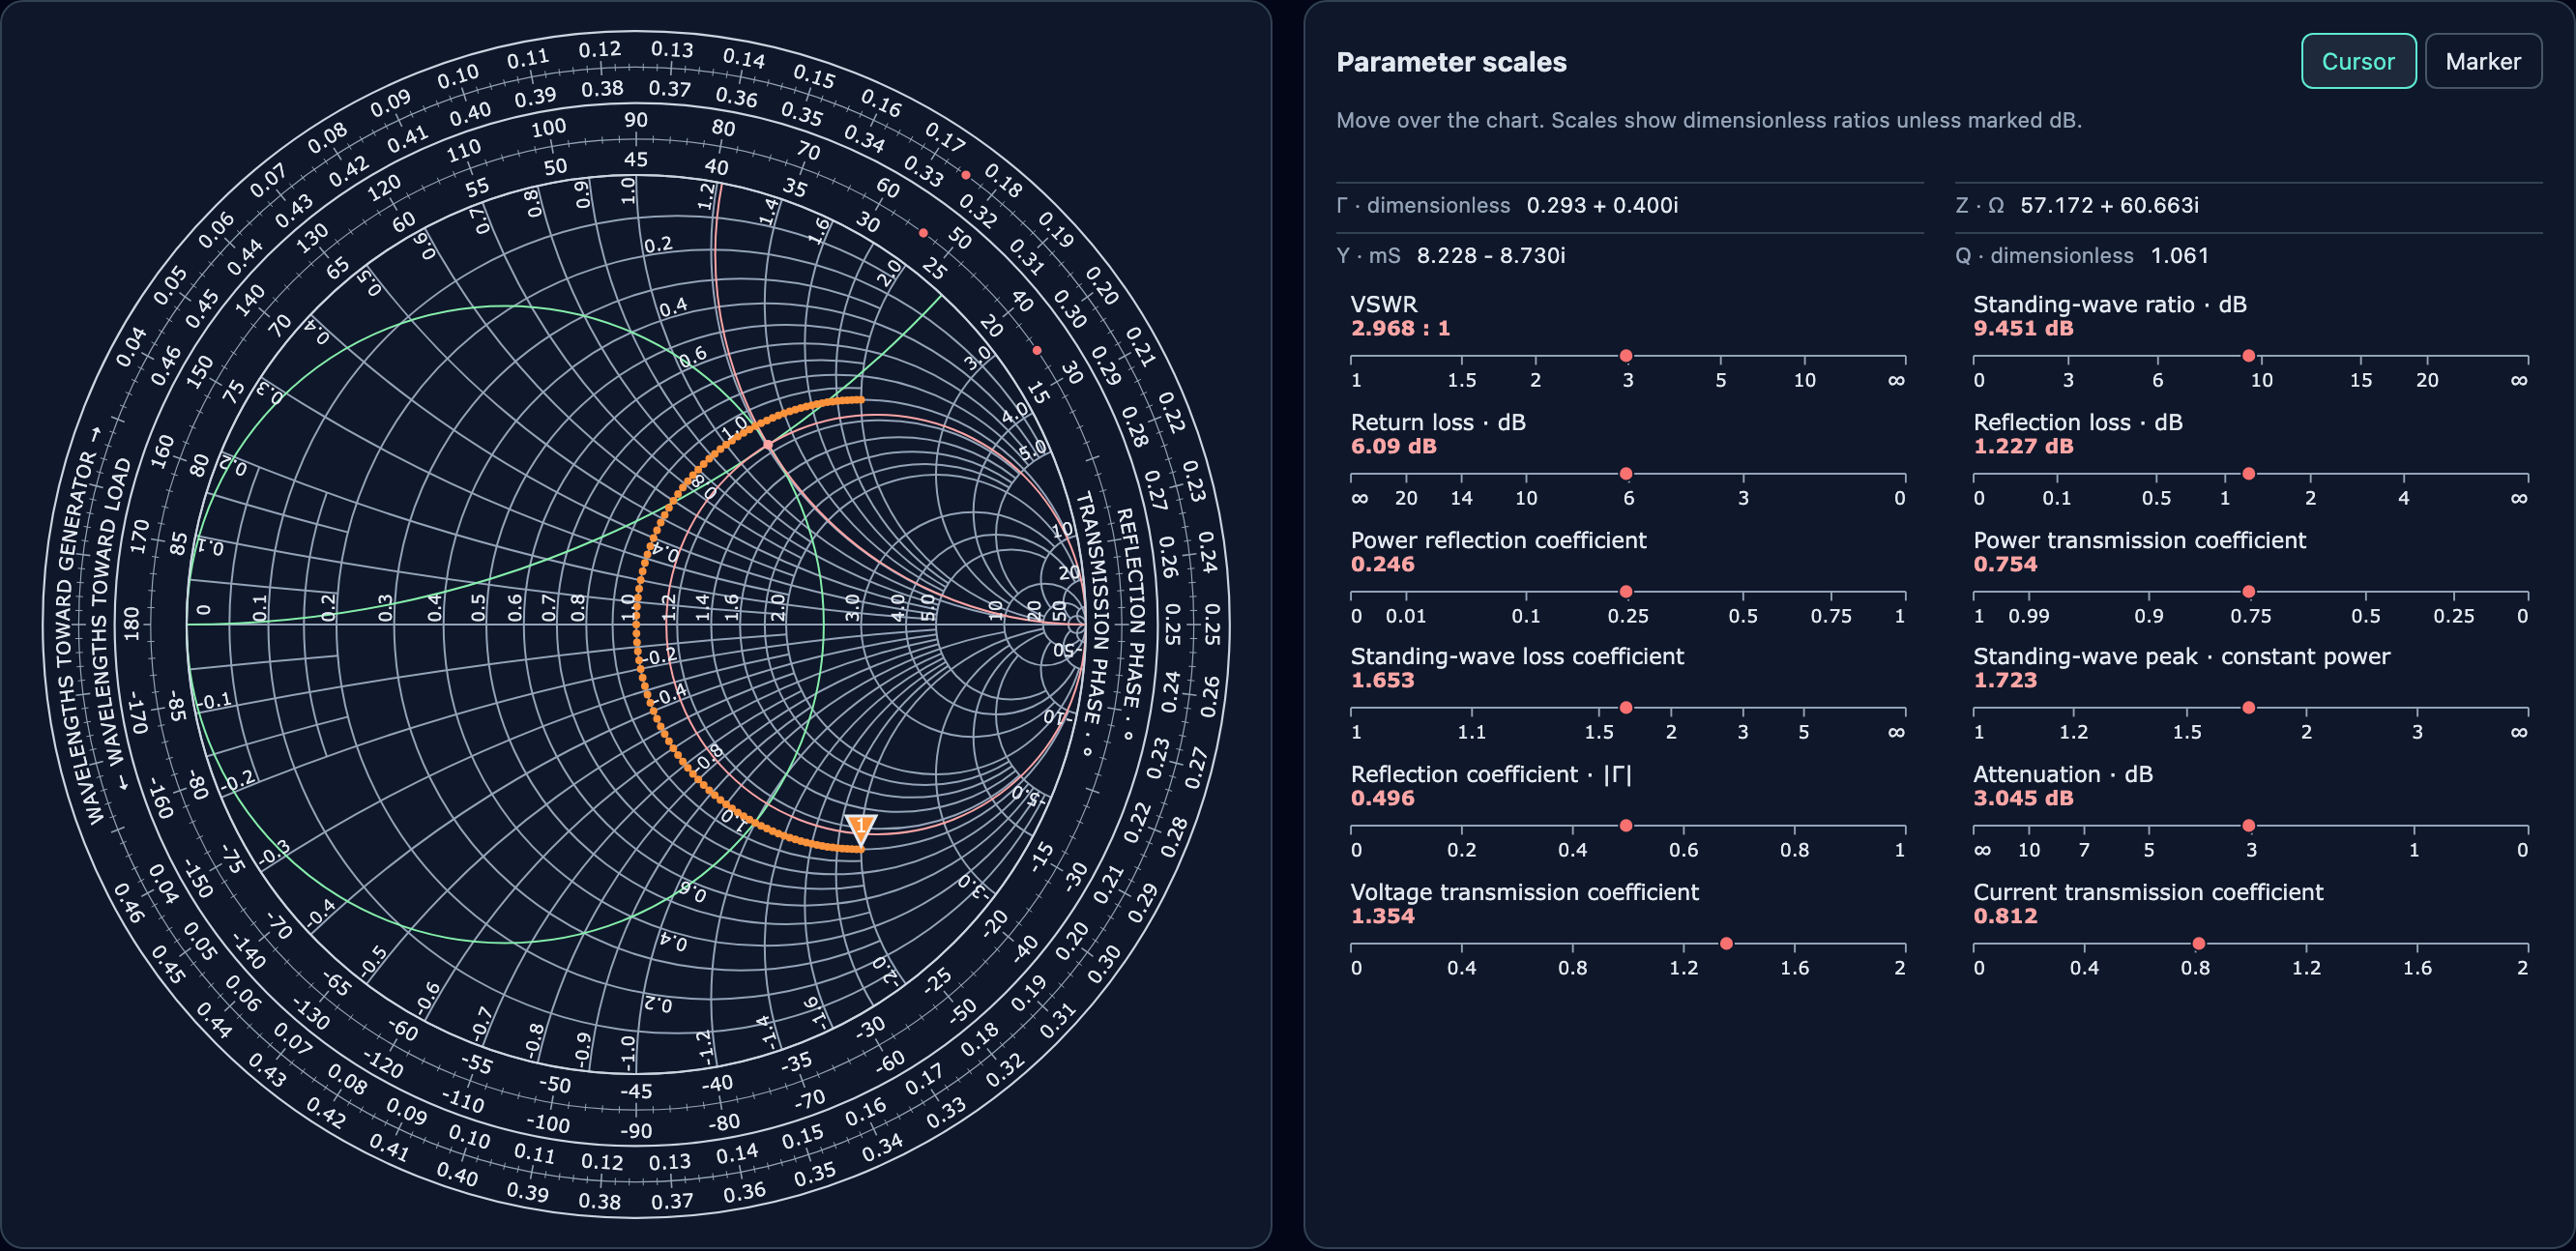](https://rosek86.github.io/smithkit/)
|
|
7
|
+
|
|
8
|
+
[API documentation](https://rosek86.github.io/smithkit/api/) · [Try the interactive demo](https://rosek86.github.io/smithkit/) or browse the
|
|
7
9
|
[integration examples](https://rosek86.github.io/smithkit/examples/index.html):
|
|
8
|
-
static charts, marker controls, a 100,000-sample trace, themes, report exports, and lifecycle cleanup.
|
|
10
|
+
static charts, marker controls, a 100,000-sample trace, themes, report exports, React/Angular components, and lifecycle cleanup.
|
|
9
11
|
Each example includes its TypeScript source.
|
|
10
12
|
|
|
11
|
-
Upgrading from 0.3.x? Version 0.4.0 introduces grouped constructor options and
|
|
12
|
-
`setOptions()`, static chart defaults, and explicit marker creation. See the
|
|
13
|
-
[0.4 migration guide](https://github.com/rosek86/smithkit/blob/v0.4.0/docs/migration-0.4.md).
|
|
14
|
-
|
|
15
|
-
Upgrading from 0.2.x? Version 0.3.0 replaces `GridLayer.setMinorVisible()` with
|
|
16
|
-
`setDetail('basic' | 'standard' | 'detailed')`. Replace `false` with `'standard'`
|
|
17
|
-
and `true` with `'detailed'`; `'basic'` shows only the principal circles.
|
|
18
|
-
|
|
19
|
-
Upgrading from 0.1.x? Version 0.2.0 groups calculation, parsing, formatting, and
|
|
20
|
-
comparison functions into classes. See the [migration guide](https://github.com/rosek86/smithkit/blob/v0.2.0/docs/migration-0.2.md)
|
|
21
|
-
for the changed imports.
|
|
22
|
-
|
|
23
|
-
The [API review and compatibility policy](https://github.com/rosek86/smithkit/blob/main/docs/api-review.md)
|
|
24
|
-
define the public contract and the compatibility scope intended for 1.0. During
|
|
25
|
-
0.x development, breaking changes are documented in minor releases.
|
|
26
|
-
|
|
27
13
|
## Features
|
|
28
14
|
|
|
29
15
|
- Labeled resistance, reactance, conductance, and susceptance grids.
|
|
@@ -47,16 +33,25 @@ npm install smithkit
|
|
|
47
33
|
```
|
|
48
34
|
|
|
49
35
|
Browser applications need SVG, ES2022, and an ESM-compatible build tool.
|
|
36
|
+
The checked TypeScript minimum is 5.7.3. See the
|
|
37
|
+
[browser and framework compatibility](https://github.com/rosek86/smithkit/blob/main/docs/compatibility.md)
|
|
38
|
+
for tested environments and build targets.
|
|
50
39
|
No library stylesheet is required. To build the library from source, see
|
|
51
40
|
[Contributing](https://github.com/rosek86/smithkit/blob/main/CONTRIBUTING.md).
|
|
52
41
|
|
|
53
42
|
For a complete application using the installed package, see the
|
|
54
43
|
[standalone integration example](https://github.com/rosek86/smithkit/tree/main/examples/basic).
|
|
55
44
|
It demonstrates mounting, replacing samples, event subscriptions, resizing, and cleanup.
|
|
45
|
+
Copyable [React](https://rosek86.github.io/smithkit/examples/react/index.html) and
|
|
46
|
+
[Angular](https://rosek86.github.io/smithkit/examples/angular/index.html) components
|
|
47
|
+
cover the same lifecycle through framework props/inputs.
|
|
48
|
+
|
|
49
|
+
For upgrades from earlier versions, see the
|
|
50
|
+
[migration guide](https://github.com/rosek86/smithkit/blob/main/docs/migrations.md).
|
|
56
51
|
|
|
57
52
|
## Quick start
|
|
58
53
|
|
|
59
|
-
|
|
54
|
+
Mount a container with a non-zero size:
|
|
60
55
|
|
|
61
56
|
```html
|
|
62
57
|
<div id="smith" style="width: 100%; max-width: 700px; aspect-ratio: 1;"></div>
|
|
@@ -65,940 +60,54 @@ Give the container an explicit size and run the code after it is mounted:
|
|
|
65
60
|
```ts
|
|
66
61
|
import { Smith } from 'smithkit';
|
|
67
62
|
|
|
68
|
-
const chart = new Smith({ referenceImpedanceOhms: 50 });
|
|
69
|
-
chart.draw('#smith');
|
|
63
|
+
const chart = new Smith('#smith', { referenceImpedanceOhms: 50 });
|
|
70
64
|
const traceId = chart.addTrace(
|
|
71
65
|
[
|
|
72
|
-
|
|
73
|
-
|
|
74
|
-
|
|
66
|
+
[1e9, 0.5, -0.5],
|
|
67
|
+
[1.5e9, 0, 0],
|
|
68
|
+
[2e9, 0.5, 0.5],
|
|
75
69
|
],
|
|
76
|
-
{ name: 'Antenna', color: '#2563eb' },
|
|
70
|
+
{ name: 'Antenna', color: '#2563eb', mode: 'line' },
|
|
77
71
|
);
|
|
78
|
-
```
|
|
79
|
-
|
|
80
|
-
Each `TraceSample` contains `frequencyHz` and the dimensionless voltage reflection
|
|
81
|
-
coefficient Γ as `[real, imaginary]`. Samples are copied and validated; readonly tuples and arrays (`as const`) are accepted. Frequencies
|
|
82
|
-
must be finite and non-negative; both coordinates must be finite. A trace must
|
|
83
|
-
contain at least one sample.
|
|
84
|
-
|
|
85
|
-
Traces start without markers. Call `chart.addMarker(traceId)` to add one at the
|
|
86
|
-
first sample, or pass a sample index to choose its initial position. Drag markers to select
|
|
87
|
-
samples with a mouse or touch. Enable zoom to scroll to zoom and drag the chart to pan. Markers
|
|
88
|
-
and their focus indicators stay above grid labels and sample points. `chart.resetView()` restores the initial view, including peripheral rulers.
|
|
89
|
-
|
|
90
|
-
Construct `Smith` only in a browser, such as your framework's mount hook. Importing
|
|
91
|
-
the package and using its calculation or parsing methods does not require a DOM.
|
|
92
|
-
|
|
93
|
-
The default chart is a static presentation: standard impedance grid with labels,
|
|
94
|
-
no peripheral scales, and zoom and cursor tracking disabled. Markers are optional
|
|
95
|
-
and remain interactive when explicitly added.
|
|
96
|
-
|
|
97
|
-
Enable interactions through constructor options or the corresponding setters:
|
|
98
|
-
|
|
99
|
-
```ts
|
|
100
|
-
import { Smith } from 'smithkit';
|
|
101
|
-
|
|
102
|
-
const chart = new Smith({ interaction: { zoom: true, cursor: true } });
|
|
103
|
-
chart.draw('#smith');
|
|
104
|
-
|
|
105
|
-
chart.setZoomEnabled(false); // Freeze the current view; page scrolling is unaffected.
|
|
106
|
-
chart.setCursorEnabled(false); // Hide cursor geometry and cancel pending readings.
|
|
107
|
-
```
|
|
108
|
-
|
|
109
|
-
Zoom controls wheel/double-click zoom and mouse/touch panning and pinch gestures;
|
|
110
|
-
it is independent of cursor tracking and marker interaction. `resetView()` remains
|
|
111
|
-
available with zoom disabled. Disabling during an active gesture freezes the view
|
|
112
|
-
while that gesture finishes normally.
|
|
113
|
-
|
|
114
|
-
Cursor tracking controls the cursor overlay and `Cursor` events. Disabling it
|
|
115
|
-
clears the current readout with one `Cursor` event carrying `undefined`, cancels
|
|
116
|
-
queued readings, and suppresses further cursor events. Enabling waits for a new
|
|
117
|
-
pointer movement. The last `cursorReading` remains available; marker controls and
|
|
118
|
-
events work independently.
|
|
119
|
-
|
|
120
|
-
`draw(selector | HTMLElement)` moves the existing SVG when called again. A missing
|
|
121
|
-
container throws. Call `chart.destroy()` on unmount; it removes the SVG, releases
|
|
122
|
-
event handlers, and cancels queued notifications. Repeated destruction is safe.
|
|
123
|
-
|
|
124
|
-
## Trace input formats
|
|
125
|
-
|
|
126
|
-
`addTrace()` and `updateTrace()` accept the same `TraceInput` union:
|
|
127
|
-
|
|
128
|
-
- `TraceSamples`: an array of objects with `frequencyHz` and `reflectionCoefficient`.
|
|
129
|
-
- `readonly TraceTuple[]`: `[frequencyHz, re, im]` tuples, including `as const` arrays.
|
|
130
|
-
- `Float64Array`: packed triples in the order `f, re, im, f, re, im, …`.
|
|
131
|
-
|
|
132
|
-
In every format, frequency is in **Hz** and `re`/`im` are the dimensionless
|
|
133
|
-
voltage reflection coefficient **Γ**, relative to the chart's reference impedance.
|
|
134
|
-
A single input must use one format throughout; mixed tuples and objects are rejected.
|
|
135
|
-
Typed-array views are supported; only values inside the supplied view are copied.
|
|
136
|
-
The packed length must be a positive multiple of three. All formats use the same
|
|
137
|
-
finite-value checks and retain input order, duplicate frequencies, and full sample precision.
|
|
138
|
-
|
|
139
|
-
```ts
|
|
140
|
-
import { Smith, type TraceTuple } from 'smithkit';
|
|
141
72
|
|
|
142
|
-
|
|
143
|
-
chart.
|
|
144
|
-
|
|
145
|
-
[1e9, 0.4, -0.4],
|
|
146
|
-
[1.5e9, 0, 0],
|
|
147
|
-
[2e9, 0.4, 0.4],
|
|
148
|
-
];
|
|
149
|
-
const traceId = chart.addTrace(samples, { name: 'S11', mode: 'line' });
|
|
73
|
+
// Optional: enable interaction and add a marker explicitly.
|
|
74
|
+
chart.setOptions({ interaction: { zoom: true, cursor: true } });
|
|
75
|
+
chart.addMarker(traceId, 1);
|
|
150
76
|
|
|
151
|
-
//
|
|
152
|
-
chart.updateTrace(traceId, new Float64Array([1e9, 0.3, -0.3, 1.5e9, 0, 0, 2e9, 0.3, 0.3]));
|
|
77
|
+
// On component unmount: chart.destroy();
|
|
153
78
|
```
|
|
154
79
|
|
|
155
|
-
|
|
156
|
-
|
|
157
|
-
|
|
158
|
-
```ts
|
|
159
|
-
import { Smith } from 'smithkit';
|
|
160
|
-
|
|
161
|
-
const count = 100_000;
|
|
162
|
-
const samples = new Float64Array(count * 3);
|
|
163
|
-
for (let i = 0; i < count; i++) {
|
|
164
|
-
samples[3 * i] = 1e9 + i * 1e4;
|
|
165
|
-
samples[3 * i + 1] = 0.7 * Math.cos((i / count) * 10);
|
|
166
|
-
samples[3 * i + 2] = 0.7 * Math.sin((i / count) * 10);
|
|
167
|
-
}
|
|
168
|
-
const chart = new Smith();
|
|
169
|
-
chart.draw('#smith');
|
|
170
|
-
const traceId = chart.addTrace(samples, { mode: 'points' });
|
|
171
|
-
chart.addMarker(traceId, count - 1);
|
|
172
|
-
```
|
|
173
|
-
|
|
174
|
-
All inputs are copied into owned packed storage (24 bytes per sample for the numeric
|
|
175
|
-
payload). Modifying the input after adding or updating a trace does not change the
|
|
176
|
-
chart. Marker readings and events keep their existing object shape. `Touchstone.parse()` returns object samples by default, or packed triples with
|
|
177
|
-
`output: 'packed'`. `RfCalculations.renormalizeSamples()` preserves object or packed
|
|
178
|
-
representation.
|
|
179
|
-
Invalid replacements leave data, markers, and rendering unchanged.
|
|
180
|
-
|
|
181
|
-
For more than 5,000 samples, point rendering groups overlapping points into screen
|
|
182
|
-
cells and skips offscreen points; markers still select from the full data. Lines
|
|
183
|
-
retain every sample, so very large SVG paths can remain expensive to render and export.
|
|
184
|
-
Sorted ascending frequencies accelerate frequency selection; unsorted inputs remain
|
|
185
|
-
supported without reordering. There is no automatic interpolation or data reduction.
|
|
186
|
-
|
|
187
|
-
## Constructor configuration
|
|
188
|
-
|
|
189
|
-
`new Smith(options?)` accepts a typed `SmithOptions` object. Every field is optional:
|
|
190
|
-
|
|
191
|
-
```ts
|
|
192
|
-
import { Smith } from 'smithkit';
|
|
193
|
-
|
|
194
|
-
const chart = new Smith({
|
|
195
|
-
referenceImpedanceOhms: 75,
|
|
196
|
-
appearance: { theme: 'dark' },
|
|
197
|
-
interaction: { zoom: false },
|
|
198
|
-
peripheralScales: { visible: false },
|
|
199
|
-
grid: {
|
|
200
|
-
detail: 'basic',
|
|
201
|
-
labelsVisible: true,
|
|
202
|
-
style: { majorWidth: 1.5 },
|
|
203
|
-
layers: {
|
|
204
|
-
resistance: { style: { stroke: '#60a5fa' } },
|
|
205
|
-
reactance: { labelsVisible: false },
|
|
206
|
-
conductance: { visible: true, detail: 'standard' },
|
|
207
|
-
},
|
|
208
|
-
},
|
|
209
|
-
circles: {
|
|
210
|
-
q: { visible: true, values: [1, 2, 5] },
|
|
211
|
-
vswr: { visible: true, values: [2, 3], style: { stroke: '#fbbf24' } },
|
|
212
|
-
},
|
|
213
|
-
});
|
|
214
|
-
chart.draw('#smith');
|
|
215
|
-
|
|
216
|
-
// Update all four grids together, including hidden admittance layers.
|
|
217
|
-
chart.setGridDetail('standard');
|
|
218
|
-
// Individual overrides remain available.
|
|
219
|
-
chart.layers.reactance.setDetail('basic');
|
|
220
|
-
```
|
|
221
|
-
|
|
222
|
-
Configuration is grouped by responsibility:
|
|
223
|
-
|
|
224
|
-
| Group | Purpose | Runtime API |
|
|
225
|
-
| ------------------------ | -------------------------------------------------------------------------------------------------- | ------------------------------------------------------------------ |
|
|
226
|
-
| `referenceImpedanceOhms` | Physical reference impedance | `renormalize()` |
|
|
227
|
-
| `appearance` | Theme, fonts, colors, marker/cursor styling | `setAppearance()` |
|
|
228
|
-
| `interaction` | `zoom` and `cursor` tracking switches | `setZoomEnabled()`, `setCursorEnabled()` |
|
|
229
|
-
| `grid` | Shared detail, labels, styles; `layers` overrides for resistance/reactance/conductance/susceptance | `setGridDetail()`, `layers.resistance` and the other grid controls |
|
|
230
|
-
| `circles` | Independent Q and VSWR values, visibility, styles | `layers.q`, `layers.vswr` |
|
|
231
|
-
| `peripheralScales` | Visibility of all peripheral rulers together | `peripheralScales.setVisible()` |
|
|
232
|
-
|
|
233
|
-
Defaults are 50 Ω, the light theme, zoom and cursor disabled, peripheral scales hidden,
|
|
234
|
-
and standard grids with labels. Resistance/reactance are visible;
|
|
235
|
-
conductance/susceptance and Q/VSWR circles are hidden. Q defaults to
|
|
236
|
-
`[0.5, 1, 2, 5, 10]`; VSWR defaults to `[1.2, 1.5, 2, 3, 5, 10]`.
|
|
237
|
-
|
|
238
|
-
Shared `grid` settings apply to all four grids; `grid.layers` overrides individual
|
|
239
|
-
fields afterward. Styles merge by property. Explicit layer styles override theme
|
|
240
|
-
colors and remain in effect when `setAppearance()` changes the theme.
|
|
241
|
-
Options and circle arrays are copied; changing the original object does not update
|
|
242
|
-
the chart. Use the existing chart/layer methods for later changes. Unknown constructor groups
|
|
243
|
-
or structural option names throw `TypeError`; omitted fields use defaults.
|
|
244
|
-
|
|
245
|
-
Export configuration belongs to `toSvg()`/`toPng()` calls, independently of chart
|
|
246
|
-
construction. `scaleReadout` requires `scales`; otherwise export throws/rejects with `TypeError`.
|
|
247
|
-
|
|
248
|
-
The constructor configures presentation and interaction. Add measurement data with
|
|
249
|
-
`addTrace()` and optional markers with `addMarker()`; no markers are created implicitly.
|
|
250
|
-
Radial parameter scales remain independently mounted `SmithScales` instances.
|
|
251
|
-
|
|
252
|
-
### Updating configuration
|
|
253
|
-
|
|
254
|
-
`chart.setOptions(options)` accepts the same `SmithOptions` type as the constructor:
|
|
255
|
-
|
|
256
|
-
```ts
|
|
257
|
-
chart.setOptions({
|
|
258
|
-
interaction: { zoom: true },
|
|
259
|
-
grid: {
|
|
260
|
-
detail: 'basic',
|
|
261
|
-
layers: { reactance: { labelsVisible: false } },
|
|
262
|
-
},
|
|
263
|
-
circles: { vswr: { visible: true, values: [2, 3] } },
|
|
264
|
-
});
|
|
265
|
-
```
|
|
80
|
+
Each tuple is `[frequencyHz, realGamma, imaginaryGamma]`. Object samples and
|
|
81
|
+
packed `Float64Array` triples are also supported. Inputs are validated and copied.
|
|
266
82
|
|
|
267
|
-
|
|
268
|
-
|
|
269
|
-
|
|
270
|
-
|
|
271
|
-
replace. `appearance`, when provided, replaces the preset/overrides exactly like
|
|
272
|
-
`setAppearance()` (it is not recursively merged with the previous appearance).
|
|
83
|
+
By default, the chart shows a labeled standard impedance grid with zoom, cursor
|
|
84
|
+
tracking, and peripheral scales disabled. No markers are added automatically.
|
|
85
|
+
The constructor and `setOptions()` share the same grouped configuration schema.
|
|
86
|
+
To mount later, use `new Smith(options)` and then `chart.draw(elementOrSelector)`.
|
|
273
87
|
|
|
274
|
-
|
|
275
|
-
|
|
276
|
-
renormalization of existing traces and retains physical impedance and marker IDs.
|
|
277
|
-
Other configuration updates preserve measurements, markers, selection, and view.
|
|
278
|
-
Options are not retained; subsequent edits to the input object have no effect.
|
|
279
|
-
Individual setters remain available for focused changes.
|
|
280
|
-
|
|
281
|
-
### Keyboard and touch markers
|
|
282
|
-
|
|
283
|
-
Use Tab/Shift+Tab to focus a marker. Arrow keys move through samples in input order;
|
|
284
|
-
Right/Up advances and Left/Down goes back. Shift+Arrow or Page Up/Down moves ten
|
|
285
|
-
samples, and Home/End selects the first/last sample. Navigation clamps at the ends
|
|
286
|
-
and also works when chart zoom is disabled. A single-sample trace remains focusable
|
|
287
|
-
for reading, with its slider marked disabled.
|
|
288
|
-
|
|
289
|
-
A focused marker has a contrasting outline and exposes its trace name, marker
|
|
290
|
-
number, sample position, and frequency to assistive technology. Hidden traces are
|
|
291
|
-
excluded from keyboard focus. `chart.focusMarker(id)` allows a separate marker
|
|
292
|
-
selector to focus the matching chart control. The demo provides a **Focus on chart**
|
|
293
|
-
button beside its marker selector.
|
|
294
|
-
|
|
295
|
-
Markers have a 44 CSS px circular hit area and an 18 CSS px triangle, kept constant
|
|
296
|
-
through zoom and container resizing. A marker touch gesture does not pan the chart;
|
|
297
|
-
cancelling it releases the drag state. Touch target areas may overlap for nearby
|
|
298
|
-
markers; use keyboard focus or the demo selector to reach an obscured marker.
|
|
299
|
-
|
|
300
|
-
## Traces and markers
|
|
301
|
-
|
|
302
|
-
Trace and marker IDs are opaque strings, unique within a chart and never reused
|
|
303
|
-
there. They survive renaming, hiding, updating samples, and removing other items.
|
|
304
|
-
They are not persistent across chart instances or page reloads.
|
|
305
|
-
|
|
306
|
-
```ts
|
|
307
|
-
const markerA = chart.addMarker(traceId)!; // First sample.
|
|
308
|
-
const markerB = chart.addMarker(traceId, 2)!; // Zero-based sample index.
|
|
309
|
-
|
|
310
|
-
chart.setTraceOptions(traceId, { name: 'Tuned antenna', visible: true });
|
|
311
|
-
chart.setMarkerSample(markerB, 1);
|
|
312
|
-
console.log(chart.getMarker(markerB)?.frequencyHz); // 1.5e9
|
|
313
|
-
|
|
314
|
-
const difference = chart.compareMarkers(markerA, markerB);
|
|
315
|
-
console.log(difference?.frequencyDeltaHz); // B − A, in Hz.
|
|
316
|
-
console.log(difference?.impedanceDeltaOhms?.toVector());
|
|
317
|
-
console.log(difference?.phaseDeltaDegrees);
|
|
318
|
-
|
|
319
|
-
chart.removeMarker(markerB);
|
|
320
|
-
```
|
|
321
|
-
|
|
322
|
-
| Method | Result / behavior |
|
|
323
|
-
| ------------------------------------- | ------------------------------------------------------------------------------------------------------------------------ |
|
|
324
|
-
| `addTrace(samples, options?)` | Returns a trace ID, without creating markers. Options: nonblank `name`, solid CSS `color`, and `visible`. |
|
|
325
|
-
| `getTraces()` | Detached `TraceInfo` snapshots: ID, name, color, visibility, sample count, and marker metadata. |
|
|
326
|
-
| `setTraceOptions(id, options)` | Updates the supplied options only. Invalid options throw before any change. |
|
|
327
|
-
| `updateTrace(id, samples, options?)` | Replaces samples and preserves identity, appearance, and markers. Empty/invalid input throws without changing the trace. |
|
|
328
|
-
| `removeTrace(id)` | Removes the trace and its markers. |
|
|
329
|
-
| `clearTraces()` | Removes all traces and their markers. |
|
|
330
|
-
| `addMarker(traceId, sampleIndex = 0)` | Returns a marker ID, or `undefined` if the trace is missing. |
|
|
331
|
-
| `getMarker(id)` | Returns a `MarkerSnapshot`, or `undefined` if missing. |
|
|
332
|
-
| `focusMarker(id)` | Moves keyboard focus to a mounted, visible marker; returns `false` if missing or not focusable. |
|
|
333
|
-
| `setMarkerSample(id, sampleIndex)` | Selects an existing sample and queues a marker notification. |
|
|
334
|
-
| `removeMarker(id)` | Removes one marker without renumbering the remaining markers. |
|
|
335
|
-
| `compareMarkers(a, b)` | Returns B − A, or `undefined` if either marker is missing. |
|
|
336
|
-
| `referenceImpedanceOhms` | Read-only reference impedance. Must be positive and finite. |
|
|
337
|
-
|
|
338
|
-
Update/remove methods return a boolean: `false` means the ID was not found.
|
|
339
|
-
Sample indices must be zero-based integers within the trace; invalid indices throw
|
|
340
|
-
`RangeError`. Sample replacement follows the nearest measured frequency by default.
|
|
341
|
-
Pass `{ markerSelection: 'sample-index' }` to retain indices (clamped to the new last
|
|
342
|
-
sample if the trace shrinks), or `{ markerSelection: 'reflection' }` to select the
|
|
343
|
-
nearest Γ. Frequency and Γ ties select the earlier sample in input order, including
|
|
344
|
-
unsorted sweeps and duplicate frequencies. Selection uses the actual selected sample,
|
|
345
|
-
not a previous requested frequency. No interpolation is performed.
|
|
346
|
-
|
|
347
|
-
```ts
|
|
348
|
-
chart.updateTrace(
|
|
349
|
-
traceId,
|
|
350
|
-
[
|
|
351
|
-
{ frequencyHz: 1e9, reflectionCoefficient: [0.2, 0] },
|
|
352
|
-
{ frequencyHz: 2e9, reflectionCoefficient: [0.3, 0] },
|
|
353
|
-
],
|
|
354
|
-
{ markerSelection: 'frequency' },
|
|
355
|
-
);
|
|
356
|
-
```
|
|
357
|
-
|
|
358
|
-
Invalid strategies throw `TypeError`; empty or invalid samples throw `RangeError`
|
|
359
|
-
before mutation. Unknown trace IDs return `false` without validating input.
|
|
360
|
-
Renormalization always preserves sample indices because it transforms the existing
|
|
361
|
-
sweep rather than replacing it.
|
|
362
|
-
|
|
363
|
-
Trace snapshots contain `markers: { id, number, sampleIndex }[]`. `number` is the
|
|
364
|
-
stable display number within that trace. A `MarkerSnapshot` includes the common
|
|
365
|
-
RF reading fields below plus `traceId`, `markerId`, `markerNumber`, `sampleIndex`,
|
|
366
|
-
and `frequencyHz`.
|
|
367
|
-
|
|
368
|
-
Hiding a trace hides its points and markers while retaining measurements for
|
|
369
|
-
comparisons. Hiding or deleting a dragged marker/trace ends the drag. Mutations
|
|
370
|
-
after destruction throw; trace/marker lookups return empty or missing results.
|
|
371
|
-
|
|
372
|
-
## Trace appearance
|
|
373
|
-
|
|
374
|
-
Pass `mode: 'points' | 'line' | 'both'`, `lineWidth`, `pointRadius`, and `lineTolerancePx` to
|
|
375
|
-
`addTrace` or `setTraceOptions`. Defaults are points, 2 px line width, and 2 px point radius. Both sizes are
|
|
376
|
-
CSS pixels and remain constant under chart zoom and container resize. Widths and radii must be positive and finite.
|
|
377
|
-
`getTraces()` includes the current style.
|
|
378
|
-
|
|
379
|
-
By default, lines connect all samples in input order, without smoothing or frequency sorting.
|
|
380
|
-
A line-only trace creates one SVG path and no sample circles, suitable for dense
|
|
381
|
-
sweeps. Points/both render every sample for traces up to 5,000 samples. Larger traces
|
|
382
|
-
render one representative per point-radius-sized display cell and skip points
|
|
383
|
-
outside the viewport; representatives are recalculated during zoom/pan.
|
|
384
|
-
This only simplifies the image: all original samples remain available to markers,
|
|
385
|
-
snapping, readouts, and comparisons.
|
|
386
|
-
Styles do not change marker identity or layer ordering. Hidden traces retain their style after sample replacement.
|
|
387
|
-
The demo exposes the same controls per trace.
|
|
388
|
-
|
|
389
|
-
For dense lines, opt into `lineTolerancePx` (finite, non-negative; default `0` disables
|
|
390
|
-
simplification):
|
|
391
|
-
|
|
392
|
-
```ts
|
|
393
|
-
chart.setTraceOptions(traceId, { mode: 'line', lineTolerancePx: 0.5 });
|
|
394
|
-
```
|
|
395
|
-
|
|
396
|
-
The tolerance bounds additional geometric deviation in **CSS pixels**, accounting for
|
|
397
|
-
chart zoom and container size. It does not include SVG coordinate rounding or browser
|
|
398
|
-
antialiasing. Cached, nested geometry levels retain endpoints and input order; zooming
|
|
399
|
-
in selects finer geometry, while panning reuses the current level. The cache is rebuilt
|
|
400
|
-
when samples change, including reference-impedance renormalization. Markers, frequency
|
|
401
|
-
selection, RF calculations, and sample counts always use the full data. The option
|
|
402
|
-
applies to the line in `line` and `both` modes; point rendering is unchanged.
|
|
403
|
-
|
|
404
|
-
Preparing levels takes extra CPU and memory, and noisy traces may simplify very little.
|
|
405
|
-
This is an opt-in display optimization, not data compression. See the
|
|
406
|
-
[large-trace example](https://rosek86.github.io/smithkit/examples/large-trace/) to compare
|
|
407
|
-
full geometry with pixel tolerances and [local measurements](docs/performance.md).
|
|
408
|
-
|
|
409
|
-
## Events and readings
|
|
410
|
-
|
|
411
|
-
`onEvent(listener)` supports multiple independent subscriptions and returns an
|
|
412
|
-
unsubscribe function. `SmithEvent` is a discriminated union: checking `type`
|
|
413
|
-
narrows `data` without a cast or a property-presence test.
|
|
414
|
-
|
|
415
|
-
```ts
|
|
416
|
-
import { SmithEventType } from 'smithkit';
|
|
417
|
-
|
|
418
|
-
const unsubscribe = chart.onEvent((event) => {
|
|
419
|
-
if (event.type === SmithEventType.Cursor) {
|
|
420
|
-
// undefined when the pointer leaves or a marker drag starts.
|
|
421
|
-
console.log(event.data?.impedanceOhms?.toVector());
|
|
422
|
-
return;
|
|
423
|
-
}
|
|
424
|
-
// Marker, MarkerSelect, MarkerDragStart, and MarkerDragEnd carry a MarkerSnapshot.
|
|
425
|
-
console.log(event.data.markerId, event.data.frequencyHz);
|
|
426
|
-
});
|
|
427
|
-
|
|
428
|
-
// On component unmount:
|
|
429
|
-
unsubscribe();
|
|
430
|
-
chart.destroy();
|
|
431
|
-
```
|
|
432
|
-
|
|
433
|
-
The event types are `Cursor` (`'cursor'`), `Marker` (`'marker'`),
|
|
434
|
-
`MarkerSelect` (`'marker-select'`),
|
|
435
|
-
`MarkerDragStart` (`'marker-drag-start'`), and `MarkerDragEnd` (`'marker-drag-end'`).
|
|
436
|
-
`MarkerSelect` fires synchronously when a marker receives focus or is engaged by
|
|
437
|
-
keyboard navigation or a pointer press. Use it to select the corresponding
|
|
438
|
-
readout; it does not indicate a position change. Keyboard changes use the normal
|
|
439
|
-
queued `Marker` event and do not emit drag lifecycle events.
|
|
440
|
-
Cursor movement is suspended during marker dragging. Drag start/end events fire
|
|
441
|
-
synchronously; marker position notifications are queued and report the latest
|
|
442
|
-
snapshot at delivery. Before delivery, repeated updates to the same marker coalesce
|
|
443
|
-
into one notification; different markers have independent notifications. `addMarker()`
|
|
444
|
-
queues an initial marker notification too; `addTrace()` does not. Removed markers cannot deliver queued
|
|
445
|
-
position events.
|
|
446
|
-
Trace metadata changes do not emit marker events; refresh metadata after mutations.
|
|
447
|
-
Destruction suppresses application callbacks.
|
|
448
|
-
|
|
449
|
-
`chart.cursorReading` returns the last cursor position. Cursor and marker readings
|
|
450
|
-
share `SmithReading`; `RfCalculations.readReflection(gamma, referenceImpedanceOhms = 50)` produces
|
|
451
|
-
the same reading without constructing a chart.
|
|
452
|
-
|
|
453
|
-
| Fields | Units / meaning |
|
|
454
|
-
| ------------------------------------------------------------------------------------ | ---------------------------------------------------------------------- |
|
|
455
|
-
| `reflectionCoefficient` | Complex, dimensionless voltage Γ. |
|
|
456
|
-
| `impedanceOhms`, `admittanceSiemens` | Physical complex Z in Ω and Y in S. Multiply Y by 1000 for mS display. |
|
|
457
|
-
| `phaseDegrees` | Phase of Γ in degrees; undefined at Γ = 0. |
|
|
458
|
-
| `vswr`, `q` | Dimensionless voltage standing-wave ratio and \|X/R\|. |
|
|
459
|
-
| `returnLossDb`, `reflectionLossDb` | dB. Reflection loss is also called mismatch loss. |
|
|
460
|
-
| `standingWaveRatioDb` | 20 log₁₀(VSWR), in dB. |
|
|
461
|
-
| `attenuationDb` | Half the return loss; interpretation described below. |
|
|
462
|
-
| `powerReflectionCoefficient`, `powerTransmissionCoefficient` | \|Γ\|² and 1 − \|Γ\|². |
|
|
463
|
-
| `voltageReflectionCoefficientMagnitude` | \|Γ\|. |
|
|
464
|
-
| `voltageTransmissionCoefficientMagnitude`, `currentTransmissionCoefficientMagnitude` | \|1 + Γ\| and \|1 − Γ\|, respectively. |
|
|
465
|
-
| `standingWavePeak`, `standingWaveLossCoefficient` | √VSWR and (1 + \|Γ\|²)/(1 − \|Γ\|²). |
|
|
466
|
-
|
|
467
|
-
Singular Z at Γ = +1 and Y at Γ = −1 are `undefined`. Q is undefined at an open
|
|
468
|
-
or short, and infinite for a nonzero purely reactive impedance. Finite points near
|
|
469
|
-
these limits retain finite readings within the supported numeric range. An exact
|
|
470
|
-
infinite scalar limit is preserved: perfect match gives infinite return loss;
|
|
471
|
-
\|Γ\| = 1 gives infinite VSWR and reflection loss.
|
|
472
|
-
|
|
473
|
-
For active loads (\|Γ\| > 1), VSWR, standing-wave quantities, reflection loss,
|
|
474
|
-
attenuation, and power transmission are `undefined`. Other quantities remain
|
|
475
|
-
available. Non-finite complex inputs or invalid reference impedances throw
|
|
476
|
-
`RangeError` in the public RF methods. Unrepresentable complex conversion
|
|
477
|
-
results are `undefined`.
|
|
478
|
-
|
|
479
|
-
## Selecting a marker by frequency
|
|
480
|
-
|
|
481
|
-
`chart.setMarkerFrequency(markerId, frequencyHz)` selects the nearest measured
|
|
482
|
-
frequency and returns `true`, or `false` if the marker does not exist. It accepts
|
|
483
|
-
finite, non-negative Hz values; other values throw `RangeError`. It works with
|
|
484
|
-
unsorted sweeps and duplicate frequencies. Equal-distance ties choose the earliest
|
|
485
|
-
sample in input order. Requests outside the sweep select the nearest endpoint.
|
|
486
|
-
No interpolation or sample reordering is performed.
|
|
487
|
-
|
|
488
|
-
Read `chart.getMarker(markerId).frequencyHz` for the actual selected frequency.
|
|
489
|
-
The same queued `Marker` event is emitted as for sample-index selection, and
|
|
490
|
-
comparisons update accordingly. The demo accepts MHz and shows the selected
|
|
491
|
-
measurement frequency; dragging and sample selection keep that field synchronized.
|
|
492
|
-
|
|
493
|
-
## Calculations without a chart
|
|
494
|
-
|
|
495
|
-
```ts
|
|
496
|
-
import { Complex, RfCalculations } from 'smithkit';
|
|
497
|
-
|
|
498
|
-
const gamma = RfCalculations.impedanceToReflection(Complex.from(75, 25), 50)!;
|
|
499
|
-
const reading = RfCalculations.readReflection(gamma, 50);
|
|
500
|
-
console.log(reading.impedanceOhms?.toVector()); // Approximately [75, 25].
|
|
501
|
-
console.log(reading.admittanceSiemens?.toVector());
|
|
502
|
-
```
|
|
88
|
+
Create charts in the browser after mounting the host; call `destroy()` on unmount.
|
|
89
|
+
Calculation, formatting, and Touchstone classes also work without a DOM.
|
|
503
90
|
|
|
504
|
-
|
|
505
|
-
| --------------------------------------------------------------------------------------- | --------------------------------------------------------------------------------------------------------------- |
|
|
506
|
-
| `RfCalculations.reflectionToImpedance(gamma, referenceImpedanceOhms = 50)` | Γ → physical Z in Ω. |
|
|
507
|
-
| `RfCalculations.impedanceToReflection(impedanceOhms, referenceImpedanceOhms = 50)` | Physical Z in Ω → Γ. |
|
|
508
|
-
| `RfCalculations.reflectionToAdmittance(gamma, referenceImpedanceOhms = 50)` | Γ → physical Y in S. |
|
|
509
|
-
| `RfCalculations.admittanceToReflection(admittanceSiemens, referenceImpedanceOhms = 50)` | Physical Y in S → Γ. |
|
|
510
|
-
| `RfCalculations.readReflection(gamma, referenceImpedanceOhms = 50)` | Complete `SmithReading`. |
|
|
511
|
-
| `MarkerMeasurements.compare(a, b)` | Compare readings without a chart. Each input needs `frequencyHz`, `reflectionCoefficient`, and `impedanceOhms`. |
|
|
91
|
+
## Documentation
|
|
512
92
|
|
|
513
|
-
|
|
514
|
-
|
|
515
|
-
|
|
516
|
-
|
|
517
|
-
is singular or non-finite. Frequencies must be finite and non-negative. This is
|
|
518
|
-
a point comparison, not sweep phase unwrapping or group delay.
|
|
93
|
+
The [searchable API documentation](https://rosek86.github.io/smithkit/api/) combines
|
|
94
|
+
usage guides with generated reference pages for every public class, method, and type.
|
|
95
|
+
The hosted site follows `main`; consult the installed package's declarations when
|
|
96
|
+
using an older release.
|
|
519
97
|
|
|
520
|
-
|
|
521
|
-
|
|
522
|
-
|
|
523
|
-
|
|
524
|
-
|
|
525
|
-
|
|
526
|
-
|
|
527
|
-
|
|
528
|
-
|
|
529
|
-
|
|
530
|
-
|
|
531
|
-
|
|
532
|
-
`RfCalculations.reactanceToComponent(reactanceOhms, frequencyHz)` calculates an ideal equivalent
|
|
533
|
-
series component without formatting or constructing a chart:
|
|
534
|
-
|
|
535
|
-
```ts
|
|
536
|
-
import { RfCalculations, SmithFormatter } from 'smithkit';
|
|
537
|
-
|
|
538
|
-
const component = RfCalculations.reactanceToComponent(-50, 1e9);
|
|
539
|
-
if (component?.kind === 'capacitor') {
|
|
540
|
-
console.log(SmithFormatter.number(component.capacitanceFarads) + 'F'); // 3.18 pF
|
|
541
|
-
} else if (component?.kind === 'inductor') {
|
|
542
|
-
console.log(SmithFormatter.number(component.inductanceHenries) + 'H');
|
|
543
|
-
}
|
|
544
|
-
```
|
|
545
|
-
|
|
546
|
-
Use `reading.impedanceOhms.im` for the reactance when impedance is defined.
|
|
547
|
-
Zero frequency, zero reactance, and unrepresentable results return `undefined`.
|
|
548
|
-
Non-finite reactance or negative/non-finite frequency throws `RangeError`.
|
|
549
|
-
This is a single-frequency equivalence, not a fitted circuit model.
|
|
550
|
-
|
|
551
|
-
## Appearance and themes
|
|
552
|
-
|
|
553
|
-
`Smith` and `SmithScales` accept the same appearance configuration. The default
|
|
554
|
-
is the light preset with a transparent background. The dark preset includes a
|
|
555
|
-
solid dark background so its labels remain readable when embedded or exported.
|
|
556
|
-
|
|
557
|
-
```ts
|
|
558
|
-
import { Smith, SmithScales } from 'smithkit';
|
|
559
|
-
import type { SmithAppearance } from 'smithkit';
|
|
560
|
-
|
|
561
|
-
const appearance: SmithAppearance = {
|
|
562
|
-
theme: 'dark',
|
|
563
|
-
overrides: {
|
|
564
|
-
fontFamily: 'Arial, sans-serif',
|
|
565
|
-
grid: { majorWidth: 1.2 },
|
|
566
|
-
cursor: { impedanceColor: '#fbbf24' },
|
|
567
|
-
marker: { focusColor: '#38bdf8' },
|
|
568
|
-
traceColors: ['#38bdf8', '#fb923c', '#a78bfa'],
|
|
569
|
-
},
|
|
570
|
-
};
|
|
571
|
-
const chart = new Smith({ referenceImpedanceOhms: 50, appearance });
|
|
572
|
-
const scales = new SmithScales(appearance);
|
|
573
|
-
chart.draw('#smith');
|
|
574
|
-
scales.draw('#scales');
|
|
575
|
-
|
|
576
|
-
// Update both independent components using the same configuration.
|
|
577
|
-
chart.setAppearance({ theme: 'light' });
|
|
578
|
-
scales.setAppearance({ theme: 'light' });
|
|
579
|
-
```
|
|
580
|
-
|
|
581
|
-
Each `setAppearance` call replaces the previous preset and overrides; omitted
|
|
582
|
-
settings return to the selected preset, or light when `theme` is omitted.
|
|
583
|
-
Nested overrides are partial. Appearance is scoped to each component and does not
|
|
584
|
-
change the surrounding application's CSS or other chart instances.
|
|
585
|
-
|
|
586
|
-
| Override | Settings |
|
|
587
|
-
| -------------------------- | ------------------------------------------------------------------------------------------------------------------------------------------------------------------------------------ |
|
|
588
|
-
| `background`, `fontFamily` | Component background and shared font family. |
|
|
589
|
-
| `grid` | `stroke`, `textColor`, `majorWidth`, `minorWidth`, `fontSize`. |
|
|
590
|
-
| `boundary` | `stroke`, `width` for the Smith chart boundary. |
|
|
591
|
-
| `circles` | `q`, `vswr` colors and shared `width`. |
|
|
592
|
-
| `scales` | `stroke`, `boundaryColor`, `textColor`, `valueColor`, `indicatorColor`, `indicatorOutline`; `fontSize` for radial ticks, `titleFontSize`, `valueFontSize`, and `peripheralFontSize`. |
|
|
593
|
-
| `cursor` | `pointColor`, `impedanceColor`, `admittanceColor`, `pointSize` (dot diameter), `lineWidth`. |
|
|
594
|
-
| `marker` | `outlineColor`, `textColor`, `focusColor`, `focusHaloColor`. Marker fill follows its trace color. |
|
|
595
|
-
| `traceColors` | Non-empty palette for automatically colored traces. |
|
|
596
|
-
|
|
597
|
-
Colors must be solid CSS colors accepted by the library's color parser, including
|
|
598
|
-
hex, RGB, HSL, named colors, and `transparent`; CSS variable references are not
|
|
599
|
-
accepted in the configuration. Numeric values must be positive and finite.
|
|
600
|
-
Line widths and cursor point size are CSS pixels. Font sizes are SVG chart/scale
|
|
601
|
-
units and follow the existing layout; grid labels retain their adaptive minimum
|
|
602
|
-
size. Marker geometry and the 44 px touch target stay unchanged.
|
|
603
|
-
|
|
604
|
-
Appearance updates retain zoom, samples, marker selection/focus, layer visibility,
|
|
605
|
-
and scale readings. They recolor existing and future automatically colored traces.
|
|
606
|
-
Explicit colors passed through trace options and explicit layer styles take
|
|
607
|
-
precedence and survive theme changes. Applying a new appearance does not reset
|
|
608
|
-
those individual overrides. Invalid appearance settings throw before making changes.
|
|
609
|
-
|
|
610
|
-
SVG exports resolve the appearance without requiring theme CSS. A configured
|
|
611
|
-
background is included in the exported image; `transparent` preserves transparency.
|
|
612
|
-
The **Theme** selector in the demo's **Chart settings** dialog updates both library components and the demo UI.
|
|
613
|
-
|
|
614
|
-
## Grid layers
|
|
615
|
-
|
|
616
|
-
Resistance and reactance are initially visible. Conductance, susceptance, Q,
|
|
617
|
-
and VSWR layers start hidden. All controls are under `chart.layers`:
|
|
618
|
-
|
|
619
|
-
```ts
|
|
620
|
-
chart.layers.resistance.setVisible(false);
|
|
621
|
-
chart.layers.reactance.setVisible(false);
|
|
622
|
-
chart.layers.conductance.setVisible(true);
|
|
623
|
-
chart.layers.susceptance.setVisible(true);
|
|
624
|
-
chart.layers.conductance.setDetail('standard');
|
|
625
|
-
chart.layers.conductance.setLabelsVisible(false);
|
|
626
|
-
chart.layers.susceptance.setLabelsVisible(false);
|
|
627
|
-
chart.layers.susceptance.setStyle({ stroke: '#64748b', textColor: '#2a7f62' });
|
|
628
|
-
chart.layers.vswr.addValue(4);
|
|
629
|
-
chart.layers.vswr.setVisible(true);
|
|
630
|
-
```
|
|
631
|
-
|
|
632
|
-
The four grid layers support `setVisible`, `setLabelsVisible`, `setDetail`, and
|
|
633
|
-
`setStyle(Partial<GridStyle>)`. Style fields: `stroke`, `majorWidth`, `minorWidth`,
|
|
634
|
-
`textColor`, `textFontFamily`, `textFontSize`. Widths are positive finite numbers
|
|
635
|
-
in CSS pixels. Font size is a positive finite base size in chart units; adaptive
|
|
636
|
-
layout raises it when needed to keep the font size at least 9 CSS pixels in the
|
|
637
|
-
default view. Partial updates retain other settings. Invalid numeric styles throw
|
|
638
|
-
before any property is changed.
|
|
639
|
-
|
|
640
|
-
Use `chart.setGridDetail('basic' | 'standard' | 'detailed')` for all four grid layers,
|
|
641
|
-
or `layer.setDetail(...)` to override one layer:
|
|
642
|
-
|
|
643
|
-
- **Basic:** complete circles and arcs for normalized values 0.2, 0.5, 1, 2, and 5,
|
|
644
|
-
with matching axis/rim labels and the zero label. Intended for small or static charts.
|
|
645
|
-
- **Standard** (default): the full major grid and its labels, without minor lines.
|
|
646
|
-
- **Detailed:** the full major and minor grid.
|
|
647
|
-
|
|
648
|
-
Changing detail preserves layer visibility, styles, and the current view. Label
|
|
649
|
-
collision handling still applies at every level. Peripheral scales and Q/VSWR
|
|
650
|
-
circles are independent. The demo's **Chart settings → Grid detail** selector updates all four grid layers.
|
|
651
|
-
|
|
652
|
-
Use `setLabelsVisible(false)` to hide a grid layer's labels while keeping its lines.
|
|
653
|
-
Labels default to visible. The setting persists through detail, style, theme, and
|
|
654
|
-
whole-layer visibility changes and is included in SVG exports. Calling
|
|
655
|
-
`setLabelsVisible(true)` restores labels allowed by the current detail and collision
|
|
656
|
-
layout; it does not show a hidden layer. The **Grid labels** checkbox in the demo’s **Chart settings** dialog controls all four grid layers together. Peripheral scale labels are unaffected.
|
|
657
|
-
|
|
658
|
-
`layers.q` and `layers.vswr` support `setVisible`,
|
|
659
|
-
`setStyle({ stroke?, strokeWidth? })`, `setValues`, `addValue`, and `removeValue`.
|
|
660
|
-
`setValues([1, 2, 5])` replaces the entire list; `setValues([])` clears it.
|
|
661
|
-
Input arrays are copied, duplicate values are ignored, and invalid input leaves
|
|
662
|
-
the previous values unchanged.
|
|
663
|
-
Circle stroke widths are positive finite numbers in CSS pixels.
|
|
664
|
-
Q values must be positive and finite; VSWR values must be finite and at least 1.
|
|
665
|
-
Duplicate additions and removal of absent values have no effect.
|
|
666
|
-
|
|
667
|
-
Grid labels use normalized values; readings use physical units. Strokes default
|
|
668
|
-
to slate gray with 1 px major and 0.6 px minor lines. Stroke widths stay constant
|
|
669
|
-
under zoom. Layer controls do not expose drawing objects or SVG nodes.
|
|
670
|
-
|
|
671
|
-
Grid labels adapt automatically to the chart's rendered size,
|
|
672
|
-
including static charts with zoom disabled. The layout prioritizes key values,
|
|
673
|
-
hides labels that overlap or extend beyond the default view, and prioritizes zero
|
|
674
|
-
and the highest labeled axis value. It recalculates on resize and layer visibility
|
|
675
|
-
or style changes. Zoom and pan preserve the chosen labels and scale them smoothly
|
|
676
|
-
with the grid. This changes only labels; grid lines and ticks remain unchanged.
|
|
677
|
-
SVG exports preserve the current label layout.
|
|
678
|
-
|
|
679
|
-
For small static charts, hide minor grid lines and, when unnecessary, peripheral
|
|
680
|
-
scales using the controls above. Very small charts necessarily show fewer values;
|
|
681
|
-
use a larger container for detailed readings. Peripheral labels retain their full
|
|
682
|
-
wording and scale with the chart. Their rulers form two outlined bands: phase
|
|
683
|
-
(transmission/reflection) and electrical length (toward load/generator), with a
|
|
684
|
-
shared tick circle inside each band.
|
|
685
|
-
The independent `SmithScales` panel uses its own responsive layout.
|
|
686
|
-
|
|
687
|
-
## Parameter scales
|
|
688
|
-
|
|
689
|
-
Mount `SmithScales` independently so its twelve axes stay outside chart zoom:
|
|
690
|
-
|
|
691
|
-
```ts
|
|
692
|
-
import { SmithScales, SmithEventType } from 'smithkit';
|
|
693
|
-
|
|
694
|
-
const scales = new SmithScales();
|
|
695
|
-
scales.draw('#smith-scales'); // Provide a separate mounted container.
|
|
696
|
-
const stopScales = chart.onEvent((event) => {
|
|
697
|
-
if (event.type === SmithEventType.Cursor || event.type === SmithEventType.Marker) {
|
|
698
|
-
const gamma = event.data?.reflectionCoefficient ?? null;
|
|
699
|
-
scales.update(gamma);
|
|
700
|
-
chart.peripheralScales.update(gamma);
|
|
701
|
-
}
|
|
702
|
-
});
|
|
703
|
-
|
|
704
|
-
// On unmount: stopScales(); scales.destroy(); chart.destroy();
|
|
705
|
-
```
|
|
706
|
-
|
|
707
|
-
`update(Complex | null)` synchronizes indicators, values, tooltips, and accessible
|
|
708
|
-
labels. Null, non-finite, or active-load inputs hide indicators. `draw` accepts a
|
|
709
|
-
selector or `HTMLElement`; `destroy` is idempotent. Scales adapt to container width.
|
|
710
|
-
|
|
711
|
-
Labels follow the complete Smith chart terminology: **Reflection loss**,
|
|
712
|
-
**Power reflection coefficient**, **Power transmission coefficient**, and separate
|
|
713
|
-
**Voltage transmission coefficient** and **Current transmission coefficient**.
|
|
714
|
-
Ratios are dimensionless; loss/standing-wave dB axes are in dB. Transmission
|
|
715
|
-
indicators depend on Γ phase as well as magnitude.
|
|
716
|
-
|
|
717
|
-
Attenuation is −10 log₁₀\|Γ\|, half the return loss. Its one-way loss interpretation
|
|
718
|
-
assumes a matched line or attenuator terminated in an open or short: the reflected
|
|
719
|
-
wave traverses it twice. It does not measure insertion loss of an arbitrary load
|
|
720
|
-
from S11 alone. At \|Γ\| = 0.1 it reads 10 dB, while return loss reads 20 dB.
|
|
721
|
-
|
|
722
|
-
Peripheral rulers are hidden by default. Enable them with
|
|
723
|
-
`{ peripheralScales: { visible: true } }` or `chart.peripheralScales.setVisible(true)`.
|
|
724
|
-
Axis captions and numeric tick labels can be controlled independently, through the
|
|
725
|
-
constructor, `setOptions()`, or the peripheral scale controls:
|
|
726
|
-
|
|
727
|
-
```ts
|
|
728
|
-
import { Smith } from 'smithkit';
|
|
729
|
-
|
|
730
|
-
const chart = new Smith({
|
|
731
|
-
peripheralScales: { visible: true, captionsVisible: false, tickLabelsVisible: true },
|
|
732
|
-
});
|
|
733
|
-
chart.draw('#smith');
|
|
734
|
-
|
|
735
|
-
chart.setOptions({ peripheralScales: { captionsVisible: true } });
|
|
736
|
-
chart.peripheralScales.setTickLabelsVisible(false); // Captions and rulers remain visible.
|
|
737
|
-
chart.peripheralScales.setCaptionsVisible(false); // Rulers and indicators remain visible.
|
|
738
|
-
```
|
|
739
|
-
|
|
740
|
-
Both text options default to `true`; the entire group remains hidden by default.
|
|
741
|
-
When captions are hidden, numeric labels fill the sectors normally reserved for them.
|
|
742
|
-
Hiding/re-showing the rulers preserves both preferences. Text controls do not affect
|
|
743
|
-
ruler lines, ticks, indicators, grid labels, or the independent radial parameter scales.
|
|
744
|
-
SVG/PNG exports preserve the current text visibility. The demo exposes **Axis captions**
|
|
745
|
-
and **Tick values** checkboxes in **Chart settings**.
|
|
746
|
-
|
|
747
|
-
`chart.peripheralScales.update(Complex | null)` supplies or clears the indicators.
|
|
748
|
-
Its four rulers zoom with the chart: reflection phase, voltage transmission phase,
|
|
749
|
-
wavelengths toward generator, and wavelengths toward load. Wavelength rulers start
|
|
750
|
-
at the negative real axis, with 0.5 λ per revolution (generator clockwise, load
|
|
751
|
-
counterclockwise). These are electrical-length coordinates modulo 0.5 λ.
|
|
752
|
-
Reflection phase and wavelength coordinates are undefined at perfect match;
|
|
753
|
-
transmission phase is undefined at Γ = −1.
|
|
754
|
-
|
|
755
|
-
Scale conventions follow the [complete Smith chart reference](https://www.uiyinc.com/assets/The-Complete-Smith-Chart-Black-Magic-Design.jpg)
|
|
756
|
-
and [CERN's Smith chart introduction](https://arxiv.org/abs/1201.4068).
|
|
757
|
-
|
|
758
|
-
## Reference impedance and renormalization
|
|
759
|
-
|
|
760
|
-
`chart.renormalize(referenceImpedanceOhms)` changes the positive real reference
|
|
761
|
-
impedance and transforms every loaded Γ to preserve physical Z. Trace/marker IDs,
|
|
762
|
-
names, colors, visibility, frequencies, and selected sample indices are retained.
|
|
763
|
-
Results for all traces are validated before any change; a singular/unrepresentable
|
|
764
|
-
result rejects the operation without changing Z₀ or data. Active marker drags end,
|
|
765
|
-
cursor indicators are cleared, and marker readings are queued with the new values.
|
|
766
|
-
Changing to the current Z₀ has no effect. Mutations after destruction throw.
|
|
767
|
-
|
|
768
|
-
Two DOM-independent methods are available on `RfCalculations`:
|
|
769
|
-
|
|
770
|
-
- `RfCalculations.renormalizeReflection(gamma, fromOhms, toOhms)` returns the new complex Γ or
|
|
771
|
-
`undefined` for a singular/unrepresentable result. Exact open and short limits
|
|
772
|
-
remain Γ = +1 and −1. References must be positive, finite, real ohm values.
|
|
773
|
-
- `RfCalculations.renormalizeSamples(samples, fromOhms, toOhms)` returns a new sample array in
|
|
774
|
-
the same order, preserving frequencies. Invalid samples or a singular result
|
|
775
|
-
throw `RangeError`; the input is never modified.
|
|
776
|
-
|
|
777
|
-
For example, a matched 75 Ω load has Γ = 0 at 75 Ω and Γ = 0.2 at 50 Ω.
|
|
778
|
-
Renormalization changes Γ, VSWR, and loss readings; physical impedance stays 75 Ω.
|
|
779
|
-
Simply relabeling the same Γ with a new Z₀ would describe a different load.
|
|
780
|
-
|
|
781
|
-
The demo exposes chart Z₀ and explicitly renormalizes existing traces when applied.
|
|
782
|
-
Import renormalization is enabled by a labeled checkbox. Disable it to reject
|
|
783
|
-
files whose reference differs from the chart. Complex reference impedances and
|
|
784
|
-
multiport renormalization are outside the supported scope.
|
|
785
|
-
|
|
786
|
-
## Touchstone import and export
|
|
787
|
-
|
|
788
|
-
`Touchstone.parse(text, options?)` returns `{ samples, referenceImpedanceOhms }`.
|
|
789
|
-
It reads Touchstone 1.x S-parameters, converts RI/MA/DB into Cartesian Γ and
|
|
790
|
-
frequencies into Hz, and throws an `Error` with a line number for invalid content.
|
|
791
|
-
Invalid parser options throw `TypeError`.
|
|
792
|
-
|
|
793
|
-
| Option | Default | Meaning |
|
|
794
|
-
| ----------- | ----------- | -------------------------------------------------------------------------------- |
|
|
795
|
-
| `ports` | `1` | Source port count: `1` for `.s1p`, `2` for `.s2p`. It is not inferred from text. |
|
|
796
|
-
| `parameter` | `'S11'` | Reflection parameter: `'S11'` or, with two ports, `'S22'`. |
|
|
797
|
-
| `output` | `'objects'` | Object samples or `'packed'` `Float64Array` containing f/re/im triples. |
|
|
798
|
-
|
|
799
|
-
```ts
|
|
800
|
-
import { Smith, Touchstone } from 'smithkit';
|
|
801
|
-
|
|
802
|
-
async function showMeasurement(file: File): Promise<Smith> {
|
|
803
|
-
const ports = /\.s2p$/i.test(file.name) ? 2 : 1;
|
|
804
|
-
const { samples, referenceImpedanceOhms } = Touchstone.parse(await file.text(), {
|
|
805
|
-
ports,
|
|
806
|
-
parameter: ports === 2 ? 'S22' : 'S11',
|
|
807
|
-
output: 'packed',
|
|
808
|
-
});
|
|
809
|
-
const chart = new Smith({ referenceImpedanceOhms });
|
|
810
|
-
chart.draw('#smith');
|
|
811
|
-
chart.addTrace(samples, { name: file.name });
|
|
812
|
-
return chart;
|
|
813
|
-
}
|
|
814
|
-
```
|
|
815
|
-
|
|
816
|
-
Packed parsing writes directly into growing typed storage, without creating an
|
|
817
|
-
object or coordinate array per sample. It scans lines incrementally within the
|
|
818
|
-
supplied string; this is not a streaming file API. The returned buffer has exact
|
|
819
|
-
length and is caller-owned. The default object result remains unchanged.
|
|
820
|
-
|
|
821
|
-
Omitted header options use GHz, S, MA, 50 Ω. The parser accepts comments, BOM,
|
|
822
|
-
LF/CRLF/CR line endings, decimal scientific notation, and continued records. Each
|
|
823
|
-
frequency record starts on a new line. Two-port records use S11, S21, S12, S22
|
|
824
|
-
order; all four parameters are validated even though only one reflection trace is
|
|
825
|
-
returned. Two-port frequencies must increase strictly. Three or more ports,
|
|
826
|
-
per-port/complex reference impedances, noise blocks and Touchstone 2.x keywords
|
|
827
|
-
are rejected. See the [IBIS Touchstone specification](https://www.ibis.org/touchstone_ver2.1/touchstone_ver2_1.pdf)
|
|
828
|
-
for the legacy 1.x data layout.
|
|
829
|
-
|
|
830
|
-
`Touchstone.stringify(samples, { referenceImpedanceOhms })` returns `.s1p` text
|
|
831
|
-
with a `# Hz S RI R …` header and a final newline. It accepts object samples,
|
|
832
|
-
tuples, or packed triples, writes numeric values without a precision limit, and
|
|
833
|
-
does not modify or renormalize the input. The reference defaults to 50 Ω; supply
|
|
834
|
-
the actual reference of your data. Empty/invalid samples, nonpositive/nonfinite
|
|
835
|
-
reference impedance, and duplicate or descending frequencies throw `RangeError`.
|
|
836
|
-
Samples are never silently sorted or discarded.
|
|
837
|
-
|
|
838
|
-
```ts
|
|
839
|
-
import { RfCalculations, Touchstone } from 'smithkit';
|
|
840
|
-
|
|
841
|
-
const sourceText = '# GHz S RI R 50\n1 0 0\n2 0.5 0';
|
|
842
|
-
const parsed = Touchstone.parse(sourceText, { output: 'packed' });
|
|
843
|
-
const samples = RfCalculations.renormalizeSamples(
|
|
844
|
-
parsed.samples,
|
|
845
|
-
parsed.referenceImpedanceOhms,
|
|
846
|
-
75,
|
|
847
|
-
);
|
|
848
|
-
const text = Touchstone.stringify(samples, { referenceImpedanceOhms: 75 });
|
|
849
|
-
// Save text as measurement.s1p in your application.
|
|
850
|
-
```
|
|
851
|
-
|
|
852
|
-
For an extracted S11/S22 trace, this is **one-port renormalization**: the other
|
|
853
|
-
port remains terminated in the original file reference. It is not renormalization
|
|
854
|
-
of the complete two-port network. Exporting S22 to `.s1p` represents that selected
|
|
855
|
-
port as the single port of the new file; transmission data is not exported.
|
|
856
|
-
|
|
857
|
-
The [Touchstone example](https://rosek86.github.io/smithkit/examples/touchstone/index.html)
|
|
858
|
-
shows parameter selection, packed import, renormalization and download. In the demo,
|
|
859
|
-
choose **Two-port reflection** before importing `.s2p`; the trace name includes the
|
|
860
|
-
selected parameter. Both `.s1p` and `.s2p` use packed import.
|
|
861
|
-
|
|
862
|
-
## PNG and report export
|
|
863
|
-
|
|
864
|
-
`chart.toPng(options?)` and `scales.toPng(options?)` return `Promise<Blob>` with MIME
|
|
865
|
-
type `image/png`. Call them in a browser after mounting the components at non-zero
|
|
866
|
-
sizes, as with SVG export. The current view, labels, colors, markers, and scale
|
|
867
|
-
readings are captured without modifying the live components.
|
|
868
|
-
|
|
869
|
-
```ts
|
|
870
|
-
import { SmithScales } from 'smithkit';
|
|
871
|
-
|
|
872
|
-
const scales = new SmithScales();
|
|
873
|
-
scales.draw('#scales');
|
|
874
|
-
const png = await chart.toPng({ width: 3200, background: 'white', legend: true });
|
|
875
|
-
// Use the Blob with your application's download, preview, or upload flow.
|
|
876
|
-
const report = await chart.toPng({ width: 2400, scales, legend: true });
|
|
877
|
-
const scalePng = await scales.toPng({ width: 1200, background: 'transparent' });
|
|
878
|
-
```
|
|
879
|
-
|
|
880
|
-
- `width` / `height`: output pixels. Omit both to use the snapshot's natural size;
|
|
881
|
-
specify one to preserve proportions. With both set, the complete image is
|
|
882
|
-
centered and fitted without distortion or cropping. Padding uses the chosen
|
|
883
|
-
background, or transparency when no background is specified.
|
|
884
|
-
- `background`: omit to keep component backgrounds, or pass a concrete CSS color
|
|
885
|
-
(for example `'#fff'`) or `'transparent'` to replace them. Chart colors stay as
|
|
886
|
-
configured; choose a suitable chart theme for your report background.
|
|
887
|
-
- `lineDetail` (chart only): `'full'` (default) includes every sample in each trace line;
|
|
888
|
-
`'view'` preserves the currently displayed line geometry, including simplification.
|
|
889
|
-
Both work for SVG and PNG without changing the live chart. Increasing export dimensions
|
|
890
|
-
scales the current-view error too; use `'full'` for reports requiring all samples.
|
|
891
|
-
This option does not change point culling, the viewport, markers, or scales.
|
|
892
|
-
- `legend` (chart only): append the names and colors of visible traces. Long names
|
|
893
|
-
wrap; hidden traces are omitted. Default: `false`.
|
|
894
|
-
- `markerLegend` (chart only): independently append marker descriptions below the chart/scales.
|
|
895
|
-
Default: `false`. `true` includes every marker of visible traces, with trace name,
|
|
896
|
-
marker number, frequency, and impedance. Use an options object to select `markerIds`
|
|
897
|
-
and `fields` (`frequency`, `impedance`, `admittance`, `reflectionCoefficient`, `vswr`,
|
|
898
|
-
`returnLoss`). Fields use Hz with SI prefixes, Ω, mS, dimensionless Γ, VSWR ratios,
|
|
899
|
-
and dB respectively. Empty `markerIds` selects none; empty `fields` keeps only names
|
|
900
|
-
and marker numbers. Hidden traces are always omitted, duplicate selections appear
|
|
901
|
-
once, and unknown IDs/fields throw. Long descriptions wrap. Readings are captured at
|
|
902
|
-
export invocation, without moving markers or changing the live view.
|
|
903
|
-
- `scales` (chart only): a mounted `SmithScales` instance to place centered below the chart.
|
|
904
|
-
Its current responsive layout and readings are preserved. Use `scaleReadout` to
|
|
905
|
-
export a specific reading independently of the live view.
|
|
906
|
-
|
|
907
|
-
```ts
|
|
908
|
-
// Works with toSvg() as well. Trace and marker legends are independent.
|
|
909
|
-
const png = await chart.toPng({
|
|
910
|
-
legend: false,
|
|
911
|
-
markerLegend: {
|
|
912
|
-
fields: ['frequency', 'impedance', 'vswr'],
|
|
913
|
-
// Omit markerIds to include all markers of visible traces.
|
|
914
|
-
},
|
|
915
|
-
});
|
|
916
|
-
```
|
|
917
|
-
|
|
918
|
-
Dimensions must be positive integers, at most 8192 px per side and 32 megapixels
|
|
919
|
-
in total. Invalid options and unavailable/destroyed components reject the promise.
|
|
920
|
-
PNG export uses browser SVG decoding and Canvas 2D and releases temporary image URLs.
|
|
921
|
-
Fonts must be available to the browser; external font files are not embedded.
|
|
922
|
-
Export size increases resolution; it does not change the current label density.
|
|
923
|
-
|
|
924
|
-
The demo's **Export** dialog supports chart, scales, or a combined report,
|
|
925
|
-
custom dimensions/background, and independent trace and marker legends. **Include marker legend** reveals field and marker checkboxes; it is disabled for scales-only exports. The default output width is 3200 px. Choose PNG or SVG in the same dialog; both formats support these report options. The demo starts in dark mode. For exports containing parameter scales, **Scale readings** explicitly selects a marker or **None**, independently of the Cursor/Marker tab. Marker exports include the trace name, marker number, and frequency; cursor readings are not exported.
|
|
926
|
-
|
|
927
|
-
To export a specific scale reading without changing the live view, pass `readout` to
|
|
928
|
-
`scales.toSvg()` / `scales.toPng()`, or `scaleReadout` to a combined chart export:
|
|
929
|
-
|
|
930
|
-
```ts
|
|
931
|
-
import { Complex, SmithScales } from 'smithkit';
|
|
932
|
-
|
|
933
|
-
const scales = new SmithScales();
|
|
934
|
-
scales.draw('#scales');
|
|
935
|
-
const report = await chart.toPng({
|
|
936
|
-
scales,
|
|
937
|
-
scaleReadout: {
|
|
938
|
-
reflectionCoefficient: Complex.from(0.2, 0.3),
|
|
939
|
-
label: 'Antenna · Marker 1 · Frequency: 1 GHz',
|
|
940
|
-
},
|
|
941
|
-
});
|
|
942
|
-
```
|
|
943
|
-
|
|
944
|
-
Use `{ reflectionCoefficient: null }` for scales without readings. Omit the override to
|
|
945
|
-
preserve the current readings. Labels wrap to fit the exported scales.
|
|
946
|
-
|
|
947
|
-
## SVG export
|
|
948
|
-
|
|
949
|
-
`chart.toSvg(options?)` and `scales.toSvg(options?)` return SVG strings synchronously.
|
|
950
|
-
They accept the same `SmithImageExportOptions` / `ImageExportOptions` as PNG export,
|
|
951
|
-
including size, background, legend, and scales. Omitting options preserves the
|
|
952
|
-
original standalone SVG snapshot. Call them after `draw()`
|
|
953
|
-
while the component is mounted and has a non-zero rendered size; exporting before
|
|
954
|
-
mounting, from a `display: none` container, or after destruction throws an error.
|
|
955
|
-
|
|
956
|
-
```ts
|
|
957
|
-
const svg = chart.toSvg();
|
|
958
|
-
const blob = new Blob([svg], { type: 'image/svg+xml;charset=utf-8' });
|
|
959
|
-
const url = URL.createObjectURL(blob);
|
|
960
|
-
const link = document.createElement('a');
|
|
961
|
-
link.href = url;
|
|
962
|
-
link.download = 'smith-chart.svg';
|
|
963
|
-
document.body.appendChild(link);
|
|
964
|
-
link.click();
|
|
965
|
-
link.remove();
|
|
966
|
-
setTimeout(() => URL.revokeObjectURL(url), 1000);
|
|
967
|
-
```
|
|
968
|
-
|
|
969
|
-
The chart export preserves the current zoom/pan, layer visibility, labels, traces,
|
|
970
|
-
markers, and visible indicators. It captures the rendered points, including dense
|
|
971
|
-
trace point reduction; it is an image export, not a measurement-data export.
|
|
972
|
-
The scale export combines all twelve axes into one SVG using their current layout
|
|
973
|
-
and displayed readings. To export a marker reading, call `scales.update()` with
|
|
974
|
-
that marker's reflection coefficient before `scales.toSvg()`.
|
|
975
|
-
|
|
976
|
-
Files have explicit pixel dimensions and preserve the configured component background
|
|
977
|
-
(transparent by default). Presentation
|
|
978
|
-
styles are inlined so the application's stylesheet is not required. Text remains
|
|
979
|
-
editable, and curved captions retain their internal path references. Font files
|
|
980
|
-
and surrounding HTML controls/backgrounds are not embedded. Downloading is the
|
|
981
|
-
consumer's responsibility; the library does not create files or modify live nodes.
|
|
982
|
-
In the demo, choose **Export → Format → SVG**, then select chart, scales, or the combined report.
|
|
98
|
+
| Topic | Guide |
|
|
99
|
+
| -------------------------------------------------------- | ---------------------------------------------------------------------------------------------------- |
|
|
100
|
+
| Mounting, resizing, cleanup | [Getting started](https://rosek86.github.io/smithkit/api/documents/Getting_started.html) |
|
|
101
|
+
| Constructor options, runtime patches, themes, layers | [Configuration](https://rosek86.github.io/smithkit/api/documents/Configuration.html) |
|
|
102
|
+
| Data formats, trace styling, markers, keyboard and touch | [Traces and markers](https://rosek86.github.io/smithkit/api/documents/Traces_and_markers.html) |
|
|
103
|
+
| Subscriptions, event timing, readouts and units | [Events and readings](https://rosek86.github.io/smithkit/api/documents/Events_and_readings.html) |
|
|
104
|
+
| Radial and peripheral scales | [Scales](https://rosek86.github.io/smithkit/api/documents/Scales.html) |
|
|
105
|
+
| Complex arithmetic, conversions and renormalization | [RF calculations](https://rosek86.github.io/smithkit/api/documents/RF_calculations.html) |
|
|
106
|
+
| S11/S22 import, packed parsing, one-port export | [Touchstone](https://rosek86.github.io/smithkit/api/documents/Touchstone.html) |
|
|
107
|
+
| SVG/PNG, dimensions, backgrounds, scales and legends | [Report export](https://rosek86.github.io/smithkit/api/documents/SVG_and_PNG_export.html) |
|
|
108
|
+
| React and Angular lifecycle integration | [Framework integration](https://rosek86.github.io/smithkit/api/documents/Framework_integration.html) |
|
|
983
109
|
|
|
984
110
|
## Development and license
|
|
985
111
|
|
|
986
112
|
See [CONTRIBUTING.md](CONTRIBUTING.md) for development, testing, release, and demo
|
|
987
113
|
hosting instructions. Licensed under [MIT](LICENSE).
|
|
988
|
-
|
|
989
|
-
## Numerical limits
|
|
990
|
-
|
|
991
|
-
`Complex` uses JavaScript binary64 numbers. Multiplication and division scale
|
|
992
|
-
intermediate products to avoid premature overflow and underflow; logarithms,
|
|
993
|
-
square roots, and reciprocals also handle extreme finite components. Results still
|
|
994
|
-
round to binary64: unrepresentable magnitudes become infinity and tiny results
|
|
995
|
-
can underflow to signed zero. Division by zero and reciprocals at zero return
|
|
996
|
-
`[NaN, NaN]`. These operations reject non-finite operands with NaN components.
|
|
997
|
-
The principal logarithm of zero retains its `-Infinity` real limit, and signed
|
|
998
|
-
zeros select the side of square-root and logarithm branch cuts. `pow(z, 0)` is one,
|
|
999
|
-
including zero to the zeroth power; negative powers of zero are undefined.
|
|
1000
|
-
|
|
1001
|
-
RF helpers validate finite inputs and use `undefined` for unrepresentable complex
|
|
1002
|
-
readings, including an overflowing impedance difference between markers. These
|
|
1003
|
-
conventions do not imply arbitrary precision or numerical certification of every
|
|
1004
|
-
transcendental operation.
|