signalk-polar-performance-plugin 0.0.18 → 0.0.20
This diff represents the content of publicly available package versions that have been released to one of the supported registries. The information contained in this diff is provided for informational purposes only and reflects changes between package versions as they appear in their respective public registries.
- package/README.md +4 -0
- package/doc/BandG_polar.png +0 -0
- package/package.json +1 -1
- package/plugin/index.js +15 -2
- package/public/index.html +56 -9
package/README.md
CHANGED
|
@@ -15,6 +15,10 @@ The following paths are read
|
|
|
15
15
|
### Polar diagram
|
|
16
16
|
The polar diagram can be configured through CSV notation as used on [ORC sailboat data](https://jieter.github.io/orc-data/site/).
|
|
17
17
|
|
|
18
|
+
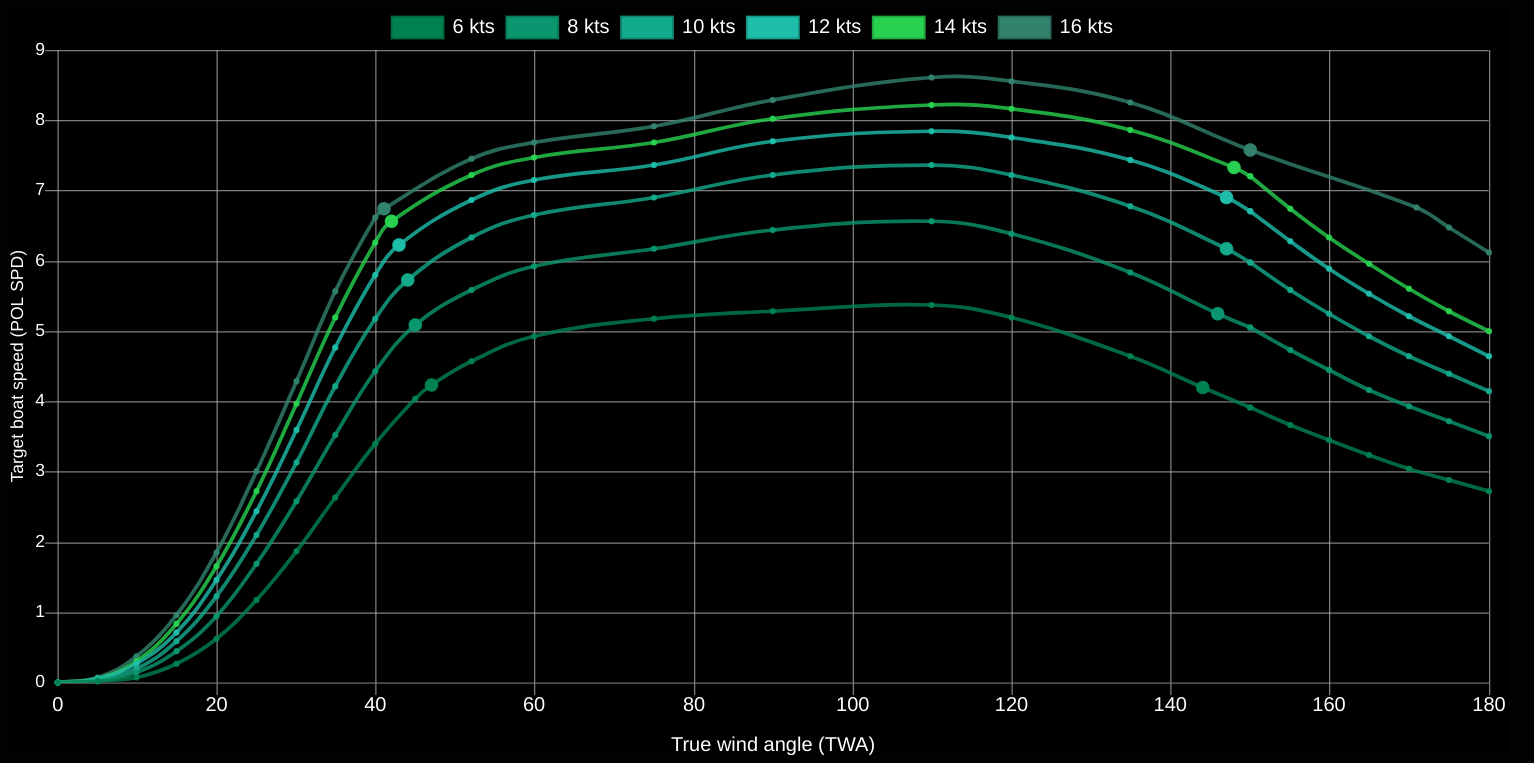
The resulting polar after processing can be seen here in the WebApp, looking something like:
|
|
19
|
+
|
|
20
|
+
|
|
21
|
+
|
|
18
22
|
### Plugin options
|
|
19
23
|
In the plugin configuration you can toggle the following options:
|
|
20
24
|
- Enable calculation/sending of beat/upwind and run/gybe/downwind angle
|
|
Binary file
|
package/package.json
CHANGED
package/plugin/index.js
CHANGED
|
@@ -544,7 +544,19 @@ module.exports = function (app) {
|
|
|
544
544
|
}
|
|
545
545
|
|
|
546
546
|
function getChartData () {
|
|
547
|
-
|
|
547
|
+
var backgroundColor = []
|
|
548
|
+
var borderColor = []
|
|
549
|
+
for (let c = 0; c < 8; c++) {
|
|
550
|
+
let r = 0 + (c*10)
|
|
551
|
+
let g = 130 + (c*20 % 100)
|
|
552
|
+
let b = 80 + (c*30 % 120)
|
|
553
|
+
let color = r + ', ' + g + ', ' + b
|
|
554
|
+
backgroundColor.push('rgba(' + color + ', 1)')
|
|
555
|
+
borderColor.push('rgba(' + color + ', 0.8)')
|
|
556
|
+
}
|
|
557
|
+
app.debug(backgroundColor)
|
|
558
|
+
app.debug(borderColor)
|
|
559
|
+
|
|
548
560
|
|
|
549
561
|
var data = {
|
|
550
562
|
labels: [],
|
|
@@ -560,7 +572,8 @@ module.exports = function (app) {
|
|
|
560
572
|
data.datasets[index] = {
|
|
561
573
|
data: [],
|
|
562
574
|
pointRadius: [],
|
|
563
|
-
|
|
575
|
+
backgroundColor: backgroundColor[index],
|
|
576
|
+
borderColor: borderColor[index],
|
|
564
577
|
fill: false,
|
|
565
578
|
label: tws + ' kts'
|
|
566
579
|
}
|
package/public/index.html
CHANGED
|
@@ -3,7 +3,7 @@
|
|
|
3
3
|
<script type='text/javascript' src="./Chart.min.js"></script>
|
|
4
4
|
<script type='text/javascript' src='/jquery/dist/jquery.min.js'></script>
|
|
5
5
|
<title>Polar performance</title>
|
|
6
|
-
<body>
|
|
6
|
+
<body style="background-color:#020202;">
|
|
7
7
|
|
|
8
8
|
<canvas id="myChart" style="width:100%;max-width:1200px"></canvas>
|
|
9
9
|
|
|
@@ -18,22 +18,65 @@ function showChart (data) {
|
|
|
18
18
|
type: "scatter",
|
|
19
19
|
data: data,
|
|
20
20
|
options: {
|
|
21
|
-
legend: {
|
|
21
|
+
legend: {
|
|
22
|
+
display: true,
|
|
23
|
+
labels: {
|
|
24
|
+
fontSize: 16,
|
|
25
|
+
fontColor: 'white'
|
|
26
|
+
}
|
|
27
|
+
},
|
|
22
28
|
spanGaps: true,
|
|
23
29
|
scales: {
|
|
24
30
|
x: {
|
|
25
|
-
type: 'linear'
|
|
31
|
+
type: 'linear',
|
|
32
|
+
ticks: {
|
|
33
|
+
color: 'white',
|
|
34
|
+
font: {
|
|
35
|
+
size: 14
|
|
36
|
+
}
|
|
37
|
+
}
|
|
38
|
+
},
|
|
39
|
+
y: {
|
|
40
|
+
type: 'linear',
|
|
41
|
+
ticks: {
|
|
42
|
+
color: 'white',
|
|
43
|
+
font: {
|
|
44
|
+
size: 14
|
|
45
|
+
}
|
|
46
|
+
}
|
|
26
47
|
},
|
|
27
48
|
xAxes: [{
|
|
28
49
|
scaleLabel: {
|
|
29
50
|
display: true,
|
|
30
|
-
labelString: 'True wind angle (TWA)'
|
|
51
|
+
labelString: 'True wind angle (TWA)',
|
|
52
|
+
fontColor: 'white',
|
|
53
|
+
fontSize: 16
|
|
54
|
+
},
|
|
55
|
+
ticks: {
|
|
56
|
+
display: true,
|
|
57
|
+
fontColor: 'white',
|
|
58
|
+
fontSize: 16,
|
|
59
|
+
},
|
|
60
|
+
gridLines: {
|
|
61
|
+
color: 'rgba(180,180,180,0.7)',
|
|
62
|
+
lineWidth: 1
|
|
31
63
|
}
|
|
32
64
|
}],
|
|
33
65
|
yAxes: [{
|
|
34
66
|
scaleLabel: {
|
|
35
67
|
display: true,
|
|
36
|
-
labelString: 'Target boat speed (POL SPD)'
|
|
68
|
+
labelString: 'Target boat speed (POL SPD)',
|
|
69
|
+
fontColor: 'white',
|
|
70
|
+
fontSize: 14
|
|
71
|
+
},
|
|
72
|
+
ticks: {
|
|
73
|
+
display: true,
|
|
74
|
+
fontColor: 'white',
|
|
75
|
+
fontSize: 14,
|
|
76
|
+
},
|
|
77
|
+
gridLines: {
|
|
78
|
+
color: 'rgba(180,180,180,0.7)',
|
|
79
|
+
lineWidth: 1
|
|
37
80
|
}
|
|
38
81
|
}],
|
|
39
82
|
},
|
|
@@ -47,15 +90,19 @@ function showChart (data) {
|
|
|
47
90
|
return label
|
|
48
91
|
}
|
|
49
92
|
},
|
|
50
|
-
backgroundColor: '#
|
|
51
|
-
titleFontSize:
|
|
93
|
+
backgroundColor: '#666',
|
|
94
|
+
titleFontSize: 18,
|
|
52
95
|
titleFontColor: '#0066ff',
|
|
53
|
-
bodyFontColor: '#
|
|
54
|
-
bodyFontSize:
|
|
96
|
+
bodyFontColor: '#ddd',
|
|
97
|
+
bodyFontSize: 18,
|
|
55
98
|
displayColors: false
|
|
56
99
|
}
|
|
57
100
|
}
|
|
58
101
|
})
|
|
102
|
+
|
|
103
|
+
var ctx = document.getElementById("myChart")
|
|
104
|
+
ctx.style.backgroundColor = 'rgba(0,0,0,0.8)'
|
|
105
|
+
ctx.style.fontColor = 'white'
|
|
59
106
|
}
|
|
60
107
|
</script>
|
|
61
108
|
|