shap-svg 0.2.3 → 0.2.4
This diff represents the content of publicly available package versions that have been released to one of the supported registries. The information contained in this diff is provided for informational purposes only and reflects changes between package versions as they appear in their respective public registries.
- package/README.md +29 -2
- package/package.json +1 -1
package/README.md
CHANGED
|
@@ -1,12 +1,39 @@
|
|
|
1
1
|
# shap-svg
|
|
2
2
|
|
|
3
|
-
|
|
4
|
-
|
|
3
|
+
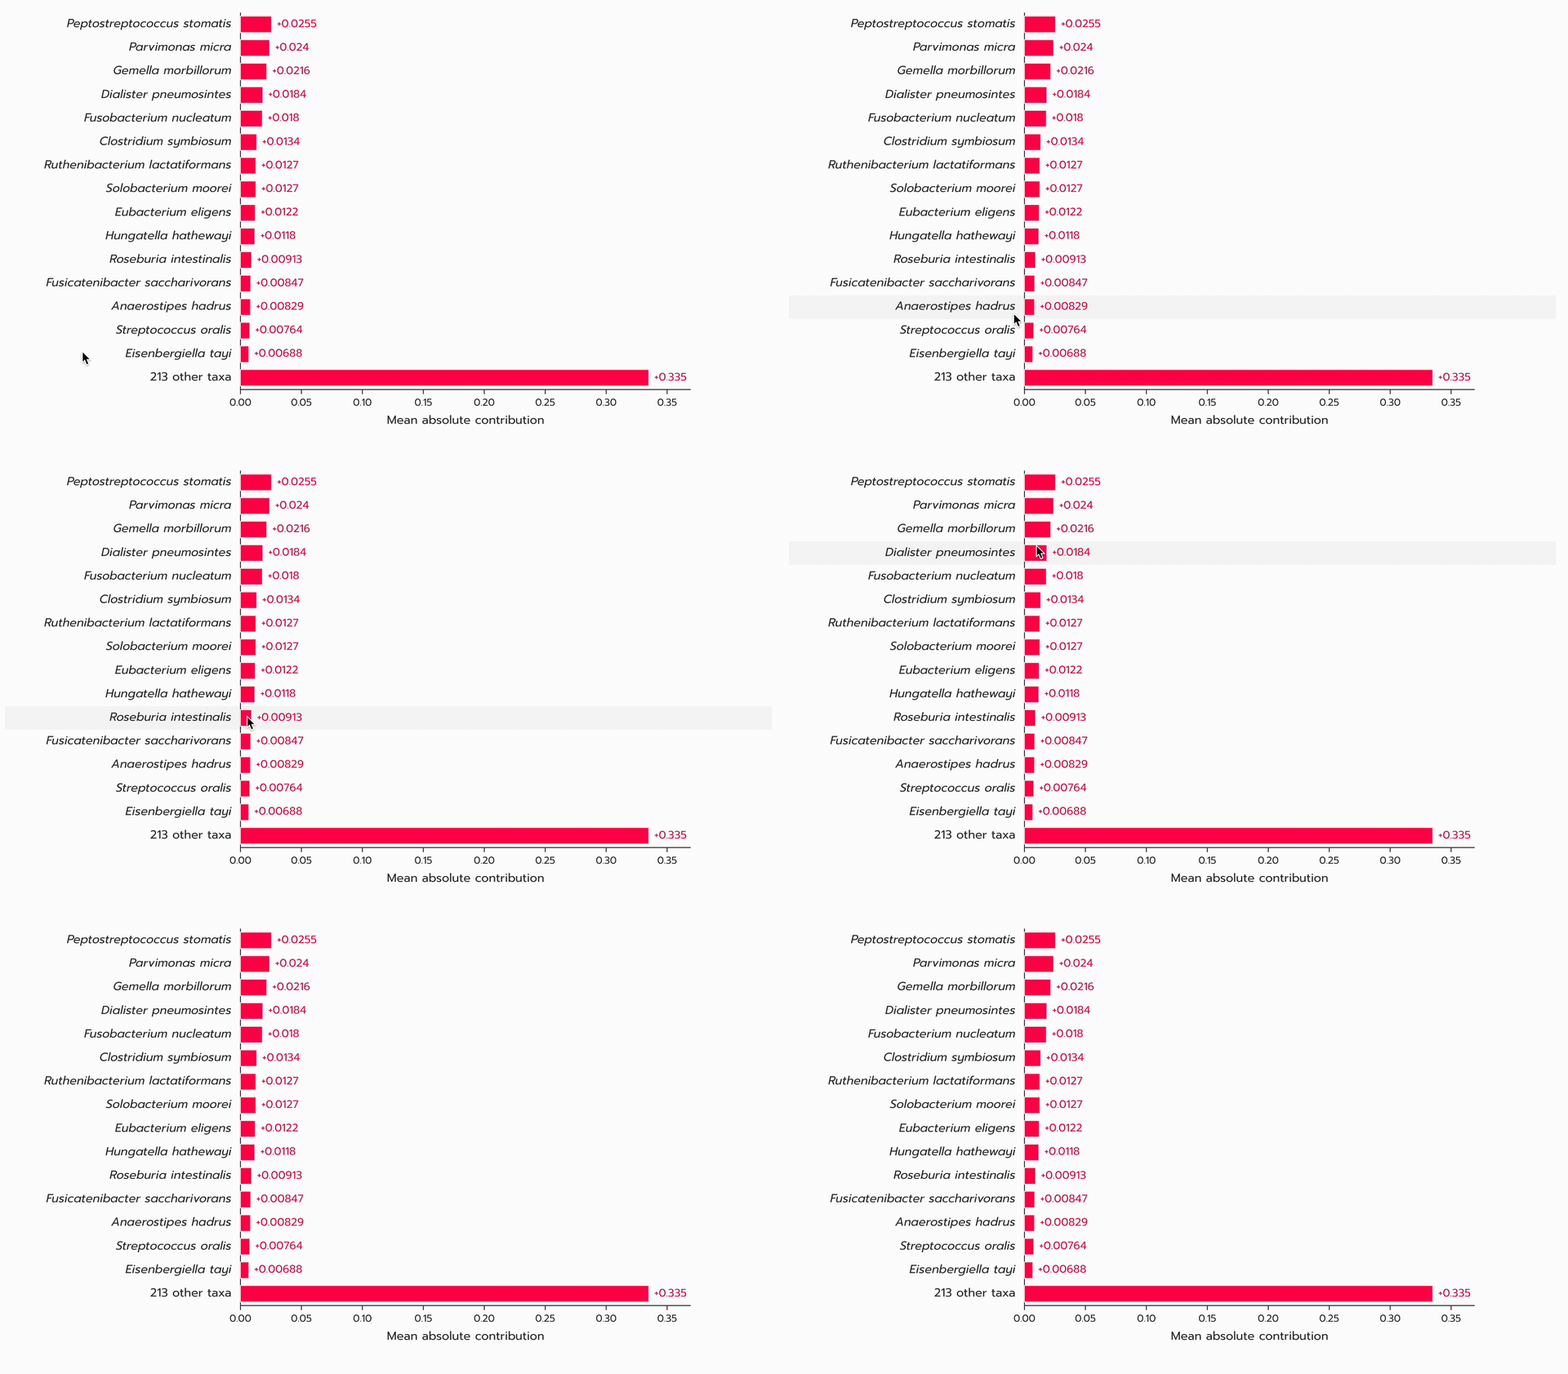
`shap-svg` is a browser rendering layer for the [`shap.plots`](https://shap.readthedocs.io/en/latest/api.html#plots)
|
|
4
|
+
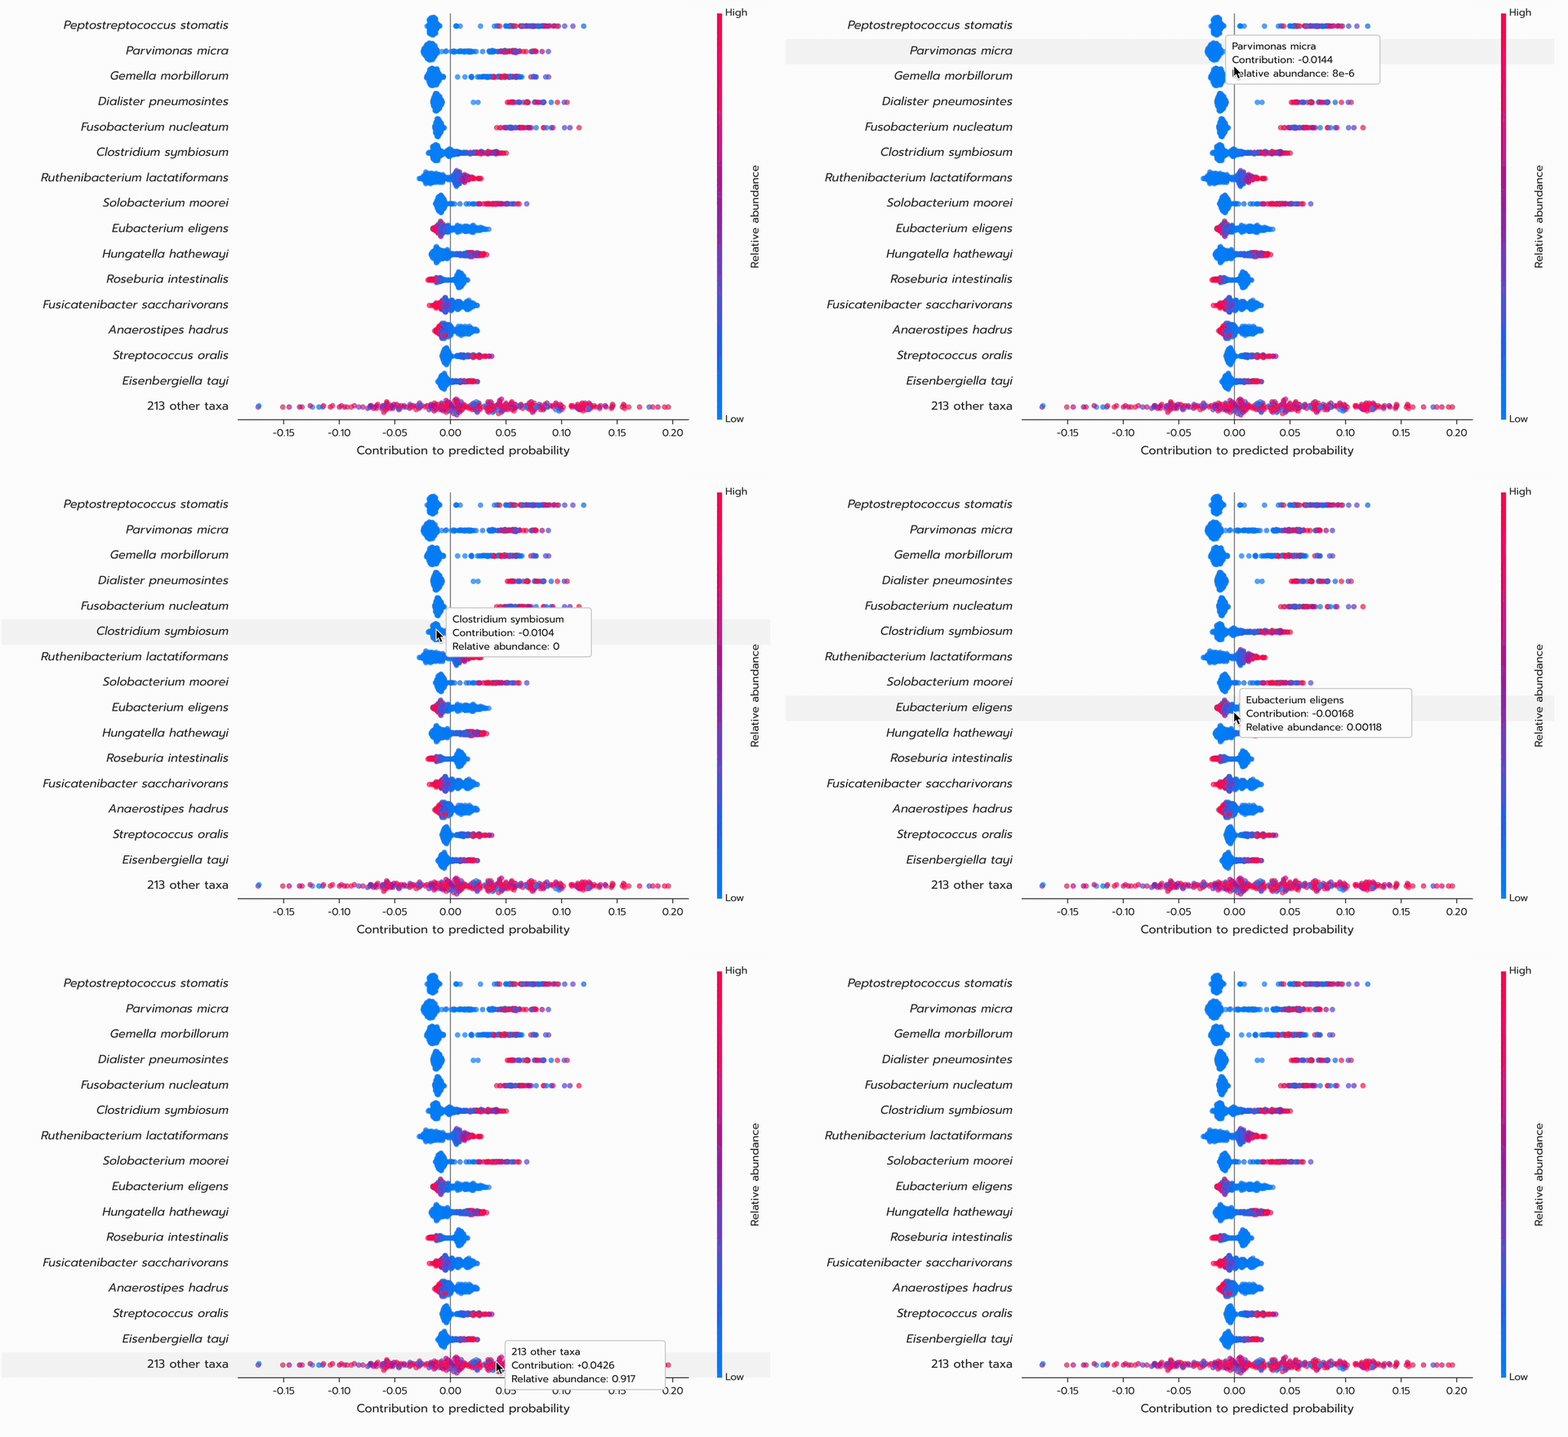
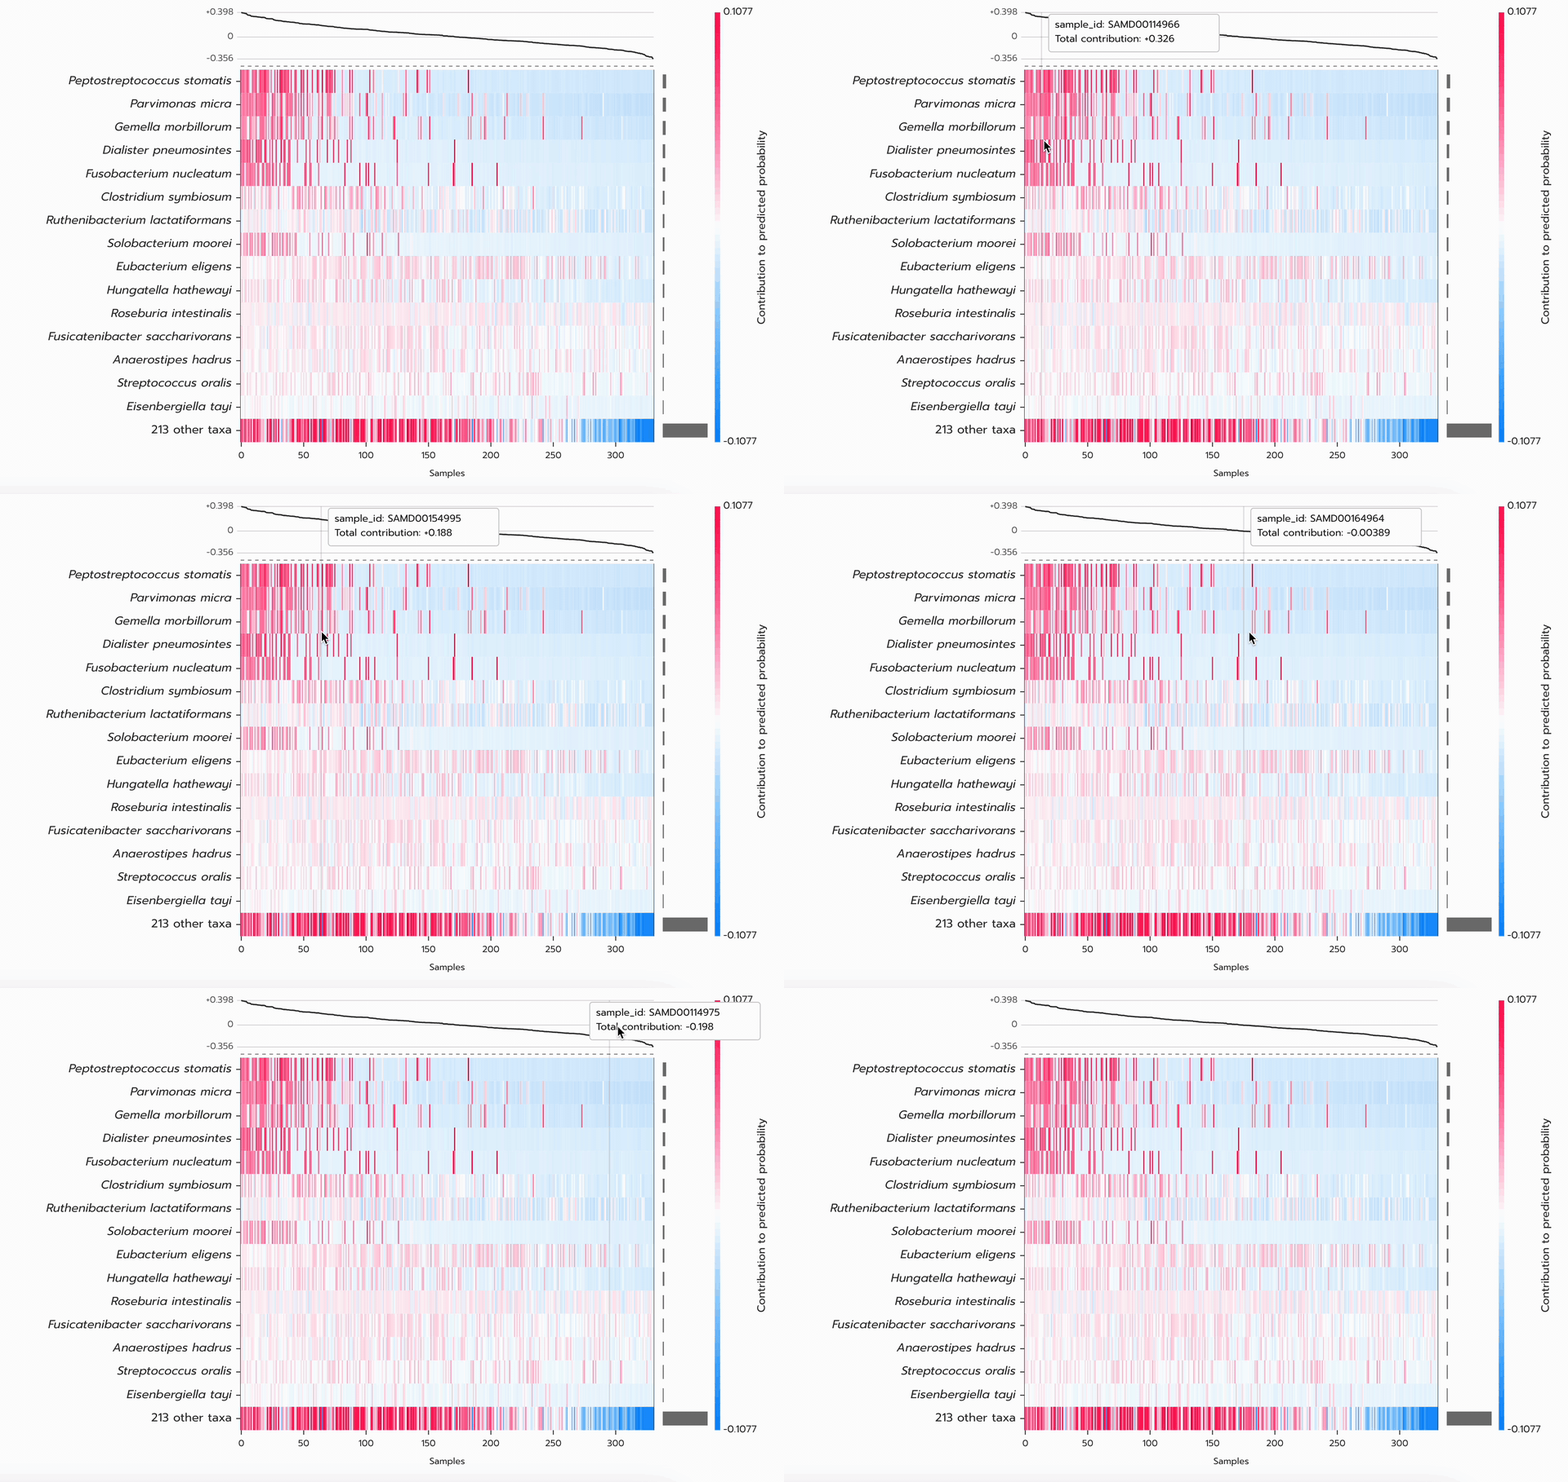
API. It reimplements `shap.plots.bar`, `shap.plots.beeswarm`, `shap.plots.heatmap` and
|
|
5
|
+
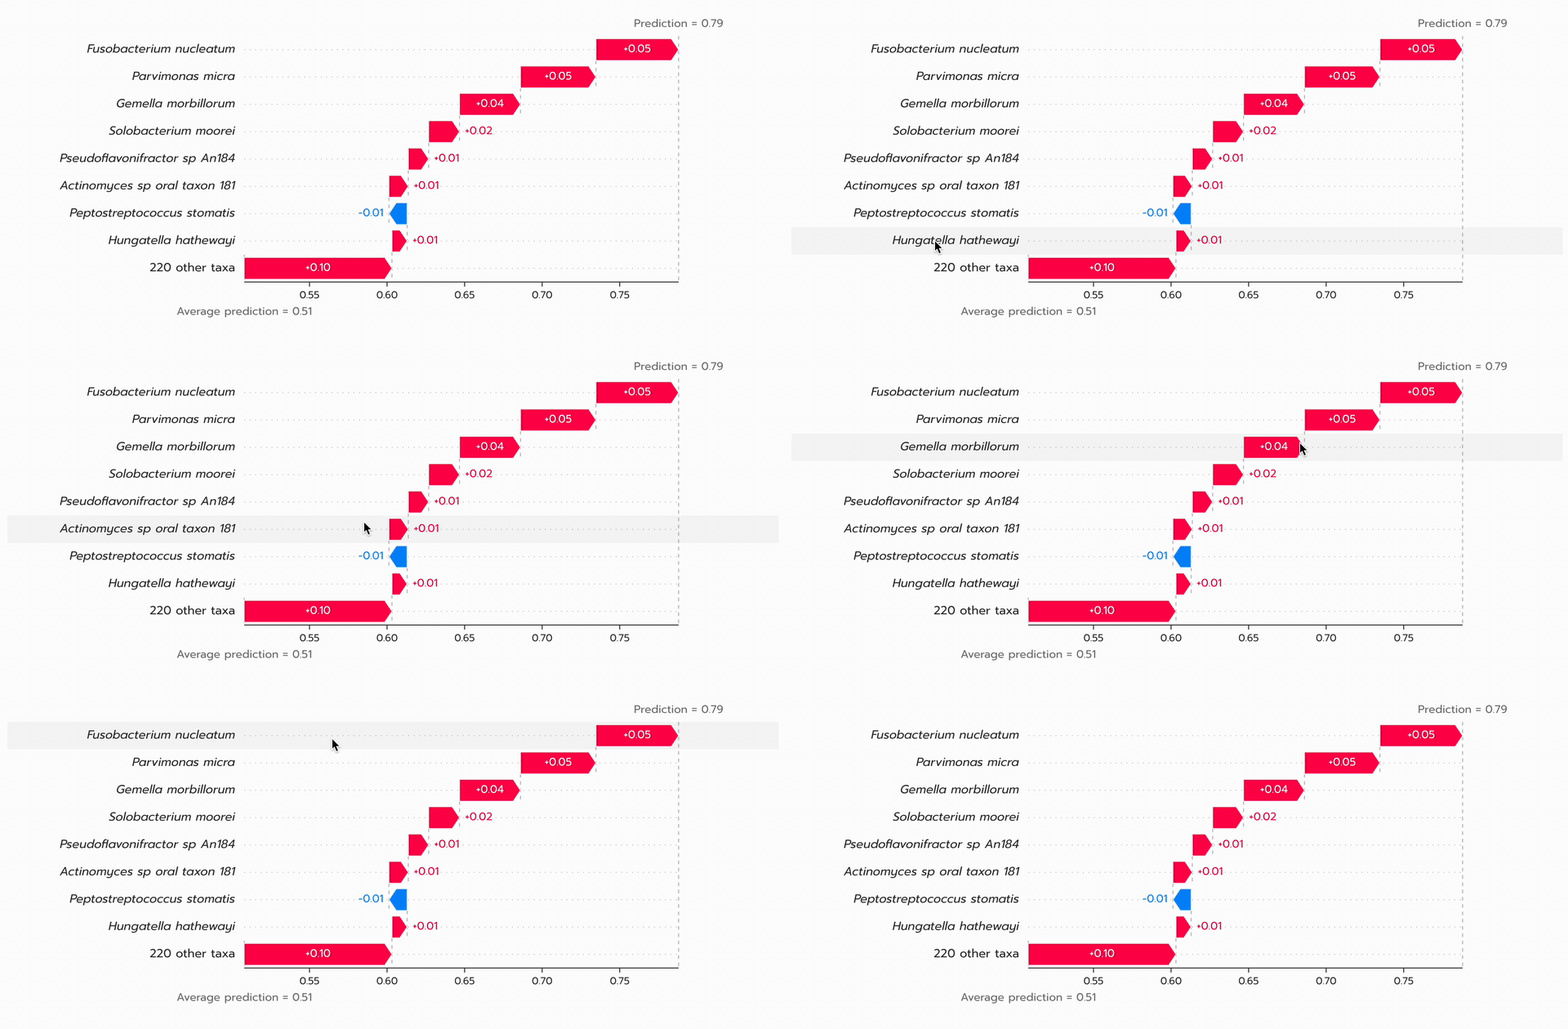
`shap.plots.waterfall` as interactive SVG charts, exposed as React components through `shap-svg/react`,
|
|
6
|
+
so web applications can present SHAP explanations without server-side matplotlib rendering.
|
|
7
|
+
|
|
8
|
+
It is a rendering library only. SHAP values must still be computed with the
|
|
9
|
+
[`shap`](https://github.com/shap/shap) Python package and delivered to the client as JSON.
|
|
5
10
|
|
|
6
11
|
```bash
|
|
7
12
|
npm install shap-svg
|
|
8
13
|
```
|
|
9
14
|
|
|
15
|
+
## In action
|
|
16
|
+
|
|
17
|
+
Recorded in the
|
|
18
|
+
[Explainable AI Microbiome Platform](https://github.com/princepongsakorn/explainable-ai-microbiome-platform),
|
|
19
|
+
which draws its SHAP charts with `shap-svg`.
|
|
20
|
+
|
|
21
|
+
### `Plots.bar`
|
|
22
|
+
|
|
23
|
+
|
|
24
|
+
|
|
25
|
+
### `Plots.beeswarm`
|
|
26
|
+
|
|
27
|
+
|
|
28
|
+
|
|
29
|
+
### `Plots.heatmap`
|
|
30
|
+
|
|
31
|
+
|
|
32
|
+
|
|
33
|
+
### `Plots.waterfall`
|
|
34
|
+
|
|
35
|
+
|
|
36
|
+
|
|
10
37
|
## Why this exists, and why the name
|
|
11
38
|
|
|
12
39
|
SHAP draws its plots with matplotlib, on the machine that computed the values. A web application
|
package/package.json
CHANGED
|
@@ -1,6 +1,6 @@
|
|
|
1
1
|
{
|
|
2
2
|
"name": "shap-svg",
|
|
3
|
-
"version": "0.2.
|
|
3
|
+
"version": "0.2.4",
|
|
4
4
|
"description": "Interactive SVG charts for SHAP explanations — bar, beeswarm, heatmap and waterfall — drawn in the browser from SHAP values, with a framework-free core and React components.",
|
|
5
5
|
"license": "MIT",
|
|
6
6
|
"author": "Pongsakorn P.",
|