sferic-charts 0.0.0-stage → 0.2.0
This diff represents the content of publicly available package versions that have been released to one of the supported registries. The information contained in this diff is provided for informational purposes only and reflects changes between package versions as they appear in their respective public registries.
- package/LICENSE +21 -0
- package/README.md +196 -2
- package/dist/sferic.js +16116 -0
- package/dist/sferic.js.map +1 -0
- package/dist/sferic.umd.cjs +1149 -0
- package/dist/sferic.umd.cjs.map +1 -0
- package/dist/types/bar/BarChart.d.cts +249 -0
- package/dist/types/bar/BarChart.d.ts +249 -0
- package/dist/types/bar/index.d.cts +1 -0
- package/dist/types/bar/index.d.ts +1 -0
- package/dist/types/chart3d/Axis3D.d.cts +97 -0
- package/dist/types/chart3d/Axis3D.d.ts +97 -0
- package/dist/types/chart3d/Chart3D.d.cts +154 -0
- package/dist/types/chart3d/Chart3D.d.ts +154 -0
- package/dist/types/chart3d/gl3d.d.cts +78 -0
- package/dist/types/chart3d/gl3d.d.ts +78 -0
- package/dist/types/chart3d/index.d.cts +13 -0
- package/dist/types/chart3d/index.d.ts +13 -0
- package/dist/types/chart3d/math3d.d.cts +15 -0
- package/dist/types/chart3d/math3d.d.ts +15 -0
- package/dist/types/chart3d/mesh3d.d.cts +127 -0
- package/dist/types/chart3d/mesh3d.d.ts +127 -0
- package/dist/types/chart3d/series3d.d.cts +168 -0
- package/dist/types/chart3d/series3d.d.ts +168 -0
- package/dist/types/chart3d/shaders3d.d.cts +17 -0
- package/dist/types/chart3d/shaders3d.d.ts +17 -0
- package/dist/types/chart3d/store3d.d.cts +81 -0
- package/dist/types/chart3d/store3d.d.ts +81 -0
- package/dist/types/chart3d/styles3d.d.cts +81 -0
- package/dist/types/chart3d/styles3d.d.ts +81 -0
- package/dist/types/chart3d/surface3d.d.cts +159 -0
- package/dist/types/chart3d/surface3d.d.ts +159 -0
- package/dist/types/core/Legend.d.cts +90 -0
- package/dist/types/core/Legend.d.ts +90 -0
- package/dist/types/core/Panel.d.cts +197 -0
- package/dist/types/core/Panel.d.ts +197 -0
- package/dist/types/core/color.d.cts +38 -0
- package/dist/types/core/color.d.ts +38 -0
- package/dist/types/core/style.d.cts +184 -0
- package/dist/types/core/style.d.ts +184 -0
- package/dist/types/core/theme.d.cts +87 -0
- package/dist/types/core/theme.d.ts +87 -0
- package/dist/types/core/util.d.cts +52 -0
- package/dist/types/core/util.d.ts +52 -0
- package/dist/types/dashboard/Dashboard.d.cts +98 -0
- package/dist/types/dashboard/Dashboard.d.ts +98 -0
- package/dist/types/dashboard/UIPanel.d.cts +10 -0
- package/dist/types/dashboard/UIPanel.d.ts +10 -0
- package/dist/types/datagrid/DataGrid.d.cts +160 -0
- package/dist/types/datagrid/DataGrid.d.ts +160 -0
- package/dist/types/datagrid/index.d.cts +1 -0
- package/dist/types/datagrid/index.d.ts +1 -0
- package/dist/types/hierarchy/SunburstChart.d.cts +96 -0
- package/dist/types/hierarchy/SunburstChart.d.ts +96 -0
- package/dist/types/hierarchy/TreeMapChart.d.cts +113 -0
- package/dist/types/hierarchy/TreeMapChart.d.ts +113 -0
- package/dist/types/hierarchy/common.d.cts +116 -0
- package/dist/types/hierarchy/common.d.ts +116 -0
- package/dist/types/hierarchy/index.d.cts +4 -0
- package/dist/types/hierarchy/index.d.ts +4 -0
- package/dist/types/hierarchy/shaders.d.cts +9 -0
- package/dist/types/hierarchy/shaders.d.ts +9 -0
- package/dist/types/index.d.cts +37 -0
- package/dist/types/index.d.ts +37 -0
- package/dist/types/lc.d.cts +49 -0
- package/dist/types/lc.d.ts +49 -0
- package/dist/types/map/MapChart.d.cts +172 -0
- package/dist/types/map/MapChart.d.ts +172 -0
- package/dist/types/map/index.d.cts +6 -0
- package/dist/types/map/index.d.ts +6 -0
- package/dist/types/map/iso.d.cts +2 -0
- package/dist/types/map/iso.d.ts +2 -0
- package/dist/types/map/projection.d.cts +12 -0
- package/dist/types/map/projection.d.ts +12 -0
- package/dist/types/map/topojson.d.cts +43 -0
- package/dist/types/map/topojson.d.ts +43 -0
- package/dist/types/map/triangulate.d.cts +5 -0
- package/dist/types/map/triangulate.d.ts +5 -0
- package/dist/types/parallel/ParallelCoordinateChart.d.cts +245 -0
- package/dist/types/parallel/ParallelCoordinateChart.d.ts +245 -0
- package/dist/types/parallel/index.d.cts +1 -0
- package/dist/types/parallel/index.d.ts +1 -0
- package/dist/types/pie/FunnelChart.d.cts +24 -0
- package/dist/types/pie/FunnelChart.d.ts +24 -0
- package/dist/types/pie/GaugeChart.d.cts +110 -0
- package/dist/types/pie/GaugeChart.d.ts +110 -0
- package/dist/types/pie/PieChart.d.cts +103 -0
- package/dist/types/pie/PieChart.d.ts +103 -0
- package/dist/types/pie/PyramidChart.d.cts +21 -0
- package/dist/types/pie/PyramidChart.d.ts +21 -0
- package/dist/types/pie/SlicedShapeChart.d.cts +108 -0
- package/dist/types/pie/SlicedShapeChart.d.ts +108 -0
- package/dist/types/pie/index.d.cts +6 -0
- package/dist/types/pie/index.d.ts +6 -0
- package/dist/types/pie/slices.d.cts +95 -0
- package/dist/types/pie/slices.d.ts +95 -0
- package/dist/types/polar/PolarChart.d.cts +166 -0
- package/dist/types/polar/PolarChart.d.ts +166 -0
- package/dist/types/polar/PolarSeries.d.cts +226 -0
- package/dist/types/polar/PolarSeries.d.ts +226 -0
- package/dist/types/polar/SpiderChart.d.cts +181 -0
- package/dist/types/polar/SpiderChart.d.ts +181 -0
- package/dist/types/polar/common.d.cts +33 -0
- package/dist/types/polar/common.d.ts +33 -0
- package/dist/types/polar/gl.d.cts +92 -0
- package/dist/types/polar/gl.d.ts +92 -0
- package/dist/types/polar/index.d.cts +4 -0
- package/dist/types/polar/index.d.ts +4 -0
- package/dist/types/render/GLRenderer.d.cts +181 -0
- package/dist/types/render/GLRenderer.d.ts +181 -0
- package/dist/types/render/Surface.d.cts +153 -0
- package/dist/types/render/Surface.d.ts +153 -0
- package/dist/types/render/draw.d.cts +125 -0
- package/dist/types/render/draw.d.ts +125 -0
- package/dist/types/render/shaders.d.cts +37 -0
- package/dist/types/render/shaders.d.ts +37 -0
- package/dist/types/xy/Axis.d.cts +233 -0
- package/dist/types/xy/Axis.d.ts +233 -0
- package/dist/types/xy/ChartXY.d.cts +224 -0
- package/dist/types/xy/ChartXY.d.ts +224 -0
- package/dist/types/xy/series/BoxSeries.d.cts +94 -0
- package/dist/types/xy/series/BoxSeries.d.ts +94 -0
- package/dist/types/xy/series/EllipseSeries.d.cts +61 -0
- package/dist/types/xy/series/EllipseSeries.d.ts +61 -0
- package/dist/types/xy/series/HeatmapSeries.d.cts +141 -0
- package/dist/types/xy/series/HeatmapSeries.d.ts +141 -0
- package/dist/types/xy/series/OHLCSeries.d.cts +122 -0
- package/dist/types/xy/series/OHLCSeries.d.ts +122 -0
- package/dist/types/xy/series/PointLineAreaSeries.d.cts +168 -0
- package/dist/types/xy/series/PointLineAreaSeries.d.ts +168 -0
- package/dist/types/xy/series/RectangleSeries.d.cts +192 -0
- package/dist/types/xy/series/RectangleSeries.d.ts +192 -0
- package/dist/types/xy/series/SegmentSeries.d.cts +66 -0
- package/dist/types/xy/series/SegmentSeries.d.ts +66 -0
- package/dist/types/xy/series/SeriesXY.d.cts +97 -0
- package/dist/types/xy/series/SeriesXY.d.ts +97 -0
- package/dist/types/xy/store.d.cts +185 -0
- package/dist/types/xy/store.d.ts +185 -0
- package/dist/types/xy/sync.d.cts +6 -0
- package/dist/types/xy/sync.d.ts +6 -0
- package/dist/types/xy/ticks.d.cts +122 -0
- package/dist/types/xy/ticks.d.ts +122 -0
- package/dist/types/xydata/gen3d.d.cts +24 -0
- package/dist/types/xydata/gen3d.d.ts +24 -0
- package/dist/types/xydata/index.d.cts +121 -0
- package/dist/types/xydata/index.d.ts +121 -0
- package/dist/types/zoomband/ZoomBandChart.d.cts +53 -0
- package/dist/types/zoomband/ZoomBandChart.d.ts +53 -0
- package/dist/types/zoomband/index.d.cts +1 -0
- package/dist/types/zoomband/index.d.ts +1 -0
- package/package.json +64 -4
package/LICENSE
ADDED
|
@@ -0,0 +1,21 @@
|
|
|
1
|
+
MIT License
|
|
2
|
+
|
|
3
|
+
Copyright (c) 2026 Murray Kopit
|
|
4
|
+
|
|
5
|
+
Permission is hereby granted, free of charge, to any person obtaining a copy
|
|
6
|
+
of this software and associated documentation files (the "Software"), to deal
|
|
7
|
+
in the Software without restriction, including without limitation the rights
|
|
8
|
+
to use, copy, modify, merge, publish, distribute, sublicense, and/or sell
|
|
9
|
+
copies of the Software, and to permit persons to whom the Software is
|
|
10
|
+
furnished to do so, subject to the following conditions:
|
|
11
|
+
|
|
12
|
+
The above copyright notice and this permission notice shall be included in all
|
|
13
|
+
copies or substantial portions of the Software.
|
|
14
|
+
|
|
15
|
+
THE SOFTWARE IS PROVIDED "AS IS", WITHOUT WARRANTY OF ANY KIND, EXPRESS OR
|
|
16
|
+
IMPLIED, INCLUDING BUT NOT LIMITED TO THE WARRANTIES OF MERCHANTABILITY,
|
|
17
|
+
FITNESS FOR A PARTICULAR PURPOSE AND NONINFRINGEMENT. IN NO EVENT SHALL THE
|
|
18
|
+
AUTHORS OR COPYRIGHT HOLDERS BE LIABLE FOR ANY CLAIM, DAMAGES OR OTHER
|
|
19
|
+
LIABILITY, WHETHER IN AN ACTION OF CONTRACT, TORT OR OTHERWISE, ARISING FROM,
|
|
20
|
+
OUT OF OR IN CONNECTION WITH THE SOFTWARE OR THE USE OR OTHER DEALINGS IN THE
|
|
21
|
+
SOFTWARE.
|
package/README.md
CHANGED
|
@@ -1,3 +1,197 @@
|
|
|
1
|
-
#
|
|
1
|
+
# Sferic Charts
|
|
2
2
|
|
|
3
|
-
|
|
3
|
+
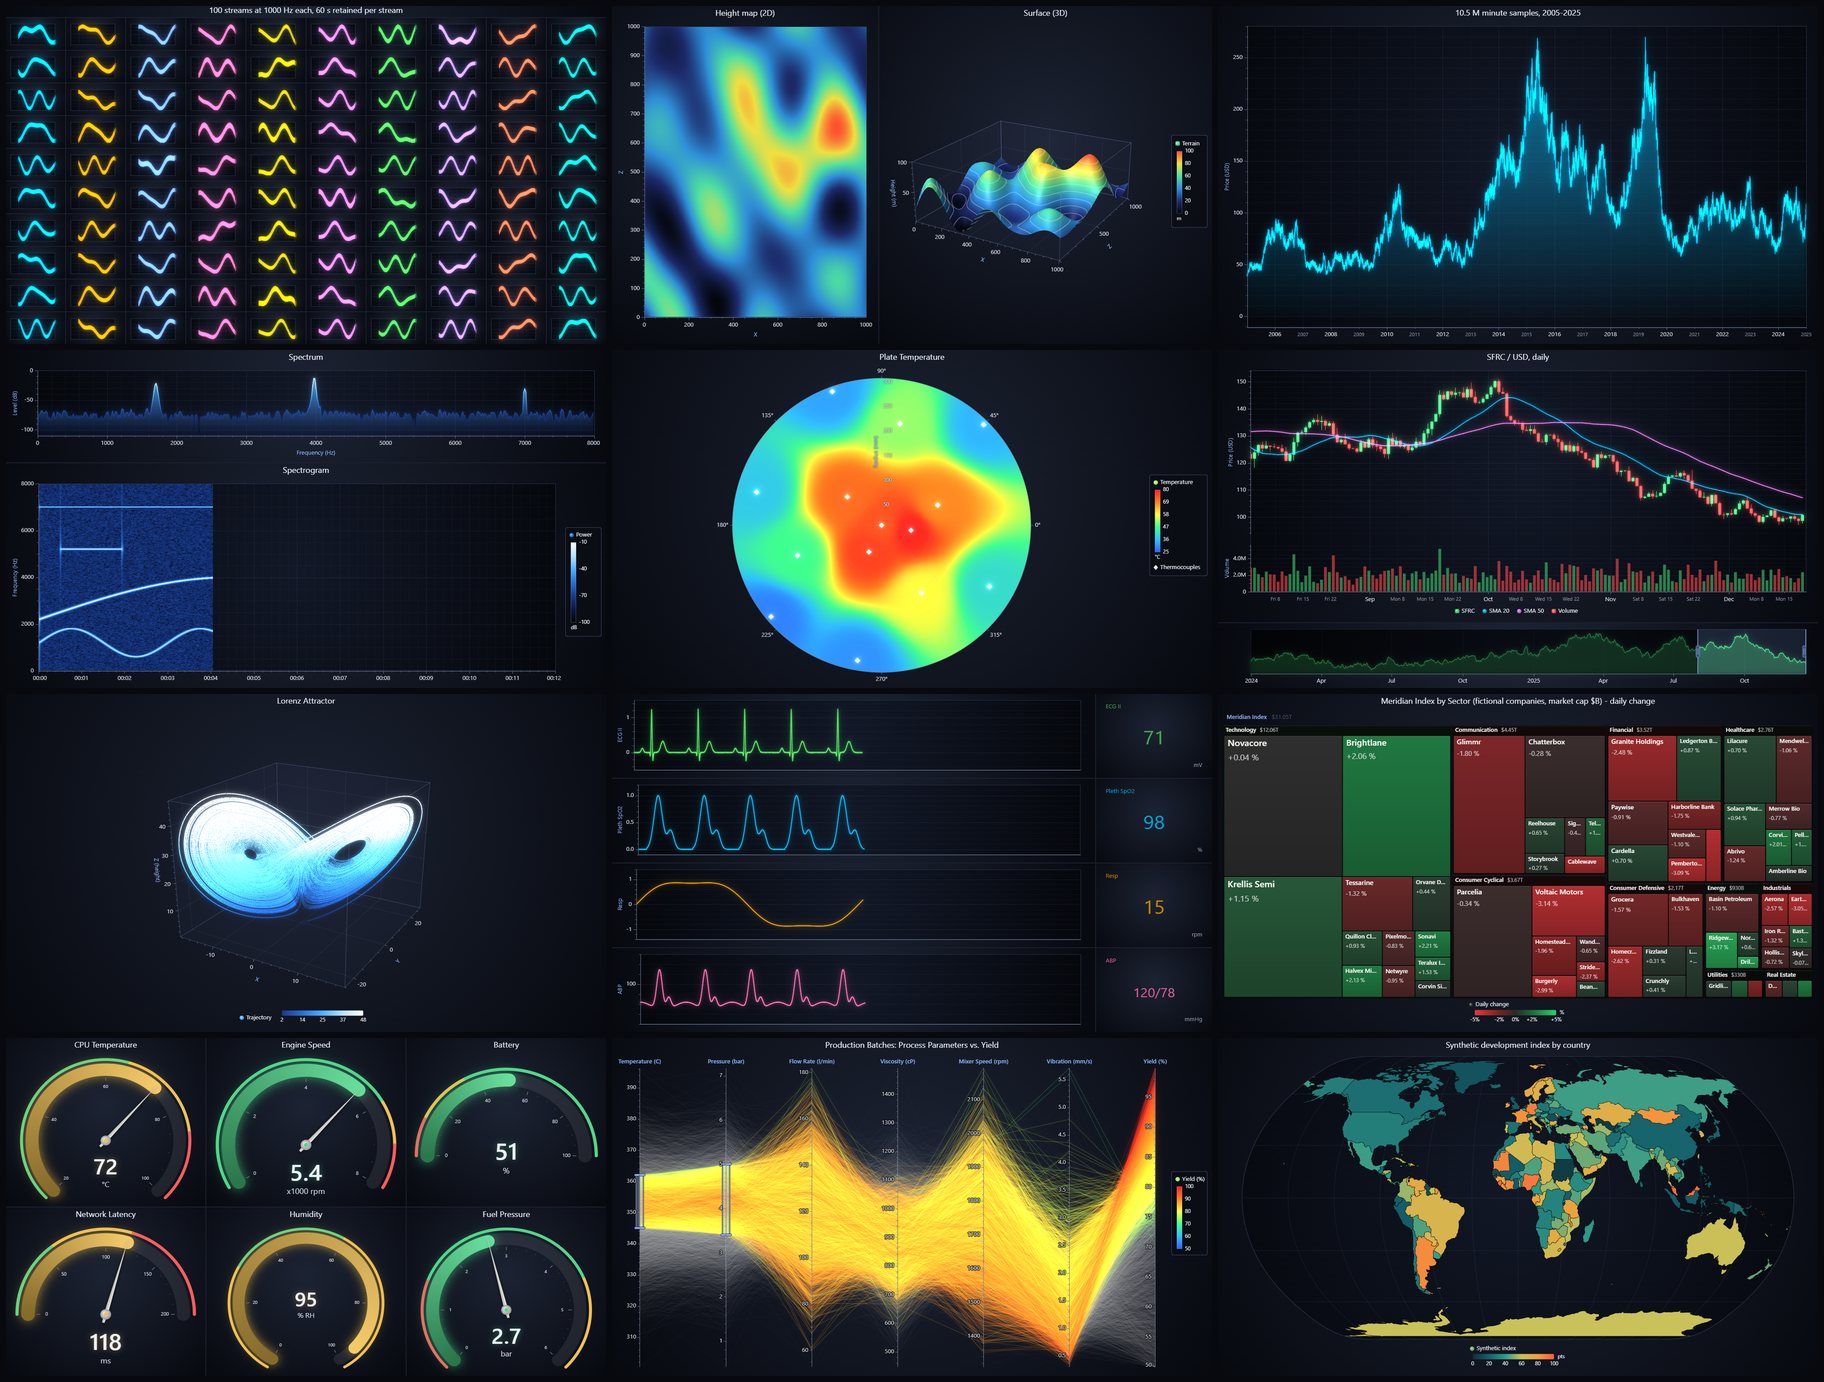
GPU-accelerated charting for the browser. Sferic renders millions of data points
|
|
4
|
+
at interactive frame rates with WebGL2, ships with a dark, glowing default theme,
|
|
5
|
+
and uses a fluent builder API. Zero runtime dependencies.
|
|
6
|
+
|
|
7
|
+
|
|
8
|
+
|
|
9
|
+
> A *sferic* is the broadband radio impulse emitted by a lightning stroke.
|
|
10
|
+
|
|
11
|
+
## Highlights
|
|
12
|
+
|
|
13
|
+
- **Large data:** 10M+ point line charts stay interactive through a per-chunk min/max
|
|
14
|
+
level-of-detail pyramid; 1M-point scatter plots with per-point colors pan smoothly.
|
|
15
|
+
- **Real-time:** scrolling, sweeping and multi-channel streaming; a 100-chart live
|
|
16
|
+
dashboard renders in about 9 ms per frame on an integrated GPU.
|
|
17
|
+
- **Precision:** data is stored per chunk relative to a float64 origin, so epoch
|
|
18
|
+
timestamps zoom down to microseconds without jitter.
|
|
19
|
+
- **Unlimited charts per page:** all charts share one WebGL context and draw into
|
|
20
|
+
their own canvases, avoiding the browser's limit of about 16 WebGL contexts.
|
|
21
|
+
- **Looks good by default:** five themes (`storm`, `daylight`, `aurora`, `lagoon`, `graphite`);
|
|
22
|
+
the default `storm` adds GPU bloom glow. Series palettes are validated for
|
|
23
|
+
color-vision-deficiency separation.
|
|
24
|
+
|
|
25
|
+
## Chart types
|
|
26
|
+
|
|
27
|
+
| Family | What you get |
|
|
28
|
+
|---|---|
|
|
29
|
+
| `ChartXY` | Line, point, point-line, area, area range, step, spline, heatmap grid, scrolling heatmap, box and whiskers, OHLC / candlestick, rectangles, segments, ellipses |
|
|
30
|
+
| Axes | Numeric, logarithmic, DateTime (years to microseconds), elapsed Time; stacked and opposite axes; scroll strategies; bands, constant lines, custom ticks |
|
|
31
|
+
| `Dashboard` | Grid of any charts on one canvas, draggable splitters, synchronized axes and cursors |
|
|
32
|
+
| `Chart3D` | Point, line, surface grid, scrolling surface, mesh model, box series; orbit camera |
|
|
33
|
+
| `Polar`, `Spider` | Polar line, point, area, polygon and heatmap series; radar charts |
|
|
34
|
+
| `Pie`, `Gauge`, `Funnel`, `Pyramid` | Pie and donut, animated gauges, funnel and pyramid |
|
|
35
|
+
| `BarChart` | Vertical, horizontal, grouped, stacked, animated (racing) bars |
|
|
36
|
+
| `ZoomBandChart`, `ParallelCoordinateChart` | Overview range selector; brushing and LUT-colored parallel coordinates |
|
|
37
|
+
| `TreeMapChart`, `SunburstChart` | Hierarchies with drill-down |
|
|
38
|
+
| `DataGrid`, `Map` | Canvas data grid with sparklines and change flashes; world map from TopoJSON or GeoJSON |
|
|
39
|
+
|
|
40
|
+
## Quick start
|
|
41
|
+
|
|
42
|
+
```bash
|
|
43
|
+
npm install sferic-charts
|
|
44
|
+
```
|
|
45
|
+
|
|
46
|
+
The package ships an ES module, a UMD/CommonJS build and TypeScript declarations for
|
|
47
|
+
both.
|
|
48
|
+
|
|
49
|
+
```ts
|
|
50
|
+
import { sferic, AxisTickStrategies, Themes } from 'sferic-charts'
|
|
51
|
+
|
|
52
|
+
const chart = sferic()
|
|
53
|
+
.ChartXY({ container: 'chart', theme: Themes.storm })
|
|
54
|
+
.setTitle('Day-ahead Power Price')
|
|
55
|
+
|
|
56
|
+
chart.axisX.setTickStrategy(AxisTickStrategies.DateTime)
|
|
57
|
+
chart.axisY.setTitle('Price').setUnits('EUR/MWh')
|
|
58
|
+
|
|
59
|
+
chart
|
|
60
|
+
.addLineSeries()
|
|
61
|
+
.setName('Day-ahead')
|
|
62
|
+
.appendJSON([
|
|
63
|
+
{ x: new Date(2025, 2, 3, 0).getTime(), y: 61.4 },
|
|
64
|
+
{ x: new Date(2025, 2, 3, 1).getTime(), y: 58.9 },
|
|
65
|
+
])
|
|
66
|
+
```
|
|
67
|
+
|
|
68
|
+
`container` takes an element or an element id; without one the chart fills the window.
|
|
69
|
+
Sferic requires WebGL2 (all current desktop and mobile browsers).
|
|
70
|
+
|
|
71
|
+
### Real-time streaming
|
|
72
|
+
|
|
73
|
+
```ts
|
|
74
|
+
import { sferic, AxisTickStrategies, AxisScrollStrategies } from 'sferic-charts'
|
|
75
|
+
|
|
76
|
+
const chart = sferic().ChartXY({ container: 'chart' })
|
|
77
|
+
chart.axisX
|
|
78
|
+
.setTickStrategy(AxisTickStrategies.Time)
|
|
79
|
+
.setScrollStrategy(AxisScrollStrategies.scrolling)
|
|
80
|
+
.setDefaultInterval((s) => ({ end: s.dataMax ?? 0, start: (s.dataMax ?? 0) - 10_000, stopAxisAfter: false }))
|
|
81
|
+
|
|
82
|
+
const series = chart.addLineSeries().setMaxSampleCount(100_000)
|
|
83
|
+
let t = 0
|
|
84
|
+
setInterval(() => {
|
|
85
|
+
const ys = Float32Array.from({ length: 50 }, () => Math.random())
|
|
86
|
+
series.appendSamples({ start: t, step: 1, yValues: ys })
|
|
87
|
+
t += 50
|
|
88
|
+
}, 50)
|
|
89
|
+
```
|
|
90
|
+
|
|
91
|
+
### Heatmap with a color palette
|
|
92
|
+
|
|
93
|
+
```ts
|
|
94
|
+
import { sferic, LUT, PalettedFill, regularColorSteps, Themes } from 'sferic-charts'
|
|
95
|
+
|
|
96
|
+
const theme = Themes.storm
|
|
97
|
+
const chart = sferic().ChartXY({ container: 'chart', theme })
|
|
98
|
+
const lut = new LUT({ steps: regularColorSteps(0, 100, theme.examples.intensityColorPalette), units: 'dB' })
|
|
99
|
+
chart
|
|
100
|
+
.addHeatmapGridSeries({ columns: 1000, rows: 1000, dataOrder: 'rows' })
|
|
101
|
+
.setFillStyle(new PalettedFill({ lut }))
|
|
102
|
+
.setIntensityInterpolation('bilinear')
|
|
103
|
+
.invalidateIntensityValues(matrix) // number[][], rows x columns
|
|
104
|
+
chart.legend.add(lut, { name: 'Level' })
|
|
105
|
+
```
|
|
106
|
+
|
|
107
|
+
### Dashboards
|
|
108
|
+
|
|
109
|
+
```ts
|
|
110
|
+
const dash = sferic().Dashboard({ container: 'app', numberOfColumns: 2, numberOfRows: 2 })
|
|
111
|
+
const a = dash.createChartXY({ columnIndex: 0, rowIndex: 0 })
|
|
112
|
+
const b = dash.createChartXY({ columnIndex: 1, rowIndex: 0 })
|
|
113
|
+
const g = dash.createGaugeChart({ columnIndex: 0, rowIndex: 1, columnSpan: 2 })
|
|
114
|
+
```
|
|
115
|
+
|
|
116
|
+
## Porting from LightningChart JS
|
|
117
|
+
|
|
118
|
+
Many Sferic builder methods share names with LightningChart JS (`ChartXY`,
|
|
119
|
+
`Dashboard`, `axisX`, `setTickStrategy`, `addLineSeries`, `appendSamples`,
|
|
120
|
+
`addHeatmapGridSeries`, `LUT`, `PalettedFill`, ...), so much existing code maps over
|
|
121
|
+
with small edits. Sferic does not export a function under that product's name; alias
|
|
122
|
+
the factory yourself if you want to keep your call sites:
|
|
123
|
+
|
|
124
|
+
```ts
|
|
125
|
+
import { sferic as lightningChart } from 'sferic-charts'
|
|
126
|
+
```
|
|
127
|
+
|
|
128
|
+
Theme names differ (use `Themes.storm` and friends), no license key is needed, and
|
|
129
|
+
less common APIs and visual details are not identical. The gallery examples are the
|
|
130
|
+
best reference for what is covered.
|
|
131
|
+
|
|
132
|
+
## How it works
|
|
133
|
+
|
|
134
|
+
- One process-wide WebGL2 context. Each standalone chart or dashboard owns a single
|
|
135
|
+
visible 2D canvas; per frame it draws backgrounds and grids (Canvas2D), renders all
|
|
136
|
+
GPU content into the shared context and copies it in, then draws axes, labels,
|
|
137
|
+
legends and cursors (Canvas2D).
|
|
138
|
+
- Lines are instanced capsules with signed-distance antialiasing in the fragment
|
|
139
|
+
shader; points are instanced quads with SDF shapes; heatmaps are float textures
|
|
140
|
+
colored through a LUT texture.
|
|
141
|
+
- Series data lives in chunks of up to 32K points, each relative to its own float64
|
|
142
|
+
origin. Chunk buffers are only ever re-specified whole (no partial updates of
|
|
143
|
+
buffers in flight, which stall ANGLE/D3D11); newly appended samples are drawn from
|
|
144
|
+
a small per-frame tail buffer until committed.
|
|
145
|
+
- Glow is a bloom post-process over multiple render targets. MSAA is enabled only for
|
|
146
|
+
charts that draw un-antialiased triangles (3D, filled polygons).
|
|
147
|
+
- Rendering is on demand: nothing is drawn unless data, layout, interaction or an
|
|
148
|
+
animation changed.
|
|
149
|
+
|
|
150
|
+
## Performance
|
|
151
|
+
|
|
152
|
+
Measured with `npm run bench` on an Intel Arc integrated GPU at 1920x1080 (headless
|
|
153
|
+
Chrome): the wall time of each rendered frame, CPU and GPU, synchronized with a
|
|
154
|
+
1-pixel readback (about 0.4 ms of each figure).
|
|
155
|
+
|
|
156
|
+
| Scenario | Median cost per frame |
|
|
157
|
+
|---|---|
|
|
158
|
+
| 10 channels x 1 kHz streaming | 3.2 ms |
|
|
159
|
+
| 1000x1000 heatmap, wheel zooming | 3.2 ms |
|
|
160
|
+
| Real-time FFT spectrogram | 3.7 ms |
|
|
161
|
+
| 10M-point line, wheel zooming | 4.3 ms |
|
|
162
|
+
| 100 live charts in one dashboard | 9.1 ms |
|
|
163
|
+
| 1M-point scatter, per-point colors, panning | 11.5 ms |
|
|
164
|
+
|
|
165
|
+
## Development
|
|
166
|
+
|
|
167
|
+
```bash
|
|
168
|
+
git clone https://github.com/murr2k/sferic-charts.git
|
|
169
|
+
cd sferic-charts
|
|
170
|
+
npm install
|
|
171
|
+
npm run dev # gallery at http://127.0.0.1:8779 (run.cmd on Windows)
|
|
172
|
+
npm run typecheck
|
|
173
|
+
npm run build:lib # library bundle and type declarations
|
|
174
|
+
npm run build # static gallery build
|
|
175
|
+
npm test # map decoder hostile-input tests
|
|
176
|
+
npm run snap # screenshot every example headlessly; fails on page or WebGL errors
|
|
177
|
+
npm run test:browser # context loss, no-WebGL, GPU memory and accessibility checks
|
|
178
|
+
npm run bench # GPU-synced cost per rendered frame
|
|
179
|
+
npm run verify:package # pack, install into a clean project, check imports and types
|
|
180
|
+
```
|
|
181
|
+
|
|
182
|
+
`prepublishOnly` runs typecheck, tests, the library build and `verify:package`, so a
|
|
183
|
+
broken or stale build cannot be published.
|
|
184
|
+
|
|
185
|
+
`snap` and `bench` drive your installed Chrome or Edge through puppeteer-core and need
|
|
186
|
+
the dev server running. Gallery examples live in `gallery/examples/`, one file each,
|
|
187
|
+
and are discovered automatically.
|
|
188
|
+
|
|
189
|
+
## License
|
|
190
|
+
|
|
191
|
+
MIT. See [LICENSE](https://github.com/murr2k/sferic-charts/blob/main/LICENSE).
|
|
192
|
+
|
|
193
|
+
## Trademarks
|
|
194
|
+
|
|
195
|
+
LightningChart is a trademark of LightningChart Ltd. Sferic Charts is an independent
|
|
196
|
+
open-source project and is not affiliated with, endorsed by, or sponsored by
|
|
197
|
+
LightningChart Ltd. References to LightningChart JS describe API familiarity only.
|