react-gridix 0.2.3 → 0.2.5
This diff represents the content of publicly available package versions that have been released to one of the supported registries. The information contained in this diff is provided for informational purposes only and reflects changes between package versions as they appear in their respective public registries.
- package/README.md +559 -46
- package/dist/client-40__X0_a.cjs +1 -0
- package/dist/client-DUlru6F3.js +51 -0
- package/dist/index.d.ts +331 -9
- package/dist/react-gridix.cjs +21 -2
- package/dist/react-gridix.js +1871 -1106
- package/dist/style.css +1 -1
- package/package.json +10 -3
package/README.md
CHANGED
|
@@ -1,6 +1,6 @@
|
|
|
1
1
|
# react-gridix Documentation
|
|
2
2
|
|
|
3
|
-
A React `DataGrid` with row selection, server-side mode, typed per-column filters, date columns, in-cell editing, resizing and pinning, virtualization, CSV
|
|
3
|
+
A React `DataGrid` with row selection, server-side mode, typed per-column filters, date columns, in-cell editing, resizing and pinning, virtualization, export to CSV / Excel / JSON / PDF, 12 row animations, filter comparisons and 8 themes, plus the `Checkbox` it uses.
|
|
4
4
|
|
|
5
5
|
**Contents**
|
|
6
6
|
|
|
@@ -12,7 +12,6 @@ A React `DataGrid` with row selection, server-side mode, typed per-column filter
|
|
|
12
12
|
6. [DataGrid](#6-datagrid)
|
|
13
13
|
7. [Demos](#7-demos)
|
|
14
14
|
8. [Troubleshooting](#9-troubleshooting)
|
|
15
|
-
9. [Migrating from the earlier version](#10-migrating-from-the-earlier-version)
|
|
16
15
|
|
|
17
16
|
---
|
|
18
17
|
|
|
@@ -44,6 +43,12 @@ A React `DataGrid` with row selection, server-side mode, typed per-column filter
|
|
|
44
43
|
|
|
45
44
|
Everything is written in TypeScript, ships its own type definitions, and uses plain CSS (no CSS-in-JS runtime). The grid is 100% of its container's width by default. There is deliberately **no column reordering**.
|
|
46
45
|
|
|
46
|
+
Demo Display
|
|
47
|
+
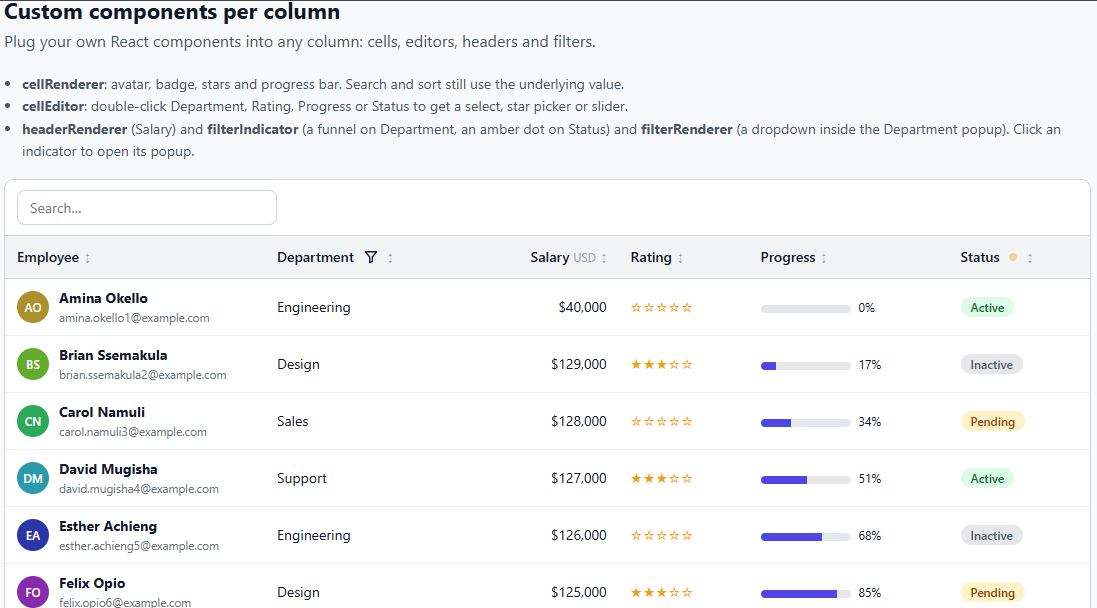
|
|
48
|
+
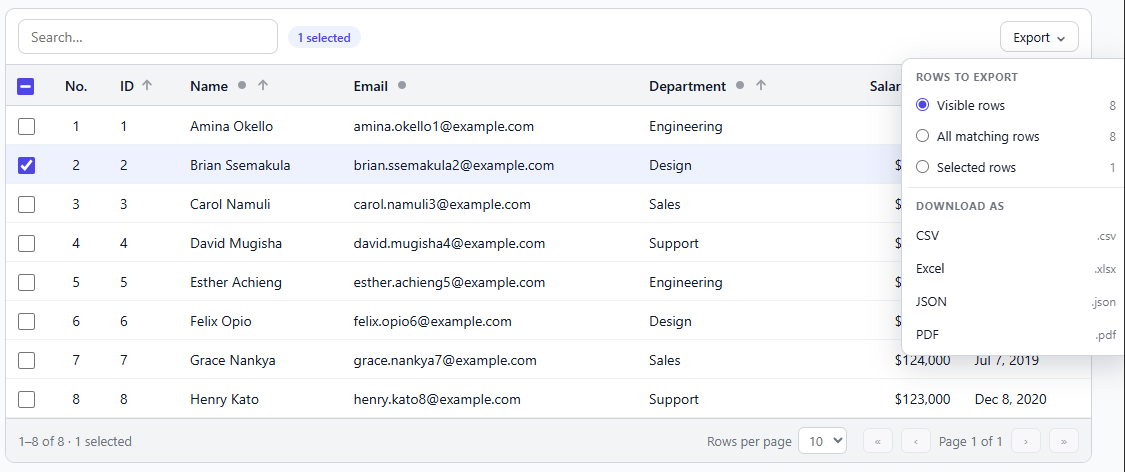
|
|
49
|
+
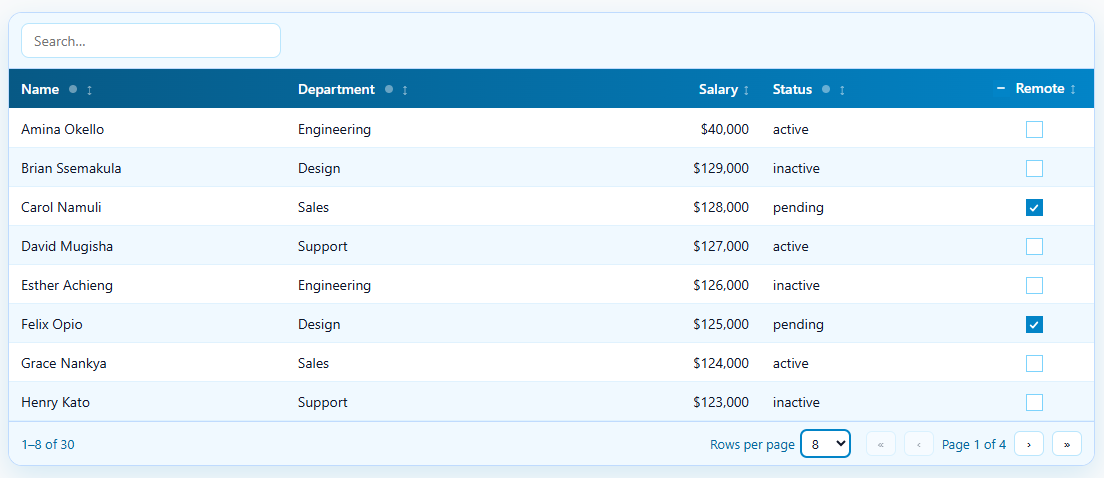
|
|
50
|
+
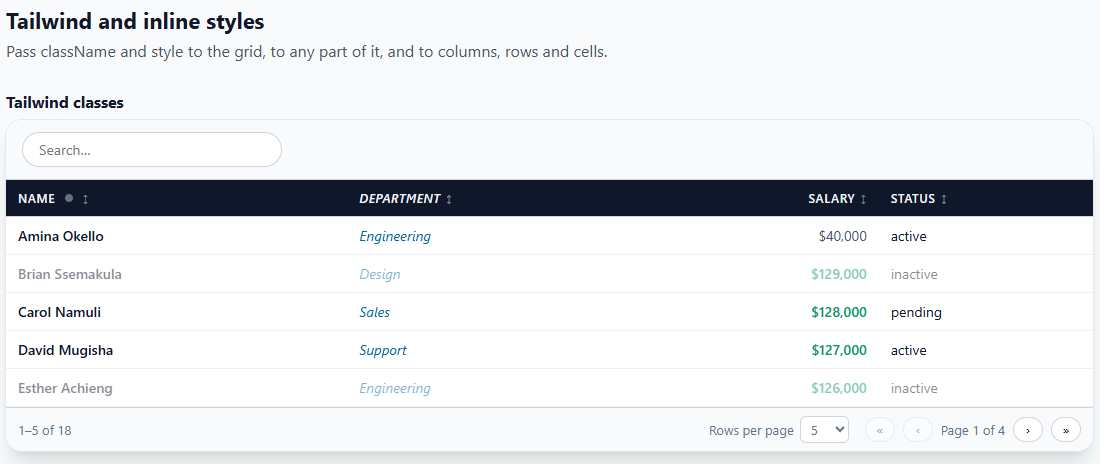
|
|
51
|
+
|
|
47
52
|
---
|
|
48
53
|
|
|
49
54
|
## 2. Installation
|
|
@@ -62,6 +67,68 @@ import "react-gridix/style.css";
|
|
|
62
67
|
|
|
63
68
|
The library does not inject CSS by itself. If the grid looks unstyled, this import is missing.
|
|
64
69
|
|
|
70
|
+
**Optional: PDF export.** CSV, Excel (`.xlsx`) and JSON export need nothing extra. PDF export uses three small libraries. The grid does **not** import them (so your app builds and runs without them); you install them and hand them over, ideally through a function that imports them only when someone exports a PDF:
|
|
71
|
+
|
|
72
|
+
```bash
|
|
73
|
+
npm install jspdf jspdf-autotable # the PDF itself and its table
|
|
74
|
+
npm install html2canvas # only if the PDF header / footer is a React element (it is drawn to a picture)
|
|
75
|
+
```
|
|
76
|
+
|
|
77
|
+
```tsx
|
|
78
|
+
<DataGrid
|
|
79
|
+
exportable={{
|
|
80
|
+
formats: ["csv", "pdf"],
|
|
81
|
+
pdf: {
|
|
82
|
+
libraries: async () => ({
|
|
83
|
+
jsPDF: (await import("jspdf")).jsPDF,
|
|
84
|
+
autoTable: (await import("jspdf-autotable")).default,
|
|
85
|
+
html2canvas: (await import("html2canvas")).default, // only for a header / footer element
|
|
86
|
+
}),
|
|
87
|
+
},
|
|
88
|
+
}}
|
|
89
|
+
/>
|
|
90
|
+
```
|
|
91
|
+
Read more about stying pdf here [stying pdf here](https://github.com/simonbengtsson/jsPDF-AutoTable). Use the style property in `autoTableOptions` for styling cells
|
|
92
|
+
|
|
93
|
+
Adding `Header` and `Footer` component
|
|
94
|
+
```tsx
|
|
95
|
+
import logo from "./logo.png";
|
|
96
|
+
|
|
97
|
+
<DataGrid
|
|
98
|
+
columns={columns}
|
|
99
|
+
rows={rows}
|
|
100
|
+
getRowId={(r) => r.id}
|
|
101
|
+
exportable={{
|
|
102
|
+
formats: ["pdf"],
|
|
103
|
+
pdf: {
|
|
104
|
+
libraries: async () => ({
|
|
105
|
+
jsPDF: (await import("jspdf")).jsPDF,
|
|
106
|
+
autoTable: (await import("jspdf-autotable")).default,
|
|
107
|
+
html2canvas: (await import("html2canvas")).default, // required for an element
|
|
108
|
+
}),
|
|
109
|
+
|
|
110
|
+
header: (
|
|
111
|
+
<div style={{ display: "flex", alignItems: "center", gap: 12, borderBottom: "3px solid #4f46e5", paddingBottom: 6 }}>
|
|
112
|
+
<img src={logo} alt="" width={40} height={40} style={{ borderRadius: 8 }} />
|
|
113
|
+
<div>
|
|
114
|
+
<div style={{ fontSize: 20, fontWeight: 700, color: "#312e81" }}>Acme Corporation</div>
|
|
115
|
+
<div style={{ fontSize: 12, color: "#6b7280" }}>People & Culture report</div>
|
|
116
|
+
</div>
|
|
117
|
+
</div>
|
|
118
|
+
),
|
|
119
|
+
|
|
120
|
+
footer: (
|
|
121
|
+
<div style={{ textAlign: "center", fontSize: 11, color: "#6b7280" }}>
|
|
122
|
+
Confidential. Do not share.
|
|
123
|
+
</div>
|
|
124
|
+
),
|
|
125
|
+
},
|
|
126
|
+
}}
|
|
127
|
+
/>
|
|
128
|
+
``
|
|
129
|
+
|
|
130
|
+
Without `libraries`, or if an import fails, a PDF export reports an error that says what to install (see `onExportError`) and everything else keeps working.
|
|
131
|
+
|
|
65
132
|
---
|
|
66
133
|
|
|
67
134
|
## 3. Quick start
|
|
@@ -427,7 +494,8 @@ The grid is generic: `DataGrid<T>` infers `T` from `rows`, and `ColumnDef<T>` ch
|
|
|
427
494
|
| `virtualize` | `boolean` | `false` | Render only the visible rows |
|
|
428
495
|
| `rowHeight` | `number` | `40` | Row height in px when virtualizing |
|
|
429
496
|
| `overscan` | `number` | `6` | Extra rows drawn above and below the window |
|
|
430
|
-
| `exportable` | `boolean \| ExportOptions` | `false` | Show an "Export CSV"
|
|
497
|
+
| `exportable` | `boolean \| ExportOptions` | `false` | Show an export button in the toolbar. `true` gives "Export CSV"; `{ formats: ["csv", "xlsx", "json", "pdf"] }` gives an "Export" menu. See [6.19](#619-export-and-the-api) |
|
|
498
|
+
| `onExportError` | `(error: Error, format: ExportFormat) => void` | | Called when an export fails (for example `jspdf` is not installed). Without it the error is logged to the console |
|
|
431
499
|
| `apiRef` | `MutableRefObject<DataGridApi<T> \| null>` | | Call `exportCsv()`, `getSelectedRows()` and more from outside |
|
|
432
500
|
|
|
433
501
|
**Look and feel**
|
|
@@ -438,10 +506,16 @@ The grid is generic: `DataGrid<T>` infers `T` from `rows`, and `ColumnDef<T>` ch
|
|
|
438
506
|
| `toolbar` | `ReactNode` | | Extra content on the right of the toolbar |
|
|
439
507
|
| `showToolbar` | `boolean` | `true` | Set `false` to remove the toolbar row completely (search box, Columns, Export, selected count and your `toolbar`), even when those features are on |
|
|
440
508
|
| `emptyMessage` | `ReactNode` | `"No rows to show"` | Shown when no rows match |
|
|
509
|
+
| `emptyComponent` | `ComponentType<EmptyStateProps<T>>` | | Your own component shown instead of `emptyMessage`. Receives `{ reason, search, filters, columns, clearAll }`. See [6.26](#626-custom-empty-state) |
|
|
510
|
+
| `sortIndicator` | `"default" \| "arrow" \| ComponentType<SortIndicatorProps<T>>` | `"default"` | The arrow in sortable headers. See [6.25](#625-sort-indicator) |
|
|
441
511
|
| `striped` | `boolean` | `false` | Alternate row shading |
|
|
442
512
|
| `stripeColors` | `[string, string]` | | Two colours for the alternating rows. Implies `striped`. See [striped rows](#striped-rows) |
|
|
443
|
-
| `animateRows` | `boolean` | `true` | Rows
|
|
444
|
-
| `
|
|
513
|
+
| `animateRows` | `boolean` | `true` | Rows animate in when they appear and out when they leave. See [row animation](#row-animation) |
|
|
514
|
+
| `rowAnimation` | `RowAnimationName \| { enter?, exit? }` | `"slide-up"` | Which of the 12 built-in animations to use (`"fade"`, `"zoom"`, `"flip-x"`, ...), for both directions or `{ enter, exit }` |
|
|
515
|
+
| `rowAnimationDuration` | `number` | `380` | Milliseconds an entrance takes (an exit takes 80% of it) |
|
|
516
|
+
| `rowAnimationStagger` | `number` | `28` | Milliseconds between rows that appear together. `0` starts them all at once |
|
|
517
|
+
| `rowExitAnimationClassName` | `string \| (row, rowIndex) => string` | | Your own CSS class for rows that leave, like `rowAnimationClassName` is for rows that arrive |
|
|
518
|
+
| `rowAnimationClassName` | `string \| (row, rowIndex) => string` | | Your own CSS class for the entrance animation. Replaces the built-in one. See [custom row animation](#custom-row-animation) |
|
|
445
519
|
| `checkboxVariant` | `"button" \| "tick" \| "native"` | `"native"` | Checkbox look for boolean columns and row selection. Columns can override it |
|
|
446
520
|
| `maxHeight` | `number \| string` | | Makes the body scroll, with a sticky header. Example: `400` or `"60vh"` |
|
|
447
521
|
| `className` | `string` | | Classes for the root element (Tailwind works). The grid is `width: 100%` of its container by default |
|
|
@@ -480,6 +554,9 @@ const columns: ColumnDef<Employee>[] = [
|
|
|
480
554
|
| `filterType` | `"text" \| "exact" \| "number" \| "date" \| "select"` | Which filter controls the popup shows. Default follows `type` |
|
|
481
555
|
| `filterOptions` | `(string \| FilterOption)[]` | Choices for a `"select"` filter. Without it they are built from the data |
|
|
482
556
|
| `filterPlaceholder` | `string` | Placeholder of the text filter box |
|
|
557
|
+
| `filterOperators` | `boolean \| TextFilterOperator[]` | Adds a drop-down to the text filter popup: contains, does not contain, equals, not equal, starts with, ... Off by default (the column then always means "contains"). See [6.24](#624-filter-comparisons) |
|
|
558
|
+
| `filterOperator` | `TextFilterOperator` | The comparison selected first when `filterOperators` is on. Default `"contains"` |
|
|
559
|
+
| `sortIndicator` | `"default" \| "arrow" \| Component` | Overrides the grid's `sortIndicator` for this column |
|
|
483
560
|
| `filterDebounce` | `number` | Milliseconds to wait after typing in **this** column's text / exact / number filter before it is applied. Overrides the grid's `filterDebounce` (default 300). `0` applies on every keystroke |
|
|
484
561
|
| `filterIndicator` | `ComponentType<FilterIndicatorProps<T>>` | Your own component drawn instead of the default dot |
|
|
485
562
|
| `filterIndicatorClassName` / `filterIndicatorStyle` | `string` / `CSSProperties` | Classes and inline styles for this column's indicator button |
|
|
@@ -1234,7 +1311,9 @@ Add `headerCheckbox: true` to a boolean column. The header label becomes a check
|
|
|
1234
1311
|
| `pageInfo` | The "Page 1 of 20" text |
|
|
1235
1312
|
| `pageSize` | The rows-per-page `<select>` |
|
|
1236
1313
|
| `pagination` | Wrapper around the page-size menu and buttons |
|
|
1237
|
-
| `toolButton` | Toolbar buttons (Columns, Export
|
|
1314
|
+
| `toolButton` | Toolbar buttons (Columns, Export, Retry) |
|
|
1315
|
+
| `exportMenu` | The "Export" button when several formats are offered (in addition to `toolButton`) |
|
|
1316
|
+
| `sortIndicator` | The wrapper of the arrow in a sortable header |
|
|
1238
1317
|
| `skeleton` | The shimmering bars of the loading skeleton |
|
|
1239
1318
|
| `pageButton` | Each first/previous/next/last button |
|
|
1240
1319
|
| `checkbox` | Root of each checkbox in a `type: "boolean"` column |
|
|
@@ -1304,28 +1383,59 @@ Rows alternate between the two colours, starting with the first. `stripeColors`
|
|
|
1304
1383
|
|
|
1305
1384
|
#### Row animation
|
|
1306
1385
|
|
|
1307
|
-
|
|
1386
|
+
Rows animate when they appear and when they leave. It is on by default (a slide up, and a slide up and fade out). The important part is that **rows are matched by their id (`getRowId`)**, so the grid never replays the animation on rows that stay:
|
|
1387
|
+
|
|
1388
|
+
- A **new row** adds itself to the list with the "in" animation, while every other row stays exactly where it is.
|
|
1389
|
+
- A **removed row** (deleted, or hidden by a search or filter) stays on screen for a moment, plays the "out" animation where it was, then goes. The rows around it do not move until it is gone.
|
|
1390
|
+
- Changing the **page** (or the page size) replaces the rows at once with the "in" animation: it would be odd to show the old page leaving.
|
|
1391
|
+
- Sorting moves rows without animating them.
|
|
1308
1392
|
|
|
1309
1393
|
```tsx
|
|
1310
|
-
<DataGrid animateRows={false} />
|
|
1394
|
+
<DataGrid animateRows={false} /> // turn it off
|
|
1395
|
+
<DataGrid rowAnimation="zoom" /> // zoom in, zoom out
|
|
1396
|
+
<DataGrid rowAnimation={{ enter: "slide-left", exit: "fade" }} /> // mix the two directions
|
|
1397
|
+
<DataGrid rowAnimation={{ enter: "bounce", exit: "none" }} /> // "none": rows just disappear
|
|
1398
|
+
<DataGrid rowAnimation="flip-x" rowAnimationDuration={600} rowAnimationStagger={60} />
|
|
1311
1399
|
```
|
|
1312
1400
|
|
|
1313
|
-
|
|
1401
|
+
The built-in animations (each has an "in" and an "out" version):
|
|
1402
|
+
|
|
1403
|
+
| Name | In | Out |
|
|
1404
|
+
| --- | --- | --- |
|
|
1405
|
+
| `"fade"` | fades in | fades out |
|
|
1406
|
+
| `"slide-up"` (default) | rises from below | floats up |
|
|
1407
|
+
| `"slide-down"` | drops from above | sinks down |
|
|
1408
|
+
| `"slide-left"` | slides in from the left | slides out to the left |
|
|
1409
|
+
| `"slide-right"` | slides in from the right | slides out to the right |
|
|
1410
|
+
| `"zoom"` | grows from small | shrinks away |
|
|
1411
|
+
| `"flip-x"` | flips up around its horizontal axis | flips away |
|
|
1412
|
+
| `"flip-y"` | swings in around its vertical axis | swings out |
|
|
1413
|
+
| `"rotate"` | turns and scales in | turns and scales out |
|
|
1414
|
+
| `"skew"` | slides in leaning over | slides out leaning over |
|
|
1415
|
+
| `"blur"` | comes into focus | blurs away |
|
|
1416
|
+
| `"bounce"` | drops in and bounces | hops and jumps out |
|
|
1417
|
+
| `"none"` | no animation | removed at once |
|
|
1418
|
+
|
|
1419
|
+
Use a row id that does not change: `getRowId={(row) => row.id}`. Without it the grid uses the row's position as its id, and removing a row from the middle makes every row after it look different, so the wrong row animates out.
|
|
1420
|
+
|
|
1421
|
+
Tuning: `rowAnimationDuration` (default 380 ms; exits take 80%), `rowAnimationStagger` (default 28 ms between rows that appear together, up to 24 rows). The same values exist as CSS variables on the grid: `--rg-row-duration`, `--rg-row-exit-duration` and `--rg-row-stagger`, so you can also set them in your own CSS. Visitors who ask their system for reduced motion get no animation, and rows leave at once. Animation is also off while `virtualize` is on.
|
|
1314
1422
|
|
|
1315
1423
|
#### Custom row animation
|
|
1316
1424
|
|
|
1317
|
-
Pass your own CSS class to replace the built-in
|
|
1425
|
+
Pass your own CSS class to replace the built-in animation: `rowAnimationClassName` for rows that arrive and `rowExitAnimationClassName` for rows that leave. The class should set `animation`; an exit class should end in the hidden state and keep it (`forwards`). Every row also gets the CSS variable `--rg-i` (its position among the rows that appear or leave together, 0 to 24), so a delay of `calc(var(--rg-i) * 40ms)` makes rows come one after another.
|
|
1318
1426
|
|
|
1319
1427
|
```css
|
|
1320
1428
|
@keyframes fade-left { from { opacity: 0; transform: translateX(-24px); } to { opacity: 1; transform: none; } }
|
|
1321
|
-
|
|
1429
|
+
@keyframes fade-right { to { opacity: 0; transform: translateX(24px); } }
|
|
1430
|
+
.row-fade-left { animation: fade-left 0.45s ease-out both; animation-delay: calc(var(--rg-i, 0) * 45ms); }
|
|
1431
|
+
.row-fade-right { animation: fade-right 0.3s ease-in forwards; }
|
|
1322
1432
|
```
|
|
1323
1433
|
|
|
1324
1434
|
```tsx
|
|
1325
|
-
<DataGrid rowAnimationClassName="row-fade-left" ... />
|
|
1435
|
+
<DataGrid rowAnimationClassName="row-fade-left" rowExitAnimationClassName="row-fade-right" ... />
|
|
1326
1436
|
```
|
|
1327
1437
|
|
|
1328
|
-
|
|
1438
|
+
Both can be functions of the row, for example to flash new rows:
|
|
1329
1439
|
|
|
1330
1440
|
```tsx
|
|
1331
1441
|
<DataGrid rowAnimationClassName={(row) => (row.isNew ? "row-flash" : "row-fade-left")} ... />
|
|
@@ -1333,9 +1443,10 @@ It can also be a function of the row, for example to animate new rows differentl
|
|
|
1333
1443
|
|
|
1334
1444
|
With Tailwind, define the keyframes in your config and use the utility, for example `rowAnimationClassName="animate-fade-in-left [animation-delay:calc(var(--rg-i)*40ms)]"`.
|
|
1335
1445
|
|
|
1336
|
-
-
|
|
1337
|
-
-
|
|
1338
|
-
-
|
|
1446
|
+
- A custom class replaces the built-in animation of its direction only: you can customise just the entrance and keep the built-in exit, or the reverse.
|
|
1447
|
+
- A leaving row is removed when its animation ends (or after 2.5 seconds if your class has none).
|
|
1448
|
+
- `animateRows={false}` turns every row animation off, custom or not.
|
|
1449
|
+
- Reduced motion: the built-in animations stop for people who ask for it. Your own class is yours to handle: wrap it in `@media (prefers-reduced-motion: no-preference) { ... }`.
|
|
1339
1450
|
|
|
1340
1451
|
#### What does `classNames={{ cell: "border border-teal-400 py-2" }}` do?
|
|
1341
1452
|
|
|
@@ -1507,7 +1618,7 @@ const [current, setCurrent] = useState<Person | null>(null);
|
|
|
1507
1618
|
{current && <PersonDetails person={current} />}
|
|
1508
1619
|
```
|
|
1509
1620
|
|
|
1510
|
-
**From outside the grid**, with `apiRef` (see [6.19](#619-
|
|
1621
|
+
**From outside the grid**, with `apiRef` (see [6.19](#619-export-and-the-api)):
|
|
1511
1622
|
|
|
1512
1623
|
```tsx
|
|
1513
1624
|
const api = useRef<DataGridApi<Person> | null>(null);
|
|
@@ -1704,7 +1815,7 @@ api.current?.refresh();
|
|
|
1704
1815
|
|
|
1705
1816
|
**Server mode and the other features.**
|
|
1706
1817
|
|
|
1707
|
-
- Selection, [CSV export of selected rows](#619-
|
|
1818
|
+
- Selection, [CSV export of selected rows](#619-export-and-the-api) and keyboard navigation work on the loaded page.
|
|
1708
1819
|
- With `scope: "filtered"` the CSV contains the rows currently loaded (the current page), because the grid does not have the rest.
|
|
1709
1820
|
- `defaultSort` is sent in the first query. `multiSort` lets users send several sort columns.
|
|
1710
1821
|
- `onQueryChange` is the only place the grid asks for data. Without `serverSide`, the grid never calls it.
|
|
@@ -1858,7 +1969,7 @@ With `virtualize`, moving past the visible window scrolls the target row into vi
|
|
|
1858
1969
|
|
|
1859
1970
|
Without `keyboardNavigation`, cells are reachable with Tab (editable cells) or the mouse, as before.
|
|
1860
1971
|
|
|
1861
|
-
### 6.19
|
|
1972
|
+
### 6.19 Export and the API
|
|
1862
1973
|
|
|
1863
1974
|
**The export button.** Switch on `exportable` for an "Export CSV" button in the toolbar. It downloads what the user sees: the visible columns, in order, for every row matching the search and filters (across all pages).
|
|
1864
1975
|
|
|
@@ -1869,12 +1980,299 @@ Without `keyboardNavigation`, cells are reachable with Tab (editable cells) or t
|
|
|
1869
1980
|
<DataGrid exportable={{ scope: "selected" }} rowSelection ... /> // only the selected rows
|
|
1870
1981
|
```
|
|
1871
1982
|
|
|
1983
|
+
**More formats: Excel, JSON and PDF.** List the formats you want and the button becomes an "Export" menu:
|
|
1984
|
+
|
|
1985
|
+
```tsx
|
|
1986
|
+
<DataGrid
|
|
1987
|
+
rowSelection
|
|
1988
|
+
pagination
|
|
1989
|
+
exportable={{ filename: "employees", formats: ["csv", "xlsx", "json", "pdf"] }}
|
|
1990
|
+
columns={columns} rows={rows} getRowId={(r) => r.id}
|
|
1991
|
+
/>
|
|
1992
|
+
```
|
|
1993
|
+
|
|
1994
|
+
The menu has two parts. **Rows to export** lets the user pick *Visible rows* (what is on screen: the current page), *All matching rows* (every page; only offered with `pagination`) or *Selected rows* (only offered with `rowSelection`, and disabled while nothing is selected). Each choice shows how many rows it covers. **Download as** has one button per format. The menu remembers the last choice. With a single format (the default `["csv"]`) you get the plain "Export CSV" / "Export Excel" / "Export JSON" / "Export PDF" button instead, using `scope` from `exportable`.
|
|
1995
|
+
|
|
1996
|
+
| Format | What you get | Needs |
|
|
1997
|
+
| --- | --- | --- |
|
|
1998
|
+
| `"csv"` | Text of the displayed values, opens in any spreadsheet | nothing |
|
|
1999
|
+
| `"xlsx"` | A real Excel workbook: bold coloured header row that stays in place while you scroll, auto-filter, sized columns, real numbers, real dates and real booleans | nothing (written by the library itself) |
|
|
2000
|
+
| `"json"` | An array of objects, one per row, with real numbers and booleans and ISO dates (`"2026-11-05"`) | nothing |
|
|
2001
|
+
| `"pdf"` | A paged table with an optional title, header, footer and "Page 1 of 3" | `jspdf` and `jspdf-autotable` (and `html2canvas` for a header / footer element), given in `pdf.libraries` |
|
|
2002
|
+
|
|
2003
|
+
The same exports are available from code, for your own buttons:
|
|
2004
|
+
|
|
2005
|
+
```tsx
|
|
2006
|
+
const api = useRef<DataGridApi<Employee> | null>(null);
|
|
2007
|
+
<DataGrid apiRef={api} rowSelection ... />
|
|
2008
|
+
|
|
2009
|
+
api.current?.exportXlsx({ scope: "selected", filename: "picked", sheetName: "Picked" });
|
|
2010
|
+
api.current?.exportJson({ scope: "visible", jsonKeys: "header", jsonIndent: 0 });
|
|
2011
|
+
await api.current?.exportPdf({ scope: "filtered", pdf: { title: "All employees" } });
|
|
2012
|
+
await api.current?.exportAs("csv", { scope: "page" }); // any format by name
|
|
2013
|
+
|
|
2014
|
+
const json: string = api.current!.getJson({ scope: "filtered" }); // build without downloading
|
|
2015
|
+
const blob: Blob = await api.current!.getXlsx(); // e.g. upload it to your server
|
|
2016
|
+
const pdf: Blob = await api.current!.getPdf();
|
|
2017
|
+
const csv: string = api.current!.getCsv();
|
|
2018
|
+
```
|
|
2019
|
+
|
|
2020
|
+
`exportXlsx` and `exportPdf` return promises. They **reject** when something goes wrong (a missing library, for instance), so `try / catch` them in your own code. The toolbar menu catches errors for you and sends them to `onExportError`:
|
|
2021
|
+
|
|
2022
|
+
```tsx
|
|
2023
|
+
<DataGrid
|
|
2024
|
+
onExportError={(error, format) => toast.error(`${format} export failed: ${error.message}`)}
|
|
2025
|
+
exportable={{ formats: ["csv", "pdf"] }}
|
|
2026
|
+
/>
|
|
2027
|
+
```
|
|
2028
|
+
|
|
2029
|
+
To export pdf, install supporting pdf libraries
|
|
2030
|
+
```bash
|
|
2031
|
+
npm install jspdf jspdf-autotable # the PDF itself and its table
|
|
2032
|
+
npm install html2canvas # only if the PDF header / footer is a React element (it is drawn to a picture)
|
|
2033
|
+
```
|
|
2034
|
+
|
|
2035
|
+
```tsx
|
|
2036
|
+
<DataGrid
|
|
2037
|
+
exportable={{
|
|
2038
|
+
formats: ["csv", "pdf"],
|
|
2039
|
+
pdf: {
|
|
2040
|
+
libraries: async () => ({
|
|
2041
|
+
jsPDF: (await import("jspdf")).jsPDF,
|
|
2042
|
+
autoTable: (await import("jspdf-autotable")).default,
|
|
2043
|
+
html2canvas: (await import("html2canvas")).default, // only for a header / footer element
|
|
2044
|
+
}),
|
|
2045
|
+
},
|
|
2046
|
+
}}
|
|
2047
|
+
/>
|
|
2048
|
+
```
|
|
2049
|
+
|
|
2050
|
+
```tsx
|
|
2051
|
+
<DataGrid
|
|
2052
|
+
rowSelection
|
|
2053
|
+
pagination
|
|
2054
|
+
columns={columns}
|
|
2055
|
+
rows={rows}
|
|
2056
|
+
getRowId={(r) => r.id}
|
|
2057
|
+
exportable={{
|
|
2058
|
+
filename: "employees",
|
|
2059
|
+
formats: ["csv", "xlsx", "json", "pdf"],
|
|
2060
|
+
pdf: {
|
|
2061
|
+
// required for PDF (npm install jspdf jspdf-autotable html2canvas)
|
|
2062
|
+
libraries: async () => ({
|
|
2063
|
+
jsPDF: (await import("jspdf")).jsPDF,
|
|
2064
|
+
autoTable: (await import("jspdf-autotable")).default,
|
|
2065
|
+
html2canvas: (await import("html2canvas")).default,
|
|
2066
|
+
}),
|
|
2067
|
+
|
|
2068
|
+
title: <TitleComponent />,
|
|
2069
|
+
margin: { top: 60, right: 30, bottom: 50, left: 30 },
|
|
2070
|
+
tableTheme: "grid", // "striped" | "grid" | "plain"
|
|
2071
|
+
|
|
2072
|
+
style: {
|
|
2073
|
+
headColor: "#f59e0b", // header row background
|
|
2074
|
+
headTextColor: "#111827",
|
|
2075
|
+
stripeColors: ["#ffffff", "#f1f5f9"], // rows alternate between these
|
|
2076
|
+
bodyTextColor: "#1f2937",
|
|
2077
|
+
borderColor: "#cbd5e1",
|
|
2078
|
+
borderWidth: 0.4,
|
|
2079
|
+
cellPadding: { top: 6, bottom: 6, left: 8, right: 8 },
|
|
2080
|
+
fontSize: 10,
|
|
2081
|
+
pageBackground: "#ffffff", // try "#0f172a" for a dark page
|
|
2082
|
+
columns: { // per column, by its field
|
|
2083
|
+
salary: { fontStyle: "bold", align: "right" },
|
|
2084
|
+
name: { width: 120 },
|
|
2085
|
+
},
|
|
2086
|
+
},
|
|
2087
|
+
},
|
|
2088
|
+
}}
|
|
2089
|
+
/>
|
|
2090
|
+
```
|
|
2091
|
+
Setting Border bottom
|
|
2092
|
+
```tsx
|
|
2093
|
+
pdf: {
|
|
2094
|
+
libraries:async () => ({
|
|
2095
|
+
jsPDF: (await import("jspdf")).jsPDF,
|
|
2096
|
+
autoTable: (await import("jspdf-autotable")).default,
|
|
2097
|
+
html2canvas: (await import("html2canvas")).default,
|
|
2098
|
+
}),
|
|
2099
|
+
//
|
|
2100
|
+
tableTheme: "plain", // plain draws no lines, so only your bottom border shows
|
|
2101
|
+
autoTableOptions: {
|
|
2102
|
+
styles: {
|
|
2103
|
+
lineWidth: { bottom: 0.5 }, // points; only the bottom side
|
|
2104
|
+
lineColor: [203, 213, 225], // [r, g, b]
|
|
2105
|
+
},
|
|
2106
|
+
},
|
|
2107
|
+
}
|
|
2108
|
+
```
|
|
2109
|
+
Read more about stying pdf here [stying pdf here](https://github.com/simonbengtsson/jsPDF-AutoTable). Use the style property in `autoTableOptions` for styling cells
|
|
2110
|
+
|
|
2111
|
+
|
|
2112
|
+
**Which rows.** `scope` accepts `"filtered"` (default), `"visible"` or `"page"` (the same: the rows on screen) and `"selected"`. A page export continues the row numbers of a `sequence` column (page 2 starts at 11) unless the column has `sequenceRestartEachPage`.
|
|
2113
|
+
|
|
2114
|
+
**What each format writes.** CSV and PDF write the displayed text (`valueFormatter` applied, `Yes` / `No` for booleans, dates as `YYYY-MM-DD`). Excel and JSON write real values: a number column stays a number (`52000`, not `"$52,000"`), a boolean column stays `true` / `false`, a date column is a real Excel date, a column with a `valueFormatter` that changes text (for example codes shown as names) writes the shown text. A column's `exportValue(value, row)` overrides all of this in every format.
|
|
2115
|
+
|
|
2116
|
+
#### PDF header and footer
|
|
2117
|
+
|
|
2118
|
+
`pdf.header` and `pdf.footer` accept **a string or a React element**, and appear on every page.
|
|
2119
|
+
|
|
2120
|
+
```tsx
|
|
2121
|
+
// A string. {page}, {pages} and {date} are replaced on each page.
|
|
2122
|
+
<DataGrid
|
|
2123
|
+
exportable={{
|
|
2124
|
+
formats: ["pdf"],
|
|
2125
|
+
pdf: {
|
|
2126
|
+
title: <TitleComponent />,
|
|
2127
|
+
header: "Acme Corporation, People report ({date})",
|
|
2128
|
+
footer: "Confidential, page {page} of {pages}",
|
|
2129
|
+
},
|
|
2130
|
+
}}
|
|
2131
|
+
/>
|
|
2132
|
+
```
|
|
2133
|
+
|
|
2134
|
+
```tsx
|
|
2135
|
+
// A component: a logo, colours, borders, anything you can style. Images and inline styles work.
|
|
2136
|
+
import logo from "./logo.png";
|
|
2137
|
+
|
|
2138
|
+
<DataGrid
|
|
2139
|
+
exportable={{
|
|
2140
|
+
formats: ["pdf"],
|
|
2141
|
+
pdf: {
|
|
2142
|
+
header: (
|
|
2143
|
+
<div style={{ display: "flex", alignItems: "center", gap: 12, borderBottom: "3px solid #4f46e5", paddingBottom: 6 }}>
|
|
2144
|
+
<img src={logo} alt="" width={40} height={40} style={{ borderRadius: 8 }} />
|
|
2145
|
+
<div>
|
|
2146
|
+
<div style={{ fontSize: 20, fontWeight: 700, color: "#312e81" }}>Acme Corporation</div>
|
|
2147
|
+
<div style={{ fontSize: 12, color: "#6b7280" }}>People & Culture report</div>
|
|
2148
|
+
</div>
|
|
2149
|
+
</div>
|
|
2150
|
+
),
|
|
2151
|
+
footer: <div style={{ textAlign: "center", fontSize: 11, color: "#6b7280" }}>Confidential. Do not share.</div>,
|
|
2152
|
+
},
|
|
2153
|
+
}}
|
|
2154
|
+
/>
|
|
2155
|
+
```
|
|
2156
|
+
|
|
2157
|
+
An element is drawn off-screen, turned into a picture with `html2canvas`, and placed on each page, shrunk to fit the page width and `maxImageHeight` (default 90 pt) with its proportions kept. A few things to know about elements:
|
|
2158
|
+
|
|
2159
|
+
- They fill the page width, so lay them out with `display: flex` and `justify-content` inside (the `headerAlign` / `footerAlign` options move strings, not elements).
|
|
2160
|
+
- They are drawn once, so they cannot show the page number. Use a string footer for "page 2 of 5", or both: an element header and a string footer.
|
|
2161
|
+
- Images must be loadable from the page: your own assets, data URLs, or servers that allow cross-origin use (CORS). Otherwise the browser blocks the picture.
|
|
2162
|
+
- Inline styles and plain CSS classes work. Very new CSS features may not be supported by `html2canvas`.
|
|
2163
|
+
|
|
2164
|
+
Other `pdf` options:
|
|
2165
|
+
|
|
2166
|
+
| Option | Default | Meaning |
|
|
2167
|
+
| --- | --- | --- |
|
|
2168
|
+
| `libraries` | | **Required.** `{ jsPDF, autoTable, html2canvas? }` or a function returning them (see Installation) |
|
|
2169
|
+
| `title` | | A heading above the table on the first page |
|
|
2170
|
+
| `header`, `footer` | | A string or element, on every page |
|
|
2171
|
+
| `headerAlign`, `footerAlign` | `"left"`, `"center"` | Where a **string** goes: `"left"`, `"center"`, `"right"` |
|
|
2172
|
+
| `orientation` | `"auto"` | `"portrait"`, `"landscape"`, or `"auto"` (landscape when there are more than 6 columns) |
|
|
2173
|
+
| `pageSize` | `"a4"` | `"a3"`, `"a4"`, `"a5"`, `"letter"`, `"legal"` |
|
|
2174
|
+
| `margin` | `36` | Points around the page (72 points = 1 inch): a number, or `{ top, right, bottom, left }` |
|
|
2175
|
+
| `fontSize` | `9` | Table text size in points |
|
|
2176
|
+
| `tableTheme` | `"striped"` | `"striped"`, `"grid"` or `"plain"` |
|
|
2177
|
+
| `headColor`, `headTextColor` | `"#4f46e5"`, `"#ffffff"` | Colours of the table's header row (any CSS colour) |
|
|
2178
|
+
| `matchGridStyle` | `false` | Copy the grid's on-screen look into the PDF. See [PDF styling](#pdf-styling) |
|
|
2179
|
+
| `style` | | Colours, stripes, borders, padding, page background, per-column looks. See [PDF styling](#pdf-styling) |
|
|
2180
|
+
| `autoTableOptions` | | Raw options for jspdf-autotable, merged last, for anything not covered |
|
|
2181
|
+
| `pageNumbers` | `true` | "Page 1 of 3" in the bottom right |
|
|
2182
|
+
| `maxImageHeight` | `90` | Tallest header / footer picture, in points |
|
|
2183
|
+
| `fontName`, `beforeRender` | | Use another font (see below) |
|
|
2184
|
+
|
|
2185
|
+
jsPDF's built-in fonts cover Western European letters. For other alphabets (Arabic, Chinese, ...) register a font in `beforeRender` and name it in `fontName`:
|
|
2186
|
+
|
|
2187
|
+
```tsx
|
|
2188
|
+
pdf: {
|
|
2189
|
+
fontName: "NotoSans",
|
|
2190
|
+
beforeRender: (doc) => {
|
|
2191
|
+
doc.addFileToVFS("NotoSans.ttf", notoSansBase64); // your font file as base64
|
|
2192
|
+
doc.addFont("NotoSans.ttf", "NotoSans", "normal");
|
|
2193
|
+
},
|
|
2194
|
+
}
|
|
2195
|
+
```
|
|
2196
|
+
|
|
2197
|
+
#### PDF styling
|
|
2198
|
+
|
|
2199
|
+
By default the PDF has its own look (indigo header, light stripes). Two ways to change it, and they combine.
|
|
2200
|
+
|
|
2201
|
+
**1. Copy the grid's look, only when you ask.** `matchGridStyle: true` reads the grid as it is on screen when the export runs: the header's background and text colour, the text colour and size of the rows, the two stripe colours (with `striped`), the row borders, and the grid's own background (which matters for dark themes). It reads real elements, so it follows `theme`, Tailwind classes and your CSS. Without the option nothing is read.
|
|
2202
|
+
|
|
2203
|
+
```tsx
|
|
2204
|
+
<DataGrid theme="midnight" striped exportable={{ formats: ["pdf"], pdf: { libraries, matchGridStyle: true } }} />
|
|
2205
|
+
```
|
|
2206
|
+
|
|
2207
|
+
Fonts are not copied: jsPDF cannot use a web font without its file (see `fontName`).
|
|
2208
|
+
|
|
2209
|
+
**2. Set it yourself with `style`.** Every field is optional, and colours are any CSS colour (`"#4f46e5"`, `"rgb(79,70,229)"`, `"tomato"`).
|
|
2210
|
+
|
|
2211
|
+
```tsx
|
|
2212
|
+
pdf: {
|
|
2213
|
+
libraries,
|
|
2214
|
+
margin: { top: 60, right: 30, bottom: 50, left: 30 },
|
|
2215
|
+
tableTheme: "grid", // "striped" | "grid" | "plain"
|
|
2216
|
+
style: {
|
|
2217
|
+
pageBackground: "#0f172a", // colour behind everything, on every page
|
|
2218
|
+
headColor: "#f59e0b",
|
|
2219
|
+
headTextColor: "#111827",
|
|
2220
|
+
stripeColors: ["#1e293b", "#334155"], // rows alternate between these two
|
|
2221
|
+
bodyTextColor: "#e2e8f0",
|
|
2222
|
+
borderColor: "#475569",
|
|
2223
|
+
borderWidth: 0.4, // points
|
|
2224
|
+
cellPadding: { top: 6, bottom: 6, left: 8, right: 8 },
|
|
2225
|
+
fontSize: 10,
|
|
2226
|
+
columns: { // per column, by its `field`
|
|
2227
|
+
salary: { fontStyle: "bold", textColor: "#fbbf24", align: "right" },
|
|
2228
|
+
name: { width: 120 },
|
|
2229
|
+
},
|
|
2230
|
+
},
|
|
2231
|
+
}
|
|
2232
|
+
```
|
|
2233
|
+
|
|
2234
|
+
| `style` field | Meaning |
|
|
2235
|
+
| --- | --- |
|
|
2236
|
+
| `headColor`, `headTextColor`, `headFontSize`, `headFontStyle` | The table's header row (`headFontStyle`: `"normal"`, `"bold"` (default), `"italic"`, `"bolditalic"`) |
|
|
2237
|
+
| `bodyColor` | Background of every body row (when there are no `stripeColors`) |
|
|
2238
|
+
| `stripeColors` | `[colorA, colorB]`: rows alternate, starting with A |
|
|
2239
|
+
| `bodyTextColor` | Text colour of body rows |
|
|
2240
|
+
| `borderColor`, `borderWidth` | Lines between cells (points) |
|
|
2241
|
+
| `cellPadding` | Space inside cells: a number or `{ top, right, bottom, left }`. Default 4 |
|
|
2242
|
+
| `minRowHeight` | Smallest row height in points |
|
|
2243
|
+
| `fontSize`, `fontName` | Table text size (default 9) and a font you registered |
|
|
2244
|
+
| `pageBackground` | Paper colour. Header, footer, title and table text turn light by themselves when it is dark |
|
|
2245
|
+
| `textColor`, `titleColor`, `titleSize` | Header / footer / page-number text, and the `title` |
|
|
2246
|
+
| `margin` | Same as the `margin` option |
|
|
2247
|
+
| `columns` | `{ [field]: { width, align, textColor, backgroundColor, fontStyle, fontSize } }`. `width` is points, `"auto"` or `"wrap"` |
|
|
2248
|
+
|
|
2249
|
+
**Which wins.** Weakest to strongest: built-in defaults, the grid's look (`matchGridStyle`), the flat options (`headColor`, `fontSize`, `margin`, ...), then `style`. So you can copy the grid and still force one colour:
|
|
2250
|
+
|
|
2251
|
+
```tsx
|
|
2252
|
+
pdf: { matchGridStyle: true, style: { headColor: "#0f766e" } } // the grid's look, but a teal header
|
|
2253
|
+
```
|
|
2254
|
+
|
|
2255
|
+
**Anything else.** `autoTableOptions` is handed to jspdf-autotable last, and its `styles`, `headStyles`, `bodyStyles`, `alternateRowStyles` and `margin` are merged key by key into ours:
|
|
2256
|
+
|
|
2257
|
+
```tsx
|
|
2258
|
+
pdf: { autoTableOptions: { rowPageBreak: "avoid", didParseCell: (data) => { if (data.column.index === 5 && Number(data.cell.raw.replace(/\D/g, "")) > 100000) data.cell.styles.textColor = [220, 38, 38]; } } }
|
|
2259
|
+
```
|
|
2260
|
+
|
|
2261
|
+
Header and footer *elements* are drawn on the page's colour, so they blend into a `pageBackground`.
|
|
2262
|
+
|
|
2263
|
+
#### Export options
|
|
2264
|
+
|
|
1872
2265
|
| `ExportOptions` | Default | Meaning |
|
|
1873
2266
|
| --- | --- | --- |
|
|
1874
|
-
| `filename` | `"export"` | File name without
|
|
1875
|
-
| `scope` | `"filtered"` | `"filtered"` all rows matching search and filters, `"page"` the
|
|
2267
|
+
| `filename` | `"export"` | File name without the extension |
|
|
2268
|
+
| `scope` | `"filtered"` | `"filtered"` all rows matching search and filters, `"visible"` / `"page"` the rows on screen, `"selected"` the selected rows |
|
|
1876
2269
|
| `includeHidden` | `false` | Also write hidden columns |
|
|
1877
|
-
| `sanitize` | `true` |
|
|
2270
|
+
| `sanitize` | `true` | CSV only: put an apostrophe in front of text starting with `=`, `+`, `-` or `@`, so Excel does not run it as a formula |
|
|
2271
|
+
| `formats` | `["csv"]` | The formats the toolbar offers: any of `"csv"`, `"xlsx"`, `"json"`, `"pdf"` |
|
|
2272
|
+
| `sheetName` | `"Sheet1"` | Excel only: the worksheet's name |
|
|
2273
|
+
| `jsonKeys` | `"field"` | JSON only: use each column's `"field"` or its `"header"` text as the key |
|
|
2274
|
+
| `jsonIndent` | `2` | JSON only: spaces of indentation (`0` for one line) |
|
|
2275
|
+
| `pdf` | | PDF only: see above |
|
|
1878
2276
|
|
|
1879
2277
|
**What goes in the file.** The header row uses the column header names. Cell values are the displayed text (the result of `valueFormatter`, `Yes` / `No` for booleans), except that dates are written as `YYYY-MM-DD`. Numbers therefore export formatted (`$52,000`) unless you give an `exportValue`. To decide a column's value yourself, add `exportValue`:
|
|
1880
2278
|
|
|
@@ -2131,7 +2529,132 @@ const markDone = () => setRows((rs) => rs.map((r) => (ids.includes(r.id) ? { ...
|
|
|
2131
2529
|
<DataGrid serverSide pagination searchable multiSort theme="aurora" columns={columns} rows={rows} rowCount={total} onQueryChange={load} />
|
|
2132
2530
|
```
|
|
2133
2531
|
|
|
2134
|
-
### 6.24
|
|
2532
|
+
### 6.24 Filter comparisons
|
|
2533
|
+
|
|
2534
|
+
A text filter normally means "contains". Switch on `filterOperators` on a column and its popup gets a drop-down on top, so the user chooses **how** to compare:
|
|
2535
|
+
|
|
2536
|
+
| Choice | A row passes when its text... |
|
|
2537
|
+
| --- | --- |
|
|
2538
|
+
| Contains | has the typed text anywhere |
|
|
2539
|
+
| Does not contain | does not have it anywhere |
|
|
2540
|
+
| Equals | is exactly the typed text |
|
|
2541
|
+
| Not equal | is anything else |
|
|
2542
|
+
| Starts with | begins with it |
|
|
2543
|
+
| Does not start with | does not begin with it |
|
|
2544
|
+
| Ends with | ends with it |
|
|
2545
|
+
| Does not end with | does not end with it |
|
|
2546
|
+
|
|
2547
|
+
All comparisons ignore upper / lower case. Changing the choice filters straight away; typing waits for `filterDebounce` as usual.
|
|
2548
|
+
|
|
2549
|
+
```tsx
|
|
2550
|
+
const columns: ColumnDef<User>[] = [
|
|
2551
|
+
{ field: "name", filterable: true, filterOperators: true }, // all eight
|
|
2552
|
+
{ field: "email", filterable: true,
|
|
2553
|
+
filterOperators: ["contains", "startsWith", "endsWith", "equals"], // only these four
|
|
2554
|
+
filterOperator: "startsWith" }, // selected first
|
|
2555
|
+
{ field: "department", filterable: true }, // no drop-down: always "contains"
|
|
2556
|
+
];
|
|
2557
|
+
```
|
|
2558
|
+
|
|
2559
|
+
- It is **off by default**. A column without `filterOperators` shows just the box and always means "contains" (or "equals" for `filterType: "exact"`).
|
|
2560
|
+
- It applies to text columns (`filterType` `"text"` or `"exact"`). It does nothing for number, date or select filters, nor when you supply your own `filterRenderer`.
|
|
2561
|
+
- Pass `true` for all eight, or a list to offer fewer. The list keeps the order shown above. `filterOperator` sets the first choice (default `"contains"`).
|
|
2562
|
+
- Keyboard: focus the drop-down, then Up / Down open it and move, Enter or Space choose, Esc closes just the list.
|
|
2563
|
+
|
|
2564
|
+
**The filter value.** With `filterOperators` on, the column's filter is an object, not a string: `{ operator: "startsWith", value: "ann" }` (type `TextFilter`). You see it in `filters` / `onFiltersChange` (controlled mode) and in the `serverSide` query, where your API applies it:
|
|
2565
|
+
|
|
2566
|
+
```tsx
|
|
2567
|
+
onQueryChange={async (query) => {
|
|
2568
|
+
const nameFilter = query.filters.name; // string, or { operator, value } when filterOperators is on
|
|
2569
|
+
const { operator, value } = typeof nameFilter === "string" ? { operator: "contains", value: nameFilter } : nameFilter;
|
|
2570
|
+
// ... translate to your database: operator "startsWith" -> LIKE 'value%'
|
|
2571
|
+
}}
|
|
2572
|
+
```
|
|
2573
|
+
|
|
2574
|
+
Controlled filters work the same way, and a plain string is still accepted (it is read as "contains"):
|
|
2575
|
+
|
|
2576
|
+
```tsx
|
|
2577
|
+
<DataGrid filters={{ name: { operator: "notContains", value: "test" } }} onFiltersChange={setFilters} ... />
|
|
2578
|
+
```
|
|
2579
|
+
|
|
2580
|
+
### 6.25 Sort indicator
|
|
2581
|
+
|
|
2582
|
+
The arrow in sortable headers can be changed. The default is the small text arrow (▲ ▼ ↕). Two other choices:
|
|
2583
|
+
|
|
2584
|
+
```tsx
|
|
2585
|
+
<DataGrid sortIndicator="arrow" ... /> // a smooth arrow that turns around
|
|
2586
|
+
<DataGrid sortIndicator={MyIndicator} ... /> // your own component
|
|
2587
|
+
```
|
|
2588
|
+
|
|
2589
|
+
**`"arrow"`** is an SVG arrow. Ascending points up, descending points down, and "not sorted" is a dim up arrow. When the sort changes it **rotates smoothly** (a CSS transition of `--rg-sort-turn`, default `0.28s`, off for reduced motion). It always keeps turning the same way (up, down, back up), so each click is one clean half-turn. With several sorted columns it shows each column's priority number.
|
|
2590
|
+
|
|
2591
|
+
**Your own component** receives `{ column, direction, priority }`: `direction` is `"asc"`, `"desc"` or `null`, and `priority` is 1, 2, ... when several columns are sorted. The grid keeps the component mounted in the same place, so a CSS `transition` on it animates between states. Define it outside any component:
|
|
2592
|
+
|
|
2593
|
+
```tsx
|
|
2594
|
+
import { SortArrow, type SortIndicatorProps } from "react-gridix";
|
|
2595
|
+
|
|
2596
|
+
// Reuse the rotating arrow with your own size and colour
|
|
2597
|
+
function BigArrow({ direction }: SortIndicatorProps<User>) {
|
|
2598
|
+
return <SortArrow direction={direction} size={18} style={{ color: "tomato" }} />;
|
|
2599
|
+
}
|
|
2600
|
+
|
|
2601
|
+
// Or draw anything, turned with CSS
|
|
2602
|
+
function Chevron({ direction }: SortIndicatorProps<User>) {
|
|
2603
|
+
return (
|
|
2604
|
+
<span style={{ display: "inline-block", transition: "transform .3s", transform: direction === "desc" ? "rotate(180deg)" : "none", opacity: direction ? 1 : 0.3 }}>
|
|
2605
|
+
⌃
|
|
2606
|
+
</span>
|
|
2607
|
+
);
|
|
2608
|
+
}
|
|
2609
|
+
|
|
2610
|
+
<DataGrid sortIndicator={BigArrow} columns={columns} rows={rows} />
|
|
2611
|
+
```
|
|
2612
|
+
|
|
2613
|
+
A single column can use its own: `{ field: "name", sortable: true, sortIndicator: "arrow" }`. The wrapper `<span>` has the `sortIndicator` slot (`classNames={{ sortIndicator: "..." }}`) and a `data-direction` attribute (`asc`, `desc` or `none`) you can style.
|
|
2614
|
+
|
|
2615
|
+
### 6.26 Custom empty state
|
|
2616
|
+
|
|
2617
|
+
When there are no rows to show, the grid draws `emptyMessage` (default "No rows to show"). For more than a sentence, pass a component with `emptyComponent`. It replaces the message and receives:
|
|
2618
|
+
|
|
2619
|
+
| Prop | Meaning |
|
|
2620
|
+
| --- | --- |
|
|
2621
|
+
| `reason` | `"no-data"` when the grid was given no rows, `"no-results"` when the search or filters hide them all |
|
|
2622
|
+
| `search` | The search text (empty when none) |
|
|
2623
|
+
| `filters` | The active filters, by field |
|
|
2624
|
+
| `columns` | The visible columns |
|
|
2625
|
+
| `clearAll()` | Clears the search and all filters, which brings the rows back |
|
|
2626
|
+
|
|
2627
|
+
```tsx
|
|
2628
|
+
import type { EmptyStateProps } from "react-gridix";
|
|
2629
|
+
|
|
2630
|
+
function NothingHere({ reason, clearAll, search }: EmptyStateProps<User>) {
|
|
2631
|
+
if (reason === "no-data") {
|
|
2632
|
+
return (
|
|
2633
|
+
<div style={{ textAlign: "center" }}>
|
|
2634
|
+
<img src="/empty-box.svg" alt="" width={96} />
|
|
2635
|
+
<h3>No users yet</h3>
|
|
2636
|
+
<button onClick={openAddUserDialog}>Add the first user</button>
|
|
2637
|
+
</div>
|
|
2638
|
+
);
|
|
2639
|
+
}
|
|
2640
|
+
return (
|
|
2641
|
+
<div style={{ textAlign: "center" }}>
|
|
2642
|
+
<h3>Nothing matches{search ? ` "${search}"` : ""}</h3>
|
|
2643
|
+
<button onClick={clearAll}>Clear search and filters</button>
|
|
2644
|
+
</div>
|
|
2645
|
+
);
|
|
2646
|
+
}
|
|
2647
|
+
|
|
2648
|
+
<DataGrid emptyComponent={NothingHere} columns={columns} rows={users} />
|
|
2649
|
+
```
|
|
2650
|
+
|
|
2651
|
+
- It is drawn inside one full-width table cell (class `rg-grid__empty rg-grid__empty--custom`, slot `empty`), so `classNames={{ empty: "py-10" }}` still works.
|
|
2652
|
+
- Define the component outside render so it keeps its identity (and its state).
|
|
2653
|
+
- While loading, the skeleton is shown, not this. After a failed load, the error message and Retry button are shown.
|
|
2654
|
+
- When rows are removed with an exit animation, the component appears once the last row has left.
|
|
2655
|
+
- Keep using `emptyMessage` for a plain sentence. `emptyComponent` wins when both are set.
|
|
2656
|
+
|
|
2657
|
+
### 6.27 Known limitations
|
|
2135
2658
|
|
|
2136
2659
|
Not included:
|
|
2137
2660
|
|
|
@@ -2154,6 +2677,10 @@ Behaviours to be aware of:
|
|
|
2154
2677
|
- Pinned columns only stick when the table is wider than its container.
|
|
2155
2678
|
- In `serverSide` mode the grid cannot export or select rows it has never loaded.
|
|
2156
2679
|
- The date calendar starts weeks on Sunday and has no week numbers or time of day.
|
|
2680
|
+
- Excel export writes one worksheet. It does not carry the grid's colours or fonts, only a styled header row.
|
|
2681
|
+
- The PDF is styled by its own `pdf` options. It only copies the grid's look when `matchGridStyle` is on, and then only colours, stripes, borders and text size, not fonts or exact spacing.
|
|
2682
|
+
- PDF text uses jsPDF's built-in Western European fonts unless you register another one (`pdf.fontName`). A PDF header / footer element is a picture: its text cannot be selected.
|
|
2683
|
+
- Rows that leave play their exit animation as a copy in place; the table closes the gap when the animation ends instead of sliding the rows below up.
|
|
2157
2684
|
|
|
2158
2685
|
---
|
|
2159
2686
|
|
|
@@ -2176,6 +2703,7 @@ The repository contains a playground with one page per feature:
|
|
|
2176
2703
|
| Large data (`#large`) | 20,000 virtualized rows with search, sorting and a theme |
|
|
2177
2704
|
| Dates and filters (`#dates`) | `type: "date"` with the calendar editor and range-calendar filter, `dateMin` / `dateMax`, a `Date`-object column, from/to, number range, select and exact filters |
|
|
2178
2705
|
| Themes (`#themes`) | A switcher for none and all 8 themes |
|
|
2706
|
+
| Animations and export (`#features`) | Pick the "in" and "out" animation from 12, add and remove rows (top, end, selected, all) and watch the other rows stay put; the rotating sort arrow, the default arrow and a custom indicator component; the Export menu (CSV, Excel, JSON, PDF) with a visible / selected / all choice and a PDF header and footer given as a string or as a styled component with a logo; filter comparison drop-downs (all eight, a short list, and none); a custom empty-state component |
|
|
2179
2707
|
|
|
2180
2708
|
Run it:
|
|
2181
2709
|
|
|
@@ -2189,7 +2717,8 @@ Open the URL it prints (usually `http://localhost:5173`). Link straight to a dem
|
|
|
2189
2717
|
The Styling demo loads Tailwind from its CDN, so it needs an internet connection. The rest works offline.
|
|
2190
2718
|
|
|
2191
2719
|
---
|
|
2192
|
-
|
|
2720
|
+
|
|
2721
|
+
## 9. Troubleshooting
|
|
2193
2722
|
|
|
2194
2723
|
| Problem | Cause and fix |
|
|
2195
2724
|
| --- | --- |
|
|
@@ -2203,6 +2732,12 @@ The Styling demo loads Tailwind from its CDN, so it needs an internet connection
|
|
|
2203
2732
|
| The date calendar never opens | The cell must be editable (`editable` on the grid or the column), then double-click it or press Enter / F2 |
|
|
2204
2733
|
| A sequence column shows nothing or a type error | Give it `type: "sequence"` and a `field` that starts with `#`, for example `{ field: "#", type: "sequence" }` |
|
|
2205
2734
|
| My custom row animation does nothing | `animateRows` is `false`, `virtualize` is on, or your class does not set `animation`. Check that the keyframes exist and that the class name is spelled the same in CSS |
|
|
2735
|
+
| PDF export fails with `needs the jspdf and jspdf-autotable libraries` | Install `jspdf jspdf-autotable` (and `html2canvas` for a header / footer element) and pass them in `exportable.pdf.libraries`. Handle the error with `onExportError` |
|
|
2736
|
+
| The PDF header / footer element has no image | The image must be loadable by the browser without being blocked: a bundled asset, a data URL, or a server that sends CORS headers |
|
|
2737
|
+
| The comparison drop-down does not show in the filter popup | Add `filterOperators: true` (or a list) to that column. It applies to text columns only, and not with a custom `filterRenderer` |
|
|
2738
|
+
| The wrong row animates out when I delete one | Give the grid `getRowId={(row) => row.id}`. Without it rows are identified by position |
|
|
2739
|
+
| Removed rows do not animate | `animateRows` is off, `virtualize` is on, the exit animation is `"none"`, or the system asks for reduced motion. Rows are also replaced at once when the page changes |
|
|
2740
|
+
| "Selected rows" is greyed out in the export menu | Nothing is selected yet, or `rowSelection` is off |
|
|
2206
2741
|
| The number filter popup asks for Min and Max, but I wanted text | Number columns default to a range filter. Set `filterType: "text"` |
|
|
2207
2742
|
| A typed filter feels slow, or fires on every key | Change the wait with `filterDebounce` on the grid (default 300 ms) or on one column. Use `0` for no waiting |
|
|
2208
2743
|
| Select filter lists the wrong labels | Pass `filterOptions` with `{ value, label }` pairs. `value` must equal what is stored in the row |
|
|
@@ -2231,28 +2766,6 @@ The Styling demo loads Tailwind from its CDN, so it needs an internet connection
|
|
|
2231
2766
|
| Type error: `field` not assignable | `field` must be a key of your row type. Check the spelling, and that `ColumnDef<T>` uses the same `T` as `rows` |
|
|
2232
2767
|
|
|
2233
2768
|
---
|
|
2234
|
-
|
|
2235
|
-
## 9. Migrating from the earlier version
|
|
2236
|
-
|
|
2237
|
-
### Renamed: react-gridix
|
|
2238
|
-
|
|
2239
|
-
The library is now **`react-gridix`**, and every CSS prefix changed from `rk` to `rg`.
|
|
2240
|
-
|
|
2241
|
-
| Before | Now |
|
|
2242
|
-
| --- | --- |
|
|
2243
|
-
| `npm install react-ui-kit` | `npm install react-gridix` |
|
|
2244
|
-
| `import ... from "react-ui-kit"` | `import ... from "react-gridix"` |
|
|
2245
|
-
| `import "react-ui-kit/style.css"` | `import "react-gridix/style.css"` |
|
|
2246
|
-
| CSS variables `--rk-header-bg`, `--rk-primary`, ... | `--rg-header-bg`, `--rg-primary`, ... |
|
|
2247
|
-
| Classes `.rk-grid__row`, `.rk-checkbox`, ... | `.rg-grid__row`, `.rg-checkbox`, ... |
|
|
2248
|
-
| Theme selector `[data-rk-theme="brand"]` | `[data-rg-theme="brand"]` |
|
|
2249
|
-
|
|
2250
|
-
Search your project's CSS for `rk-` and replace it with `rg-`. A one-line fix in a Unix shell: `sed -i 's/\brk-/rg-/g' src/**/*.css`.
|
|
2251
|
-
|
|
2252
|
-
### Other changes
|
|
2253
|
-
|
|
2254
|
-
Also new in this release: `filterDebounce`, a smaller default checkbox (17px instead of 20px, with a tighter gap and a narrower selection column), a calendar for date cells and date filters, the `sequence` column type, `rowAnimationClassName`, and re-tuned theme colours (stronger header contrast, clearer inputs in the dark themes).
|
|
2255
|
-
|
|
2256
2769
|
### Changed defaults
|
|
2257
2770
|
|
|
2258
2771
|
Three defaults changed so that every feature is opt-in.
|