react-beauti-graph 0.0.0-stage → 1.3.1
This diff represents the content of publicly available package versions that have been released to one of the supported registries. The information contained in this diff is provided for informational purposes only and reflects changes between package versions as they appear in their respective public registries.
- package/LICENSE +191 -0
- package/NOTICE +8 -0
- package/README.md +399 -2
- package/dist/default_setting.d.cts +17 -0
- package/dist/default_setting.d.ts +17 -0
- package/dist/graphFactory.d.cts +246 -0
- package/dist/graphFactory.d.ts +246 -0
- package/dist/index.cjs +3 -0
- package/dist/index.cjs.map +1 -0
- package/dist/index.d.cts +6 -0
- package/dist/index.d.ts +6 -0
- package/dist/index.js +887 -0
- package/dist/index.js.map +1 -0
- package/dist/style.css +380 -0
- package/package.json +95 -4
package/LICENSE
ADDED
|
@@ -0,0 +1,191 @@
|
|
|
1
|
+
|
|
2
|
+
Apache License
|
|
3
|
+
Version 2.0, January 2004
|
|
4
|
+
http://www.apache.org/licenses/
|
|
5
|
+
|
|
6
|
+
TERMS AND CONDITIONS FOR USE, REPRODUCTION, AND DISTRIBUTION
|
|
7
|
+
|
|
8
|
+
1. Definitions.
|
|
9
|
+
|
|
10
|
+
"License" shall mean the terms and conditions for use, reproduction,
|
|
11
|
+
and distribution as defined by Sections 1 through 9 of this document.
|
|
12
|
+
|
|
13
|
+
"Licensor" shall mean the copyright owner or entity authorized by
|
|
14
|
+
the copyright owner that is granting the License.
|
|
15
|
+
|
|
16
|
+
"Legal Entity" shall mean the union of the acting entity and all
|
|
17
|
+
other entities that control, are controlled by, or are under common
|
|
18
|
+
control with that entity. For the purposes of this definition,
|
|
19
|
+
"control" means (i) the power, direct or indirect, to cause the
|
|
20
|
+
direction or management of such entity, whether by contract or
|
|
21
|
+
otherwise, or (ii) ownership of fifty percent (50%) or more of the
|
|
22
|
+
outstanding shares, or (iii) beneficial ownership of such entity.
|
|
23
|
+
|
|
24
|
+
"You" (or "Your") shall mean an individual or Legal Entity
|
|
25
|
+
exercising permissions granted by this License.
|
|
26
|
+
|
|
27
|
+
"Source" form shall mean the preferred form for making modifications,
|
|
28
|
+
including but not limited to software source code, documentation
|
|
29
|
+
source, and configuration files.
|
|
30
|
+
|
|
31
|
+
"Object" form shall mean any form resulting from mechanical
|
|
32
|
+
transformation or translation of a Source form, including but
|
|
33
|
+
not limited to compiled object code, generated documentation,
|
|
34
|
+
and conversions to other media types.
|
|
35
|
+
|
|
36
|
+
"Work" shall mean the work of authorship, whether in Source or
|
|
37
|
+
Object form, made available under the License, as indicated by a
|
|
38
|
+
copyright notice that is included in or attached to the work
|
|
39
|
+
(an example is provided in the Appendix below).
|
|
40
|
+
|
|
41
|
+
"Derivative Works" shall mean any work, whether in Source or Object
|
|
42
|
+
form, that is based on (or derived from) the Work and for which the
|
|
43
|
+
editorial revisions, annotations, elaborations, or other modifications
|
|
44
|
+
represent, as a whole, an original work of authorship. For the purposes
|
|
45
|
+
of this License, Derivative Works shall not include works that remain
|
|
46
|
+
separable from, or merely link (or bind by name) to the interfaces of,
|
|
47
|
+
the Work and Derivative Works thereof.
|
|
48
|
+
|
|
49
|
+
"Contribution" shall mean any work of authorship, including
|
|
50
|
+
the original version of the Work and any modifications or additions
|
|
51
|
+
to that Work or Derivative Works thereof, that is intentionally
|
|
52
|
+
submitted to Licensor for inclusion in the Work by the copyright owner
|
|
53
|
+
or by an individual or Legal Entity authorized to submit on behalf of
|
|
54
|
+
the copyright owner. For the purposes of this definition, "submitted"
|
|
55
|
+
means any form of electronic, verbal, or written communication sent
|
|
56
|
+
to the Licensor or its representatives, including but not limited to
|
|
57
|
+
communication on electronic mailing lists, source code control systems,
|
|
58
|
+
and issue tracking systems that are managed by, or on behalf of, the
|
|
59
|
+
Licensor for the purpose of discussing and improving the Work, but
|
|
60
|
+
excluding communication that is conspicuously marked or otherwise
|
|
61
|
+
designated in writing by the copyright owner as "Not a Contribution."
|
|
62
|
+
|
|
63
|
+
"Contributor" shall mean Licensor and any individual or Legal Entity
|
|
64
|
+
on behalf of whom a Contribution has been received by Licensor and
|
|
65
|
+
subsequently incorporated within the Work.
|
|
66
|
+
|
|
67
|
+
2. Grant of Copyright License. Subject to the terms and conditions of
|
|
68
|
+
this License, each Contributor hereby grants to You a perpetual,
|
|
69
|
+
worldwide, non-exclusive, no-charge, royalty-free, irrevocable
|
|
70
|
+
copyright license to reproduce, prepare Derivative Works of,
|
|
71
|
+
publicly display, publicly perform, sublicense, and distribute the
|
|
72
|
+
Work and such Derivative Works in Source or Object form.
|
|
73
|
+
|
|
74
|
+
3. Grant of Patent License. Subject to the terms and conditions of
|
|
75
|
+
this License, each Contributor hereby grants to You a perpetual,
|
|
76
|
+
worldwide, non-exclusive, no-charge, royalty-free, irrevocable
|
|
77
|
+
(except as stated in this section) patent license to make, have made,
|
|
78
|
+
use, offer to sell, sell, import, and otherwise transfer the Work,
|
|
79
|
+
where such license applies only to those patent claims licensable
|
|
80
|
+
by such Contributor that are necessarily infringed by their
|
|
81
|
+
Contribution(s) alone or by combination of their Contribution(s)
|
|
82
|
+
with the Work to which such Contribution(s) was submitted. If You
|
|
83
|
+
institute patent litigation against any entity (including a
|
|
84
|
+
cross-claim or counterclaim in a lawsuit) alleging that the Work
|
|
85
|
+
or a Contribution incorporated within the Work constitutes direct
|
|
86
|
+
or contributory patent infringement, then any patent licenses
|
|
87
|
+
granted to You under this License for that Work shall terminate
|
|
88
|
+
as of the date such litigation is filed.
|
|
89
|
+
|
|
90
|
+
4. Redistribution. You may reproduce and distribute copies of the
|
|
91
|
+
Work or Derivative Works thereof in any medium, with or without
|
|
92
|
+
modifications, and in Source or Object form, provided that You
|
|
93
|
+
meet the following conditions:
|
|
94
|
+
|
|
95
|
+
(a) You must give any other recipients of the Work or
|
|
96
|
+
Derivative Works a copy of this License; and
|
|
97
|
+
|
|
98
|
+
(b) You must cause any modified files to carry prominent notices
|
|
99
|
+
stating that You changed the files; and
|
|
100
|
+
|
|
101
|
+
(c) You must retain, in the Source form of any Derivative Works
|
|
102
|
+
that You distribute, all copyright, patent, trademark, and
|
|
103
|
+
attribution notices from the Source form of the Work,
|
|
104
|
+
excluding those notices that do not pertain to any part of
|
|
105
|
+
the Derivative Works; and
|
|
106
|
+
|
|
107
|
+
(d) If the Work includes a "NOTICE" text file as part of its
|
|
108
|
+
distribution, then any Derivative Works that You distribute must
|
|
109
|
+
include a readable copy of the attribution notices contained
|
|
110
|
+
within such NOTICE file, excluding those notices that do not
|
|
111
|
+
pertain to any part of the Derivative Works, in at least one
|
|
112
|
+
of the following places: within a NOTICE text file distributed
|
|
113
|
+
as part of the Derivative Works; within the Source form or
|
|
114
|
+
documentation, if provided along with the Derivative Works; or,
|
|
115
|
+
within a display generated by the Derivative Works, if and
|
|
116
|
+
wherever such third-party notices normally appear. The contents
|
|
117
|
+
of the NOTICE file are for informational purposes only and
|
|
118
|
+
do not modify the License. You may add Your own attribution
|
|
119
|
+
notices within Derivative Works that You distribute, alongside
|
|
120
|
+
or as an addendum to the NOTICE text from the Work, provided
|
|
121
|
+
that such additional attribution notices cannot be construed
|
|
122
|
+
as modifying the License.
|
|
123
|
+
|
|
124
|
+
You may add Your own copyright statement to Your modifications and
|
|
125
|
+
may provide additional or different license terms and conditions
|
|
126
|
+
for use, reproduction, or distribution of Your modifications, or
|
|
127
|
+
for any such Derivative Works as a whole, provided Your use,
|
|
128
|
+
reproduction, and distribution of the Work otherwise complies with
|
|
129
|
+
the conditions stated in this License.
|
|
130
|
+
|
|
131
|
+
5. Submission of Contributions. Unless You explicitly state otherwise,
|
|
132
|
+
any Contribution intentionally submitted for inclusion in the Work
|
|
133
|
+
by You to the Licensor shall be under the terms and conditions of
|
|
134
|
+
this License, without any additional terms or conditions.
|
|
135
|
+
Notwithstanding the above, nothing herein shall supersede or modify
|
|
136
|
+
the terms of any separate license agreement you may have executed
|
|
137
|
+
with Licensor regarding such Contributions.
|
|
138
|
+
|
|
139
|
+
6. Trademarks. This License does not grant permission to use the trade
|
|
140
|
+
names, trademarks, service marks, or product names of the Licensor,
|
|
141
|
+
except as required for reasonable and customary use in describing the
|
|
142
|
+
origin of the Work and reproducing the content of the NOTICE file.
|
|
143
|
+
|
|
144
|
+
7. Disclaimer of Warranty. Unless required by applicable law or
|
|
145
|
+
agreed to in writing, Licensor provides the Work (and each
|
|
146
|
+
Contributor provides its Contributions) on an "AS IS" BASIS,
|
|
147
|
+
WITHOUT WARRANTIES OR CONDITIONS OF ANY KIND, either express or
|
|
148
|
+
implied, including, without limitation, any warranties or conditions
|
|
149
|
+
of TITLE, NON-INFRINGEMENT, MERCHANTABILITY, or FITNESS FOR A
|
|
150
|
+
PARTICULAR PURPOSE. You are solely responsible for determining the
|
|
151
|
+
appropriateness of using or redistributing the Work and assume any
|
|
152
|
+
risks associated with Your exercise of permissions under this License.
|
|
153
|
+
|
|
154
|
+
8. Limitation of Liability. In no event and under no legal theory,
|
|
155
|
+
whether in tort (including negligence), contract, or otherwise,
|
|
156
|
+
unless required by applicable law (such as deliberate and grossly
|
|
157
|
+
negligent acts) or agreed to in writing, shall any Contributor be
|
|
158
|
+
liable to You for damages, including any direct, indirect, special,
|
|
159
|
+
incidental, or consequential damages of any character arising as a
|
|
160
|
+
result of this License or out of the use or inability to use the
|
|
161
|
+
Work (including but not limited to damages for loss of goodwill,
|
|
162
|
+
work stoppage, computer failure or malfunction, or any and all
|
|
163
|
+
other commercial damages or losses), even if such Contributor
|
|
164
|
+
has been advised of the possibility of such damages.
|
|
165
|
+
|
|
166
|
+
9. Accepting Warranty or Additional Liability. While redistributing
|
|
167
|
+
the Work or Derivative Works thereof, You may choose to offer,
|
|
168
|
+
and charge a fee for, acceptance of support, warranty, indemnity,
|
|
169
|
+
or other liability obligations and/or rights consistent with this
|
|
170
|
+
License. However, in accepting such obligations, You may act only
|
|
171
|
+
on Your own behalf and on Your sole responsibility, not on behalf
|
|
172
|
+
of any other Contributor, and only if You agree to indemnify,
|
|
173
|
+
defend, and hold each Contributor harmless for any liability
|
|
174
|
+
incurred by, or claims asserted against, such Contributor by reason
|
|
175
|
+
of your accepting any such warranty or additional liability.
|
|
176
|
+
|
|
177
|
+
END OF TERMS AND CONDITIONS
|
|
178
|
+
|
|
179
|
+
Copyright 2026 Antonio Ramasco
|
|
180
|
+
|
|
181
|
+
Licensed under the Apache License, Version 2.0 (the "License");
|
|
182
|
+
you may not use this file except in compliance with the License.
|
|
183
|
+
You may obtain a copy of the License at
|
|
184
|
+
|
|
185
|
+
http://www.apache.org/licenses/LICENSE-2.0
|
|
186
|
+
|
|
187
|
+
Unless required by applicable law or agreed to in writing, software
|
|
188
|
+
distributed under the License is distributed on an "AS IS" BASIS,
|
|
189
|
+
WITHOUT WARRANTIES OR CONDITIONS OF ANY KIND, either express or implied.
|
|
190
|
+
See the License for the specific language governing permissions and
|
|
191
|
+
limitations under the License.
|
package/NOTICE
ADDED
|
@@ -0,0 +1,8 @@
|
|
|
1
|
+
react-beauti-graph by Antonio Ramasco
|
|
2
|
+
Copyright 2026 Antonio Ramasco
|
|
3
|
+
|
|
4
|
+
This product includes software developed by Antonio Ramasco
|
|
5
|
+
(https://github.com/ramasco/react-beauti-graph).
|
|
6
|
+
|
|
7
|
+
Any distribution or product that uses react-beauti-graph must include this
|
|
8
|
+
attribution notice, as required by section 4(d) of the Apache License 2.0.
|
package/README.md
CHANGED
|
@@ -1,3 +1,400 @@
|
|
|
1
|
-
#
|
|
1
|
+
# react-beauti-graph
|
|
2
2
|
|
|
3
|
-
|
|
3
|
+
**react-beauti-graph by Antonio Ramasco**
|
|
4
|
+
|
|
5
|
+
A React component for drawing report dependency graphs with [Cytoscape](https://js.cytoscape.org/).
|
|
6
|
+
Give it your reports, the groups they belong to and the connections between them; it draws the graph
|
|
7
|
+
on a grid and adds search, tracing of parents and children, a details panel, clipboard export and SVG export.
|
|
8
|
+
|
|
9
|
+
|
|
10
|
+
|
|
11
|
+
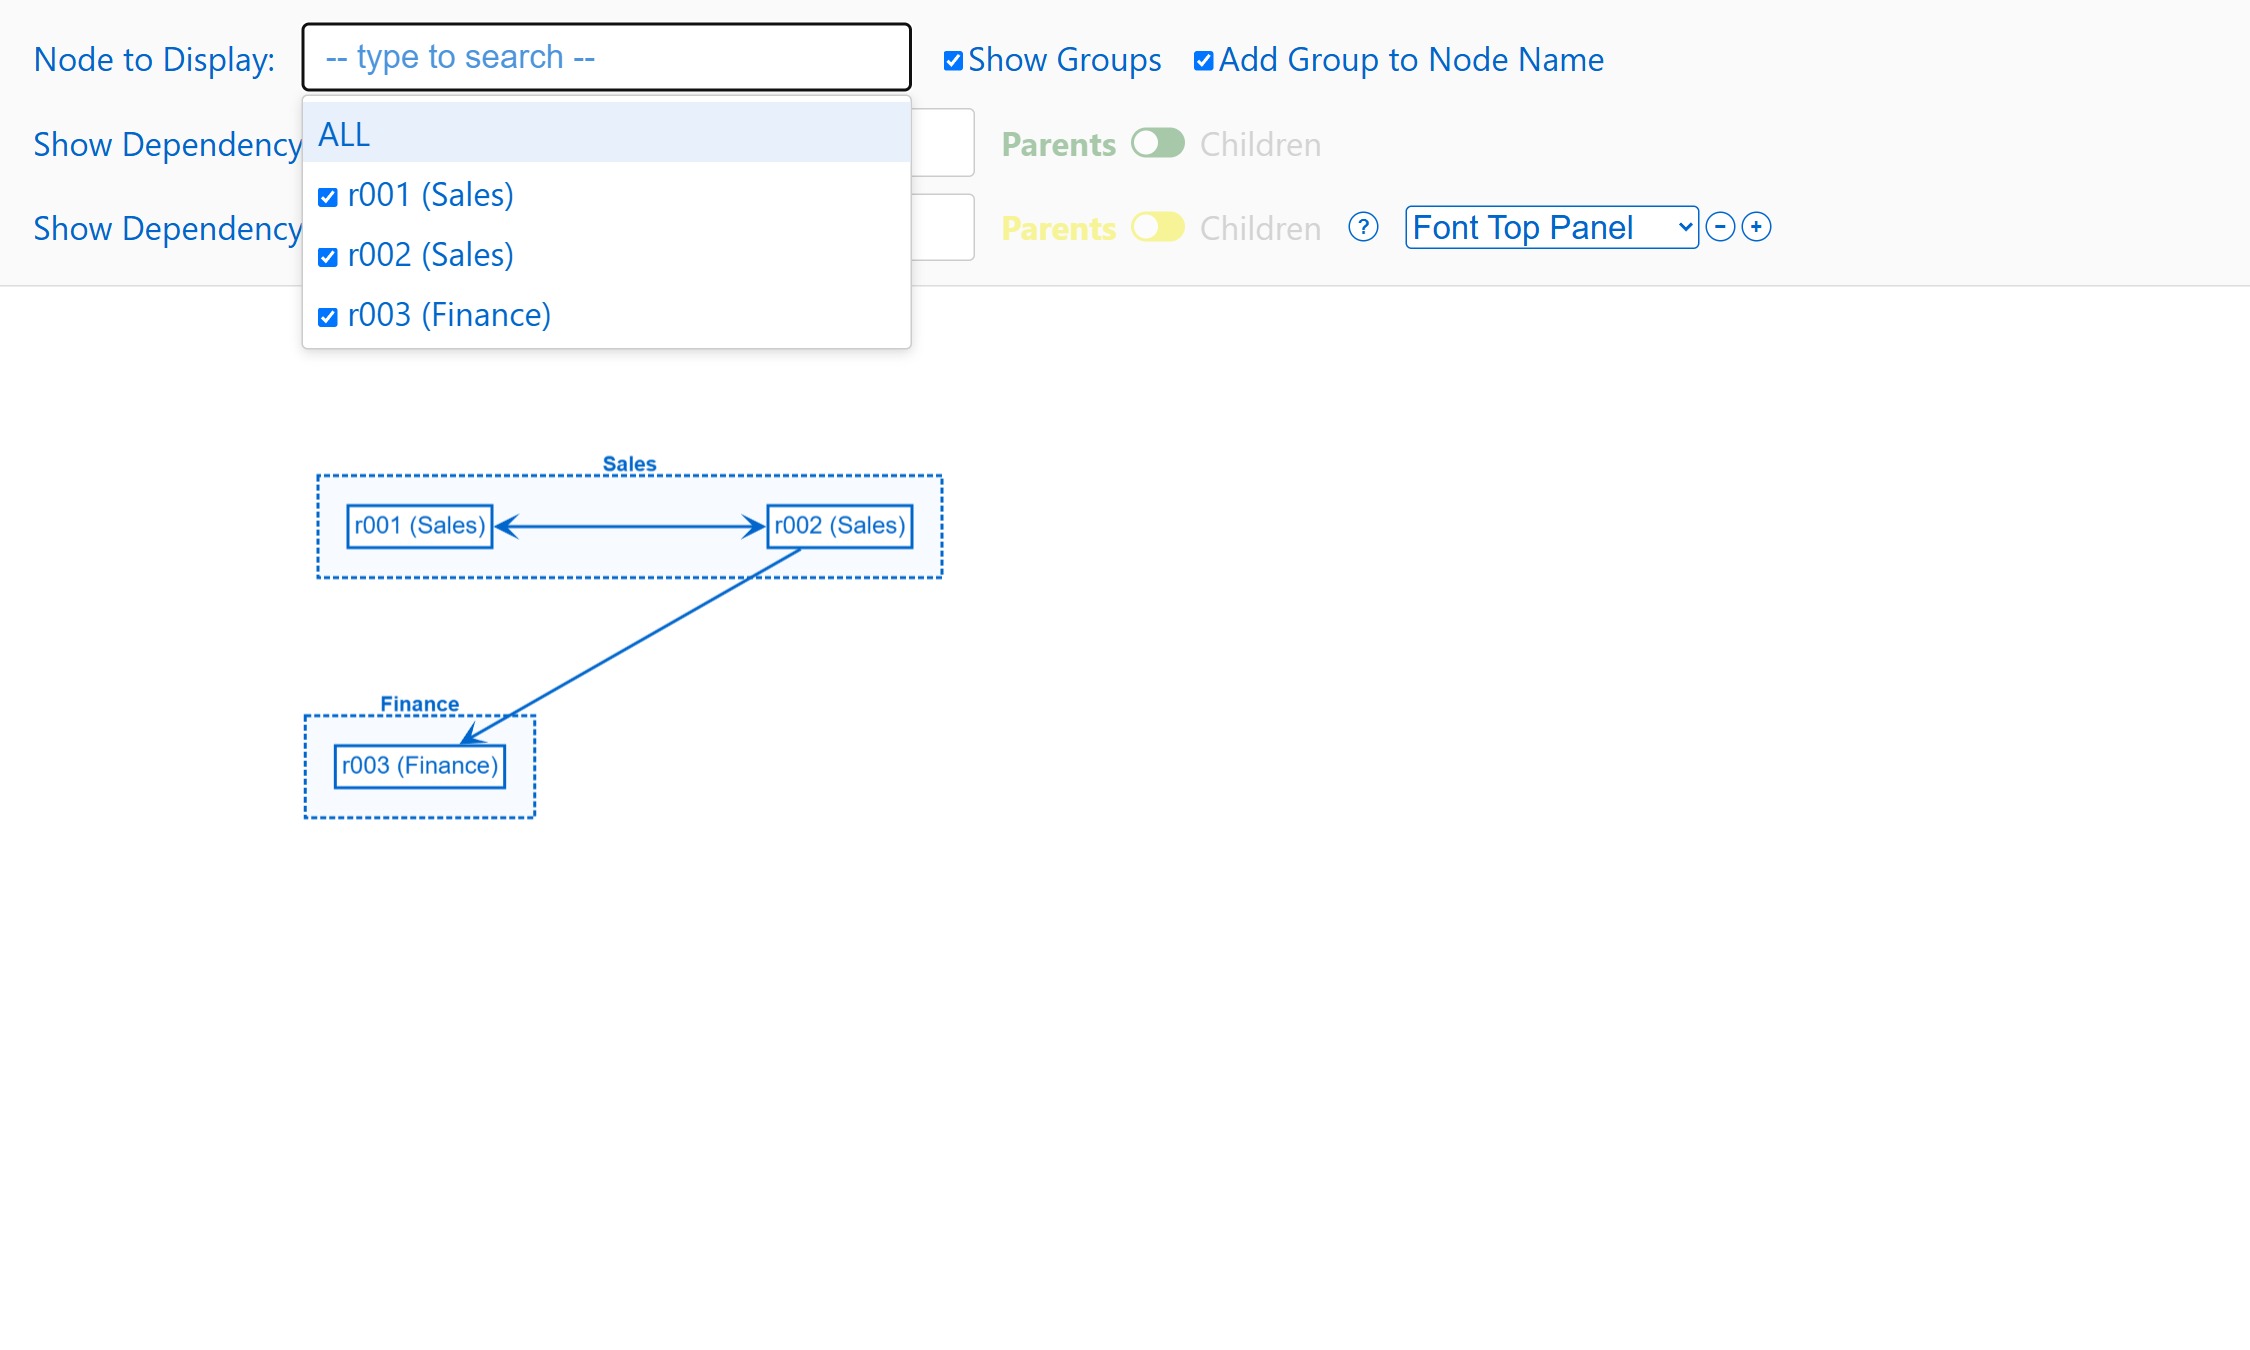
_The [quick start](#quick-start) example, with the_ Node to Display _list open._
|
|
12
|
+
|
|
13
|
+
## Contents
|
|
14
|
+
|
|
15
|
+
- [Features](#features)
|
|
16
|
+
- [Release notes](#release-notes)
|
|
17
|
+
- [Install](#install)
|
|
18
|
+
- [Quick start](#quick-start)
|
|
19
|
+
- [Frameworks](#frameworks)
|
|
20
|
+
- [Your data](#your-data)
|
|
21
|
+
- [Options](#options)
|
|
22
|
+
- [Using the graph](#using-the-graph)
|
|
23
|
+
- [Node to Display and the details panel](#node-to-display-and-the-details-panel)
|
|
24
|
+
- [Filter out nodes](#filter-out-nodes)
|
|
25
|
+
- [Show Dependency](#show-dependency)
|
|
26
|
+
- [Text size](#text-size)
|
|
27
|
+
- [All controls](#all-controls)
|
|
28
|
+
- [Styling](#styling)
|
|
29
|
+
- [Other exports](#other-exports)
|
|
30
|
+
- [Development](#development)
|
|
31
|
+
- [License and credits](#license-and-credits)
|
|
32
|
+
|
|
33
|
+
## Features
|
|
34
|
+
|
|
35
|
+
- **Groups** drawn as dashed boxes around their reports; a report can be in several groups
|
|
36
|
+
- **Automatic grid layout** built from the groups, or your own layout row by row
|
|
37
|
+
- **Arrows** for connections: `[a, b]` + `[b, a]` become one line with arrows at both ends; `[a, a]` is drawn as a loop
|
|
38
|
+
- **Node to Display**: partial, case-insensitive search; jumps to the report and opens its details
|
|
39
|
+
- **Filter out nodes**: a checkbox next to each report in the _Node to Display_ list shows or hides it
|
|
40
|
+
- **Show Dependency 1 and 2**: highlight the whole chain of parents or children of a report in two colors, and dim the rest
|
|
41
|
+
- **Details panel** (double click): the report, its group, its parents and children, one level or all levels; click a name to jump to it
|
|
42
|
+
- **Save to clipboard** (right click): copies the same information as the details panel
|
|
43
|
+
- **Export SVG** button: downloads the whole graph as a vector `graph.svg` file (a static image, not interactive)
|
|
44
|
+
- **Text size buttons** (− / +) for the top row, the details panel and the graph
|
|
45
|
+
- **Configurable** colors, text sizes and grid spacing
|
|
46
|
+
|
|
47
|
+
## Release notes
|
|
48
|
+
|
|
49
|
+
### 1.3.1
|
|
50
|
+
|
|
51
|
+
- **Export SVG**: a blue button at the right end of the top row saves the whole graph (not only the visible part) as `graph.svg`, using [`cytoscape-svg`](https://github.com/kinimesi/cytoscape-svg), which is now a dependency. The graph is still drawn on canvas; the SVG is an export only.
|
|
52
|
+
- **Top row layout**: the text size dropdown with − / + and _Export SVG_ sit together at the right end of the row, after the _?_ help
|
|
53
|
+
- **`downloadSvg(cy)`**: the same export, available in code (takes a Cytoscape core instance)
|
|
54
|
+
- Typecheck, lint, format check and all 85 tests pass (`npm run check`)
|
|
55
|
+
|
|
56
|
+
### 1.3.0
|
|
57
|
+
|
|
58
|
+
- **Report boxes fit their text**: each box is as big as its label plus a little padding (it was a fixed 200 × 60); the _Font Graph Panel_ − / + buttons resize the boxes with the text
|
|
59
|
+
- Built and type-checked with TypeScript 7; dependencies updated
|
|
60
|
+
- **Show Dependency 1 and 2**: two independent chains of parents or children, each with its own colors; reports and arrows on both use `commonColor`
|
|
61
|
+
- **Details panel**: _One level / All levels_ switch, also used by _Save to clipboard_
|
|
62
|
+
- **Text size**: dropdown with − / + buttons for the top row, the details panel and the graph
|
|
63
|
+
- **Renamed controls**: _Node to Display_, _Show Dependency_, _Show Nothing_
|
|
64
|
+
- **`node_groups`** is the name of the first `create_graph` argument (it was `folders`; the argument is positional, so existing calls keep working)
|
|
65
|
+
- **TypeScript**: written in strict TypeScript, with generated type definitions for ESM and CommonJS
|
|
66
|
+
- **Example app**: now a separate project in `examples/` (Vite); Next.js is no longer used
|
|
67
|
+
|
|
68
|
+
## Install
|
|
69
|
+
|
|
70
|
+
From the [GitHub release](https://github.com/ramasco/react-beauti-graph/releases/latest):
|
|
71
|
+
|
|
72
|
+
```bash
|
|
73
|
+
npm install https://github.com/ramasco/react-beauti-graph/releases/download/v1.3.1/react-beauti-graph-1.3.1.tgz
|
|
74
|
+
```
|
|
75
|
+
|
|
76
|
+
Requires React 18 or newer. Cytoscape is installed automatically.
|
|
77
|
+
|
|
78
|
+
Want to try it first? The example app in `examples/` runs the graph with sample data: see [Development](#development).
|
|
79
|
+
|
|
80
|
+
## Quick start
|
|
81
|
+
|
|
82
|
+
```jsx
|
|
83
|
+
import { create_graph } from 'react-beauti-graph';
|
|
84
|
+
import 'react-beauti-graph/style.css';
|
|
85
|
+
|
|
86
|
+
// Reports inside each group
|
|
87
|
+
const node_groups = { Sales: ['r001', 'r002'], Finance: ['r003'] };
|
|
88
|
+
|
|
89
|
+
// Arrows: [source, target]
|
|
90
|
+
const direct_node_connections = [
|
|
91
|
+
['r001', 'r002'],
|
|
92
|
+
['r002', 'r001'],
|
|
93
|
+
['r002', 'r003'],
|
|
94
|
+
];
|
|
95
|
+
|
|
96
|
+
// Create the component once, outside your own components
|
|
97
|
+
const MyGraph = create_graph(node_groups, direct_node_connections, { offsetX: 280, offsetY: 160 });
|
|
98
|
+
|
|
99
|
+
export default function Page() {
|
|
100
|
+
// The graph fills its container, so give the container a height
|
|
101
|
+
return (
|
|
102
|
+
<div style={{ height: '100vh' }}>
|
|
103
|
+
<MyGraph />
|
|
104
|
+
</div>
|
|
105
|
+
);
|
|
106
|
+
}
|
|
107
|
+
```
|
|
108
|
+
|
|
109
|
+
### Frameworks
|
|
110
|
+
|
|
111
|
+
Plain React (Vite, Create React App, Remix, Gatsby, ...) needs nothing special: install the package and
|
|
112
|
+
import `react-beauti-graph/style.css` once.
|
|
113
|
+
|
|
114
|
+
**Next.js (App Router):** the library is marked `'use client'`, so it can be imported from any component.
|
|
115
|
+
It draws in the browser only, so call `create_graph` and render `<MyGraph />` inside a client component
|
|
116
|
+
(a file starting with `'use client'`), not in a server component.
|
|
117
|
+
|
|
118
|
+
**TypeScript:** type definitions are included (`create_graph` and its options, `getNodeInfo`, `formatNodeInfo`, `NodeSearch`).
|
|
119
|
+
|
|
120
|
+
## Your data
|
|
121
|
+
|
|
122
|
+
```js
|
|
123
|
+
create_graph(node_groups, direct_node_connections, [layout], [options]);
|
|
124
|
+
```
|
|
125
|
+
|
|
126
|
+
Returns a React component (no props). Call it once, at the top level of a module: calling it inside a
|
|
127
|
+
component would rebuild the graph on every render.
|
|
128
|
+
|
|
129
|
+
### `node_groups`
|
|
130
|
+
|
|
131
|
+
`{ [groupName]: string[] }`: the report names inside each group.
|
|
132
|
+
|
|
133
|
+
```js
|
|
134
|
+
{ Sales: ['r001', 'r002'], Finance: ['r003'] }
|
|
135
|
+
```
|
|
136
|
+
|
|
137
|
+
- A report listed in **several groups** is drawn once in each. The copies are named `r001(1)`, `r001(2)`, …;
|
|
138
|
+
arrows connect to the first one.
|
|
139
|
+
- Reports that appear only in `direct_node_connections` are drawn without a group.
|
|
140
|
+
|
|
141
|
+
### `direct_node_connections`
|
|
142
|
+
|
|
143
|
+
`[source, target][]`: one arrow from `source` to `target`.
|
|
144
|
+
|
|
145
|
+
| You write | You get |
|
|
146
|
+
| ----------------------------- | ------------------------------------------------------------------------------- |
|
|
147
|
+
| `['a', 'b']` | an arrow from `a` to `b`: `a` is a **parent** of `b`, `b` is a **child** of `a` |
|
|
148
|
+
| `['a', 'b']` and `['b', 'a']` | one line with arrows at both ends |
|
|
149
|
+
| `['a', 'a']` | a loop on `a` |
|
|
150
|
+
| the same pair twice | one arrow |
|
|
151
|
+
|
|
152
|
+
### `layout` (optional)
|
|
153
|
+
|
|
154
|
+
Where each report sits, as a grid: one inner list per row, top to bottom.
|
|
155
|
+
|
|
156
|
+
```js
|
|
157
|
+
[
|
|
158
|
+
['r001', 'r002'], // row 1
|
|
159
|
+
['r003'], // row 2
|
|
160
|
+
];
|
|
161
|
+
```
|
|
162
|
+
|
|
163
|
+
**Leave it out** and the layout is built from the groups: each group starts a new row and fills rows of
|
|
164
|
+
at most `layoutColumns` reports (default 10); reports in no group come last.
|
|
165
|
+
|
|
166
|
+
```js
|
|
167
|
+
create_graph(node_groups, direct_node_connections, options); // layout built from the groups
|
|
168
|
+
create_graph(node_groups, direct_node_connections, layout, options); // your own layout
|
|
169
|
+
```
|
|
170
|
+
|
|
171
|
+
When you give your own layout:
|
|
172
|
+
|
|
173
|
+
- Report _n_ of row _r_ is placed at `x = startX + n × offsetX`, `y = startY + r × offsetY` (counting from 1).
|
|
174
|
+
- Put every report in it: a report that is missing has no grid position.
|
|
175
|
+
- Reports listed only in the layout are still drawn.
|
|
176
|
+
- Place the copies of a report that is in several groups with their names: `r001(1)`, …
|
|
177
|
+
- Names that match no report are skipped, and a report listed twice keeps its first position
|
|
178
|
+
(both with a warning in the browser console).
|
|
179
|
+
|
|
180
|
+
## Options
|
|
181
|
+
|
|
182
|
+
All optional.
|
|
183
|
+
|
|
184
|
+
| Option | Default | Description |
|
|
185
|
+
| ---------------------- | -------------------- | ---------------------------------------------------------------------------- |
|
|
186
|
+
| `offsetX` | `200` | Horizontal distance between grid columns, in pixels |
|
|
187
|
+
| `offsetY` | `200` | Vertical distance between grid rows, in pixels |
|
|
188
|
+
| `startX`, `startY` | `0` | Position of the grid origin, in pixels |
|
|
189
|
+
| `base` | `1` | Number of the first row and column (`0` puts the first report on the origin) |
|
|
190
|
+
| `layoutColumns` | `10` | Reports per row when the layout is built from the groups |
|
|
191
|
+
| `selectedColor` | `'#e91e63'` (pink) | Highlight of the report picked in _Node to Display_ |
|
|
192
|
+
| `parentsColor` | `'#2e7d32'` (green) | _Show Dependency 1_: chain of parents |
|
|
193
|
+
| `childrenColor` | `'#7b1fa2'` (purple) | _Show Dependency 1_: chain of children |
|
|
194
|
+
| `track2ParentsColor` | `'#efeb00'` (yellow) | _Show Dependency 2_: chain of parents |
|
|
195
|
+
| `track2ChildrenColor` | `'#8b4513'` (brown) | _Show Dependency 2_: chain of children |
|
|
196
|
+
| `commonColor` | `'#ef6c00'` (orange) | Reports and arrows on both _Show Dependency_ chains |
|
|
197
|
+
| `topControlsFontSize` | `'22px'` | Text size of the top row; its spacing grows with it |
|
|
198
|
+
| `rightDisplayFontSize` | `'18px'` | Text size of the details panel |
|
|
199
|
+
|
|
200
|
+
The option names keep the older "track" wording: `parentsColor` and `childrenColor` are for _Show Dependency 1_, and the `track2…` options are for _Show Dependency 2_.
|
|
201
|
+
|
|
202
|
+
Colors are `#rrggbb` or `rgb(239, 108, 0)` strings; sizes are any CSS length
|
|
203
|
+
(`'16px'`, `'1rem'`, …). All the defaults live in `src/default_setting.ts`.
|
|
204
|
+
|
|
205
|
+
```js
|
|
206
|
+
const MyGraph = create_graph(node_groups, direct_node_connections, {
|
|
207
|
+
offsetX: 280,
|
|
208
|
+
offsetY: 160,
|
|
209
|
+
parentsColor: '#1565c0',
|
|
210
|
+
childrenColor: '#ef6c00',
|
|
211
|
+
topControlsFontSize: '16px',
|
|
212
|
+
});
|
|
213
|
+
```
|
|
214
|
+
|
|
215
|
+
## Using the graph
|
|
216
|
+
|
|
217
|
+
### Node to Display and the details panel
|
|
218
|
+
|
|
219
|
+
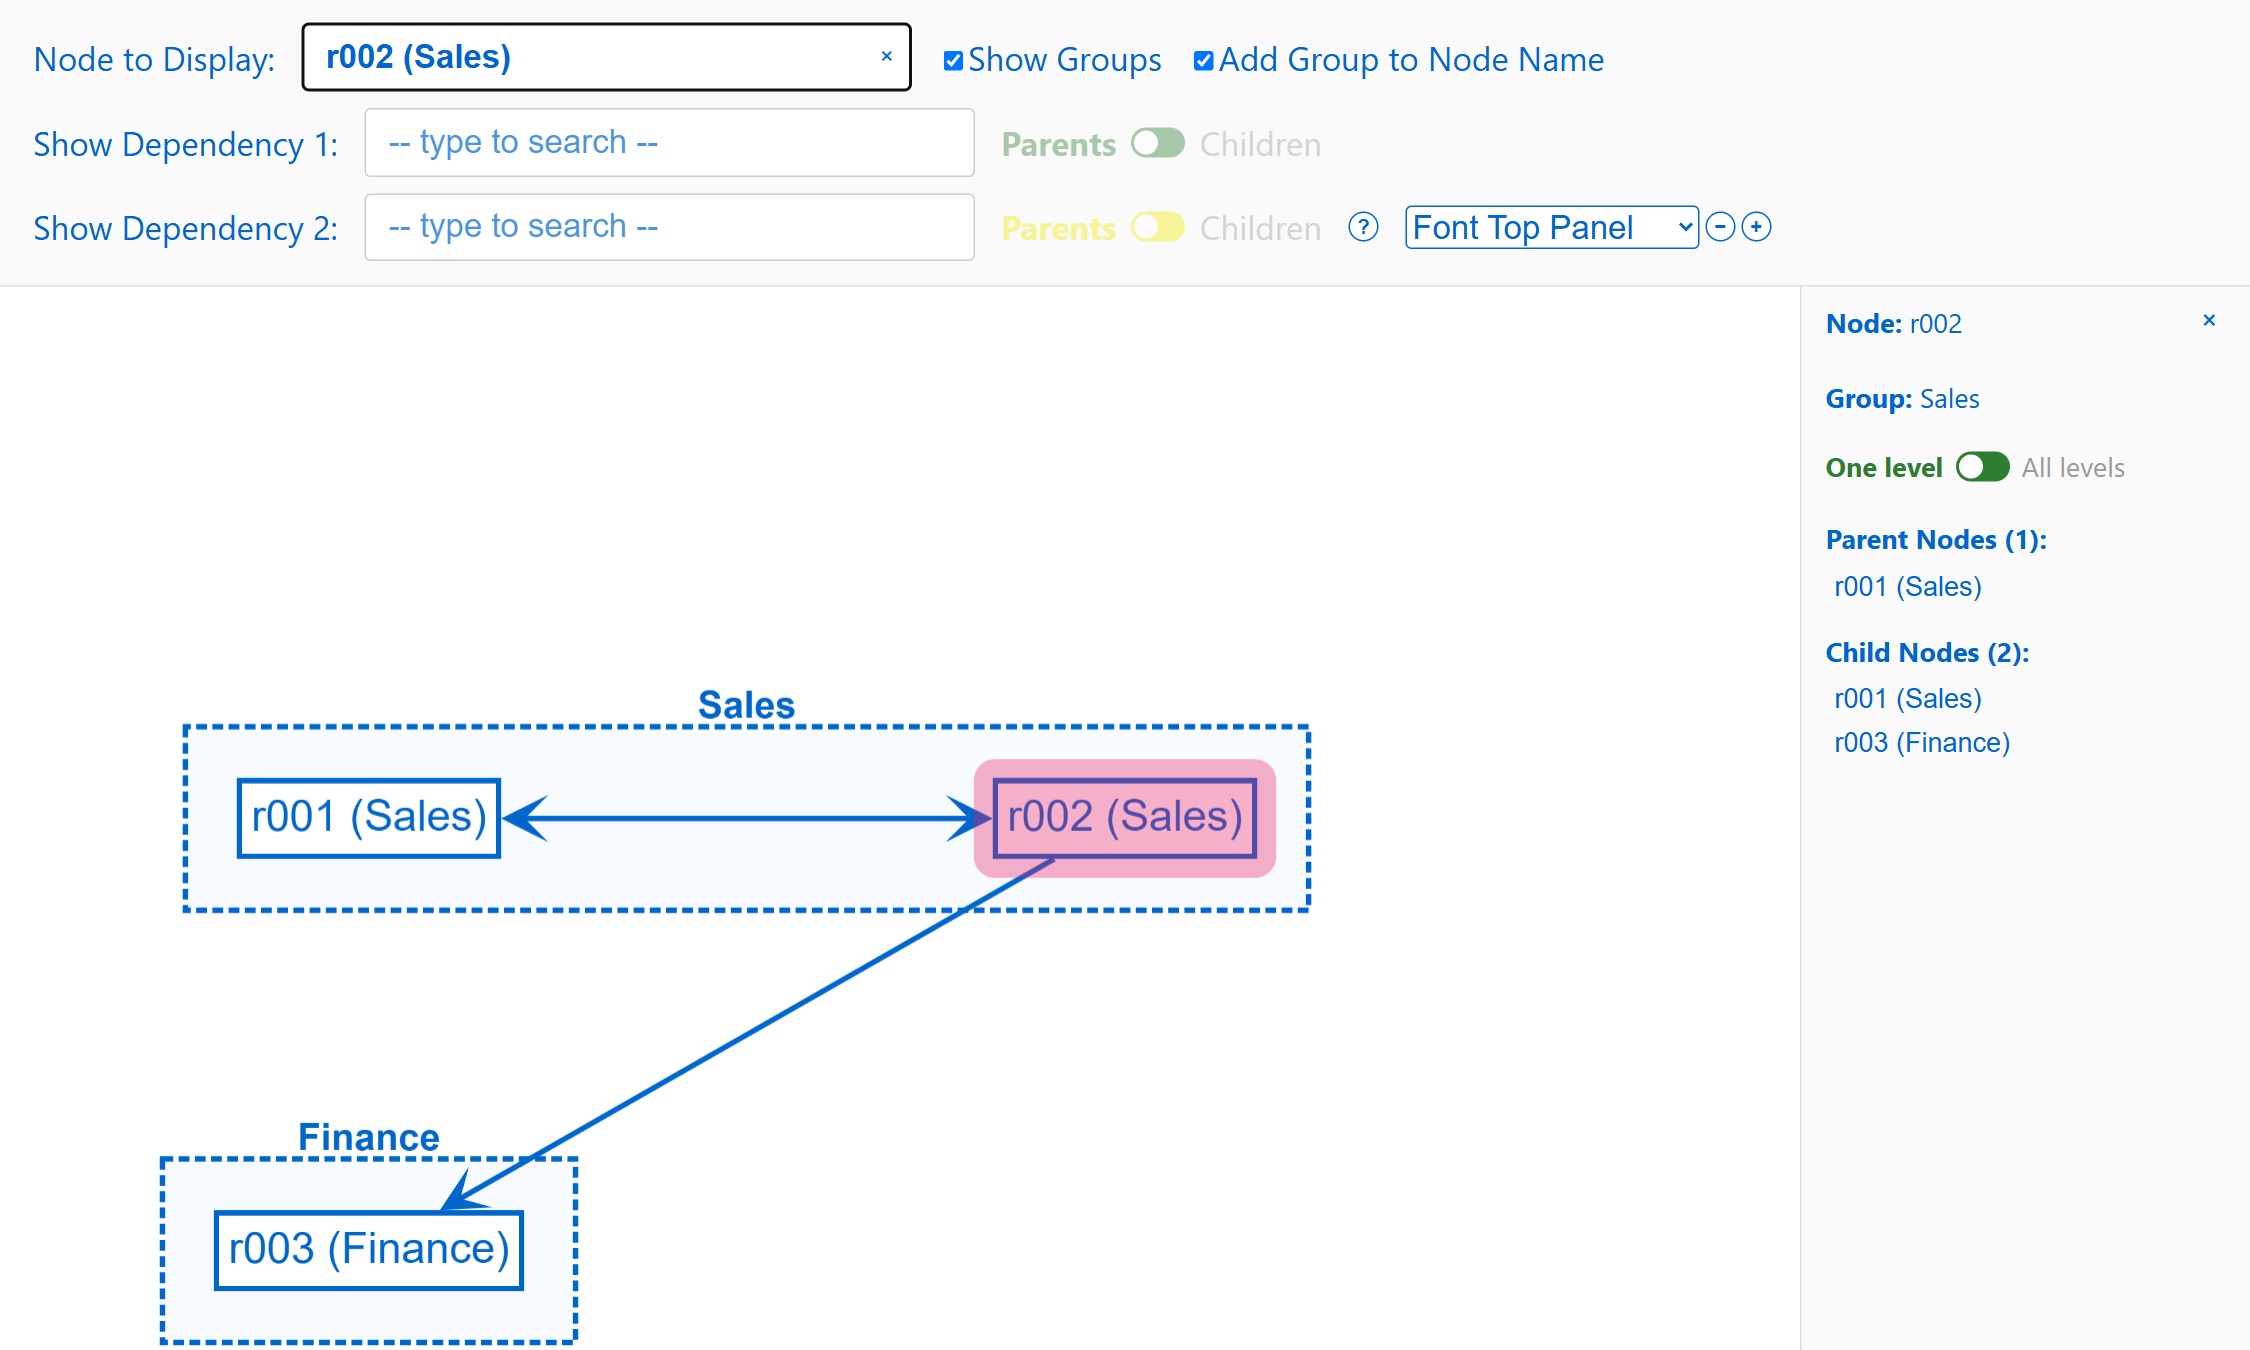
Pick a report in _Node to Display_, or double click it: the graph zooms to it, highlights it in pink and opens
|
|
220
|
+
the details panel on the right with its group, its parent reports (arrows pointing to it) and its child
|
|
221
|
+
reports (arrows leaving it). Click a name in the panel to jump to that report.
|
|
222
|
+
|
|
223
|
+
Under the group, the **One level / All levels** switch (_One level_ at first) chooses what the lists show:
|
|
224
|
+
_One level_ lists the direct parents and children only; _All levels_ lists every report above it (parents of
|
|
225
|
+
parents, …) and every report below it (children of children, …). The choice also applies to _Save to clipboard_.
|
|
226
|
+
|
|
227
|
+
|
|
228
|
+
|
|
229
|
+
_`r002` selected. `r001` is both a parent and a child because of the two-way arrow._
|
|
230
|
+
|
|
231
|
+
### Filter out nodes
|
|
232
|
+
|
|
233
|
+
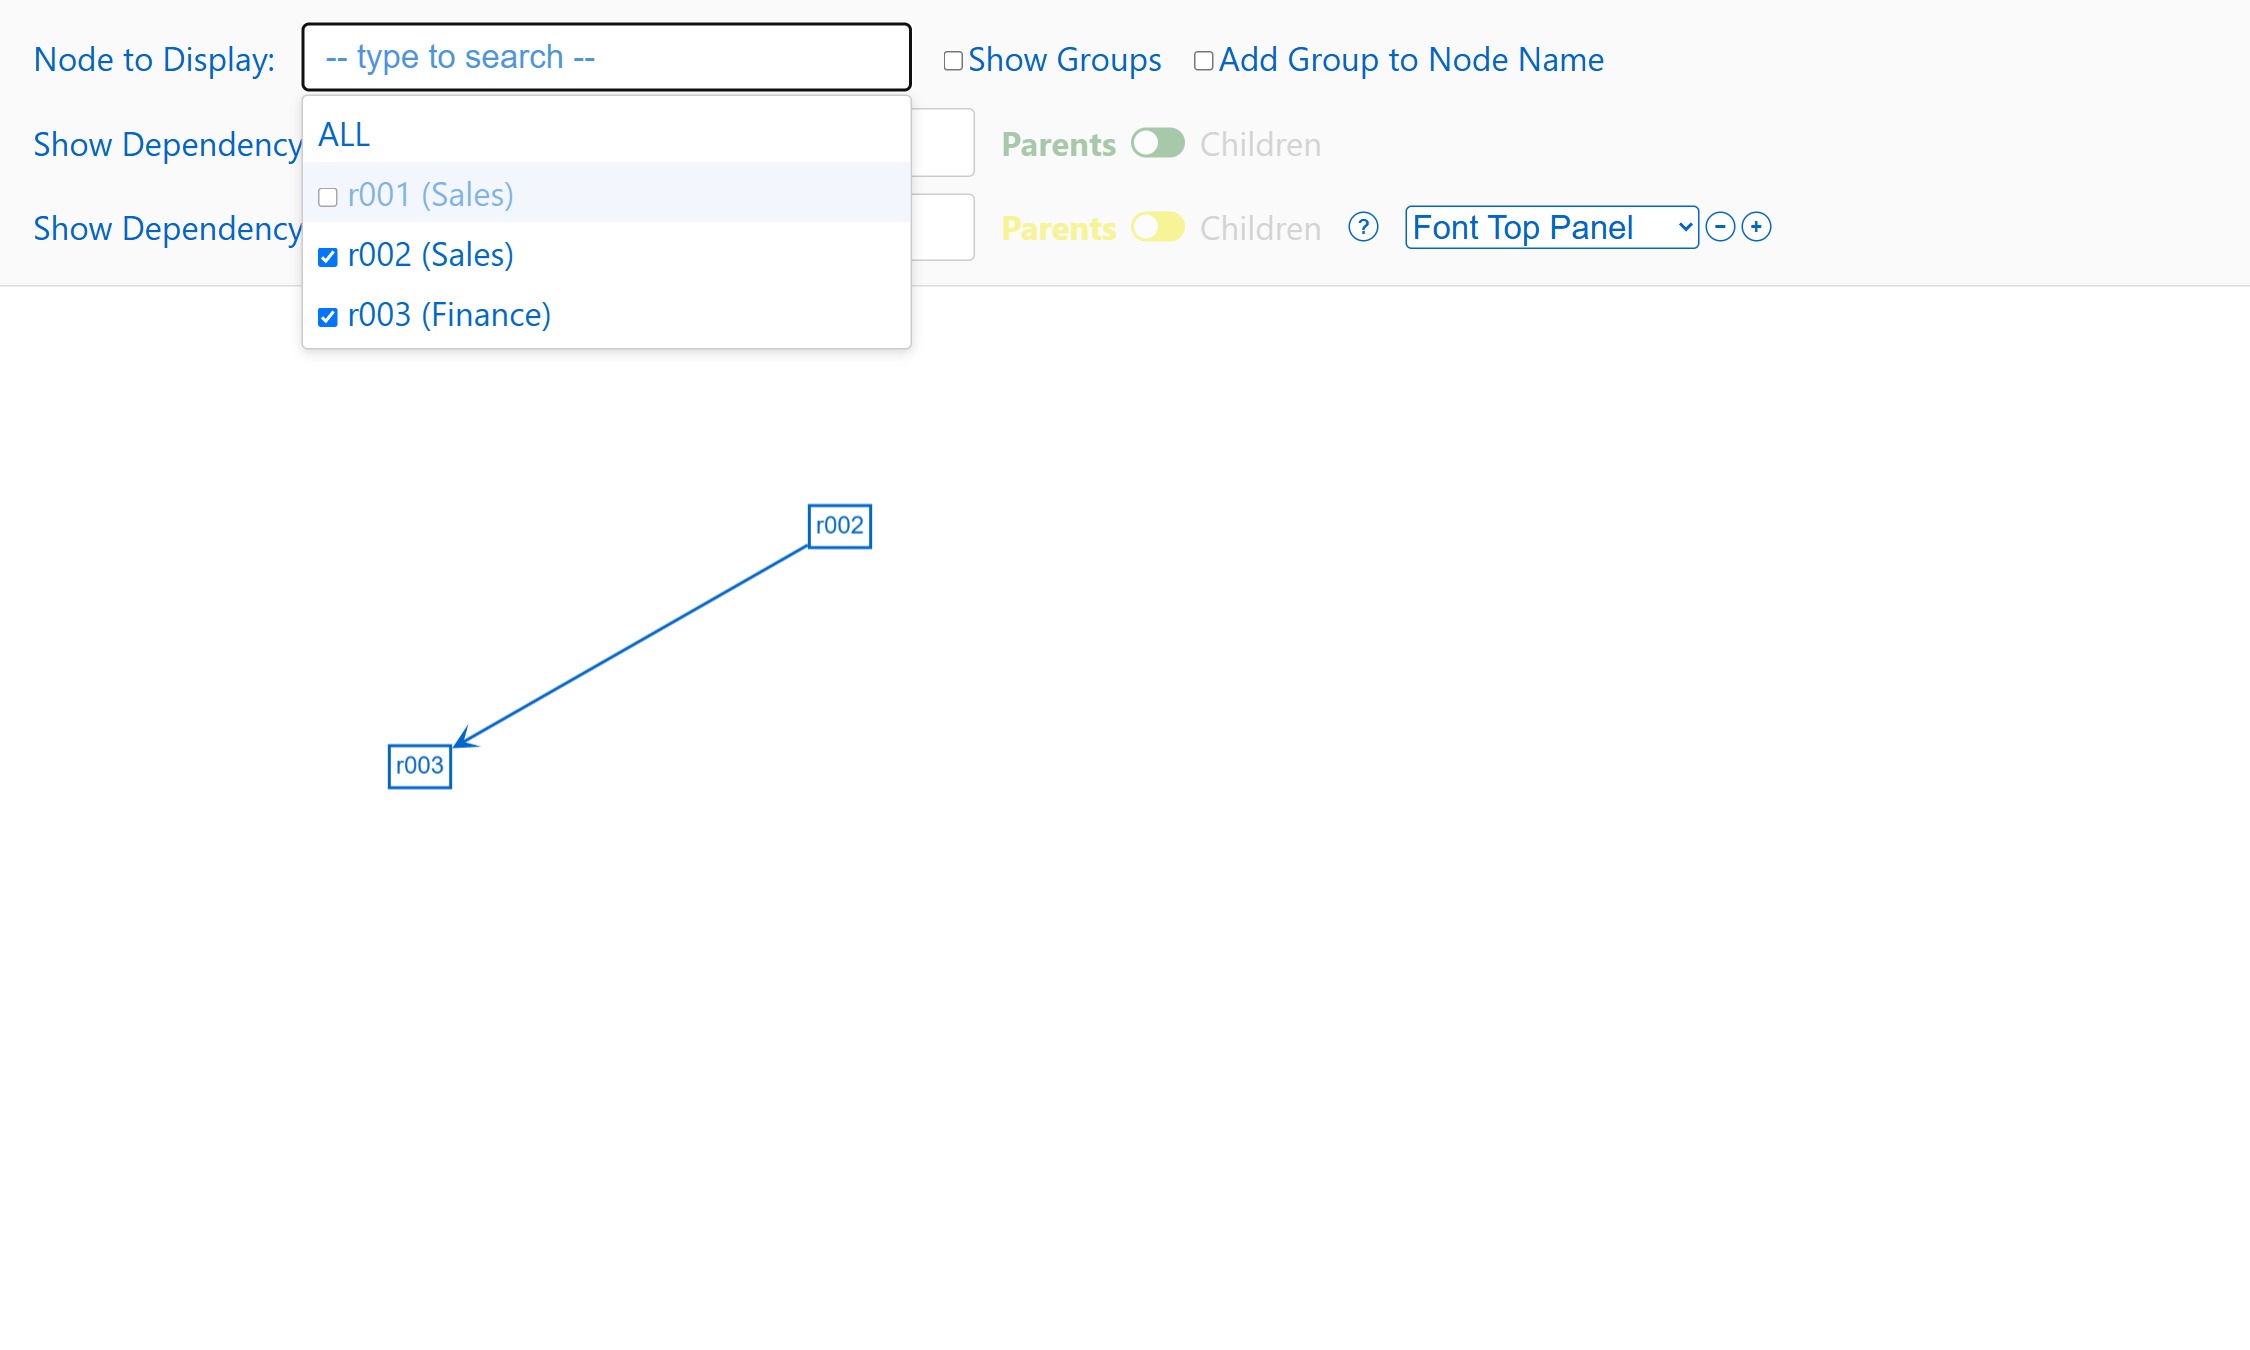
Each report in the _Node to Display_ list has a checkbox, checked at first. Uncheck it to remove the report
|
|
234
|
+
and its arrows from the graph; check it again to bring them back. A group whose reports are all unchecked
|
|
235
|
+
disappears too. Hidden reports stay in the list, greyed out.
|
|
236
|
+
|
|
237
|
+
Clicking a checkbox does not select the report and keeps the list open, so you can hide several in a row.
|
|
238
|
+
Picking a hidden report by name shows it again, and _ALL_ zooms to fit the reports that are shown.
|
|
239
|
+
|
|
240
|
+
|
|
241
|
+
|
|
242
|
+
_`r001` unchecked, with_ Show Groups _and_ Add Group to Node Name _turned off: only `r002 → r003` is left._
|
|
243
|
+
|
|
244
|
+
### Show Dependency
|
|
245
|
+
|
|
246
|
+
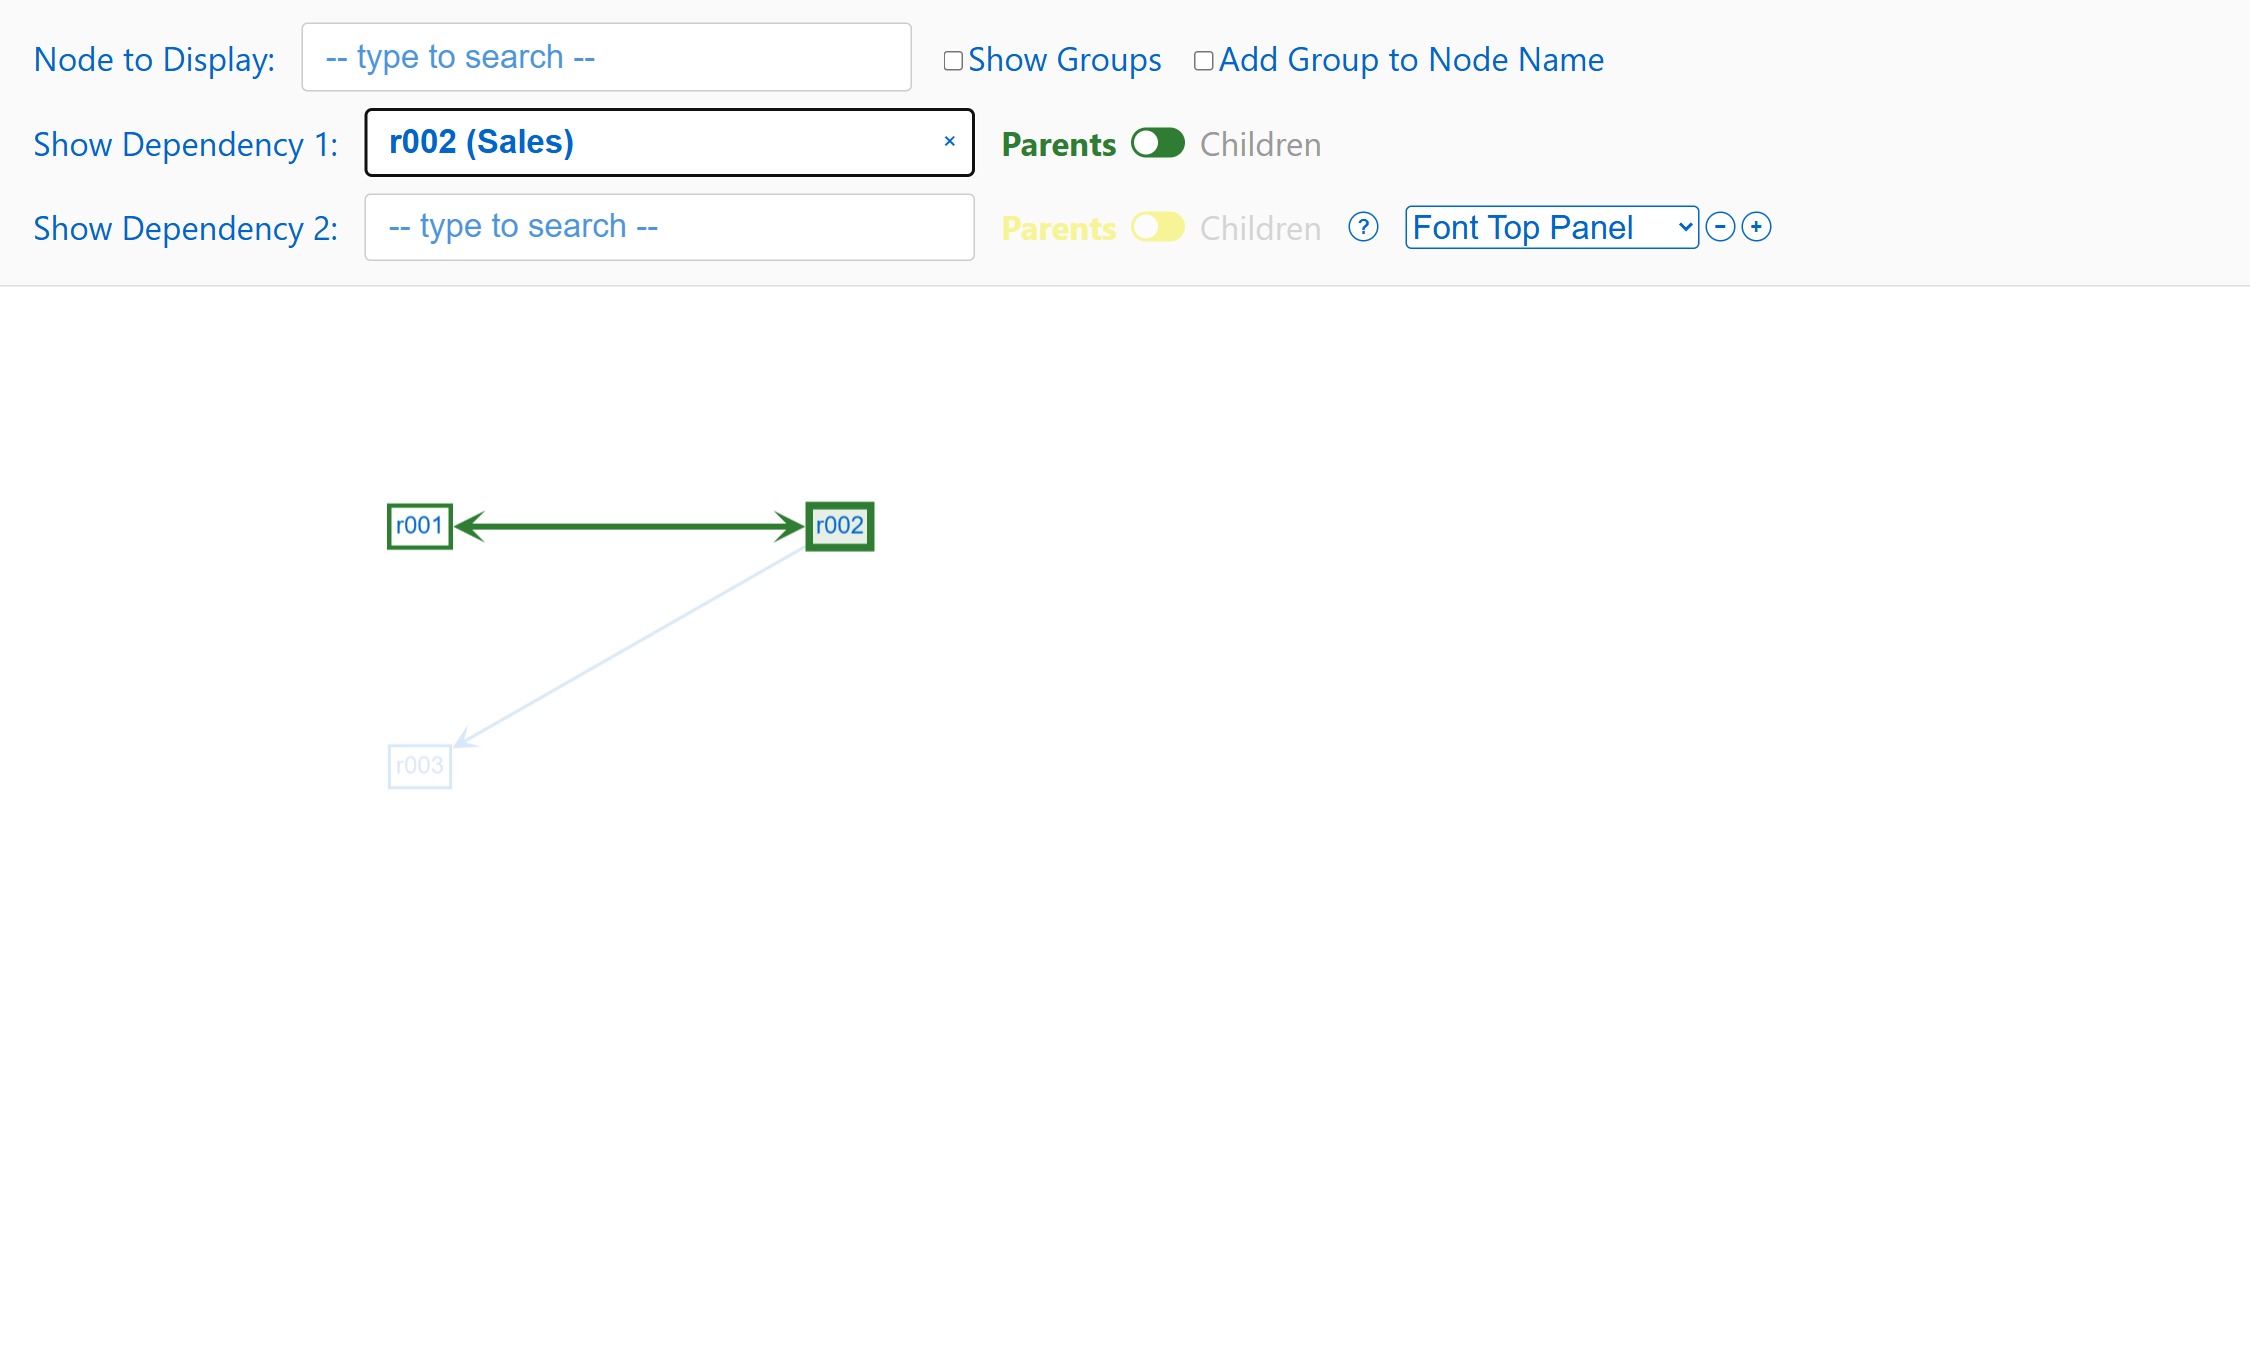
Pick a report in _Show Dependency 1_ to follow its whole chain, not just its direct neighbours: with _Parents_,
|
|
247
|
+
the reports pointing to it, the reports pointing to those, and so on; with _Children_, the same in the
|
|
248
|
+
other direction. The chain is drawn in the track's parents or children color (green or purple by default), the tracked report is
|
|
249
|
+
filled, and everything else is dimmed.
|
|
250
|
+
|
|
251
|
+
_Show Dependency 2_ works the same way with its own _Parents / Children_ switch and its own colors
|
|
252
|
+
(yellow and brown by default), so two chains can be compared. Reports and arrows on both
|
|
253
|
+
chains are drawn in the common color (`commonColor`, orange by default).
|
|
254
|
+
|
|
255
|
+
|
|
256
|
+
|
|
257
|
+
_Parents of `r002`, with_ Show Groups _and_ Add Group to Node Name _turned off._
|
|
258
|
+
|
|
259
|
+
### Text size
|
|
260
|
+
|
|
261
|
+
The dropdown and the **−** / **+** buttons at the end of the top row change the text size while you look
|
|
262
|
+
at the graph. Pick what to resize in the dropdown, then click **−** or **+**:
|
|
263
|
+
|
|
264
|
+
| Dropdown | What changes |
|
|
265
|
+
| ------------------------------- | -------------------------------------------------------------------------------------------------- |
|
|
266
|
+
| _Font Top Panel_ (first choice) | The top row: labels, search boxes, switches and buttons |
|
|
267
|
+
| _Font Right Panel_ | The details panel (open it by double clicking a report) |
|
|
268
|
+
| _Font Graph Panel_ | The text in the graph: report names and group names. The report boxes grow or shrink with the text |
|
|
269
|
+
|
|
270
|
+
- Each click changes the size by 2px, from 8px smaller to 16px larger than the starting size. The button
|
|
271
|
+
is greyed out at the limit.
|
|
272
|
+
- Each area keeps its own size when you switch the dropdown to another one.
|
|
273
|
+
- The starting sizes of the top row and the details panel are the `topControlsFontSize` and
|
|
274
|
+
`rightDisplayFontSize` [options](#options) (`22px` and `18px`). The graph text starts at 16px for reports and
|
|
275
|
+
14px for groups and has no option.
|
|
276
|
+
- Sizes are not saved: they go back to the starting size when the page is reloaded.
|
|
277
|
+
- With a large graph text, reports can touch each other; increase `offsetX` and `offsetY` to give them more room.
|
|
278
|
+
|
|
279
|
+
### All controls
|
|
280
|
+
|
|
281
|
+
**Top row**
|
|
282
|
+
|
|
283
|
+
| Control | What it does |
|
|
284
|
+
| ------------------------------------------------------- | ------------------------------------------------------------------------------------------------------------------------------------------------------------------------------------------------- |
|
|
285
|
+
| _Node to Display_ | Type part of a name, pick a report: the graph zooms to it and opens its details. _ALL_ closes the details and shows the whole graph. |
|
|
286
|
+
| Checkbox next to a report in the _Node to Display_ list | Shows or hides the report and its arrows; see [Filter out nodes](#filter-out-nodes). |
|
|
287
|
+
| _Show Groups_ | Shows or hides the group boxes. |
|
|
288
|
+
| _Add Group to Node Name_ | Writes the group after each report name, e.g. `r001 (Sales)`. |
|
|
289
|
+
| _Show Dependency 1_, _Show Dependency 2_ | Pick a report to highlight its whole chain (parents of parents, … or children of children, …) and dim the rest. _Show Nothing_ turns it off. Where the two chains meet, the common color is used. |
|
|
290
|
+
| _Parents / Children_ | Which chain the _Show Dependency_ next to it follows. Disabled while nothing is tracked. |
|
|
291
|
+
| _Font Top Panel / Font Right Panel / Font Graph Panel_ | Dropdown that picks which text the next two buttons resize: the top row, the details panel, or the labels and boxes of the graph. |
|
|
292
|
+
| _−_ and _+_ | Make the chosen text 2px smaller or larger (from 8px smaller to 16px larger than the configured size). Each area keeps its own size; they reset when the page is reloaded. |
|
|
293
|
+
| _Export SVG_ | Downloads the whole graph as `graph.svg` (all reports and groups, whatever the zoom). The file is a static image: no search, details or highlighting. |
|
|
294
|
+
| _?_ | Short help. |
|
|
295
|
+
|
|
296
|
+
In all search boxes, use the arrow keys and Enter to pick, Escape to close the list, and × to clear.
|
|
297
|
+
|
|
298
|
+
**On the graph**
|
|
299
|
+
|
|
300
|
+
| Action | What it does |
|
|
301
|
+
| ----------------------------------------------- | --------------------------------------------------------------------------------------------------- |
|
|
302
|
+
| Double click a report | Opens the details panel: group, parent reports and child reports. Click a name there to jump to it. |
|
|
303
|
+
| Right click a report | _Save to clipboard_: copies the same information as text. |
|
|
304
|
+
| _One level / All levels_ switch (details panel) | Lists only the direct parents and children, or the whole chains. |
|
|
305
|
+
| Scroll / drag | Zoom / move the view. |
|
|
306
|
+
|
|
307
|
+
When the window is too narrow, the top row continues on a second line.
|
|
308
|
+
|
|
309
|
+
## Styling
|
|
310
|
+
|
|
311
|
+
Import the styles once: `import 'react-beauti-graph/style.css'`. Everything is scoped under the
|
|
312
|
+
`.rbg-graph` class, so it does not affect the rest of your page. To change the look, override its rules
|
|
313
|
+
in your own CSS, for example:
|
|
314
|
+
|
|
315
|
+
```css
|
|
316
|
+
.rbg-graph .node-info-panel {
|
|
317
|
+
width: 360px;
|
|
318
|
+
}
|
|
319
|
+
.rbg-graph .controls {
|
|
320
|
+
background: #fff;
|
|
321
|
+
}
|
|
322
|
+
```
|
|
323
|
+
|
|
324
|
+
Colors and text sizes are easier to change with the [options](#options); viewers can also resize the text with the buttons described in [Text size](#text-size).
|
|
325
|
+
|
|
326
|
+
## Other exports
|
|
327
|
+
|
|
328
|
+
Building blocks used by the component, for building your own UI:
|
|
329
|
+
|
|
330
|
+
| Export | Description |
|
|
331
|
+
| ------------------------------- | --------------------------------------------------------------------------------------------------------------------------------------------------------------------------------------------------------------------------------------------- |
|
|
332
|
+
| `NodeSearch` | The search box: `<NodeSearch options={[{ id, label }]} selectedId={id} onSelect={(id) => …} noneLabel="ALL" />`. `''` means no node. Add `onToggleVisible={(id) => …}` and `hiddenIds={new Set([...])}` to show a checkbox next to each node. |
|
|
333
|
+
| `getNodeInfo(node, allLevels?)` | For a Cytoscape node: `{ id, name, group, parents, children }` (parents and children sorted by name). With `allLevels` set to `true`, the lists hold every ancestor and descendant instead of the direct ones. |
|
|
334
|
+
| `formatNodeInfo(info)` | The clipboard text for the result of `getNodeInfo`. |
|
|
335
|
+
| `downloadSvg(cy)` | Downloads the whole graph of a Cytoscape core instance as `graph.svg`. |
|
|
336
|
+
|
|
337
|
+
## Development
|
|
338
|
+
|
|
339
|
+
The library is written in TypeScript (strict mode); its type definitions are generated from the source when
|
|
340
|
+
you build the package. Code is type-checked and compiled with TypeScript 7 (the `typescript7` package); `typescript` 6 stays
|
|
341
|
+
installed only because `typescript-eslint` does not support version 7 yet. The library and the example app are two separate projects, each with its own `package.json`:
|
|
342
|
+
|
|
343
|
+
| Folder | Contents |
|
|
344
|
+
| ----------- | ----------------------------------------------------------------------------------------------------- |
|
|
345
|
+
| `src/` | **Source code of the library** (this is what gets published) |
|
|
346
|
+
| `tests/` | **Unit tests** (Vitest) |
|
|
347
|
+
| `examples/` | **Example app**, its own project: it only imports the package `react-beauti-graph`, as any user would |
|
|
348
|
+
|
|
349
|
+
**Library** (project root):
|
|
350
|
+
|
|
351
|
+
```bash
|
|
352
|
+
npm install
|
|
353
|
+
npm test # unit tests (Vitest)
|
|
354
|
+
npm run typecheck # TypeScript 7, strict (library, tests and example app)
|
|
355
|
+
npm run lint # ESLint, strict rules (eslint.config.mjs)
|
|
356
|
+
npm run format # Prettier: formats the code (npm run format:check only checks)
|
|
357
|
+
npm run check # typecheck + lint + format check + tests: run it before a commit
|
|
358
|
+
npm run build:lib # build the npm package (code and .d.ts types) into dist/
|
|
359
|
+
npm run smoke # draws the example app in Chrome or Edge and checks the arrows are painted
|
|
360
|
+
```
|
|
361
|
+
|
|
362
|
+
**Example app** (`examples/`):
|
|
363
|
+
|
|
364
|
+
```bash
|
|
365
|
+
cd examples
|
|
366
|
+
npm install
|
|
367
|
+
npm run dev # example app (Vite) at http://localhost:5173
|
|
368
|
+
npm run build # build the example app into examples/dist/
|
|
369
|
+
```
|
|
370
|
+
|
|
371
|
+
On Windows, `examples/run.cmd` installs the example's dependencies the first time and starts it. From the root,
|
|
372
|
+
`npm run dev` does the same as `cd examples && npm run dev`. While developing, the name `react-beauti-graph`
|
|
373
|
+
points at the library source in `src/` (see `examples/vite.config.mjs`), so library changes show up at once.
|
|
374
|
+
|
|
375
|
+
| Path | Contents |
|
|
376
|
+
| ---------------------------------------------------------------- | ---------------------------------------------------------------------------------- |
|
|
377
|
+
| `src/graphFactory.tsx` | The library: `create_graph`, layout, styles, search box |
|
|
378
|
+
| `src/default_setting.ts` | Default colors, text sizes and layout (the `DEFAULT_*` values) |
|
|
379
|
+
| `src/react-beauti-graph.css` | The library styles (published as `style.css`) |
|
|
380
|
+
| `src/index.ts` | Public entry point of the package (the `.d.ts` types are generated into `dist/`) |
|
|
381
|
+
| `tests/` | `graphFactory.test.ts`, `NodeSearch.test.tsx` |
|
|
382
|
+
| `tsconfig.json`, `tsconfig.build.json` | TypeScript settings (strict), and the settings that generate the types |
|
|
383
|
+
| `scripts/` | `smoke.mjs` (browser smoke test) and `make-cts.mjs` (finishes the type files) |
|
|
384
|
+
| `.github/workflows/ci.yml` | GitHub Actions: runs the check, the package build and the smoke test on every push |
|
|
385
|
+
| `vite.lib.config.mjs`, `vitest.config.mjs` | Build of the npm package, and the test setup |
|
|
386
|
+
| `examples/DemoApp.tsx` | The example page, with the _Demo data_ dropdown |
|
|
387
|
+
| `examples/main.tsx`, `examples/index.html`, `examples/index.css` | The Vite entry that mounts the example page, and its page styles |
|
|
388
|
+
| `examples/samples/` | Example data: a small example and 100 reports in 5 groups |
|
|
389
|
+
| `examples/package.json`, `examples/vite.config.mjs` | The example app's own dependencies and Vite setup |
|
|
390
|
+
|
|
391
|
+
In the example app, switch between the two samples with the _Demo data_ dropdown at the top of the page.
|
|
392
|
+
|
|
393
|
+
## License and credits
|
|
394
|
+
|
|
395
|
+
Licensed under the [Apache License 2.0](LICENSE).
|
|
396
|
+
|
|
397
|
+
You are free to use, modify and distribute this library, including in commercial
|
|
398
|
+
products, provided you keep the attribution in the [NOTICE](NOTICE) file:
|
|
399
|
+
|
|
400
|
+
> react-beauti-graph by Antonio Ramasco
|
|
@@ -0,0 +1,17 @@
|
|
|
1
|
+
/**
|
|
2
|
+
* default_setting.js
|
|
3
|
+
* Default colors, text sizes and layout of the graph. The DEFAULT_* ones can be overridden
|
|
4
|
+
* with the create_graph option named in its comment.
|
|
5
|
+
*/
|
|
6
|
+
export declare const DEFAULT_SELECTED_COLOR = "#e91e63";
|
|
7
|
+
export declare const DEFAULT_TRACK1_PARENTS_COLOR = "#2e7d32";
|
|
8
|
+
export declare const DEFAULT_TRACK1_CHILDREN_COLOR = "#7b1fa2";
|
|
9
|
+
export declare const DEFAULT_TRACK2_PARENTS_COLOR = "#efeb00";
|
|
10
|
+
export declare const DEFAULT_TRACK2_CHILDREN_COLOR = "#8b4513";
|
|
11
|
+
export declare const DEFAULT_TRACK_COMMON_COLOR = "rgb(239, 108, 0)";
|
|
12
|
+
export declare const DEFAULT_LAYOUT_COLUMNS = 10;
|
|
13
|
+
export declare const DEFAULT_TOP_CONTROLS_FONT_SIZE = "22px";
|
|
14
|
+
export declare const DEFAULT_RIGHT_DISPLAY_FONT_SIZE = "18px";
|
|
15
|
+
export declare const GRAPH_COLOR = "#0066cc";
|
|
16
|
+
export declare const REPORT_BACKGROUND_COLOR = "#fff";
|
|
17
|
+
export declare const FOLDER_BACKGROUND_COLOR = "#f0f8ff";
|
|
@@ -0,0 +1,17 @@
|
|
|
1
|
+
/**
|
|
2
|
+
* default_setting.js
|
|
3
|
+
* Default colors, text sizes and layout of the graph. The DEFAULT_* ones can be overridden
|
|
4
|
+
* with the create_graph option named in its comment.
|
|
5
|
+
*/
|
|
6
|
+
export declare const DEFAULT_SELECTED_COLOR = "#e91e63";
|
|
7
|
+
export declare const DEFAULT_TRACK1_PARENTS_COLOR = "#2e7d32";
|
|
8
|
+
export declare const DEFAULT_TRACK1_CHILDREN_COLOR = "#7b1fa2";
|
|
9
|
+
export declare const DEFAULT_TRACK2_PARENTS_COLOR = "#efeb00";
|
|
10
|
+
export declare const DEFAULT_TRACK2_CHILDREN_COLOR = "#8b4513";
|
|
11
|
+
export declare const DEFAULT_TRACK_COMMON_COLOR = "rgb(239, 108, 0)";
|
|
12
|
+
export declare const DEFAULT_LAYOUT_COLUMNS = 10;
|
|
13
|
+
export declare const DEFAULT_TOP_CONTROLS_FONT_SIZE = "22px";
|
|
14
|
+
export declare const DEFAULT_RIGHT_DISPLAY_FONT_SIZE = "18px";
|
|
15
|
+
export declare const GRAPH_COLOR = "#0066cc";
|
|
16
|
+
export declare const REPORT_BACKGROUND_COLOR = "#fff";
|
|
17
|
+
export declare const FOLDER_BACKGROUND_COLOR = "#f0f8ff";
|