pixl-cli 1.1.2 → 1.1.4
This diff represents the content of publicly available package versions that have been released to one of the supported registries. The information contained in this diff is provided for informational purposes only and reflects changes between package versions as they appear in their respective public registries.
- package/README.md +56 -2
- package/chart.js +427 -0
- package/cli.js +14 -7
- package/package.json +1 -1
- package/util.js +29 -1
package/README.md
CHANGED
|
@@ -20,6 +20,9 @@
|
|
|
20
20
|
* [Displaying Info Boxes](#displaying-info-boxes)
|
|
21
21
|
+ [Centering Text](#centering-text)
|
|
22
22
|
+ [Word-Wrapping Text](#word-wrapping-text)
|
|
23
|
+
* [Displaying Definition Lists](#displaying-definition-lists)
|
|
24
|
+
* [Displaying Dashboard Grids](#displaying-dashboard-grids)
|
|
25
|
+
* [Displaying Timeseries Charts](#displaying-timeseries-charts)
|
|
23
26
|
* [Displaying Tables](#displaying-tables)
|
|
24
27
|
* [Graphical Progress Bars](#graphical-progress-bars)
|
|
25
28
|
+ [Configuration](#configuration)
|
|
@@ -39,7 +42,7 @@
|
|
|
39
42
|
|
|
40
43
|
# Overview
|
|
41
44
|
|
|
42
|
-
This module provides utilities for creating command-line Node.js apps. Features include automatic parsing of command-line args into simple key/value pairs, prompting the user for information, and displaying graphical info boxes and progress bars.
|
|
45
|
+
This module provides utilities for creating command-line Node.js apps. Features include automatic parsing of command-line args into simple key/value pairs, prompting the user for information, and displaying graphical info boxes, tables, timeseries charts, and progress bars.
|
|
43
46
|
|
|
44
47
|
# Usage
|
|
45
48
|
|
|
@@ -491,12 +494,63 @@ You can customize the dashboard grid with these options:
|
|
|
491
494
|
| `unitWidth` | Target outer width used to select the responsive column count. Defaults to `20`. |
|
|
492
495
|
| `minCols` | Preferred minimum number of columns. Defaults to `3`. Extremely narrow terminals may use fewer to avoid overflow. |
|
|
493
496
|
| `maxCols` | Maximum number of columns. Defaults to `5`. |
|
|
494
|
-
| `gap` | Horizontal spaces between units
|
|
497
|
+
| `gap` | Horizontal spaces between units. Grid rows use `gap - 1` blank lines. Defaults to `1`, producing no vertical blank line. |
|
|
495
498
|
| `indent` | Horizontal margin in characters on both sides of the grid. Defaults to `0`. |
|
|
496
499
|
| `valueStyles` | An array of [chalk](https://www.npmjs.com/package/chalk) styles or functions for values. Defaults to `["bold"]`. |
|
|
497
500
|
| `labelStyles` | An array of styles or functions for labels. Defaults to `["gray"]`. |
|
|
498
501
|
| `borderStyles` | An array of styles or functions for unit borders. Defaults to `["gray"]`. |
|
|
499
502
|
|
|
503
|
+
## Displaying Timeseries Charts
|
|
504
|
+
|
|
505
|
+
Call `cli.chart()` to render a filled timeseries area chart using Unicode Braille characters. Each character contains two horizontal samples and four vertical dots, which gives the chart more detail than ordinary text cells can provide.
|
|
506
|
+
|
|
507
|
+
Pass the chart an array of objects containing an `x` Epoch timestamp in seconds and a numeric `y` value:
|
|
508
|
+
|
|
509
|
+
```js
|
|
510
|
+
const cli = require('pixl-cli');
|
|
511
|
+
|
|
512
|
+
cli.println( cli.chart({
|
|
513
|
+
title: "App Requests per sec",
|
|
514
|
+
dataType: "integer",
|
|
515
|
+
dataSuffix: "/sec",
|
|
516
|
+
height: 14,
|
|
517
|
+
indent: 1,
|
|
518
|
+
color: "green",
|
|
519
|
+
data: [
|
|
520
|
+
{ x: 1634269860, y: 39 },
|
|
521
|
+
{ x: 1634269920, y: 42 },
|
|
522
|
+
{ x: 1634269980, y: 53 },
|
|
523
|
+
{ x: 1634270040, y: 40 },
|
|
524
|
+
{ x: 1634270100, y: 81 },
|
|
525
|
+
{ x: 1634270160, y: 43 }
|
|
526
|
+
]
|
|
527
|
+
}) );
|
|
528
|
+
```
|
|
529
|
+
|
|
530
|
+
The chart automatically fills the available terminal width. The `indent` option reserves the same horizontal margin on both sides, and defaults to one character. An explicit `width` is useful for tests and redirected output, where a terminal width may not be available.
|
|
531
|
+
|
|
532
|
+
The Y axis always starts at zero and ends at the highest data value. Set `minVertScale` to enforce a minimum upper bound, such as `100` for a CPU percentage chart. The two Y-axis labels are drawn inside the frame, while the first and last timestamps are shown below it using the current system locale and time zone.
|
|
533
|
+
|
|
534
|
+
Sparse datasets are smoothed using monotone cubic interpolation. Dense datasets are reduced to two samples per Braille character using linear interpolation. A single sample produces axis labels without chart data, and an empty dataset produces only the frame.
|
|
535
|
+
|
|
536
|
+
You can customize the chart with these options:
|
|
537
|
+
|
|
538
|
+
| Property Name | Description |
|
|
539
|
+
|---------------|-------------|
|
|
540
|
+
| `data` | Array of `{ x, y }` samples. The `x` values must be Epoch timestamps in seconds. Defaults to `[]`. |
|
|
541
|
+
| `title` | Optional title displayed above the frame. |
|
|
542
|
+
| `width` | Overall layout width, including horizontal margins. Defaults to `cli.width()`, or `80` when no terminal width is available. |
|
|
543
|
+
| `height` | Number of Braille rows inside the frame. Defaults to `14`, with a minimum of `2`. |
|
|
544
|
+
| `indent` | Horizontal margin in characters on both sides of the chart. Defaults to `1`. |
|
|
545
|
+
| `dataType` | Y-axis format: `integer`, `float`, `bytes`, `seconds`, or `milliseconds`. Defaults to `integer`. |
|
|
546
|
+
| `dataSuffix` | Optional text appended to both Y-axis labels. Defaults to an empty string. |
|
|
547
|
+
| `floatPrecision` | Maximum decimal precision used by compact value formats. Defaults to `2`. |
|
|
548
|
+
| `minVertScale` | Minimum value for the top of the Y axis. Defaults to `0`. |
|
|
549
|
+
| `color` | Chalk style name, style function, or array of styles for the chart data. Defaults to no style. |
|
|
550
|
+
| `borderStyles` | Array of styles or functions for the frame. Defaults to `["gray"]`. |
|
|
551
|
+
| `labelStyles` | Array of styles or functions for both axes. Defaults to `["gray"]`. |
|
|
552
|
+
| `titleStyles` | Array of styles or functions for the title. Defaults to `["cyan", "bold"]`. |
|
|
553
|
+
|
|
500
554
|
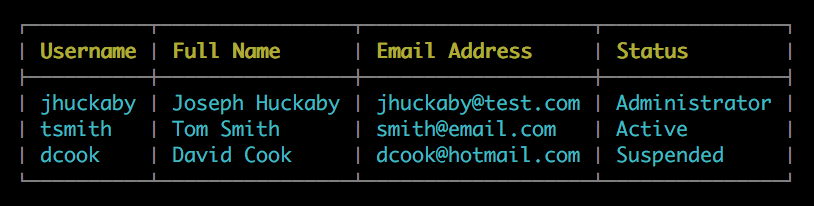
## Displaying Tables
|
|
501
555
|
|
|
502
556
|
|
package/chart.js
ADDED
|
@@ -0,0 +1,427 @@
|
|
|
1
|
+
// Unicode Braille timeseries area charts for pixl-cli.
|
|
2
|
+
// Copyright (c) 2016 - 2026 Joseph Huckaby
|
|
3
|
+
// Released under the MIT License
|
|
4
|
+
|
|
5
|
+
var Width = require('./width');
|
|
6
|
+
|
|
7
|
+
var stringWidth = Width.stringWidth;
|
|
8
|
+
var numberFormatter = new Intl.NumberFormat();
|
|
9
|
+
|
|
10
|
+
// Braille characters contain two columns of four dots. The Unicode bit order
|
|
11
|
+
// is not linear across the rows, so keep an explicit map for each column.
|
|
12
|
+
var brailleBits = {
|
|
13
|
+
left: [0x01, 0x02, 0x04, 0x40],
|
|
14
|
+
right: [0x08, 0x10, 0x20, 0x80]
|
|
15
|
+
};
|
|
16
|
+
|
|
17
|
+
function wholeNumber(value, defaultValue, minimum) {
|
|
18
|
+
// Normalize layout options to safe, whole terminal cells.
|
|
19
|
+
value = Math.floor( Number(value) );
|
|
20
|
+
if (!isFinite(value)) value = defaultValue;
|
|
21
|
+
return Math.max(minimum, value);
|
|
22
|
+
}
|
|
23
|
+
|
|
24
|
+
function styleList(value, defaultValue) {
|
|
25
|
+
// The rest of pixl-cli uses arrays of chalk style names or functions. Also
|
|
26
|
+
// accept one style directly because chart colors are commonly a single name.
|
|
27
|
+
if (typeof(value) == 'undefined') return defaultValue;
|
|
28
|
+
if (!value) return [];
|
|
29
|
+
return Array.isArray(value) ? value : [value];
|
|
30
|
+
}
|
|
31
|
+
|
|
32
|
+
function prepareData(data) {
|
|
33
|
+
// Copy and normalize the caller's data without modifying their objects.
|
|
34
|
+
// Invalid samples are ignored so a malformed row cannot crash a report.
|
|
35
|
+
var rows = [];
|
|
36
|
+
(data || []).forEach( function(row) {
|
|
37
|
+
if (!row || (typeof(row) != 'object')) return;
|
|
38
|
+
var x = Number(row.x);
|
|
39
|
+
var y = Number(row.y);
|
|
40
|
+
if (!isFinite(x) || !isFinite(y)) return;
|
|
41
|
+
rows.push({ x: x, y: y });
|
|
42
|
+
} );
|
|
43
|
+
|
|
44
|
+
// Interpolation requires ascending, unique X coordinates. If two samples
|
|
45
|
+
// share a timestamp, preserve the last one supplied by the caller.
|
|
46
|
+
rows.sort( function(a, b) { return a.x - b.x; } );
|
|
47
|
+
var uniqueRows = [];
|
|
48
|
+
rows.forEach( function(row) {
|
|
49
|
+
var last = uniqueRows[ uniqueRows.length - 1 ];
|
|
50
|
+
if (last && (last.x == row.x)) uniqueRows[ uniqueRows.length - 1 ] = row;
|
|
51
|
+
else uniqueRows.push(row);
|
|
52
|
+
} );
|
|
53
|
+
|
|
54
|
+
return uniqueRows;
|
|
55
|
+
}
|
|
56
|
+
|
|
57
|
+
function createLinearInterpolant(xs, ys) {
|
|
58
|
+
// Create a simple piecewise-linear interpolator for reducing large datasets.
|
|
59
|
+
// This samples the complete time range uniformly into the available dots.
|
|
60
|
+
if (!xs.length) return function() { return 0; };
|
|
61
|
+
if (xs.length == 1) return function() { return ys[0]; };
|
|
62
|
+
|
|
63
|
+
return function(x) {
|
|
64
|
+
if (x <= xs[0]) return ys[0];
|
|
65
|
+
if (x >= xs[xs.length - 1]) return ys[ys.length - 1];
|
|
66
|
+
|
|
67
|
+
// Locate the two source samples surrounding this output timestamp.
|
|
68
|
+
var low = 0;
|
|
69
|
+
var high = xs.length - 1;
|
|
70
|
+
while ((high - low) > 1) {
|
|
71
|
+
var mid = Math.floor( (low + high) / 2 );
|
|
72
|
+
if (xs[mid] <= x) low = mid;
|
|
73
|
+
else high = mid;
|
|
74
|
+
}
|
|
75
|
+
|
|
76
|
+
var ratio = (x - xs[low]) / (xs[high] - xs[low]);
|
|
77
|
+
return ys[low] + ((ys[high] - ys[low]) * ratio);
|
|
78
|
+
};
|
|
79
|
+
}
|
|
80
|
+
|
|
81
|
+
function createInterpolant(xs, ys) {
|
|
82
|
+
// Adapted from: https://en.wikipedia.org/wiki/Monotone_cubic_interpolation
|
|
83
|
+
// This is copied from pixl-chart. The xs array MUST be pre-sorted!
|
|
84
|
+
var i, length = xs.length;
|
|
85
|
+
|
|
86
|
+
// Deal with length issues.
|
|
87
|
+
if (length != ys.length) throw new Error('Need an equal count of xs and ys.');
|
|
88
|
+
if (length === 0) return function() { return 0; };
|
|
89
|
+
if (length === 1) {
|
|
90
|
+
var result = +ys[0];
|
|
91
|
+
return function() { return result; };
|
|
92
|
+
}
|
|
93
|
+
|
|
94
|
+
// Get consecutive differences and slopes.
|
|
95
|
+
var dys = [];
|
|
96
|
+
var dxs = [];
|
|
97
|
+
var ms = [];
|
|
98
|
+
for (i = 0; i < length - 1; i++) {
|
|
99
|
+
var dx = xs[i + 1] - xs[i];
|
|
100
|
+
var dy = ys[i + 1] - ys[i];
|
|
101
|
+
dxs.push(dx);
|
|
102
|
+
dys.push(dy);
|
|
103
|
+
ms.push(dy / dx);
|
|
104
|
+
}
|
|
105
|
+
|
|
106
|
+
// Get degree-1 coefficients.
|
|
107
|
+
var c1s = [ms[0]];
|
|
108
|
+
for (i = 0; i < dxs.length - 1; i++) {
|
|
109
|
+
var m = ms[i];
|
|
110
|
+
var mNext = ms[i + 1];
|
|
111
|
+
if ((m * mNext) <= 0) {
|
|
112
|
+
c1s.push(0);
|
|
113
|
+
}
|
|
114
|
+
else {
|
|
115
|
+
var dxCurrent = dxs[i];
|
|
116
|
+
var dxNext = dxs[i + 1];
|
|
117
|
+
var common = dxCurrent + dxNext;
|
|
118
|
+
c1s.push( 3 * common / (((common + dxNext) / m) + ((common + dxCurrent) / mNext)) );
|
|
119
|
+
}
|
|
120
|
+
}
|
|
121
|
+
c1s.push( ms[ms.length - 1] );
|
|
122
|
+
|
|
123
|
+
// Get degree-2 and degree-3 coefficients.
|
|
124
|
+
var c2s = [];
|
|
125
|
+
var c3s = [];
|
|
126
|
+
for (i = 0; i < c1s.length - 1; i++) {
|
|
127
|
+
var c1 = c1s[i];
|
|
128
|
+
var slope = ms[i];
|
|
129
|
+
var invDx = 1 / dxs[i];
|
|
130
|
+
var commonValue = c1 + c1s[i + 1] - slope - slope;
|
|
131
|
+
c2s.push( (slope - c1 - commonValue) * invDx );
|
|
132
|
+
c3s.push( commonValue * invDx * invDx );
|
|
133
|
+
}
|
|
134
|
+
|
|
135
|
+
// Return the interpolation function.
|
|
136
|
+
return function(x) {
|
|
137
|
+
// The rightmost point in the dataset should give an exact result.
|
|
138
|
+
var idx = xs.length - 1;
|
|
139
|
+
if (x == xs[idx]) return ys[idx];
|
|
140
|
+
|
|
141
|
+
// Search for the interval containing x.
|
|
142
|
+
var low = 0;
|
|
143
|
+
var mid = 0;
|
|
144
|
+
var high = c3s.length - 1;
|
|
145
|
+
while (low <= high) {
|
|
146
|
+
mid = Math.floor( 0.5 * (low + high) );
|
|
147
|
+
var xHere = xs[mid];
|
|
148
|
+
if (xHere < x) low = mid + 1;
|
|
149
|
+
else if (xHere > x) high = mid - 1;
|
|
150
|
+
else return ys[mid];
|
|
151
|
+
}
|
|
152
|
+
idx = Math.max(0, high);
|
|
153
|
+
|
|
154
|
+
// Interpolate the value from the precomputed coefficients.
|
|
155
|
+
var diff = x - xs[idx];
|
|
156
|
+
var diffSq = diff * diff;
|
|
157
|
+
return ys[idx] + (c1s[idx] * diff) + (c2s[idx] * diffSq) + (c3s[idx] * diff * diffSq);
|
|
158
|
+
};
|
|
159
|
+
}
|
|
160
|
+
|
|
161
|
+
function resampleData(rows, sampleCount) {
|
|
162
|
+
// Every Braille cell represents two uniformly spaced timestamps. Smooth a
|
|
163
|
+
// sparse series with monotone cubic interpolation, and reduce a dense series
|
|
164
|
+
// with linear interpolation as requested by the chart API.
|
|
165
|
+
if ((rows.length < 2) || (sampleCount < 1)) return [];
|
|
166
|
+
|
|
167
|
+
var xs = rows.map( function(row) { return row.x; } );
|
|
168
|
+
var ys = rows.map( function(row) { return row.y; } );
|
|
169
|
+
var interpolate = (rows.length < sampleCount) ?
|
|
170
|
+
createInterpolant(xs, ys) : createLinearInterpolant(xs, ys);
|
|
171
|
+
var xMin = xs[0];
|
|
172
|
+
var xMax = xs[ xs.length - 1 ];
|
|
173
|
+
var values = [];
|
|
174
|
+
|
|
175
|
+
for (var idx = 0; idx < sampleCount; idx++) {
|
|
176
|
+
var ratio = (sampleCount == 1) ? 0 : (idx / (sampleCount - 1));
|
|
177
|
+
values.push( interpolate(xMin + ((xMax - xMin) * ratio)) );
|
|
178
|
+
}
|
|
179
|
+
|
|
180
|
+
return values;
|
|
181
|
+
}
|
|
182
|
+
|
|
183
|
+
function getColumnMask(value, rowIndex, height, yMax, side) {
|
|
184
|
+
// Quantize one sample to the chart's four-dots-per-line vertical resolution,
|
|
185
|
+
// then turn on every dot from the baseline up to the sample height.
|
|
186
|
+
if (!(yMax > 0)) return 0;
|
|
187
|
+
var totalDots = height * 4;
|
|
188
|
+
var ratio = Math.max(0, Math.min(Number(value) / yMax, 1));
|
|
189
|
+
var filledDots = Math.round(ratio * totalDots);
|
|
190
|
+
var firstFilledDot = totalDots - filledDots;
|
|
191
|
+
var rowStart = rowIndex * 4;
|
|
192
|
+
var mask = 0;
|
|
193
|
+
|
|
194
|
+
for (var dot = 0; dot < 4; dot++) {
|
|
195
|
+
if ((rowStart + dot) >= firstFilledDot) mask |= brailleBits[side][dot];
|
|
196
|
+
}
|
|
197
|
+
|
|
198
|
+
return mask;
|
|
199
|
+
}
|
|
200
|
+
|
|
201
|
+
function renderBrailleRow(values, rowIndex, height, width, yMax) {
|
|
202
|
+
// Combine each adjacent pair of samples into one Unicode Braille character.
|
|
203
|
+
var output = '';
|
|
204
|
+
for (var col = 0; col < width; col++) {
|
|
205
|
+
var mask = getColumnMask(values[col * 2], rowIndex, height, yMax, 'left');
|
|
206
|
+
mask |= getColumnMask(values[(col * 2) + 1], rowIndex, height, yMax, 'right');
|
|
207
|
+
output += mask ? String.fromCharCode(0x2800 + mask) : ' ';
|
|
208
|
+
}
|
|
209
|
+
return output;
|
|
210
|
+
}
|
|
211
|
+
|
|
212
|
+
function shortFloat(value, precision) {
|
|
213
|
+
// Match pixl-chart's compact floating-point axis labels.
|
|
214
|
+
precision = precision || 2;
|
|
215
|
+
var power = Math.pow(10, precision);
|
|
216
|
+
value = Math.round(parseFloat(value || 0) * power) / power;
|
|
217
|
+
if (value == Math.round(value)) value += '.0';
|
|
218
|
+
return '' + value;
|
|
219
|
+
}
|
|
220
|
+
|
|
221
|
+
function getTextFromBytes(value, precision) {
|
|
222
|
+
// Format byte quantities using binary units and compact decimals.
|
|
223
|
+
precision = precision || 10;
|
|
224
|
+
var prefix = '';
|
|
225
|
+
value = Math.floor(value);
|
|
226
|
+
if (value < 0) {
|
|
227
|
+
value = -value;
|
|
228
|
+
prefix = '-';
|
|
229
|
+
}
|
|
230
|
+
if (value < 1024) return prefix + value + ' B';
|
|
231
|
+
value = Math.floor((value / 1024) * precision) / precision;
|
|
232
|
+
if (value < 1024) return prefix + value + ' K';
|
|
233
|
+
value = Math.floor((value / 1024) * precision) / precision;
|
|
234
|
+
if (value < 1024) return prefix + value + ' MB';
|
|
235
|
+
value = Math.floor((value / 1024) * precision) / precision;
|
|
236
|
+
if (value < 1024) return prefix + value + ' GB';
|
|
237
|
+
value = Math.floor((value / 1024) * precision) / precision;
|
|
238
|
+
return prefix + value + ' TB';
|
|
239
|
+
}
|
|
240
|
+
|
|
241
|
+
function getTextFromSeconds(value, abbreviated) {
|
|
242
|
+
// Format elapsed seconds using the largest practical unit.
|
|
243
|
+
var prefix = '';
|
|
244
|
+
if (value < 0) {
|
|
245
|
+
value = -value;
|
|
246
|
+
prefix = '-';
|
|
247
|
+
}
|
|
248
|
+
var unit = abbreviated ? 'sec' : 'second';
|
|
249
|
+
var amount = value;
|
|
250
|
+
if (value > 59) {
|
|
251
|
+
unit = abbreviated ? 'min' : 'minute';
|
|
252
|
+
amount = value = value / 60;
|
|
253
|
+
if (value > 59) {
|
|
254
|
+
unit = abbreviated ? 'hr' : 'hour';
|
|
255
|
+
amount = value = value / 60;
|
|
256
|
+
if (value > 23) {
|
|
257
|
+
unit = 'day';
|
|
258
|
+
amount = value / 24;
|
|
259
|
+
}
|
|
260
|
+
}
|
|
261
|
+
}
|
|
262
|
+
amount = (amount < 10) ? Math.floor(amount * 10) / 10 : Math.floor(amount);
|
|
263
|
+
var output = amount + ' ' + unit;
|
|
264
|
+
if ((amount != 1) && !abbreviated) output += 's';
|
|
265
|
+
return prefix + output;
|
|
266
|
+
}
|
|
267
|
+
|
|
268
|
+
function formatDataValue(value, dataType, suffix, floatPrecision) {
|
|
269
|
+
// Format Y-axis labels using the same core rules as pixl-chart.
|
|
270
|
+
var output = value;
|
|
271
|
+
switch (dataType) {
|
|
272
|
+
case 'bytes':
|
|
273
|
+
output = getTextFromBytes( Math.floor(value), Math.pow(10, floatPrecision - 1) );
|
|
274
|
+
break;
|
|
275
|
+
case 'seconds':
|
|
276
|
+
output = getTextFromSeconds(value, true);
|
|
277
|
+
break;
|
|
278
|
+
case 'milliseconds':
|
|
279
|
+
output = (Math.abs(value) < 1000) ? Math.floor(value) + ' ms' : getTextFromSeconds(value / 1000, true);
|
|
280
|
+
break;
|
|
281
|
+
case 'integer':
|
|
282
|
+
if (Math.abs(value) >= 1000000000) output = Math.floor(value / 1000000000) + 'B';
|
|
283
|
+
else if (Math.abs(value) >= 1000000) output = Math.floor(value / 1000000) + 'M';
|
|
284
|
+
else if (Math.abs(value) >= 10000) output = Math.floor(value / 1000) + 'K';
|
|
285
|
+
else output = numberFormatter.format( Math.floor(value) );
|
|
286
|
+
break;
|
|
287
|
+
default:
|
|
288
|
+
output = shortFloat(value, floatPrecision);
|
|
289
|
+
break;
|
|
290
|
+
}
|
|
291
|
+
|
|
292
|
+
if (suffix) output += suffix;
|
|
293
|
+
return '' + output;
|
|
294
|
+
}
|
|
295
|
+
|
|
296
|
+
function getDateRange(start, end) {
|
|
297
|
+
// Match pixl-chart's automatic date format selection thresholds.
|
|
298
|
+
var range = end - start;
|
|
299
|
+
if (range > 2764800) return 'year';
|
|
300
|
+
if (range > 172800) return 'month';
|
|
301
|
+
if (range > 43200) return 'day';
|
|
302
|
+
if (range > 600) return 'hour';
|
|
303
|
+
return 'minute';
|
|
304
|
+
}
|
|
305
|
+
|
|
306
|
+
function formatDate(epoch, range) {
|
|
307
|
+
// Use the process locale and time zone by leaving both unspecified.
|
|
308
|
+
var dateStyles = {
|
|
309
|
+
minute: { hour: 'numeric', hour12: false, minute: '2-digit', second: '2-digit' },
|
|
310
|
+
hour: { hour: 'numeric', hour12: true, minute: '2-digit' },
|
|
311
|
+
day: { hour: 'numeric', hour12: true },
|
|
312
|
+
month: { month: 'short', day: 'numeric' },
|
|
313
|
+
year: { month: 'short', day: 'numeric' }
|
|
314
|
+
};
|
|
315
|
+
return new Date(epoch * 1000).toLocaleString(undefined, dateStyles[range]);
|
|
316
|
+
}
|
|
317
|
+
|
|
318
|
+
function renderAxisLabels(left, right, width) {
|
|
319
|
+
// Keep exactly two labels on one line. On narrow terminals, divide the line
|
|
320
|
+
// between them and truncate each side without allowing an overflow.
|
|
321
|
+
if (width < 1) return '';
|
|
322
|
+
left = '' + left;
|
|
323
|
+
right = '' + right;
|
|
324
|
+
if ((stringWidth(left) + stringWidth(right) + 1) > width) {
|
|
325
|
+
var leftWidth = Math.floor((width - 1) / 2);
|
|
326
|
+
var rightWidth = Math.max(0, width - leftWidth - 1);
|
|
327
|
+
left = Width.truncate(left, leftWidth, leftWidth > 1 ? '…' : '');
|
|
328
|
+
right = Width.truncate(right, rightWidth, rightWidth > 1 ? '…' : '');
|
|
329
|
+
}
|
|
330
|
+
return left + new Array(Math.max(0, width - stringWidth(left) - stringWidth(right)) + 1).join(' ') + right;
|
|
331
|
+
}
|
|
332
|
+
|
|
333
|
+
function overtypeLabel(cli, graphText, label, width, graphStyles, labelStyles) {
|
|
334
|
+
// Y labels live inside the chart and deliberately replace any Braille cells
|
|
335
|
+
// beneath them. Style the two segments separately after measuring raw text.
|
|
336
|
+
label = Width.truncate(label, width, width > 1 ? '…' : '');
|
|
337
|
+
var labelWidth = stringWidth(label);
|
|
338
|
+
return cli.applyStyles(label, labelStyles) +
|
|
339
|
+
cli.applyStyles(graphText.slice(labelWidth), graphStyles);
|
|
340
|
+
}
|
|
341
|
+
|
|
342
|
+
module.exports = {
|
|
343
|
+
|
|
344
|
+
chart: function(args) {
|
|
345
|
+
// Render one static, filled timeseries chart as a multi-line string.
|
|
346
|
+
args = args || {};
|
|
347
|
+
var layoutWidth = ('width' in args) ?
|
|
348
|
+
wholeNumber(args.width, 80, 0) : (this.width() || 80);
|
|
349
|
+
var indent = wholeNumber(args.indent, 1, 0);
|
|
350
|
+
var outerWidth = Math.max(0, layoutWidth - (indent * 2));
|
|
351
|
+
var innerWidth = Math.max(0, outerWidth - 2);
|
|
352
|
+
var height = wholeNumber(args.height, 14, 2);
|
|
353
|
+
var indentText = this.space(indent);
|
|
354
|
+
|
|
355
|
+
// A border needs at least its two corner cells. Returning an empty string is
|
|
356
|
+
// safer than overflowing when the requested margins consume the whole width.
|
|
357
|
+
if (outerWidth < 2) return '';
|
|
358
|
+
|
|
359
|
+
var graphStyles = styleList(args.color, []);
|
|
360
|
+
var borderStyles = styleList(args.borderStyles, ['gray']);
|
|
361
|
+
var labelStyles = styleList(args.labelStyles, ['gray']);
|
|
362
|
+
var titleStyles = styleList(args.titleStyles, ['cyan', 'bold']);
|
|
363
|
+
var rows = prepareData( Array.isArray(args.data) ? args.data : [] );
|
|
364
|
+
var dataType = args.dataType || 'integer';
|
|
365
|
+
var dataSuffix = args.dataSuffix || '';
|
|
366
|
+
var floatPrecision = wholeNumber(args.floatPrecision, 2, 1);
|
|
367
|
+
var minVertScale = Number(args.minVertScale || 0);
|
|
368
|
+
if (!isFinite(minVertScale) || (minVertScale < 0)) minVertScale = 0;
|
|
369
|
+
|
|
370
|
+
// The Y scale is always zero-floored and otherwise bound to the highest
|
|
371
|
+
// sample, unless minVertScale requests a larger fixed minimum.
|
|
372
|
+
var yMax = minVertScale;
|
|
373
|
+
rows.forEach( function(row) { yMax = Math.max(yMax, row.y, 0); } );
|
|
374
|
+
var values = resampleData(rows, innerWidth * 2);
|
|
375
|
+
var output = [];
|
|
376
|
+
|
|
377
|
+
// Titles sit above the frame and align with its left border.
|
|
378
|
+
if (args.title) {
|
|
379
|
+
var title = ('' + args.title).replace(/\r?\n/g, ' ');
|
|
380
|
+
title = Width.truncate(title, outerWidth, outerWidth > 1 ? '…' : '');
|
|
381
|
+
output.push( indentText + this.applyStyles(title, titleStyles) );
|
|
382
|
+
}
|
|
383
|
+
|
|
384
|
+
// Render the border and all chart rows. Fewer than two samples intentionally
|
|
385
|
+
// leaves the Braille area blank, while one sample still supplies axis limits.
|
|
386
|
+
output.push( indentText + this.applyStyles('┌' + this.repeat('─', innerWidth) + '┐', borderStyles) );
|
|
387
|
+
for (var rowIndex = 0; rowIndex < height; rowIndex++) {
|
|
388
|
+
var graphText = (rows.length >= 2) ?
|
|
389
|
+
renderBrailleRow(values, rowIndex, height, innerWidth, yMax) : this.space(innerWidth);
|
|
390
|
+
var content = this.applyStyles(graphText, graphStyles);
|
|
391
|
+
|
|
392
|
+
if (rows.length && !rowIndex) {
|
|
393
|
+
var topLabel = formatDataValue(yMax, dataType, dataSuffix, floatPrecision);
|
|
394
|
+
content = overtypeLabel(this, graphText, topLabel, innerWidth, graphStyles, labelStyles);
|
|
395
|
+
}
|
|
396
|
+
else if (rows.length && (rowIndex == height - 1)) {
|
|
397
|
+
var bottomLabel = formatDataValue(0, dataType, dataSuffix, floatPrecision);
|
|
398
|
+
content = overtypeLabel(this, graphText, bottomLabel, innerWidth, graphStyles, labelStyles);
|
|
399
|
+
}
|
|
400
|
+
|
|
401
|
+
output.push(
|
|
402
|
+
indentText +
|
|
403
|
+
this.applyStyles('│', borderStyles) +
|
|
404
|
+
content +
|
|
405
|
+
this.applyStyles('│', borderStyles)
|
|
406
|
+
);
|
|
407
|
+
}
|
|
408
|
+
output.push( indentText + this.applyStyles('└' + this.repeat('─', innerWidth) + '┘', borderStyles) );
|
|
409
|
+
|
|
410
|
+
// Empty datasets have no axes. One sample produces two identical timestamps,
|
|
411
|
+
// which preserves the documented two-label layout without drawing an area.
|
|
412
|
+
if (rows.length) {
|
|
413
|
+
var xMin = rows[0].x;
|
|
414
|
+
var xMax = rows[ rows.length - 1 ].x;
|
|
415
|
+
var dateRange = getDateRange(xMin, xMax);
|
|
416
|
+
var axisText = renderAxisLabels(
|
|
417
|
+
formatDate(xMin, dateRange),
|
|
418
|
+
formatDate(xMax, dateRange),
|
|
419
|
+
outerWidth
|
|
420
|
+
);
|
|
421
|
+
output.push( indentText + this.applyStyles(axisText, labelStyles) );
|
|
422
|
+
}
|
|
423
|
+
|
|
424
|
+
return output.join('\n');
|
|
425
|
+
}
|
|
426
|
+
|
|
427
|
+
};
|
package/cli.js
CHANGED
|
@@ -176,7 +176,11 @@ var cli = module.exports = {
|
|
|
176
176
|
output.push( indent + this.applyStyles("┌" + this.repeat("─", width) + "┐", styles) );
|
|
177
177
|
|
|
178
178
|
// left, content, right
|
|
179
|
-
|
|
179
|
+
// Styled text normally carries its SGR modes across newlines, but the styled
|
|
180
|
+
// right border resets those modes before the next content line. Make each
|
|
181
|
+
// line self-contained before inserting borders between them.
|
|
182
|
+
var safeText = (styles && styles.length) ? Util.preserveAnsiLineStyles(text) : text;
|
|
183
|
+
var lines = safeText.split(/\n/);
|
|
180
184
|
while (vspace-- > 0) {
|
|
181
185
|
lines.unshift( "" );
|
|
182
186
|
lines.push( "" );
|
|
@@ -290,7 +294,7 @@ var cli = module.exports = {
|
|
|
290
294
|
|
|
291
295
|
dashGrid: function(rows, args) {
|
|
292
296
|
// Render a responsive grid of equal-sized dashboard units. Each unit has a
|
|
293
|
-
// centered value, a centered label,
|
|
297
|
+
// centered value, a centered label, a blank spacer row and its own border.
|
|
294
298
|
var self = this;
|
|
295
299
|
if (!rows || !rows.length) return '';
|
|
296
300
|
if (!args) args = {};
|
|
@@ -375,7 +379,7 @@ var cli = module.exports = {
|
|
|
375
379
|
} );
|
|
376
380
|
|
|
377
381
|
var renderUnit = function(unit) {
|
|
378
|
-
// The interior layout is:
|
|
382
|
+
// The interior layout is: value, blank, label.
|
|
379
383
|
var top = self.applyStyles(
|
|
380
384
|
'┌' + self.repeat('─', innerWidth) + '┐', borderStyles
|
|
381
385
|
);
|
|
@@ -388,7 +392,6 @@ var cli = module.exports = {
|
|
|
388
392
|
|
|
389
393
|
return [
|
|
390
394
|
top,
|
|
391
|
-
// blank,
|
|
392
395
|
leftBorder + centerCell(truncate(unit.value)) + rightBorder,
|
|
393
396
|
blank,
|
|
394
397
|
leftBorder + centerCell(truncate(unit.label)) + rightBorder,
|
|
@@ -401,7 +404,7 @@ var cli = module.exports = {
|
|
|
401
404
|
var gridRow = units.slice(rowIdx, rowIdx + numCols).map(renderUnit);
|
|
402
405
|
|
|
403
406
|
// Join corresponding lines from each unit to form one complete grid row.
|
|
404
|
-
for (var lineIdx = 0; lineIdx <
|
|
407
|
+
for (var lineIdx = 0; lineIdx < gridRow[0].length; lineIdx++) {
|
|
405
408
|
output.push(
|
|
406
409
|
indent + gridRow.map( function(unit) {
|
|
407
410
|
return unit[lineIdx];
|
|
@@ -409,9 +412,10 @@ var cli = module.exports = {
|
|
|
409
412
|
);
|
|
410
413
|
}
|
|
411
414
|
|
|
412
|
-
//
|
|
415
|
+
// Adjacent text lines already provide one row of vertical separation, so
|
|
416
|
+
// subtract one when translating the horizontal gap into blank lines.
|
|
413
417
|
if (rowIdx + numCols < units.length) {
|
|
414
|
-
for (var gapIdx = 0; gapIdx < gap; gapIdx++) output.push('');
|
|
418
|
+
for (var gapIdx = 0; gapIdx < Math.max(0, gap - 1); gapIdx++) output.push('');
|
|
415
419
|
}
|
|
416
420
|
}
|
|
417
421
|
|
|
@@ -933,6 +937,9 @@ var cli = module.exports = {
|
|
|
933
937
|
|
|
934
938
|
};
|
|
935
939
|
|
|
940
|
+
// Mix in optional renderers which depend on the core CLI helpers above.
|
|
941
|
+
Tools.mergeHashInto( cli, require('./chart.js') );
|
|
942
|
+
|
|
936
943
|
// import some common utilities
|
|
937
944
|
["getTextFromBytes", "commify", "shortFloat", "pct", "zeroPad", "getTextFromSeconds", "getNiceRemainingTime", "pluralize", "ucfirst"].forEach( function(func) {
|
|
938
945
|
module.exports[func] = Tools[func].bind(Tools);
|
package/package.json
CHANGED
package/util.js
CHANGED
|
@@ -32,8 +32,36 @@ function splitAnsiGraphemes(text) {
|
|
|
32
32
|
return units;
|
|
33
33
|
}
|
|
34
34
|
|
|
35
|
+
function preserveAnsiLineStyles(text) {
|
|
36
|
+
// A styled multi-line string normally relies on terminal modes carrying across
|
|
37
|
+
// newline characters. Callers such as cli.box() insert independently styled
|
|
38
|
+
// borders between those lines, whose reset codes can cancel the content styles.
|
|
39
|
+
// Close all modes at each line ending, then restore the exact SGR state after the
|
|
40
|
+
// next border by replaying the original SGR history at the next line's start.
|
|
41
|
+
var lines = text.split('\n');
|
|
42
|
+
if (lines.length < 2) return text;
|
|
43
|
+
|
|
44
|
+
var sgrHistory = '';
|
|
45
|
+
var sgrPattern = /^(?:\u001B\[|\u009B)[0-9:;]*m$/;
|
|
46
|
+
var reset = '\u001b[0m';
|
|
47
|
+
|
|
48
|
+
return lines.map( function(line, idx) {
|
|
49
|
+
var reopen = sgrHistory;
|
|
50
|
+
|
|
51
|
+
// Only sequences from the original text enter the history. Synthetic reset
|
|
52
|
+
// and replay sequences added here must not accumulate on subsequent lines.
|
|
53
|
+
splitAnsiGraphemes(line).forEach( function(unit) {
|
|
54
|
+
if (unit.ansi && unit.text.match(sgrPattern)) sgrHistory += unit.text;
|
|
55
|
+
} );
|
|
56
|
+
|
|
57
|
+
if ((idx < lines.length - 1) && sgrHistory) line += reset;
|
|
58
|
+
return reopen + line;
|
|
59
|
+
} ).join('\n');
|
|
60
|
+
}
|
|
61
|
+
|
|
35
62
|
module.exports = {
|
|
36
63
|
ansiPattern: ansiPattern,
|
|
37
64
|
graphemeSegmenter: graphemeSegmenter,
|
|
38
|
-
splitAnsiGraphemes: splitAnsiGraphemes
|
|
65
|
+
splitAnsiGraphemes: splitAnsiGraphemes,
|
|
66
|
+
preserveAnsiLineStyles: preserveAnsiLineStyles
|
|
39
67
|
};
|