pivotkit-react 0.7.0 → 0.8.1
This diff represents the content of publicly available package versions that have been released to one of the supported registries. The information contained in this diff is provided for informational purposes only and reflects changes between package versions as they appear in their respective public registries.
- package/CHANGELOG.md +191 -1
- package/README.md +33 -15
- package/dist/chunks/{chunk-JMRTIOX4.js → chunk-2N2UGSIG.js} +7 -0
- package/dist/chunks/{chunk-XN5HNKJ2.js → chunk-3WWWKPB4.js} +98 -33
- package/dist/chunks/{chunk-ZK5RVCHP.js → chunk-6OWC6X5W.js} +1 -1
- package/dist/chunks/{chunk-YXLANLGL.js → chunk-GUSQWPTH.js} +56 -3
- package/dist/chunks/{chunk-E6M57YLL.js → chunk-MU5BTKSY.js} +7 -0
- package/dist/chunks/{chunk-4WZ5F2TJ.js → chunk-W2SVDHGN.js} +371 -32
- package/dist/chunks/{chunk-TR2HROIK.js → chunk-ZM45YU3W.js} +66 -5
- package/dist/chunks/{unused-texts-Y4R67XSN.js → unused-texts-LRYVWFFN.js} +1 -1
- package/dist/chunks/{unused-texts-de-6YVPTNVS.js → unused-texts-de-GB3IWWEM.js} +1 -1
- package/dist/echarts.js +426 -35
- package/dist/import-ui.js +2 -2
- package/dist/index.js +728 -393
- package/dist/labels.js +6 -6
- package/dist/menu-texts-de.js +1 -1
- package/dist/menus.js +1534 -1020
- package/dist/styles.css +292 -171
- package/package.json +3 -3
- package/types/PivotReport.d.ts +6 -0
- package/types/add-menu.d.ts +48 -0
- package/types/chart-colors.d.ts +8 -0
- package/types/chart-decorate.d.ts +66 -3
- package/types/chart-legend.d.ts +176 -0
- package/types/chart-summary.d.ts +8 -3
- package/types/chart-tooltip.d.ts +159 -17
- package/types/chart.d.ts +21 -3
- package/types/date-context.d.ts +30 -0
- package/types/drill-panel.d.ts +4 -2
- package/types/echarts.d.ts +7 -3
- package/types/export-run.d.ts +7 -14
- package/types/export-scope.d.ts +13 -2
- package/types/field-info.d.ts +12 -0
- package/types/files.d.ts +14 -0
- package/types/filter.d.ts +18 -0
- package/types/group-context.d.ts +20 -0
- package/types/index.d.ts +35 -6
- package/types/label-room.d.ts +13 -0
- package/types/labels.d.ts +85 -16
- package/types/lazy-menus.d.ts +2 -2
- package/types/levels.d.ts +16 -7
- package/types/menu-labels.d.ts +67 -1
- package/types/menu-ops.d.ts +10 -0
- package/types/menu-topics.d.ts +110 -21
- package/types/menus.d.ts +2 -1
- package/types/names.d.ts +32 -3
- package/types/overflow.d.ts +18 -30
- package/types/rove.d.ts +10 -0
- package/types/toolbar-panels.d.ts +34 -10
- package/types/unused-texts.d.ts +7 -0
- package/types/use-big-result.d.ts +24 -9
- package/types/use-export.d.ts +2 -2
- package/types/view-ops.d.ts +19 -8
- package/types/view-tabs.d.ts +12 -0
- package/types/zones.d.ts +41 -9
package/CHANGELOG.md
CHANGED
|
@@ -6,6 +6,194 @@ All notable changes to `pivotkit-react` are documented in this file. The format
|
|
|
6
6
|
|
|
7
7
|
## [Unreleased]
|
|
8
8
|
|
|
9
|
+
## [0.8.1] - 2026-11-18
|
|
10
|
+
|
|
11
|
+
### Added
|
|
12
|
+
|
|
13
|
+
- Theme tokens for the tabs, icon buttons, button frames and primary buttons, so a host themes them
|
|
14
|
+
without changing the general tokens: `--pk-tab-bg`, `--pk-tab-text`, `--pk-tab-selected-bg`,
|
|
15
|
+
`--pk-tab-selected-text`, `--pk-icon-button-text`, `--pk-icon-button-hover-bg`,
|
|
16
|
+
`--pk-button-border`, `--pk-button-border-hover`, `--pk-primary-bg`, `--pk-primary-text` and
|
|
17
|
+
`--pk-primary-hover-bg`. Their defaults are today's colours
|
|
18
|
+
([#604](https://github.com/eizedev/pivotkit/issues/604)).
|
|
19
|
+
|
|
20
|
+
### Changed
|
|
21
|
+
|
|
22
|
+
- The four zones form an even grid. From 640 px of the main area, Filters and Columns sit on top
|
|
23
|
+
and Rows and Values below, in equal halves at every width. Below 640 px they stand in one column.
|
|
24
|
+
A chip never widens a zone, so the drop targets stay in place while fields are added
|
|
25
|
+
([#605](https://github.com/eizedev/pivotkit/issues/605)).
|
|
26
|
+
- A zone narrower than 26em puts its title row above its chips, as on a phone.
|
|
27
|
+
- Each zone has a frame, from the new token `--pk-zone-border`, and a little more height,
|
|
28
|
+
from the new token `--pk-shelf-pad-block`. `--pk-shelf-min` is now the least width of a half of
|
|
29
|
+
the grid.
|
|
30
|
+
- The Filters hint is shorter: "Add or drop a field to filter".
|
|
31
|
+
|
|
32
|
+
## [0.8.0] - 2026-11-18
|
|
33
|
+
|
|
34
|
+
### Upgrading from 0.7
|
|
35
|
+
|
|
36
|
+
- Table and Chart are tabs on top of the result, with "Table settings" or "Chart settings" beside
|
|
37
|
+
them. The chart type button, Options and Layout left the toolbar. More is always at its end, with
|
|
38
|
+
Help first. The zones fold under the heading "Fields in the report", and Swap rows and columns sits
|
|
39
|
+
at the end of that row. The labels `layout`, `showLayout`, `options` and `chartDisplay` are no longer
|
|
40
|
+
shown, and the test ids `chart-type`, `options` and `layout` are gone
|
|
41
|
+
([#580](https://github.com/eizedev/pivotkit/issues/580),
|
|
42
|
+
[upgrading](https://pivotkit.eize.dev/getting-started/upgrading/#view-tabs-0-8)).
|
|
43
|
+
- The chart type menu lists the types, then a row per Display topic that opens a level: Value
|
|
44
|
+
labels, Legend, Title, Axis, Tooltip, Series and Layout ([#106](https://github.com/eizedev/pivotkit/issues/106)). Tests open the
|
|
45
|
+
level first; a choice is a menu item with `aria-checked`.
|
|
46
|
+
- Bars, lines and areas with more than 20 categories get a zoom slider. Display › Axis › Zoom slider
|
|
47
|
+
› Off draws every category as before. A click on the legend changes the view, so Undo takes it
|
|
48
|
+
back ([upgrading](https://pivotkit.eize.dev/getting-started/upgrading/#from-0-7)).
|
|
49
|
+
- With `exportData` off, the default, the drill-down panel has no Export menu: no copy and no
|
|
50
|
+
download of its rows. Set `drillDownExport` to keep it
|
|
51
|
+
([upgrading](https://pivotkit.eize.dev/getting-started/upgrading/#drill-export)).
|
|
52
|
+
- The row count under the result says "2,190 of 4,386 rows" when a filter leaves rows out. A host
|
|
53
|
+
whose `labels` set `rowsCount` or add a language sets the new label `rowsFiltered` too
|
|
54
|
+
([upgrading](https://pivotkit.eize.dev/getting-started/upgrading/#rows-filtered)).
|
|
55
|
+
|
|
56
|
+
### Deprecated
|
|
57
|
+
|
|
58
|
+
- The theme token `--pk-knob` is unused: the chart's Display settings have no switch any more. It
|
|
59
|
+
goes in 0.9.0 ([#106](https://github.com/eizedev/pivotkit/issues/106)).
|
|
60
|
+
|
|
61
|
+
### Added
|
|
62
|
+
|
|
63
|
+
- "+ Add" in each zone opens "Add to Rows" (or the zone's name): every field with its type and the
|
|
64
|
+
field list's search. A field placed elsewhere shows its zone and moves. A pick that would change
|
|
65
|
+
nothing is disabled with its reason. Values takes a field again, and Filters opens the field's
|
|
66
|
+
filter first. The focus goes to the new chip, and a status region says what happened. Test ids:
|
|
67
|
+
`add-field-<zone>`, `add-pick-<field>`, `zones-status`. New labels: `addField`, `addFieldTo`,
|
|
68
|
+
`movedFrom`; the menu adds `addAlready`, `addMoves` and `addSecond`
|
|
69
|
+
([#581](https://github.com/eizedev/pivotkit/issues/581)).
|
|
70
|
+
- The `zones` prop (`"open"` or `"folded"`) sets whether the zones start open or folded. Without it,
|
|
71
|
+
the report's height decides ([#580](https://github.com/eizedev/pivotkit/issues/580)).
|
|
72
|
+
- Chart settings › Layout folds the groups of Rows in the words of the fields: "Show each Country",
|
|
73
|
+
"Show Region only". Table settings' Collapse all says what it keeps
|
|
74
|
+
([#580](https://github.com/eizedev/pivotkit/issues/580)).
|
|
75
|
+
- Theme tokens for the zones' section (`--pk-section-*`) and the tab shown (`--pk-tab-mark`)
|
|
76
|
+
([#580](https://github.com/eizedev/pivotkit/issues/580)).
|
|
77
|
+
- The data's date range before filters ("Data before filters: …"): in the footer next to the row count, and in a date
|
|
78
|
+
field's "i". The title of a cyclic grouping such as "Month of year" in the table and the chart
|
|
79
|
+
says which years it combines: "Date by month of year · 2023–2025 combined". With one year left,
|
|
80
|
+
month and quarter items carry it ("Jan 2025"); weekday, hour and week say "· 2025 only" in the
|
|
81
|
+
title. Exports keep the plain items and names.
|
|
82
|
+
Group lists the data's range first and shows hints from the data, under "One item per period"
|
|
83
|
+
and "Same period, years combined" ([#109](https://github.com/eizedev/pivotkit/issues/109)).
|
|
84
|
+
- A zoom slider under a long category axis, Display › Axis › Zoom slider (Automatic, On, Off). It
|
|
85
|
+
works by mouse, touch and keyboard, and keeps its place when the chart is drawn again. The PNG
|
|
86
|
+
image leaves it out ([#36](https://github.com/eizedev/pivotkit/issues/36)), ([#575](https://github.com/eizedev/pivotkit/issues/575)).
|
|
87
|
+
- A click on the legend hides or shows a series, or a slice. The view keeps it, a screen reader
|
|
88
|
+
hears it, and Undo takes it back. Display › Series does the same by keyboard ([#36](https://github.com/eizedev/pivotkit/issues/36)).
|
|
89
|
+
- Display › Layout › Stacked to 100 % for stacked bars and areas of sums and counts. The tooltip
|
|
90
|
+
shows each part's value and share, and the total of the values ([#36](https://github.com/eizedev/pivotkit/issues/36)).
|
|
91
|
+
- Export › **Copy chart image**: the chart as a PNG on the clipboard. `onExport` sees it first as
|
|
92
|
+
`"copy-chart"` ([#54](https://github.com/eizedev/pivotkit/issues/54)).
|
|
93
|
+
- The `colorMap` prop: a fixed colour per series or slice name across charts, one colour or one per
|
|
94
|
+
theme. Display › Series has a colour beside each series or slice, a view's own colour
|
|
95
|
+
([#54](https://github.com/eizedev/pivotkit/issues/54)).
|
|
96
|
+
- Display › Tooltip › Share in the tooltip: each value's share of the category's total, of a single
|
|
97
|
+
series' total, or of a pie ([#54](https://github.com/eizedev/pivotkit/issues/54)).
|
|
98
|
+
- Display › **Reference lines** in the chart type menu, for bars, lines and areas: a level with
|
|
99
|
+
**Average**, **Trend** and a **Target** (`chart.referenceLines`, [#48](https://github.com/eizedev/pivotkit/issues/48)).
|
|
100
|
+
Its row says which lines are on. The level offers only the lines the chart can draw, with a note
|
|
101
|
+
on the rest. The Target field reads "25%" as a share, with a hint for a value shown in percent.
|
|
102
|
+
The tooltip names the lines at the category, and the chart's text alternative names each with
|
|
103
|
+
its value.
|
|
104
|
+
- `labels.chartLines` and `labels.chartTrendSpan`: the reference lines in the chart's text
|
|
105
|
+
alternative ("Reference lines: {lines}.", "from {from} to {to}"), and the token
|
|
106
|
+
`--pk-chart-reference` for a target and the lines of a stack's total (default `--pk-muted`).
|
|
107
|
+
- Display › **Tooltip** in the chart type menu, for bars, lines and areas: **Automatic** or **All
|
|
108
|
+
series** (`chart.tooltip`, [#106](https://github.com/eizedev/pivotkit/issues/106)). All series lists
|
|
109
|
+
every series at the pointer's category, the hovered one first, its name in the strong weight.
|
|
110
|
+
- `labels.chartTotal`, the tooltip's "Total" line (German "Gesamt"), and `labels.chartMore`, the
|
|
111
|
+
line for the series that do not fit ("+{count} more"), and `labels.chartMoreInTotal` for it when
|
|
112
|
+
a total is shown ("+{count} more (in the total)").
|
|
113
|
+
- `--pk-tooltip-name-w` (default `12em`): the widest series name in the tooltip. A longer one ends
|
|
114
|
+
in "…".
|
|
115
|
+
|
|
116
|
+
- `drillDownExport`: the drill-down panel's copy and download while `exportData` is off, with every
|
|
117
|
+
column. Off by default.
|
|
118
|
+
|
|
119
|
+
### Changed
|
|
120
|
+
|
|
121
|
+
- Depends on `pivotkit-core` `^0.8.0` (was `^0.7.0`) and `pivotkit-report` `^0.4.0` (was `^0.3.0`): a host
|
|
122
|
+
that also lists pivotkit-core updates both together, or it gets two copies.
|
|
123
|
+
- The open zones are shelves: each zone's title, "i" and "+ Add" at its left, its chips beside them.
|
|
124
|
+
Shelves sit side by side while they fit and take a line of their own when they need it. The dashed
|
|
125
|
+
drop outline shows only while something is dragged. On a phone, "+ Add" sits at the right end of
|
|
126
|
+
the shelf's title row. A report with no field placed starts with its zones open, whatever its
|
|
127
|
+
height, unless `zones` says otherwise. The empty report's steps and the empty zones' hints name
|
|
128
|
+
"+ Add" too. A value that is in the view twice is "Sum of Revenue (2)" on its chip and in the
|
|
129
|
+
table. New tokens: `--pk-shelf-gap`, `--pk-shelf-pad`,
|
|
130
|
+
`--pk-shelf-min`, `--pk-chip-gap`, `--pk-chip-h`, `--pk-add-gap`, `--pk-add-hover`
|
|
131
|
+
([#581](https://github.com/eizedev/pivotkit/issues/581)).
|
|
132
|
+
- The chart's tooltip names the element under the pointer
|
|
133
|
+
([#376](https://github.com/eizedev/pivotkit/issues/376)):
|
|
134
|
+
- A bar or a line point shows that series alone.
|
|
135
|
+
- A segment of stacked bars, or a point of a stacked area, adds the sum of the stack's parts. A
|
|
136
|
+
value that does not add up gets no total: only sums and counts do, and not when shown as a rank
|
|
137
|
+
or a percent difference.
|
|
138
|
+
- Between the elements it lists every series at the category. Between stacked bars it shows the
|
|
139
|
+
total only.
|
|
140
|
+
- A series without a value at the category is left out, not shown as an empty line.
|
|
141
|
+
- Pie, donut and heatmap keep the tooltip of the slice or cell.
|
|
142
|
+
- The tooltip stays inside the chart. When more series are there than fit, the last line says how
|
|
143
|
+
many more there are.
|
|
144
|
+
|
|
145
|
+
- The drill-down panel's copy and download follow `exportData`. With it off, the panel shows the
|
|
146
|
+
rows but offers no copy and no download (#263).
|
|
147
|
+
- pivotkit-core's ECharts option (`toEChartsOption`) loads with ECharts, from `pivotkit-core/chart`,
|
|
148
|
+
not with the first load (#546).
|
|
149
|
+
- The row count under the result says how many of the data's rows the filters keep: "2,190 of 4,386
|
|
150
|
+
rows", German "2.190 von 4.386 Zeilen". With nothing filtered it says "4,386 rows" (#108).
|
|
151
|
+
Its words are pivotkit-core's `ROW_COUNT_TEXTS`, so the HTML report says the same (#547).
|
|
152
|
+
|
|
153
|
+
### Fixed
|
|
154
|
+
|
|
155
|
+
- The chart's tooltip names the element under the pointer after a redraw, and after the pointer
|
|
156
|
+
left the chart in one move, such as a tap elsewhere. It listed every series instead
|
|
157
|
+
([#576](https://github.com/eizedev/pivotkit/issues/576)).
|
|
158
|
+
- On a touch screen, a menu's rows and its Back row are at least 44 px high (`--pk-target-touch`)
|
|
159
|
+
on every level. They were 35 and 28 px ([#582](https://github.com/eizedev/pivotkit/issues/582)).
|
|
160
|
+
- Row labels, the field names above them and the value names keep their natural width, on one
|
|
161
|
+
line, when the table fits the report. Only a table that would be wider than the report wraps them,
|
|
162
|
+
between words first. Then the row labels share the room the value columns leave, not a fixed 40 %
|
|
163
|
+
of the width. A word breaks only when it alone is wider than its column ([#584](https://github.com/eizedev/pivotkit/issues/584)).
|
|
164
|
+
- On a touch screen, the first tap on a bar, a point or a heatmap cell shows its tooltip. The second
|
|
165
|
+
tap on it opens the rows behind it and calls `onCellClick`. The tooltip no longer stays over the
|
|
166
|
+
panel, and the panel no longer closes right after it opens ([#538](https://github.com/eizedev/pivotkit/issues/538)).
|
|
167
|
+
- A heatmap whose `--pk-heat-low` or `--pk-heat-high` is in a form ECharts cannot mix, such as
|
|
168
|
+
`oklch()` or `rgb()` with spaces, shows the host's colours instead of black cells. So do the HTML
|
|
169
|
+
report and the SVG of the Export menu, whose table also takes an `oklch()` colour scale ([#386](https://github.com/eizedev/pivotkit/issues/386)).
|
|
170
|
+
- With a field on Columns, a pie's, a donut's and a heatmap's tooltip is titled by the value, not by
|
|
171
|
+
the first column, from pivotkit-core ([#537](https://github.com/eizedev/pivotkit/issues/537)).
|
|
172
|
+
- A view's locale that the browser has no data for, such as `xx-XX`, is reported as unknown, and
|
|
173
|
+
the report takes the `locale` prop. Such a `locale` prop takes `en-US` with a warning. Before,
|
|
174
|
+
both took the machine's locale, from pivotkit-core ([#552](https://github.com/eizedev/pivotkit/issues/552)).
|
|
175
|
+
- Export → Source data is greyed out while the data have no rows, like the table's entries. It says
|
|
176
|
+
"The data has no rows yet." ([#585](https://github.com/eizedev/pivotkit/issues/585)).
|
|
177
|
+
- A relative date filter that holds today no longer says that the days from today on have no data,
|
|
178
|
+
while the data have no date after today. Data up to yesterday give "last 4 weeks (Oct 26,
|
|
179
|
+
2026–Nov 22, 2026)", not a second part for the rest of the week. Days before today without rows
|
|
180
|
+
are still named, also in a range with no data at all: "last 1 week (Nov 16, 2026 has no data)".
|
|
181
|
+
A range wholly after today, and data with rows dated after today, name every day without data.
|
|
182
|
+
The "Include the current …" checkbox and its count back from the latest record follow the same
|
|
183
|
+
rule. The chip, its tooltip, the summary, the menu's first level and the Filter level's choices
|
|
184
|
+
say the same ([#586](https://github.com/eizedev/pivotkit/issues/586)).
|
|
185
|
+
- "Table as CSV" in a locale whose own decimal mark is `٫` (`ar-EG`, `ar-SA`, `fa-IR`, `ur-IN`,
|
|
186
|
+
`ps-AF` and others) writes the decimal mark the locale uses with Latin digits, from pivotkit-core:
|
|
187
|
+
`9.6`, not `9٫6`, which parsers misread ([#478](https://github.com/eizedev/pivotkit/issues/478)).
|
|
188
|
+
- The chart's labels at small sizes, from pivotkit-core: slanted category names leave the plot its
|
|
189
|
+
height, a donut's outside labels stay whole, the value at the end of a horizontal bar is not cut,
|
|
190
|
+
and a heatmap names every row that has room ([#228](https://github.com/eizedev/pivotkit/issues/228), [#229](https://github.com/eizedev/pivotkit/issues/229), [#230](https://github.com/eizedev/pivotkit/issues/230),
|
|
191
|
+
[#231](https://github.com/eizedev/pivotkit/issues/231)).
|
|
192
|
+
- The zones fold when they no longer fit the report's box, also when the box keeps its size. Longer
|
|
193
|
+
texts in another language, more fields in Rows, a tip or a late stylesheet made them taller without
|
|
194
|
+
a resize, and they stayed open over a squeezed result. Folded that way, they open again once they
|
|
195
|
+
fit (#93).
|
|
196
|
+
|
|
9
197
|
## [0.7.0] - 2026-11-16
|
|
10
198
|
|
|
11
199
|
### Upgrading from 0.6
|
|
@@ -1093,7 +1281,9 @@ First release.
|
|
|
1093
1281
|
weather (Open-Meteo), countries (World Bank), earthquakes (USGS), Nobel laureates and the release
|
|
1094
1282
|
cycles of software products (endoflife.date).
|
|
1095
1283
|
|
|
1096
|
-
[Unreleased]: https://github.com/eizedev/pivotkit/compare/pivotkit-react@0.
|
|
1284
|
+
[Unreleased]: https://github.com/eizedev/pivotkit/compare/pivotkit-react@0.8.1...HEAD
|
|
1285
|
+
[0.8.1]: https://github.com/eizedev/pivotkit/compare/pivotkit-react@0.8.0...pivotkit-react@0.8.1
|
|
1286
|
+
[0.8.0]: https://github.com/eizedev/pivotkit/compare/pivotkit-react@0.7.0...pivotkit-react@0.8.0
|
|
1097
1287
|
[0.7.0]: https://github.com/eizedev/pivotkit/compare/pivotkit-react@0.6.1...pivotkit-react@0.7.0
|
|
1098
1288
|
[0.6.1]: https://github.com/eizedev/pivotkit/compare/pivotkit-react@0.6.0...pivotkit-react@0.6.1
|
|
1099
1289
|
[0.6.0]: https://github.com/eizedev/pivotkit/compare/pivotkit-react@0.5.0...pivotkit-react@0.6.0
|
package/README.md
CHANGED
|
@@ -1,13 +1,8 @@
|
|
|
1
1
|
# pivotkit-react
|
|
2
2
|
|
|
3
3
|
The pivot report builder of [pivotkit](https://pivotkit.eize.dev/) as a React 18/19 component,
|
|
4
|
-
`<PivotReport
|
|
5
|
-
|
|
6
|
-
drill-down to the rows behind a value, undo and redo, saved and shared views as JSON files, and
|
|
7
|
-
Excel, CSV, HTML report, PNG and SVG export and printing. Where the host turns them on, people load
|
|
8
|
-
their own CSV, JSON or Excel file with a preview (`allowImport`) and download the rows behind the
|
|
9
|
-
report for the command line (`exportData`). Excel's PivotTable is the reference; the engine is
|
|
10
|
-
[pivotkit-core](https://www.npmjs.com/package/pivotkit-core).
|
|
4
|
+
`<PivotReport>`. People build pivot tables and charts from your data by drag and drop. Excel's
|
|
5
|
+
PivotTable is the reference. The engine is [pivotkit-core](https://www.npmjs.com/package/pivotkit-core).
|
|
11
6
|
|
|
12
7
|
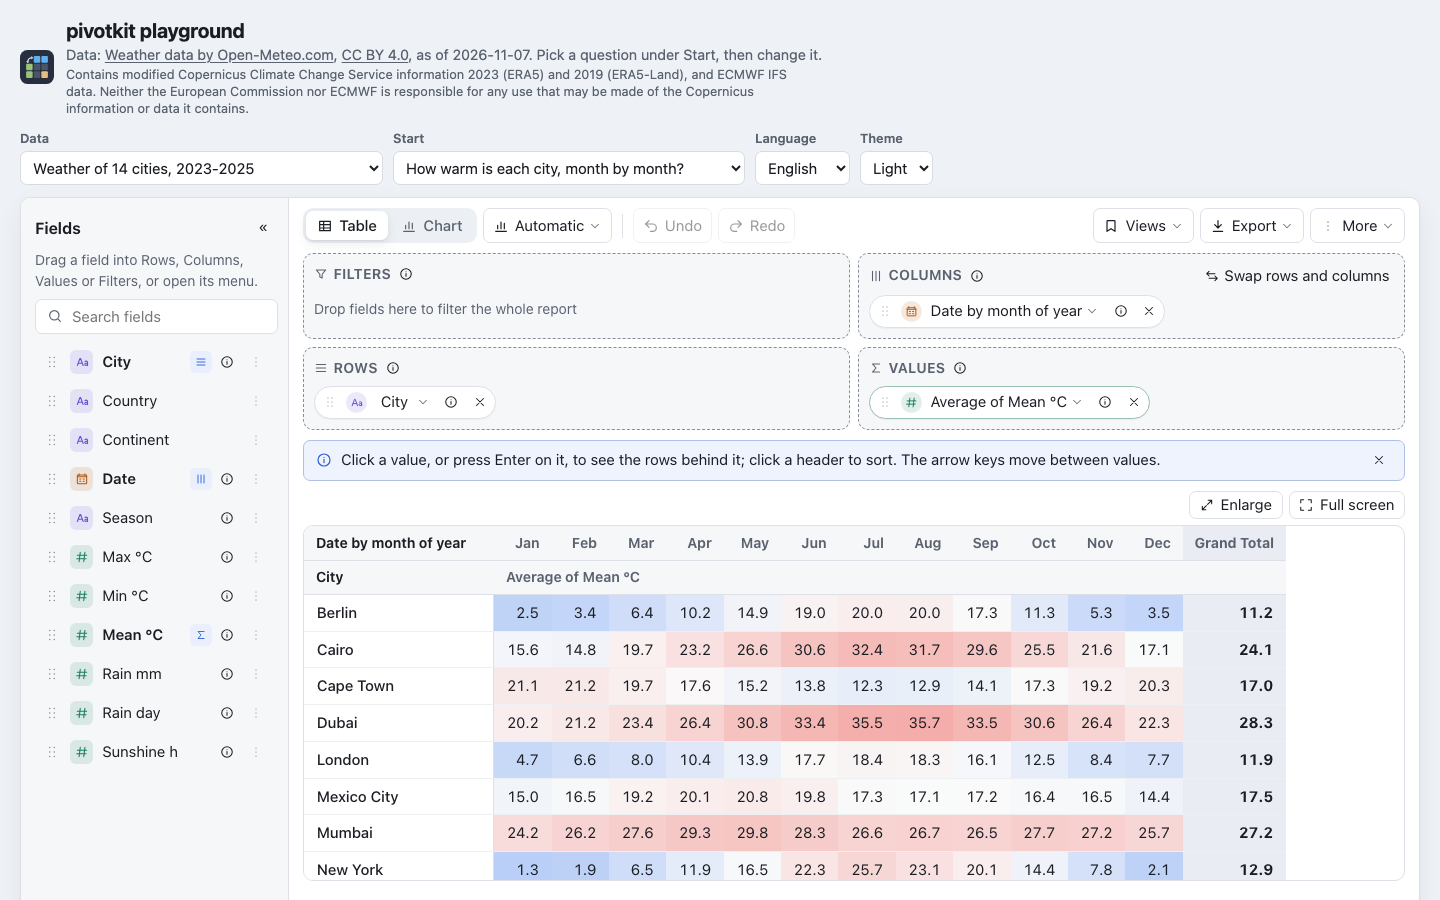
|
|
13
8
|
|
|
@@ -26,10 +21,12 @@ npm install pivotkit-react react react-dom echarts
|
|
|
26
21
|
| `react`, `react-dom` | `>=18.2 <20` | Hooks break with two copies of React in one page. Tested on React 18 and 19. |
|
|
27
22
|
| `echarts` | `>=6.1.0 <7` | About 1 MB, and its security updates stay with your app. Loaded on the first chart only. |
|
|
28
23
|
|
|
29
|
-
|
|
30
|
-
|
|
31
|
-
|
|
32
|
-
|
|
24
|
+
- The package includes TypeScript declarations.
|
|
25
|
+
- pivotkit-core, pivotkit-report and @dnd-kit come with the package. It depends on pivotkit-core with
|
|
26
|
+
a caret range.
|
|
27
|
+
- In 0.x a caret range spans patch versions only: `^0.y.z` means 0.y.z and later 0.y patches. If your
|
|
28
|
+
app also imports pivotkit-core itself, use a version inside that range. npm shares one copy only
|
|
29
|
+
when the ranges overlap.
|
|
33
30
|
|
|
34
31
|
## Example
|
|
35
32
|
|
|
@@ -47,9 +44,30 @@ export function TicketReport({ rows }) {
|
|
|
47
44
|
}
|
|
48
45
|
```
|
|
49
46
|
|
|
50
|
-
Without app state, `defaultView={start}`
|
|
51
|
-
|
|
52
|
-
the
|
|
47
|
+
Without app state, pass `defaultView={start}` instead, and the report keeps the view itself.
|
|
48
|
+
|
|
49
|
+
The view is plain JSON. It is the preset, the saved view and the undo step at once. The report treats
|
|
50
|
+
it as user input and checks it against the data. A view cannot run code.
|
|
51
|
+
|
|
52
|
+
## What it does
|
|
53
|
+
|
|
54
|
+
- A searchable field list.
|
|
55
|
+
- Four drop zones: Rows, Columns, Values and Filters, with drag and drop, "+ Add" in each zone and a
|
|
56
|
+
menu on every field.
|
|
57
|
+
- Table and chart. The chart uses Apache ECharts.
|
|
58
|
+
- Filters with value counts.
|
|
59
|
+
- Dates grouped by year, quarter, month and more. The footer gives the data's date range, and a
|
|
60
|
+
grouping such as "Month of year" says which years it combines.
|
|
61
|
+
- Drill-down to the rows behind a value.
|
|
62
|
+
- Undo and redo.
|
|
63
|
+
- Saved and shared views as JSON files.
|
|
64
|
+
- Export to Excel, CSV, HTML report, PNG and SVG, and printing.
|
|
65
|
+
|
|
66
|
+
Two more features are off until the host turns them on:
|
|
67
|
+
|
|
68
|
+
- `allowImport`: people load their own CSV, JSON or Excel file, with a preview.
|
|
69
|
+
- `exportData`: people download the rows behind the report for the command line. It also gives
|
|
70
|
+
the drill-down its copy and download. `drillDownExport` gives the drill-down those alone.
|
|
53
71
|
|
|
54
72
|
## Where in the docs
|
|
55
73
|
|
|
@@ -64,7 +82,7 @@ the data; it cannot run code.
|
|
|
64
82
|
| The view | [Views and saved views](https://pivotkit.eize.dev/concepts/views/) |
|
|
65
83
|
| Saved and shared views, links | [Templates and shared views](https://pivotkit.eize.dev/concepts/templates/), [Sharing](https://pivotkit.eize.dev/concepts/sharing/), [View file format](https://pivotkit.eize.dev/reference/view-file/) |
|
|
66
84
|
| Field names, descriptions, defaults | [Field descriptions and names](https://pivotkit.eize.dev/concepts/fields/) |
|
|
67
|
-
| Charts and `chartOptions` | [Charts](https://pivotkit.eize.dev/concepts/charts/#chartoptions-for-developers) |
|
|
85
|
+
| Charts, `colorMap` and `chartOptions` | [Charts](https://pivotkit.eize.dev/concepts/charts/#chartoptions-for-developers) |
|
|
68
86
|
| Theming: the `--pk-*` tokens | [Theming](https://pivotkit.eize.dev/reference/theming/) |
|
|
69
87
|
| Languages and labels | [Localisation](https://pivotkit.eize.dev/reference/localisation/) |
|
|
70
88
|
| Limits | [Locale, time zones, limits and errors](https://pivotkit.eize.dev/concepts/limits/#limits) |
|
|
@@ -21,6 +21,13 @@ var de = {
|
|
|
21
21
|
axisLabels: "Achsenbeschriftung",
|
|
22
22
|
groupLabels: "Gruppenbeschriftung",
|
|
23
23
|
labelPosition: "Beschriftungsposition",
|
|
24
|
+
tooltip: "Tooltip",
|
|
25
|
+
zoom: "Zoom-Schieber",
|
|
26
|
+
stackPercent: "100-%-Stapel",
|
|
27
|
+
hidden: "ausgeblendete Reihen",
|
|
28
|
+
colors: "Farben",
|
|
29
|
+
tooltipShare: "Anteil im Tooltip",
|
|
30
|
+
target: "Ziellinie",
|
|
24
31
|
other: "Einstellung"
|
|
25
32
|
},
|
|
26
33
|
dropped: {
|
|
@@ -1,8 +1,13 @@
|
|
|
1
1
|
// src/labels.js
|
|
2
|
-
import { GROUPING_NAMES, PivotkitError, REPORT_LABELS } from "pivotkit-core";
|
|
2
|
+
import { GROUPING_NAMES, PLURAL_CATEGORIES, PivotkitError, REPORT_LABELS, ROW_COUNT_TEXTS, pluralForm } from "pivotkit-core";
|
|
3
3
|
var en = {
|
|
4
4
|
/** the language of the texts, for the report's lang attribute */
|
|
5
5
|
lang: "en",
|
|
6
|
+
dateYearsCombined: "{years} combined",
|
|
7
|
+
dateYearOnly: "{years} only",
|
|
8
|
+
dateRangeTitle: "{field}: the data's first and last date, before filters",
|
|
9
|
+
dateRangeData: "Data before filters: {range}",
|
|
10
|
+
dateRangeField: "{field} before filters: {range}",
|
|
6
11
|
/** the name of the report's region landmark */
|
|
7
12
|
report: "Pivot report",
|
|
8
13
|
core: (
|
|
@@ -11,10 +16,10 @@ var en = {
|
|
|
11
16
|
),
|
|
12
17
|
zones: { rows: "Rows", cols: "Columns", values: "Values", filters: "Filters" },
|
|
13
18
|
zoneHints: {
|
|
14
|
-
rows: "
|
|
15
|
-
cols: "
|
|
16
|
-
values: "
|
|
17
|
-
filters: "
|
|
19
|
+
rows: "Add or drop a field to group rows",
|
|
20
|
+
cols: "Add or drop a field to group columns",
|
|
21
|
+
values: "Add or drop a number to sum or count it",
|
|
22
|
+
filters: "Add or drop a field to filter"
|
|
18
23
|
},
|
|
19
24
|
fields: "Fields",
|
|
20
25
|
fieldsHint: "Drag a field into Rows, Columns, Values or Filters, or open its menu.",
|
|
@@ -28,6 +33,11 @@ var en = {
|
|
|
28
33
|
addAgain: "Add to {zone} again",
|
|
29
34
|
// a click on a field that is in its zone already: said in the status line
|
|
30
35
|
alreadyIn: "{field} is already in {zone}",
|
|
36
|
+
// "+ Add" in each zone: its text, and its name and tooltip
|
|
37
|
+
addField: "Add",
|
|
38
|
+
addFieldTo: "Add a field to {zone}",
|
|
39
|
+
// said in the zones' status line after a field from "+ Add" moved there from another zone
|
|
40
|
+
movedFrom: "{field} moved from {from} to {zone}",
|
|
31
41
|
move: "Move",
|
|
32
42
|
moveTo: "Move to {zone}",
|
|
33
43
|
dragHandle: "Drag {field}",
|
|
@@ -59,10 +69,12 @@ var en = {
|
|
|
59
69
|
// next to Views: the name of the view loaded, and the mark while it has changes not saved
|
|
60
70
|
unsavedChanges: "Unsaved changes",
|
|
61
71
|
swap: "Swap rows and columns",
|
|
62
|
-
// the
|
|
63
|
-
|
|
64
|
-
|
|
72
|
+
// the section of the zones: its heading, and its line under it while open (folded: what is placed,
|
|
73
|
+
// or layoutEmpty)
|
|
74
|
+
zonesTitle: "Fields in the report",
|
|
75
|
+
zonesHint: "Drag fields into Filters, Columns, Rows and Values, or use Add in each one.",
|
|
65
76
|
layoutEmpty: "No fields placed yet",
|
|
77
|
+
// always at the end of the toolbar: Help first, then the buttons that do not fit
|
|
66
78
|
more: "More",
|
|
67
79
|
// the Views menu: the saved views (the host's templates) and sharing
|
|
68
80
|
views: "Views",
|
|
@@ -74,7 +86,11 @@ var en = {
|
|
|
74
86
|
emptyDrop: "Drop a file onto the report, or",
|
|
75
87
|
emptyNoData: "Load data to start",
|
|
76
88
|
exportLabel: "Export",
|
|
77
|
-
|
|
89
|
+
// the button beside the tabs Table and Chart: the settings of the view shown
|
|
90
|
+
tableSettings: "Table settings",
|
|
91
|
+
chartSettings: "Chart settings",
|
|
92
|
+
// the same button's text on a phone; its name stays the whole one
|
|
93
|
+
settingsShort: "Settings",
|
|
78
94
|
expand: "Expand {label}",
|
|
79
95
|
collapse: "Collapse {label}",
|
|
80
96
|
showAs: "Show as",
|
|
@@ -105,7 +121,7 @@ var en = {
|
|
|
105
121
|
},
|
|
106
122
|
// a date grouping's name: "Date by month"; the unit as it reads inside it (unitInName); pivotkit-core's GROUPING_NAMES
|
|
107
123
|
derivedName: GROUPING_NAMES.en.name,
|
|
108
|
-
unitInName:
|
|
124
|
+
unitInName: GROUPING_NAMES.en.units,
|
|
109
125
|
binsName: GROUPING_NAMES.en.bins,
|
|
110
126
|
top: "Top",
|
|
111
127
|
topBadge: "Top {count}",
|
|
@@ -121,8 +137,8 @@ var en = {
|
|
|
121
137
|
// result
|
|
122
138
|
emptyTitle: "Build your report in three steps",
|
|
123
139
|
emptySteps: [
|
|
124
|
-
"
|
|
125
|
-
"
|
|
140
|
+
"Click + Add next to Rows, or drag a field such as a team or region into it.",
|
|
141
|
+
"Add a number to Values the same way: it is summed, or counted for text.",
|
|
126
142
|
"Add a field to Columns, switch to Chart or export to Excel."
|
|
127
143
|
],
|
|
128
144
|
emptyFields: "The data has no columns.",
|
|
@@ -145,8 +161,11 @@ var en = {
|
|
|
145
161
|
dismissIssues: "Dismiss",
|
|
146
162
|
loadingChart: "Loading chart\u2026",
|
|
147
163
|
noChartData: "Add a value to see a chart.",
|
|
148
|
-
// a count in words: one form per Intl.PluralRules category of the language ("one", "other", ...)
|
|
149
|
-
|
|
164
|
+
// a count in words: one form per Intl.PluralRules category of the language ("one", "other", ...);
|
|
165
|
+
// the row counts are pivotkit-core's, so pivotkit-report's HTML report says the same
|
|
166
|
+
rowsCount: ROW_COUNT_TEXTS.en.rowsCount,
|
|
167
|
+
// a filter left rows out: the rows kept ({shown}) of the data's ({count}, which picks the form)
|
|
168
|
+
rowsFiltered: ROW_COUNT_TEXTS.en.rowsFiltered,
|
|
150
169
|
tableName: "Pivot table",
|
|
151
170
|
emptyCell: "No rows",
|
|
152
171
|
emptyValue: "No value",
|
|
@@ -157,8 +176,24 @@ var en = {
|
|
|
157
176
|
chartCategories: { one: "{count} category", other: "{count} categories" },
|
|
158
177
|
chartSeries: { one: "{count} series", other: "{count} series" },
|
|
159
178
|
chartExtremes: "Highest {max} at {maxAt}; lowest {min} at {minAt}.",
|
|
179
|
+
// the chart's reference lines in its text alternative: "Average 25; Trend from 10 to 40"
|
|
180
|
+
chartLines: "Reference lines: {lines}.",
|
|
181
|
+
chartTrendSpan: "from {from} to {to}",
|
|
160
182
|
// the last sentence of the chart's text alternative
|
|
161
183
|
chartTableHint: "Switch to Table to read every value.",
|
|
184
|
+
// the tooltip's last line on stacked bars and areas: the sum of the stack's parts
|
|
185
|
+
chartTotal: "Total",
|
|
186
|
+
// the tooltip's line for the series that do not fit
|
|
187
|
+
chartMore: "+{count} more",
|
|
188
|
+
chartMoreInTotal: "+{count} more (in the total)",
|
|
189
|
+
// said when a click on the legend hides or shows a series (or a slice)
|
|
190
|
+
// the chart's text alternative of a 100 % stack
|
|
191
|
+
chartShares: "Shown as shares of each stack.",
|
|
192
|
+
// the zoom slider by keyboard: its name, and what it shows
|
|
193
|
+
chartZoom: "Zoom window",
|
|
194
|
+
chartZoomWindow: "Categories {from} to {to} of {count}",
|
|
195
|
+
chartHidden: "{name} hidden",
|
|
196
|
+
chartShown: "{name} shown",
|
|
162
197
|
categories: "categories",
|
|
163
198
|
close: "Close",
|
|
164
199
|
// toasts and live region
|
|
@@ -354,6 +389,11 @@ var en = {
|
|
|
354
389
|
};
|
|
355
390
|
var de = {
|
|
356
391
|
lang: "de",
|
|
392
|
+
dateYearsCombined: "{years} zusammengefasst",
|
|
393
|
+
dateYearOnly: "nur {years}",
|
|
394
|
+
dateRangeTitle: "{field}: erstes und letztes Datum der Daten, vor den Filtern",
|
|
395
|
+
dateRangeData: "Daten vor den Filtern: {range}",
|
|
396
|
+
dateRangeField: "{field} vor den Filtern: {range}",
|
|
357
397
|
report: "Pivot-Bericht",
|
|
358
398
|
core: (
|
|
359
399
|
/** @type {import("pivotkit-core").Labels} */
|
|
@@ -361,10 +401,10 @@ var de = {
|
|
|
361
401
|
),
|
|
362
402
|
zones: { rows: "Zeilen", cols: "Spalten", values: "Werte", filters: "Filter" },
|
|
363
403
|
zoneHints: {
|
|
364
|
-
rows: "
|
|
365
|
-
cols: "
|
|
366
|
-
values: "
|
|
367
|
-
filters: "
|
|
404
|
+
rows: "Ein Feld hinzuf\xFCgen oder hierher ziehen, um Zeilen zu gruppieren",
|
|
405
|
+
cols: "Ein Feld hinzuf\xFCgen oder hierher ziehen, um Spalten zu gruppieren",
|
|
406
|
+
values: "Eine Zahl hinzuf\xFCgen oder hierher ziehen, um sie zu summieren oder zu z\xE4hlen",
|
|
407
|
+
filters: "Ein Feld hinzuf\xFCgen oder hierher ziehen, um zu filtern"
|
|
368
408
|
},
|
|
369
409
|
fields: "Felder",
|
|
370
410
|
fieldsHint: "Ein Feld in Zeilen, Spalten, Werte oder Filter ziehen oder sein Men\xFC \xF6ffnen.",
|
|
@@ -375,6 +415,9 @@ var de = {
|
|
|
375
415
|
addTo: "Zu {zone} hinzuf\xFCgen",
|
|
376
416
|
addAgain: "Noch einmal zu {zone} hinzuf\xFCgen",
|
|
377
417
|
alreadyIn: "{field} ist bereits in {zone}",
|
|
418
|
+
addField: "Hinzuf\xFCgen",
|
|
419
|
+
addFieldTo: "Ein Feld zu {zone} hinzuf\xFCgen",
|
|
420
|
+
movedFrom: "{field} von {from} nach {zone} verschoben",
|
|
378
421
|
move: "Verschieben",
|
|
379
422
|
moveTo: "Nach {zone} verschieben",
|
|
380
423
|
dragHandle: "{field} ziehen",
|
|
@@ -402,8 +445,8 @@ var de = {
|
|
|
402
445
|
newAlready: "Der Bericht ist schon leer.",
|
|
403
446
|
unsavedChanges: "Nicht gespeicherte \xC4nderungen",
|
|
404
447
|
swap: "Zeilen und Spalten tauschen",
|
|
405
|
-
|
|
406
|
-
|
|
448
|
+
zonesTitle: "Felder im Bericht",
|
|
449
|
+
zonesHint: "Felder in Filter, Spalten, Zeilen und Werte ziehen oder in jedem Bereich Hinzuf\xFCgen nutzen.",
|
|
407
450
|
layoutEmpty: "Noch keine Felder angeordnet",
|
|
408
451
|
more: "Mehr",
|
|
409
452
|
views: "Ansichten",
|
|
@@ -414,7 +457,9 @@ var de = {
|
|
|
414
457
|
emptyDrop: "Eine Datei auf den Bericht ziehen, oder",
|
|
415
458
|
emptyNoData: "Daten laden, um zu beginnen",
|
|
416
459
|
exportLabel: "Export",
|
|
417
|
-
|
|
460
|
+
tableSettings: "Tabelleneinstellungen",
|
|
461
|
+
chartSettings: "Diagrammeinstellungen",
|
|
462
|
+
settingsShort: "Einstellungen",
|
|
418
463
|
expand: "{label} aufklappen",
|
|
419
464
|
collapse: "{label} zuklappen",
|
|
420
465
|
showAs: "Anzeigen als",
|
|
@@ -443,7 +488,7 @@ var de = {
|
|
|
443
488
|
bin: "Bereiche"
|
|
444
489
|
},
|
|
445
490
|
derivedName: GROUPING_NAMES.de.name,
|
|
446
|
-
unitInName:
|
|
491
|
+
unitInName: GROUPING_NAMES.de.units,
|
|
447
492
|
binsName: GROUPING_NAMES.de.bins,
|
|
448
493
|
top: "Oberste",
|
|
449
494
|
topBadge: "Top {count}",
|
|
@@ -456,8 +501,8 @@ var de = {
|
|
|
456
501
|
condition: "Textbedingung",
|
|
457
502
|
emptyTitle: "Den Bericht in drei Schritten bauen",
|
|
458
503
|
emptySteps: [
|
|
459
|
-
"
|
|
460
|
-
"Eine Zahl
|
|
504
|
+
"Neben Zeilen auf + Hinzuf\xFCgen klicken oder ein Feld wie Team oder Region hineinziehen.",
|
|
505
|
+
"Eine Zahl genauso zu Werte hinzuf\xFCgen: Sie wird summiert, Text wird gez\xE4hlt.",
|
|
461
506
|
"Ein Feld in Spalten ziehen, zum Diagramm wechseln oder nach Excel exportieren."
|
|
462
507
|
],
|
|
463
508
|
emptyFields: "Die Daten haben keine Spalten.",
|
|
@@ -477,7 +522,8 @@ var de = {
|
|
|
477
522
|
dismissIssues: "Ausblenden",
|
|
478
523
|
loadingChart: "Diagramm wird geladen\u2026",
|
|
479
524
|
noChartData: "Einen Wert hinzuf\xFCgen, um ein Diagramm zu sehen.",
|
|
480
|
-
rowsCount:
|
|
525
|
+
rowsCount: ROW_COUNT_TEXTS.de.rowsCount,
|
|
526
|
+
rowsFiltered: ROW_COUNT_TEXTS.de.rowsFiltered,
|
|
481
527
|
tableName: "Pivot-Tabelle",
|
|
482
528
|
emptyCell: "Keine Zeilen",
|
|
483
529
|
emptyValue: "Kein Wert",
|
|
@@ -487,7 +533,17 @@ var de = {
|
|
|
487
533
|
chartCategories: { one: "{count} Kategorie", other: "{count} Kategorien" },
|
|
488
534
|
chartSeries: { one: "{count} Reihe", other: "{count} Reihen" },
|
|
489
535
|
chartExtremes: "H\xF6chster Wert {max} bei {maxAt}; niedrigster {min} bei {minAt}.",
|
|
536
|
+
chartLines: "Bezugslinien: {lines}.",
|
|
537
|
+
chartTrendSpan: "von {from} bis {to}",
|
|
490
538
|
chartTableHint: "Zur Tabelle wechseln, um jeden Wert zu lesen.",
|
|
539
|
+
chartTotal: "Gesamt",
|
|
540
|
+
chartMore: "+{count} weitere",
|
|
541
|
+
chartMoreInTotal: "+{count} weitere (im Gesamtwert)",
|
|
542
|
+
chartShares: "Als Anteile je Stapel dargestellt.",
|
|
543
|
+
chartZoom: "Zoom-Fenster",
|
|
544
|
+
chartZoomWindow: "Kategorien {from} bis {to} von {count}",
|
|
545
|
+
chartHidden: "{name} ausgeblendet",
|
|
546
|
+
chartShown: "{name} eingeblendet",
|
|
491
547
|
categories: "Kategorien",
|
|
492
548
|
close: "Schlie\xDFen",
|
|
493
549
|
toastRemoved: "{field} entfernt",
|
|
@@ -687,16 +743,13 @@ function hostFailure(withMessage, withoutMessage, error) {
|
|
|
687
743
|
function fill(template, values) {
|
|
688
744
|
return String(template).replace(/\{(\w+)\}/g, (all, name) => Object.hasOwn(values, name) ? String(values[name]) : all);
|
|
689
745
|
}
|
|
690
|
-
var PLURAL_CATEGORIES = Object.freeze(["zero", "one", "two", "few", "many", "other"]);
|
|
691
746
|
var isPluralForms = (v) => v !== null && typeof v === "object" && !Array.isArray(v) && Object.hasOwn(v, "other") && Object.keys(v).every((k) => PLURAL_CATEGORIES.includes(k));
|
|
692
747
|
function plural(forms, count, { lang, locale }) {
|
|
693
|
-
|
|
694
|
-
|
|
695
|
-
|
|
696
|
-
|
|
697
|
-
}
|
|
698
|
-
const form = typeof forms[category] === "string" ? forms[category] : forms.other;
|
|
699
|
-
return fill(form ?? "", { count: count.toLocaleString(locale) });
|
|
748
|
+
return fill(pluralForm(forms, count, lang), { count: count.toLocaleString(locale) });
|
|
749
|
+
}
|
|
750
|
+
function rowCount(shown, total, labels, locale) {
|
|
751
|
+
const lang = { lang: labels.lang, locale };
|
|
752
|
+
return shown < total ? fill(plural(labels.rowsFiltered, total, lang), { shown: shown.toLocaleString(locale) }) : plural(labels.rowsCount, total, lang);
|
|
700
753
|
}
|
|
701
754
|
var isObject = (v) => v !== null && typeof v === "object" && !Array.isArray(v);
|
|
702
755
|
var isTextList = (v) => Array.isArray(v) && v.every((x) => typeof x === "string");
|
|
@@ -753,6 +806,16 @@ function withLegacyTips(custom) {
|
|
|
753
806
|
}
|
|
754
807
|
return { ...custom, tips: { ...moved, ...isObject(custom.tips) ? custom.tips : {} } };
|
|
755
808
|
}
|
|
809
|
+
var REMOVED_LABELS = Object.freeze({ layout: "zonesTitle", showLayout: "zonesTitle", options: "tableSettings", chartDisplay: "chartSettings" });
|
|
810
|
+
function removedLabels(custom) {
|
|
811
|
+
if (!isObject(custom)) {
|
|
812
|
+
return [];
|
|
813
|
+
}
|
|
814
|
+
return Object.keys(
|
|
815
|
+
/** @type {object} */
|
|
816
|
+
custom
|
|
817
|
+
).filter((k) => Object.hasOwn(REMOVED_LABELS, k)).map((k) => [k, REMOVED_LABELS[k]]);
|
|
818
|
+
}
|
|
756
819
|
function resolveLabels(locale, custom) {
|
|
757
820
|
const lang = typeof locale === "string" ? locale.toLowerCase().split(/[-_]/)[0] : "en";
|
|
758
821
|
const base = Object.hasOwn(LABELS, lang) ? LABELS[lang] : en;
|
|
@@ -770,7 +833,9 @@ export {
|
|
|
770
833
|
hostFailure,
|
|
771
834
|
fill,
|
|
772
835
|
plural,
|
|
836
|
+
rowCount,
|
|
773
837
|
MENU_TEXTS,
|
|
774
838
|
mergeLabels,
|
|
839
|
+
removedLabels,
|
|
775
840
|
resolveLabels
|
|
776
841
|
};
|