pivotkit-react 0.6.1 → 0.8.0
This diff represents the content of publicly available package versions that have been released to one of the supported registries. The information contained in this diff is provided for informational purposes only and reflects changes between package versions as they appear in their respective public registries.
- package/CHANGELOG.md +212 -1
- package/README.md +33 -15
- package/dist/chunks/{chunk-JMRTIOX4.js → chunk-2N2UGSIG.js} +7 -0
- package/dist/chunks/{chunk-ZK5RVCHP.js → chunk-BHHIZHUE.js} +1 -1
- package/dist/chunks/{chunk-YXLANLGL.js → chunk-GUSQWPTH.js} +56 -3
- package/dist/chunks/{chunk-JOWAEZAD.js → chunk-JAOOFDNR.js} +21 -1
- package/dist/chunks/{chunk-E6M57YLL.js → chunk-MU5BTKSY.js} +7 -0
- package/dist/chunks/{chunk-TR2HROIK.js → chunk-RNQ32FCN.js} +66 -5
- package/dist/chunks/{chunk-XN5HNKJ2.js → chunk-SJCG4I57.js} +98 -33
- package/dist/chunks/{chunk-3LDE2GPG.js → chunk-VMJMDP7C.js} +372 -33
- package/dist/chunks/{report-run-BZBFOMPF.js → report-run-HU4WPOB7.js} +3 -1
- package/dist/chunks/{unused-texts-Y4R67XSN.js → unused-texts-LRYVWFFN.js} +1 -1
- package/dist/chunks/{unused-texts-de-6YVPTNVS.js → unused-texts-de-GB3IWWEM.js} +1 -1
- package/dist/echarts.js +426 -35
- package/dist/import-ui.js +3 -3
- package/dist/index.js +769 -435
- package/dist/labels.js +6 -6
- package/dist/menu-texts-de.js +1 -1
- package/dist/menus.js +1133 -542
- package/dist/styles.css +271 -158
- package/package.json +8 -4
- package/styles.css.d.ts +3 -0
- package/types/PivotReport.d.ts +6 -0
- package/types/add-menu.d.ts +48 -0
- package/types/chart-colors.d.ts +8 -0
- package/types/chart-decorate.d.ts +66 -3
- package/types/chart-legend.d.ts +176 -0
- package/types/chart-summary.d.ts +8 -3
- package/types/chart-tooltip.d.ts +159 -17
- package/types/chart.d.ts +21 -3
- package/types/date-context.d.ts +30 -0
- package/types/drill-panel.d.ts +4 -2
- package/types/echarts.d.ts +7 -3
- package/types/export-run.d.ts +19 -14
- package/types/export-scope.d.ts +13 -2
- package/types/field-info.d.ts +12 -0
- package/types/files.d.ts +14 -0
- package/types/filter.d.ts +18 -0
- package/types/group-context.d.ts +20 -0
- package/types/index.d.ts +35 -6
- package/types/label-room.d.ts +13 -0
- package/types/labels.d.ts +85 -16
- package/types/lazy-menus.d.ts +2 -2
- package/types/levels.d.ts +16 -7
- package/types/menu-labels.d.ts +67 -1
- package/types/menu-ops.d.ts +10 -0
- package/types/menu-topics.d.ts +110 -21
- package/types/menus.d.ts +3 -2
- package/types/names.d.ts +32 -3
- package/types/overflow.d.ts +18 -30
- package/types/print-frame.d.ts +32 -3
- package/types/report-run.d.ts +5 -0
- package/types/rove.d.ts +10 -0
- package/types/theme-tokens.d.ts +17 -0
- package/types/toolbar-panels.d.ts +43 -15
- package/types/unused-texts.d.ts +7 -0
- package/types/use-big-result.d.ts +24 -9
- package/types/use-export.d.ts +8 -4
- package/types/view-ops.d.ts +19 -8
- package/types/view-tabs.d.ts +12 -0
- package/types/zones.d.ts +41 -9
- package/types/light-tokens.d.ts +0 -16
package/CHANGELOG.md
CHANGED
|
@@ -6,6 +6,215 @@ All notable changes to `pivotkit-react` are documented in this file. The format
|
|
|
6
6
|
|
|
7
7
|
## [Unreleased]
|
|
8
8
|
|
|
9
|
+
## [0.8.0] - 2026-11-18
|
|
10
|
+
|
|
11
|
+
### Upgrading from 0.7
|
|
12
|
+
|
|
13
|
+
- Table and Chart are tabs on top of the result, with "Table settings" or "Chart settings" beside
|
|
14
|
+
them. The chart type button, Options and Layout left the toolbar. More is always at its end, with
|
|
15
|
+
Help first. The zones fold under the heading "Fields in the report", and Swap rows and columns sits
|
|
16
|
+
at the end of that row. The labels `layout`, `showLayout`, `options` and `chartDisplay` are no longer
|
|
17
|
+
shown, and the test ids `chart-type`, `options` and `layout` are gone
|
|
18
|
+
([#580](https://github.com/eizedev/pivotkit/issues/580),
|
|
19
|
+
[upgrading](https://pivotkit.eize.dev/getting-started/upgrading/#view-tabs-0-8)).
|
|
20
|
+
- The chart type menu lists the types, then a row per Display topic that opens a level: Value
|
|
21
|
+
labels, Legend, Title, Axis, Tooltip, Series and Layout ([#106](https://github.com/eizedev/pivotkit/issues/106)). Tests open the
|
|
22
|
+
level first; a choice is a menu item with `aria-checked`.
|
|
23
|
+
- Bars, lines and areas with more than 20 categories get a zoom slider. Display › Axis › Zoom slider
|
|
24
|
+
› Off draws every category as before. A click on the legend changes the view, so Undo takes it
|
|
25
|
+
back ([upgrading](https://pivotkit.eize.dev/getting-started/upgrading/#from-0-7)).
|
|
26
|
+
- With `exportData` off, the default, the drill-down panel has no Export menu: no copy and no
|
|
27
|
+
download of its rows. Set `drillDownExport` to keep it
|
|
28
|
+
([upgrading](https://pivotkit.eize.dev/getting-started/upgrading/#drill-export)).
|
|
29
|
+
- The row count under the result says "2,190 of 4,386 rows" when a filter leaves rows out. A host
|
|
30
|
+
whose `labels` set `rowsCount` or add a language sets the new label `rowsFiltered` too
|
|
31
|
+
([upgrading](https://pivotkit.eize.dev/getting-started/upgrading/#rows-filtered)).
|
|
32
|
+
|
|
33
|
+
### Deprecated
|
|
34
|
+
|
|
35
|
+
- The theme token `--pk-knob` is unused: the chart's Display settings have no switch any more. It
|
|
36
|
+
goes in 0.9.0 ([#106](https://github.com/eizedev/pivotkit/issues/106)).
|
|
37
|
+
|
|
38
|
+
### Added
|
|
39
|
+
|
|
40
|
+
- "+ Add" in each zone opens "Add to Rows" (or the zone's name): every field with its type and the
|
|
41
|
+
field list's search. A field placed elsewhere shows its zone and moves. A pick that would change
|
|
42
|
+
nothing is disabled with its reason. Values takes a field again, and Filters opens the field's
|
|
43
|
+
filter first. The focus goes to the new chip, and a status region says what happened. Test ids:
|
|
44
|
+
`add-field-<zone>`, `add-pick-<field>`, `zones-status`. New labels: `addField`, `addFieldTo`,
|
|
45
|
+
`movedFrom`; the menu adds `addAlready`, `addMoves` and `addSecond`
|
|
46
|
+
([#581](https://github.com/eizedev/pivotkit/issues/581)).
|
|
47
|
+
- The `zones` prop (`"open"` or `"folded"`) sets whether the zones start open or folded. Without it,
|
|
48
|
+
the report's height decides ([#580](https://github.com/eizedev/pivotkit/issues/580)).
|
|
49
|
+
- Chart settings › Layout folds the groups of Rows in the words of the fields: "Show each Country",
|
|
50
|
+
"Show Region only". Table settings' Collapse all says what it keeps
|
|
51
|
+
([#580](https://github.com/eizedev/pivotkit/issues/580)).
|
|
52
|
+
- Theme tokens for the zones' section (`--pk-section-*`) and the tab shown (`--pk-tab-mark`)
|
|
53
|
+
([#580](https://github.com/eizedev/pivotkit/issues/580)).
|
|
54
|
+
- The data's date range before filters ("Data before filters: …"): in the footer next to the row count, and in a date
|
|
55
|
+
field's "i". The title of a cyclic grouping such as "Month of year" in the table and the chart
|
|
56
|
+
says which years it combines: "Date by month of year · 2023–2025 combined". With one year left,
|
|
57
|
+
month and quarter items carry it ("Jan 2025"); weekday, hour and week say "· 2025 only" in the
|
|
58
|
+
title. Exports keep the plain items and names.
|
|
59
|
+
Group lists the data's range first and shows hints from the data, under "One item per period"
|
|
60
|
+
and "Same period, years combined" ([#109](https://github.com/eizedev/pivotkit/issues/109)).
|
|
61
|
+
- A zoom slider under a long category axis, Display › Axis › Zoom slider (Automatic, On, Off). It
|
|
62
|
+
works by mouse, touch and keyboard, and keeps its place when the chart is drawn again. The PNG
|
|
63
|
+
image leaves it out ([#36](https://github.com/eizedev/pivotkit/issues/36)), ([#575](https://github.com/eizedev/pivotkit/issues/575)).
|
|
64
|
+
- A click on the legend hides or shows a series, or a slice. The view keeps it, a screen reader
|
|
65
|
+
hears it, and Undo takes it back. Display › Series does the same by keyboard ([#36](https://github.com/eizedev/pivotkit/issues/36)).
|
|
66
|
+
- Display › Layout › Stacked to 100 % for stacked bars and areas of sums and counts. The tooltip
|
|
67
|
+
shows each part's value and share, and the total of the values ([#36](https://github.com/eizedev/pivotkit/issues/36)).
|
|
68
|
+
- Export › **Copy chart image**: the chart as a PNG on the clipboard. `onExport` sees it first as
|
|
69
|
+
`"copy-chart"` ([#54](https://github.com/eizedev/pivotkit/issues/54)).
|
|
70
|
+
- The `colorMap` prop: a fixed colour per series or slice name across charts, one colour or one per
|
|
71
|
+
theme. Display › Series has a colour beside each series or slice, a view's own colour
|
|
72
|
+
([#54](https://github.com/eizedev/pivotkit/issues/54)).
|
|
73
|
+
- Display › Tooltip › Share in the tooltip: each value's share of the category's total, of a single
|
|
74
|
+
series' total, or of a pie ([#54](https://github.com/eizedev/pivotkit/issues/54)).
|
|
75
|
+
- Display › **Reference lines** in the chart type menu, for bars, lines and areas: a level with
|
|
76
|
+
**Average**, **Trend** and a **Target** (`chart.referenceLines`, [#48](https://github.com/eizedev/pivotkit/issues/48)).
|
|
77
|
+
Its row says which lines are on. The level offers only the lines the chart can draw, with a note
|
|
78
|
+
on the rest. The Target field reads "25%" as a share, with a hint for a value shown in percent.
|
|
79
|
+
The tooltip names the lines at the category, and the chart's text alternative names each with
|
|
80
|
+
its value.
|
|
81
|
+
- `labels.chartLines` and `labels.chartTrendSpan`: the reference lines in the chart's text
|
|
82
|
+
alternative ("Reference lines: {lines}.", "from {from} to {to}"), and the token
|
|
83
|
+
`--pk-chart-reference` for a target and the lines of a stack's total (default `--pk-muted`).
|
|
84
|
+
- Display › **Tooltip** in the chart type menu, for bars, lines and areas: **Automatic** or **All
|
|
85
|
+
series** (`chart.tooltip`, [#106](https://github.com/eizedev/pivotkit/issues/106)). All series lists
|
|
86
|
+
every series at the pointer's category, the hovered one first, its name in the strong weight.
|
|
87
|
+
- `labels.chartTotal`, the tooltip's "Total" line (German "Gesamt"), and `labels.chartMore`, the
|
|
88
|
+
line for the series that do not fit ("+{count} more"), and `labels.chartMoreInTotal` for it when
|
|
89
|
+
a total is shown ("+{count} more (in the total)").
|
|
90
|
+
- `--pk-tooltip-name-w` (default `12em`): the widest series name in the tooltip. A longer one ends
|
|
91
|
+
in "…".
|
|
92
|
+
|
|
93
|
+
- `drillDownExport`: the drill-down panel's copy and download while `exportData` is off, with every
|
|
94
|
+
column. Off by default.
|
|
95
|
+
|
|
96
|
+
### Changed
|
|
97
|
+
|
|
98
|
+
- Depends on `pivotkit-core` `^0.8.0` (was `^0.7.0`) and `pivotkit-report` `^0.4.0` (was `^0.3.0`): a host
|
|
99
|
+
that also lists pivotkit-core updates both together, or it gets two copies.
|
|
100
|
+
- The open zones are shelves: each zone's title, "i" and "+ Add" at its left, its chips beside them.
|
|
101
|
+
Shelves sit side by side while they fit and take a line of their own when they need it. The dashed
|
|
102
|
+
drop outline shows only while something is dragged. On a phone, "+ Add" sits at the right end of
|
|
103
|
+
the shelf's title row. A report with no field placed starts with its zones open, whatever its
|
|
104
|
+
height, unless `zones` says otherwise. The empty report's steps and the empty zones' hints name
|
|
105
|
+
"+ Add" too. A value that is in the view twice is "Sum of Revenue (2)" on its chip and in the
|
|
106
|
+
table. New tokens: `--pk-shelf-gap`, `--pk-shelf-pad`,
|
|
107
|
+
`--pk-shelf-min`, `--pk-chip-gap`, `--pk-chip-h`, `--pk-add-gap`, `--pk-add-hover`
|
|
108
|
+
([#581](https://github.com/eizedev/pivotkit/issues/581)).
|
|
109
|
+
- The chart's tooltip names the element under the pointer
|
|
110
|
+
([#376](https://github.com/eizedev/pivotkit/issues/376)):
|
|
111
|
+
- A bar or a line point shows that series alone.
|
|
112
|
+
- A segment of stacked bars, or a point of a stacked area, adds the sum of the stack's parts. A
|
|
113
|
+
value that does not add up gets no total: only sums and counts do, and not when shown as a rank
|
|
114
|
+
or a percent difference.
|
|
115
|
+
- Between the elements it lists every series at the category. Between stacked bars it shows the
|
|
116
|
+
total only.
|
|
117
|
+
- A series without a value at the category is left out, not shown as an empty line.
|
|
118
|
+
- Pie, donut and heatmap keep the tooltip of the slice or cell.
|
|
119
|
+
- The tooltip stays inside the chart. When more series are there than fit, the last line says how
|
|
120
|
+
many more there are.
|
|
121
|
+
|
|
122
|
+
- The drill-down panel's copy and download follow `exportData`. With it off, the panel shows the
|
|
123
|
+
rows but offers no copy and no download (#263).
|
|
124
|
+
- pivotkit-core's ECharts option (`toEChartsOption`) loads with ECharts, from `pivotkit-core/chart`,
|
|
125
|
+
not with the first load (#546).
|
|
126
|
+
- The row count under the result says how many of the data's rows the filters keep: "2,190 of 4,386
|
|
127
|
+
rows", German "2.190 von 4.386 Zeilen". With nothing filtered it says "4,386 rows" (#108).
|
|
128
|
+
Its words are pivotkit-core's `ROW_COUNT_TEXTS`, so the HTML report says the same (#547).
|
|
129
|
+
|
|
130
|
+
### Fixed
|
|
131
|
+
|
|
132
|
+
- The chart's tooltip names the element under the pointer after a redraw, and after the pointer
|
|
133
|
+
left the chart in one move, such as a tap elsewhere. It listed every series instead
|
|
134
|
+
([#576](https://github.com/eizedev/pivotkit/issues/576)).
|
|
135
|
+
- On a touch screen, a menu's rows and its Back row are at least 44 px high (`--pk-target-touch`)
|
|
136
|
+
on every level. They were 35 and 28 px ([#582](https://github.com/eizedev/pivotkit/issues/582)).
|
|
137
|
+
- Row labels, the field names above them and the value names keep their natural width, on one
|
|
138
|
+
line, when the table fits the report. Only a table that would be wider than the report wraps them,
|
|
139
|
+
between words first. Then the row labels share the room the value columns leave, not a fixed 40 %
|
|
140
|
+
of the width. A word breaks only when it alone is wider than its column ([#584](https://github.com/eizedev/pivotkit/issues/584)).
|
|
141
|
+
- On a touch screen, the first tap on a bar, a point or a heatmap cell shows its tooltip. The second
|
|
142
|
+
tap on it opens the rows behind it and calls `onCellClick`. The tooltip no longer stays over the
|
|
143
|
+
panel, and the panel no longer closes right after it opens ([#538](https://github.com/eizedev/pivotkit/issues/538)).
|
|
144
|
+
- A heatmap whose `--pk-heat-low` or `--pk-heat-high` is in a form ECharts cannot mix, such as
|
|
145
|
+
`oklch()` or `rgb()` with spaces, shows the host's colours instead of black cells. So do the HTML
|
|
146
|
+
report and the SVG of the Export menu, whose table also takes an `oklch()` colour scale ([#386](https://github.com/eizedev/pivotkit/issues/386)).
|
|
147
|
+
- With a field on Columns, a pie's, a donut's and a heatmap's tooltip is titled by the value, not by
|
|
148
|
+
the first column, from pivotkit-core ([#537](https://github.com/eizedev/pivotkit/issues/537)).
|
|
149
|
+
- A view's locale that the browser has no data for, such as `xx-XX`, is reported as unknown, and
|
|
150
|
+
the report takes the `locale` prop. Such a `locale` prop takes `en-US` with a warning. Before,
|
|
151
|
+
both took the machine's locale, from pivotkit-core ([#552](https://github.com/eizedev/pivotkit/issues/552)).
|
|
152
|
+
- Export → Source data is greyed out while the data have no rows, like the table's entries. It says
|
|
153
|
+
"The data has no rows yet." ([#585](https://github.com/eizedev/pivotkit/issues/585)).
|
|
154
|
+
- A relative date filter that holds today no longer says that the days from today on have no data,
|
|
155
|
+
while the data have no date after today. Data up to yesterday give "last 4 weeks (Oct 26,
|
|
156
|
+
2026–Nov 22, 2026)", not a second part for the rest of the week. Days before today without rows
|
|
157
|
+
are still named, also in a range with no data at all: "last 1 week (Nov 16, 2026 has no data)".
|
|
158
|
+
A range wholly after today, and data with rows dated after today, name every day without data.
|
|
159
|
+
The "Include the current …" checkbox and its count back from the latest record follow the same
|
|
160
|
+
rule. The chip, its tooltip, the summary, the menu's first level and the Filter level's choices
|
|
161
|
+
say the same ([#586](https://github.com/eizedev/pivotkit/issues/586)).
|
|
162
|
+
- "Table as CSV" in a locale whose own decimal mark is `٫` (`ar-EG`, `ar-SA`, `fa-IR`, `ur-IN`,
|
|
163
|
+
`ps-AF` and others) writes the decimal mark the locale uses with Latin digits, from pivotkit-core:
|
|
164
|
+
`9.6`, not `9٫6`, which parsers misread ([#478](https://github.com/eizedev/pivotkit/issues/478)).
|
|
165
|
+
- The chart's labels at small sizes, from pivotkit-core: slanted category names leave the plot its
|
|
166
|
+
height, a donut's outside labels stay whole, the value at the end of a horizontal bar is not cut,
|
|
167
|
+
and a heatmap names every row that has room ([#228](https://github.com/eizedev/pivotkit/issues/228), [#229](https://github.com/eizedev/pivotkit/issues/229), [#230](https://github.com/eizedev/pivotkit/issues/230),
|
|
168
|
+
[#231](https://github.com/eizedev/pivotkit/issues/231)).
|
|
169
|
+
- The zones fold when they no longer fit the report's box, also when the box keeps its size. Longer
|
|
170
|
+
texts in another language, more fields in Rows, a tip or a late stylesheet made them taller without
|
|
171
|
+
a resize, and they stayed open over a squeezed result. Folded that way, they open again once they
|
|
172
|
+
fit (#93).
|
|
173
|
+
|
|
174
|
+
## [0.7.0] - 2026-11-16
|
|
175
|
+
|
|
176
|
+
### Upgrading from 0.6
|
|
177
|
+
|
|
178
|
+
What a host checks; the [upgrade page](https://pivotkit.eize.dev/getting-started/upgrading/#from-0-6-1) has the details.
|
|
179
|
+
|
|
180
|
+
- Export → HTML report carries the host's dark colours too. On a dark screen a colour scale's middle
|
|
181
|
+
colour (`--pk-scale-mid`) is the one your dark theme sets, not the light one; without it the cells
|
|
182
|
+
run halfway between the dark low and high colours ([upgrading](https://pivotkit.eize.dev/getting-started/upgrading/#dark-mid-colour)).
|
|
183
|
+
- A field's Filter level shows its rules in a single column as wide as the menu, in every browser.
|
|
184
|
+
Tests or screenshots of that form take the new layout.
|
|
185
|
+
- pivotkit-core moves to `^0.7.0` and pivotkit-report to `^0.3.0` with it.
|
|
186
|
+
|
|
187
|
+
### Changed
|
|
188
|
+
|
|
189
|
+
- Depends on `pivotkit-core` `^0.7.0` (was `^0.6.1`) and `pivotkit-report` `^0.3.0` (was `^0.2.1`): a host
|
|
190
|
+
that also lists pivotkit-core updates both together, or it gets two copies.
|
|
191
|
+
|
|
192
|
+
### Fixed
|
|
193
|
+
|
|
194
|
+
- The rules in a field's Filter level show in the WebKit of Playwright 1.65 (build 2388): the rule
|
|
195
|
+
list stacked in a wrapping column got no size there, so a new rule's row and its value field could
|
|
196
|
+
not be seen or used. The rules form is a single column as wide as the menu, each row with room for
|
|
197
|
+
its value, in every browser. Whether a Safari release shows the same fault was not checked
|
|
198
|
+
([#474](https://github.com/eizedev/pivotkit/issues/474)).
|
|
199
|
+
- Export → HTML report carries the host's dark colours too (pivotkit-report's `darkTokens`), read
|
|
200
|
+
from the report's dark theme whichever theme it shows: a reader on a dark screen sees the host's
|
|
201
|
+
dark design, not pivotkit's default dark colours. Paper and a print stay light. The report's
|
|
202
|
+
`--pk-scale-mid` on a dark screen is the one your dark theme resolves (pivotkit-report no longer
|
|
203
|
+
takes the light one there) ([#385](https://github.com/eizedev/pivotkit/issues/385)).
|
|
204
|
+
- Print or save as PDF opens the print dialog in the click itself: the Export menu makes the print
|
|
205
|
+
frame ready when it opens, and the report's modules load when Print is pointed at or focused. A
|
|
206
|
+
page hidden while it printed (it gets no animation frame) did not print at all. Safari still asks
|
|
207
|
+
"This webpage is trying to print" after a cancelled print dialog: that is Safari's own rule
|
|
208
|
+
([print or save as PDF](https://pivotkit.eize.dev/use/export/)) ([#210](https://github.com/eizedev/pivotkit/issues/210)).
|
|
209
|
+
- A second click on a menu's button closes the menu in Safari and other WebKit browsers, as in the
|
|
210
|
+
others: the toolbar's menus (Export, Views, Data, Start over, More) and a field's chip menu. WebKit
|
|
211
|
+
does not focus a clicked button, so the press moved the focus out of the menu, which closed it,
|
|
212
|
+
and the click opened it again ([#393](https://github.com/eizedev/pivotkit/issues/393)).
|
|
213
|
+
- `import "pivotkit-react/styles.css"` compiles in a strict TypeScript project without a bundler's
|
|
214
|
+
CSS types: the stylesheet ships its own declaration (`styles.css.d.ts`, the `types` condition of
|
|
215
|
+
its export); TypeScript answered TS2882 before
|
|
216
|
+
([#165](https://github.com/eizedev/pivotkit/issues/165)).
|
|
217
|
+
|
|
9
218
|
## [0.6.1] - 2026-11-14
|
|
10
219
|
|
|
11
220
|
### Added
|
|
@@ -1049,7 +1258,9 @@ First release.
|
|
|
1049
1258
|
weather (Open-Meteo), countries (World Bank), earthquakes (USGS), Nobel laureates and the release
|
|
1050
1259
|
cycles of software products (endoflife.date).
|
|
1051
1260
|
|
|
1052
|
-
[Unreleased]: https://github.com/eizedev/pivotkit/compare/pivotkit-react@0.
|
|
1261
|
+
[Unreleased]: https://github.com/eizedev/pivotkit/compare/pivotkit-react@0.8.0...HEAD
|
|
1262
|
+
[0.8.0]: https://github.com/eizedev/pivotkit/compare/pivotkit-react@0.7.0...pivotkit-react@0.8.0
|
|
1263
|
+
[0.7.0]: https://github.com/eizedev/pivotkit/compare/pivotkit-react@0.6.1...pivotkit-react@0.7.0
|
|
1053
1264
|
[0.6.1]: https://github.com/eizedev/pivotkit/compare/pivotkit-react@0.6.0...pivotkit-react@0.6.1
|
|
1054
1265
|
[0.6.0]: https://github.com/eizedev/pivotkit/compare/pivotkit-react@0.5.0...pivotkit-react@0.6.0
|
|
1055
1266
|
[0.5.0]: https://github.com/eizedev/pivotkit/compare/pivotkit-react@0.4.0...pivotkit-react@0.5.0
|
package/README.md
CHANGED
|
@@ -1,13 +1,8 @@
|
|
|
1
1
|
# pivotkit-react
|
|
2
2
|
|
|
3
3
|
The pivot report builder of [pivotkit](https://pivotkit.eize.dev/) as a React 18/19 component,
|
|
4
|
-
`<PivotReport
|
|
5
|
-
|
|
6
|
-
drill-down to the rows behind a value, undo and redo, saved and shared views as JSON files, and
|
|
7
|
-
Excel, CSV, HTML report, PNG and SVG export and printing. Where the host turns them on, people load
|
|
8
|
-
their own CSV, JSON or Excel file with a preview (`allowImport`) and download the rows behind the
|
|
9
|
-
report for the command line (`exportData`). Excel's PivotTable is the reference; the engine is
|
|
10
|
-
[pivotkit-core](https://www.npmjs.com/package/pivotkit-core).
|
|
4
|
+
`<PivotReport>`. People build pivot tables and charts from your data by drag and drop. Excel's
|
|
5
|
+
PivotTable is the reference. The engine is [pivotkit-core](https://www.npmjs.com/package/pivotkit-core).
|
|
11
6
|
|
|
12
7
|
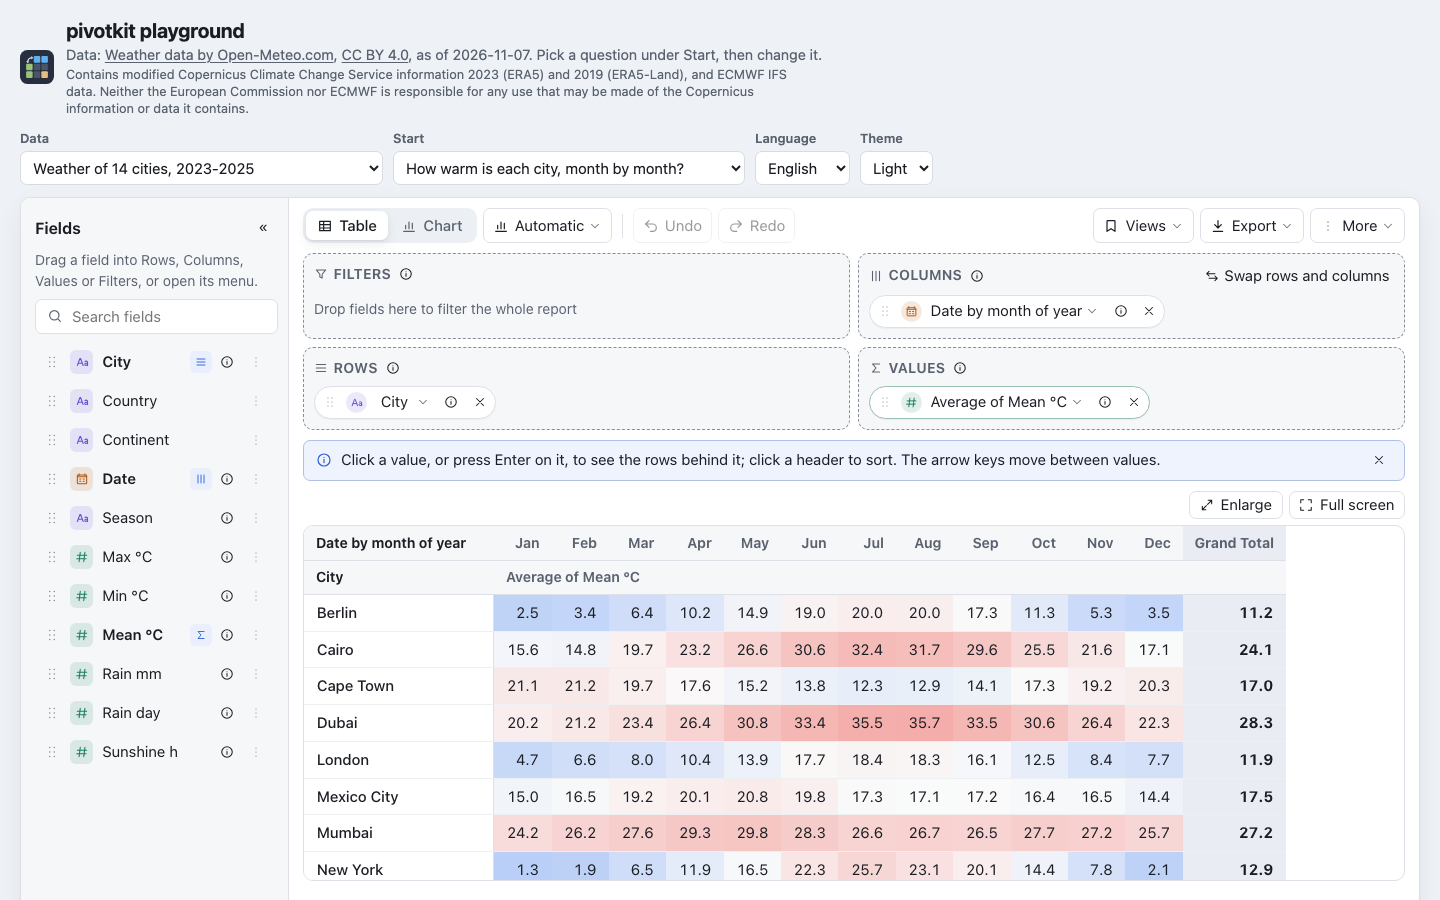
|
|
13
8
|
|
|
@@ -26,10 +21,12 @@ npm install pivotkit-react react react-dom echarts
|
|
|
26
21
|
| `react`, `react-dom` | `>=18.2 <20` | Hooks break with two copies of React in one page. Tested on React 18 and 19. |
|
|
27
22
|
| `echarts` | `>=6.1.0 <7` | About 1 MB, and its security updates stay with your app. Loaded on the first chart only. |
|
|
28
23
|
|
|
29
|
-
|
|
30
|
-
|
|
31
|
-
|
|
32
|
-
|
|
24
|
+
- The package includes TypeScript declarations.
|
|
25
|
+
- pivotkit-core, pivotkit-report and @dnd-kit come with the package. It depends on pivotkit-core with
|
|
26
|
+
a caret range.
|
|
27
|
+
- In 0.x a caret range spans patch versions only: `^0.y.z` means 0.y.z and later 0.y patches. If your
|
|
28
|
+
app also imports pivotkit-core itself, use a version inside that range. npm shares one copy only
|
|
29
|
+
when the ranges overlap.
|
|
33
30
|
|
|
34
31
|
## Example
|
|
35
32
|
|
|
@@ -47,9 +44,30 @@ export function TicketReport({ rows }) {
|
|
|
47
44
|
}
|
|
48
45
|
```
|
|
49
46
|
|
|
50
|
-
Without app state, `defaultView={start}`
|
|
51
|
-
|
|
52
|
-
the
|
|
47
|
+
Without app state, pass `defaultView={start}` instead, and the report keeps the view itself.
|
|
48
|
+
|
|
49
|
+
The view is plain JSON. It is the preset, the saved view and the undo step at once. The report treats
|
|
50
|
+
it as user input and checks it against the data. A view cannot run code.
|
|
51
|
+
|
|
52
|
+
## What it does
|
|
53
|
+
|
|
54
|
+
- A searchable field list.
|
|
55
|
+
- Four drop zones: Rows, Columns, Values and Filters, with drag and drop, "+ Add" in each zone and a
|
|
56
|
+
menu on every field.
|
|
57
|
+
- Table and chart. The chart uses Apache ECharts.
|
|
58
|
+
- Filters with value counts.
|
|
59
|
+
- Dates grouped by year, quarter, month and more. The footer gives the data's date range, and a
|
|
60
|
+
grouping such as "Month of year" says which years it combines.
|
|
61
|
+
- Drill-down to the rows behind a value.
|
|
62
|
+
- Undo and redo.
|
|
63
|
+
- Saved and shared views as JSON files.
|
|
64
|
+
- Export to Excel, CSV, HTML report, PNG and SVG, and printing.
|
|
65
|
+
|
|
66
|
+
Two more features are off until the host turns them on:
|
|
67
|
+
|
|
68
|
+
- `allowImport`: people load their own CSV, JSON or Excel file, with a preview.
|
|
69
|
+
- `exportData`: people download the rows behind the report for the command line. It also gives
|
|
70
|
+
the drill-down its copy and download. `drillDownExport` gives the drill-down those alone.
|
|
53
71
|
|
|
54
72
|
## Where in the docs
|
|
55
73
|
|
|
@@ -64,7 +82,7 @@ the data; it cannot run code.
|
|
|
64
82
|
| The view | [Views and saved views](https://pivotkit.eize.dev/concepts/views/) |
|
|
65
83
|
| Saved and shared views, links | [Templates and shared views](https://pivotkit.eize.dev/concepts/templates/), [Sharing](https://pivotkit.eize.dev/concepts/sharing/), [View file format](https://pivotkit.eize.dev/reference/view-file/) |
|
|
66
84
|
| Field names, descriptions, defaults | [Field descriptions and names](https://pivotkit.eize.dev/concepts/fields/) |
|
|
67
|
-
| Charts and `chartOptions` | [Charts](https://pivotkit.eize.dev/concepts/charts/#chartoptions-for-developers) |
|
|
85
|
+
| Charts, `colorMap` and `chartOptions` | [Charts](https://pivotkit.eize.dev/concepts/charts/#chartoptions-for-developers) |
|
|
68
86
|
| Theming: the `--pk-*` tokens | [Theming](https://pivotkit.eize.dev/reference/theming/) |
|
|
69
87
|
| Languages and labels | [Localisation](https://pivotkit.eize.dev/reference/localisation/) |
|
|
70
88
|
| Limits | [Locale, time zones, limits and errors](https://pivotkit.eize.dev/concepts/limits/#limits) |
|
|
@@ -21,6 +21,13 @@ var de = {
|
|
|
21
21
|
axisLabels: "Achsenbeschriftung",
|
|
22
22
|
groupLabels: "Gruppenbeschriftung",
|
|
23
23
|
labelPosition: "Beschriftungsposition",
|
|
24
|
+
tooltip: "Tooltip",
|
|
25
|
+
zoom: "Zoom-Schieber",
|
|
26
|
+
stackPercent: "100-%-Stapel",
|
|
27
|
+
hidden: "ausgeblendete Reihen",
|
|
28
|
+
colors: "Farben",
|
|
29
|
+
tooltipShare: "Anteil im Tooltip",
|
|
30
|
+
target: "Ziellinie",
|
|
24
31
|
other: "Einstellung"
|
|
25
32
|
},
|
|
26
33
|
dropped: {
|
|
@@ -19,6 +19,10 @@ var de = {
|
|
|
19
19
|
drillCopy: "Die Zeilen wie im Bereich angezeigt, mit einer \xDCberschriftenzeile: tabulatorgetrennt, wird in Excel oder Google Sheets in Spalten eingef\xFCgt.",
|
|
20
20
|
drillJson: "Die Zeilen als JSON-Objekte, mit den Feldnamen und Rohwerten der Daten, f\xFCr ein Programm.",
|
|
21
21
|
groupLabels: "Mit zwei oder mehr Feldern in Zeilen: die Eintr\xE4ge des \xE4u\xDFeren Felds einmal unter der Achse, unter ihren Kategorien.",
|
|
22
|
+
chartColors: "Ein Schalter blendet jede Reihe oder jedes Segment ein oder aus. Die Farbe daneben legt seine Farbe nach dem Namen fest, in der Ansicht und in jedem Diagramm mit diesem Namen.",
|
|
23
|
+
tooltip: "Automatisch: Ein Balken, Segment oder Punkt zeigt nur seinen Wert. Dazwischen erscheinen alle Reihen. Gestapelte Summen und Anzahlen zeigen auch den Gesamtwert. Alle Reihen: immer alle Reihen dieser Kategorie.",
|
|
24
|
+
stackPercent: "Jeder Stapel f\xFCllt die Achse; jeder Teil zeigt seinen Anteil. Auch die Wertbeschriftungen zeigen den Anteil. Nur f\xFCr Summen und Anzahlen. Ein Stapel mit Teilen unter null f\xFCllt die Achse nicht, einer mit der Summe null fehlt.",
|
|
25
|
+
zoom: "Ein Schieber unter der Achse zeigt einen Teil der Kategorien. Automatisch: bei mehr als 20 Kategorien, oder wenn die Achse 3 Namen oder mehr zwischen zweien auslassen m\xFCsste. Per Tastatur l\xE4sst er sich noch nicht bewegen: Aus zeigt alle Kategorien. Dateien und Drucke zeigen alle Kategorien.",
|
|
22
26
|
labelPosition: "Au\xDFen: Name und Zahl jedes Segments daneben. Innen: die Zahl auf dem Segment, die Namen in der Legende; au\xDFen, wenn der Ring eines Donuts daf\xFCr zu schmal ist.",
|
|
23
27
|
sharedView: "Nur Admins k\xF6nnen gemeinsame Ansichten \xE4ndern.",
|
|
24
28
|
valuesFilter: "Werte werden hier nicht gefiltert: Ein Feld in Zeilen oder Spalten \xFCber sein Men\xFC filtern oder ein Feld in Filter ziehen."
|
|
@@ -30,6 +34,9 @@ var de = {
|
|
|
30
34
|
searchMenuShort: "In diesem Men\xFC suchen (Taste /)",
|
|
31
35
|
searchResults: "Treffer",
|
|
32
36
|
searchNothing: "Nichts gefunden. Ein anderes Wort versuchen oder die Suche leeren.",
|
|
37
|
+
addAlready: "Bereits in {zone}.",
|
|
38
|
+
addMoves: "Verschiebt es aus {zone}.",
|
|
39
|
+
addSecond: "F\xFCgt einen zweiten Wert davon hinzu.",
|
|
33
40
|
sortByValue: "Nach Wert sortieren",
|
|
34
41
|
sortOldestShort: "\xC4lteste",
|
|
35
42
|
sortNewestShort: "Neueste",
|
|
@@ -236,8 +243,10 @@ var de = {
|
|
|
236
243
|
sortOldest: "\xC4lteste zuerst",
|
|
237
244
|
sortNewest: "Neueste zuerst",
|
|
238
245
|
groupNone: "Keine Gruppierung (jedes Datum mit Uhrzeit)",
|
|
239
|
-
groupTimeline: "
|
|
240
|
-
groupCyclic: "Gleicher Zeitraum
|
|
246
|
+
groupTimeline: "Ein Eintrag pro Zeitraum",
|
|
247
|
+
groupCyclic: "Gleicher Zeitraum, Jahre zusammengefasst",
|
|
248
|
+
groupDataRange: { one: "Daten vor den Filtern: {range} ({count} Tag)", other: "Daten vor den Filtern: {range} ({count} Tage)" },
|
|
249
|
+
groupYearsTogether: { one: "{count} Jahr zusammen", other: "{count} Jahre zusammen" },
|
|
241
250
|
unitHints: {
|
|
242
251
|
year: "2025",
|
|
243
252
|
yearQuarter: "Q1 2025",
|
|
@@ -284,10 +293,16 @@ var de = {
|
|
|
284
293
|
exportPrint: "Drucken oder als PDF speichern\u2026",
|
|
285
294
|
exportPngNeedsChart: "Zuerst zum Diagramm wechseln.",
|
|
286
295
|
exportNeedsField: "Zuerst ein Feld hinzuf\xFCgen.",
|
|
296
|
+
exportNeedsRows: "Die Daten haben noch keine Zeilen.",
|
|
287
297
|
exportDataGroup: "Quelldaten",
|
|
288
298
|
exportDataCsv: "Alle Zeilen als CSV (.csv)",
|
|
289
299
|
exportDataJson: "Alle Zeilen als JSON (.json)",
|
|
290
300
|
copyTable: "Tabelle kopieren",
|
|
301
|
+
copyChart: "Diagramm als Bild kopieren",
|
|
302
|
+
toastChartCopied: "Diagramm als Bild kopiert",
|
|
303
|
+
toastImageCopyBlocked: "Diese Seite erlaubt kein Kopieren des Bildes.",
|
|
304
|
+
toastChartNotDrawn: "Das Diagramm ist noch nicht gezeichnet. Gleich noch einmal versuchen.",
|
|
305
|
+
downloadPng: "PNG herunterladen",
|
|
291
306
|
copyDataJson: "Daten als JSON kopieren",
|
|
292
307
|
toastTableCopied: "Tabelle kopiert: tabulatorgetrennt, wird in Excel oder Google Sheets in Spalten eingef\xFCgt",
|
|
293
308
|
toastDataCopied: "Daten als JSON kopiert",
|
|
@@ -310,6 +325,7 @@ var de = {
|
|
|
310
325
|
resetTips: "Ausgeblendete Tipps wieder zeigen",
|
|
311
326
|
sectionChanged: ", ge\xE4ndert",
|
|
312
327
|
help: "Hilfe",
|
|
328
|
+
helpAndShortcuts: "Hilfe und Tastenk\xFCrzel",
|
|
313
329
|
shortcutsTitle: "Tastenk\xFCrzel",
|
|
314
330
|
keys: { Mod: "Strg", Shift: "Umschalt", "Arrow keys": "Pfeiltasten", Enter: "Eingabe", Space: "Leertaste", Escape: "Esc", F10: "F10" },
|
|
315
331
|
shortcuts: {
|
|
@@ -329,12 +345,43 @@ var de = {
|
|
|
329
345
|
chartTitle: "Titel",
|
|
330
346
|
chartTitleNone: "Kein Titel",
|
|
331
347
|
smoothLines: "Gegl\xE4ttete Linien",
|
|
348
|
+
referenceLines: "Bezugslinien",
|
|
349
|
+
targetNone: "Kein Ziel",
|
|
350
|
+
linesOff: "Aus",
|
|
351
|
+
targetPercent: "Ein Prozentwert: 25 % oder 0,25 eingeben.",
|
|
352
|
+
targetPercent100: "Ein Prozentwert: 25 oder 25 % eingeben.",
|
|
353
|
+
targetPercentHigh: "{typed} sind {shown}. F\xFCr {share} {typed} % eingeben.",
|
|
354
|
+
targetRemove: "Ziel entfernen",
|
|
355
|
+
linesNotes: {
|
|
356
|
+
noTotal: "Diese Linien brauchen eine Summe. Zum Zeichnen auf Balken wechseln, nicht gestapelt.",
|
|
357
|
+
negative: "Ein Stapel mit Werten unter null hat keine einzelne Summe, daher keinen Durchschnitt und keinen Trend.",
|
|
358
|
+
percentStack: "Jeder Stapel auf 100 % ist gleich hoch, daher gibt es keine Linien.",
|
|
359
|
+
noTime: "Ein Trend braucht Datumswerte in Zeilen, nach Datum geordnet.",
|
|
360
|
+
byIndex: "Manche Kategorien haben kein Datum, daher z\xE4hlt der Trend sie als gleichm\xE4\xDFig verteilt.",
|
|
361
|
+
mixedUnits: "Die Werte haben verschiedene Einheiten, daher passt kein gemeinsames Ziel.",
|
|
362
|
+
table: "Die Linien erscheinen hier, sobald das Diagramm gezeichnet ist."
|
|
363
|
+
},
|
|
332
364
|
labelPosition: "Beschriftung",
|
|
333
365
|
labelPositionNames: { outside: "Au\xDFen", inside: "Innen" },
|
|
334
366
|
axisLabels: "Achsenbeschriftung",
|
|
335
367
|
axisLabelNames: { auto: "Automatisch", all: "Alle (schr\xE4g)", nth: "Jede n-te" },
|
|
336
368
|
groupLabels: "Gruppen unter der Achse",
|
|
337
369
|
groupLabelNames: { auto: "Automatisch", on: "Ein", off: "Aus" },
|
|
370
|
+
tooltip: "Tooltip",
|
|
371
|
+
tooltipNames: { auto: "Automatisch", axis: "Alle Reihen" },
|
|
372
|
+
zoom: "Zoom-Schieber",
|
|
373
|
+
zoomNames: { auto: "Automatisch", on: "Ein", off: "Aus" },
|
|
374
|
+
stackPercent: "Gestapelt auf 100 %",
|
|
375
|
+
shownSeries: "Reihen",
|
|
376
|
+
seriesShownOf: "{shown} von {count} angezeigt",
|
|
377
|
+
chartAxis: "Achse",
|
|
378
|
+
chartLayout: "Anordnung",
|
|
379
|
+
tooltipShare: "Anteil im Tooltip",
|
|
380
|
+
colorOf: "Farbe von {name}",
|
|
381
|
+
colorDefault: "Standard",
|
|
382
|
+
colorRemove: "Entfernen",
|
|
383
|
+
colorsNotShown: "Farben nicht angezeigter Namen",
|
|
384
|
+
seriesOnly: "Die einzige Reihe wird immer angezeigt",
|
|
338
385
|
defaultName: "Standardnamen verwenden",
|
|
339
386
|
shareThisView: "Diese Ansicht teilen",
|
|
340
387
|
copyLink: "Link kopieren",
|
|
@@ -375,7 +422,13 @@ var de = {
|
|
|
375
422
|
collapseAllDone: "Alle Gruppen sind schon zugeklappt.",
|
|
376
423
|
groupsCollapsed: { one: "{count} Gruppe zugeklappt", other: "{count} Gruppen zugeklappt" },
|
|
377
424
|
groupsExpanded: { one: "{count} Gruppe aufgeklappt", other: "{count} Gruppen aufgeklappt" },
|
|
378
|
-
|
|
425
|
+
chartShowEach: "{field} einzeln zeigen",
|
|
426
|
+
chartShowOnly: "Nur {field} zeigen",
|
|
427
|
+
chartShowDetails: "Details zeigen",
|
|
428
|
+
chartShowTotals: "Nur Gruppensummen zeigen",
|
|
429
|
+
chartFoldEach: "{field} einzeln",
|
|
430
|
+
chartFoldOnly: "Nur {field}",
|
|
431
|
+
chartFoldSome: "Einige Gruppen zugeklappt",
|
|
379
432
|
toastExported: "{file} exportiert",
|
|
380
433
|
toastLinkCopied: "Link kopiert",
|
|
381
434
|
toastJsonCopied: "Ansicht als JSON kopiert",
|
|
@@ -302,6 +302,7 @@ function onTheWay(anchor, popover, point) {
|
|
|
302
302
|
}
|
|
303
303
|
|
|
304
304
|
// src/popover.jsx
|
|
305
|
+
var PRESS_MS = 1e3;
|
|
305
306
|
var LayerContext = createContext2({ layer: (
|
|
306
307
|
/** @type {HTMLElement | null} */
|
|
307
308
|
null
|
|
@@ -428,6 +429,8 @@ function Popover({ open, anchor, onClose, label, role = "dialog", align = "start
|
|
|
428
429
|
};
|
|
429
430
|
}, [open, anchor, align, sheet, layer, fill]);
|
|
430
431
|
useEscapeLayer(open, onClose);
|
|
432
|
+
const pressedAt = useRef2(0);
|
|
433
|
+
const pressedAway = (to) => pressedAt.current > 0 && performance.now() - pressedAt.current < PRESS_MS && Boolean(anchor.current && to.contains(anchor.current));
|
|
431
434
|
const closeRef = useRef2(onClose);
|
|
432
435
|
useEffect3(() => {
|
|
433
436
|
closeRef.current = onClose;
|
|
@@ -446,12 +449,24 @@ function Popover({ open, anchor, onClose, label, role = "dialog", align = "start
|
|
|
446
449
|
first?.focus({ preventScroll: true });
|
|
447
450
|
});
|
|
448
451
|
const onDown = (e) => {
|
|
452
|
+
pressedAt.current = eventWithin(e, [anchor.current]) ? performance.now() : 0;
|
|
449
453
|
if (!eventWithin(e, [el, anchor.current]) && !e.composedPath().some((n) => n instanceof Element && n !== el && n.getAttribute("data-pk-parent") === elId)) {
|
|
450
454
|
closeRef.current();
|
|
451
455
|
}
|
|
452
456
|
};
|
|
457
|
+
const onUp = () => {
|
|
458
|
+
if (pressedAt.current) pressedAt.current = performance.now();
|
|
459
|
+
};
|
|
460
|
+
const onPressEnd = () => {
|
|
461
|
+
pressedAt.current = 0;
|
|
462
|
+
};
|
|
453
463
|
const doc = el?.ownerDocument ?? document;
|
|
464
|
+
const win = doc.defaultView;
|
|
454
465
|
doc.addEventListener("pointerdown", onDown, true);
|
|
466
|
+
doc.addEventListener("pointerup", onUp, true);
|
|
467
|
+
doc.addEventListener("click", onPressEnd, true);
|
|
468
|
+
doc.addEventListener("pointercancel", onPressEnd, true);
|
|
469
|
+
win?.addEventListener("blur", onPressEnd);
|
|
455
470
|
const onWheel = (e) => {
|
|
456
471
|
if (el && !e.ctrlKey && !wheelScrollsInside(e.composedPath(), el, e.deltaX, e.deltaY)) {
|
|
457
472
|
e.preventDefault();
|
|
@@ -462,6 +477,11 @@ function Popover({ open, anchor, onClose, label, role = "dialog", align = "start
|
|
|
462
477
|
return () => {
|
|
463
478
|
cancelAnimationFrame(t);
|
|
464
479
|
doc.removeEventListener("pointerdown", onDown, true);
|
|
480
|
+
doc.removeEventListener("pointerup", onUp, true);
|
|
481
|
+
doc.removeEventListener("click", onPressEnd, true);
|
|
482
|
+
doc.removeEventListener("pointercancel", onPressEnd, true);
|
|
483
|
+
win?.removeEventListener("blur", onPressEnd);
|
|
484
|
+
pressedAt.current = 0;
|
|
465
485
|
el?.removeEventListener("wheel", onWheel);
|
|
466
486
|
const now = activeIn(button);
|
|
467
487
|
if (button && button.isConnected && (!now || now === doc.body || el?.contains(now) || !now.isConnected)) {
|
|
@@ -528,7 +548,7 @@ function Popover({ open, anchor, onClose, label, role = "dialog", align = "start
|
|
|
528
548
|
/** @type {Node | null} */
|
|
529
549
|
e.relatedTarget
|
|
530
550
|
);
|
|
531
|
-
if (to && !ref.current?.contains(to) && !anchor.current?.contains(to) && !(to instanceof Element && [...to.ownerDocument.querySelectorAll(".pk-popover")].some((p) => p.contains(to) && within(p)))) {
|
|
551
|
+
if (to && !pressedAway(to) && !ref.current?.contains(to) && !anchor.current?.contains(to) && !(to instanceof Element && [...to.ownerDocument.querySelectorAll(".pk-popover")].some((p) => p.contains(to) && within(p)))) {
|
|
532
552
|
onClose();
|
|
533
553
|
}
|
|
534
554
|
};
|
|
@@ -26,6 +26,13 @@ var en = {
|
|
|
26
26
|
axisLabels: "axis labels",
|
|
27
27
|
groupLabels: "group labels",
|
|
28
28
|
labelPosition: "label position",
|
|
29
|
+
tooltip: "tooltip",
|
|
30
|
+
zoom: "zoom slider",
|
|
31
|
+
stackPercent: "100 % stack",
|
|
32
|
+
hidden: "hidden series",
|
|
33
|
+
colors: "colours",
|
|
34
|
+
tooltipShare: "share in the tooltip",
|
|
35
|
+
target: "target line",
|
|
29
36
|
other: "setting"
|
|
30
37
|
},
|
|
31
38
|
// what the report does instead, by the part of the view ({dropped} in a text)
|