pivotkit-react 0.5.0 → 0.6.1
This diff represents the content of publicly available package versions that have been released to one of the supported registries. The information contained in this diff is provided for informational purposes only and reflects changes between package versions as they appear in their respective public registries.
- package/CHANGELOG.md +118 -2
- package/README.md +4 -1
- package/dist/chunks/{chunk-2AT72SLA.js → chunk-3LDE2GPG.js} +58 -34
- package/dist/chunks/{chunk-RIOSIYGC.js → chunk-JOWAEZAD.js} +6 -4
- package/dist/chunks/{chunk-U5Q5I2D5.js → chunk-TR2HROIK.js} +10 -3
- package/dist/chunks/chunk-W2KIPREL.js +36 -0
- package/dist/chunks/{chunk-3WUGQPWV.js → chunk-XN5HNKJ2.js} +10 -95
- package/dist/chunks/{chunk-4RS72AAA.js → chunk-YXLANLGL.js} +8 -2
- package/dist/chunks/{chunk-3E4NB5RZ.js → chunk-ZK5RVCHP.js} +21 -3
- package/dist/import-ui.js +68 -174
- package/dist/index.js +75 -28
- package/dist/labels.js +4 -4
- package/dist/menu-texts-de.js +1 -1
- package/dist/menus.js +338 -82
- package/dist/styles.css +1 -1
- package/package.json +3 -3
- package/types/drill-export.d.ts +3 -2
- package/types/drill-panel.d.ts +4 -2
- package/types/export-run.d.ts +8 -3
- package/types/export-scope.d.ts +47 -0
- package/types/field-info.d.ts +3 -10
- package/types/import-host.d.ts +37 -8
- package/types/import-labels.d.ts +20 -3
- package/types/import-module.d.ts +1 -1
- package/types/import-run.d.ts +0 -8
- package/types/import-steps.d.ts +8 -0
- package/types/import-ui.d.ts +21 -4
- package/types/index.d.ts +59 -12
- package/types/labels.d.ts +2 -22
- package/types/menu-fields.d.ts +9 -0
- package/types/menu-labels.d.ts +6 -0
- package/types/menu-ops.d.ts +28 -3
- package/types/names.d.ts +22 -8
- package/types/share-actions.d.ts +14 -0
- package/types/sheet-views.d.ts +60 -0
- package/types/templates.d.ts +21 -1
- package/types/toolbar-panels.d.ts +13 -6
- package/types/use-export.d.ts +2 -2
- package/types/view-history.d.ts +15 -0
- package/types/view-save.d.ts +10 -6
- package/types/view-store.d.ts +21 -11
- package/types/import-source.d.ts +0 -32
package/CHANGELOG.md
CHANGED
|
@@ -6,11 +6,125 @@ All notable changes to `pivotkit-react` are documented in this file. The format
|
|
|
6
6
|
|
|
7
7
|
## [Unreleased]
|
|
8
8
|
|
|
9
|
+
## [0.6.1] - 2026-11-14
|
|
10
|
+
|
|
11
|
+
### Added
|
|
12
|
+
|
|
13
|
+
- `exportData={{ columns: [...] }}`: Source data and the drill-down's copies and files hold only
|
|
14
|
+
those columns, in that order (matched case-insensitively, derived fields never). A name the data
|
|
15
|
+
lacks is left out and said once in the console; with no column left, or `columns` that is no list
|
|
16
|
+
(said once too), Source data and the drill-down's Export menu are off; an `exportData` of another
|
|
17
|
+
shape is off, as `false` ([#259](https://github.com/eizedev/pivotkit/issues/259)).
|
|
18
|
+
|
|
19
|
+
### Changed
|
|
20
|
+
|
|
21
|
+
- Source data as CSV is built in pieces of whole lines (pivotkit-core's `dataToCsvParts`), so the
|
|
22
|
+
browser holds about twice the file's size while it is made, not about five times
|
|
23
|
+
([#260](https://github.com/eizedev/pivotkit/issues/260)).
|
|
24
|
+
|
|
25
|
+
### Fixed
|
|
26
|
+
|
|
27
|
+
- Filter level: Years combined (its year buttons, "The table shows … only" and the summary) writes a
|
|
28
|
+
year before 1 AD as the table does ("5 BC", not "-4"); the reference date's field shows and takes a
|
|
29
|
+
day after 9999 ("+010000-01-01" was cut off and could not be typed), and whether a quick choice
|
|
30
|
+
reaches the data compares days, not their text, for years with a sign
|
|
31
|
+
([#351](https://github.com/eizedev/pivotkit/issues/351)).
|
|
32
|
+
- An open menu no longer moves when its own content is scrolled: a click on a control reached by
|
|
33
|
+
scrolling (Rolling under More choices of a date's quick choices) could land beside it when the
|
|
34
|
+
menu was placed again between the press and the release. A menu whose content grew while it was
|
|
35
|
+
already as tall as its room is placed again in the next frame instead
|
|
36
|
+
([#222](https://github.com/eizedev/pivotkit/issues/222)).
|
|
37
|
+
- A workbook whose shared strings and formats reach `limits.importCells` is said as "more than …
|
|
38
|
+
different texts and formats" (`labels.dataImport.workbookCells`), chosen by the reader's
|
|
39
|
+
`details.what`, not as "values (rows x columns)", which stays for a table's own extent
|
|
40
|
+
([#325](https://github.com/eizedev/pivotkit/issues/325)).
|
|
41
|
+
- Filter level: a rule's × clicked while its value still waits to apply (a moment after typing)
|
|
42
|
+
takes the rule away; before, the field's blur applied the value and the click was lost. What waits
|
|
43
|
+
in a removed row applies nothing ([#320](https://github.com/eizedev/pivotkit/issues/320)).
|
|
44
|
+
- Filter level: emptying the value of a rule on the item or on its total takes the rule off, as
|
|
45
|
+
emptying the text of a rule on the name does; its row stays, says "Applies once it is complete."
|
|
46
|
+
and applies again with the next value, in its place among the rules. Before, the field looked empty
|
|
47
|
+
while the previous rule kept filtering ([#244](https://github.com/eizedev/pivotkit/issues/244)).
|
|
48
|
+
- Filter level: a rule added while the text or number of a new rule still waits to apply is a row of
|
|
49
|
+
its own; the comparison and the value chosen next no longer change the first rule. The add buttons
|
|
50
|
+
keep the focus in the field until the click, and a new row not yet complete stays in its place when
|
|
51
|
+
another one is added ([#245](https://github.com/eizedev/pivotkit/issues/245)).
|
|
52
|
+
- Filter level: a click on a date's quick choice (All, This, Last, …) focuses it in Safari too, as
|
|
53
|
+
Top items' choices do; both use one radio button that takes the focus on a click
|
|
54
|
+
([#203](https://github.com/eizedev/pivotkit/issues/203)).
|
|
55
|
+
- A saved view that reads another sheet of the loaded workbook no longer loads that sheet unseen when
|
|
56
|
+
the reader has notes on it (a used range, values not read, columns renamed): the preview stays
|
|
57
|
+
open with the notes and a line naming the view that needs the sheet, and **Load data** loads the
|
|
58
|
+
sheet and opens the view. Another sheet picked in that preview does not load by itself, and loaded
|
|
59
|
+
it does not open the view; a note says so
|
|
60
|
+
([#274](https://github.com/eizedev/pivotkit/issues/274)). Browser tests cover Cancel, a host's
|
|
61
|
+
refusal, another file dropped during the read and a sheet without rows
|
|
62
|
+
([#277](https://github.com/eizedev/pivotkit/issues/277)).
|
|
63
|
+
- A controlled report whose host does not pass its views back (it rejects or ignores
|
|
64
|
+
`onViewChange`) keeps at most 100 of the views it told the host waiting, the newest ones, instead
|
|
65
|
+
of one more with every change ([#204](https://github.com/eizedev/pivotkit/issues/204)).
|
|
66
|
+
- The dashed rule between the parts of a menu's group (the chart's Display: Value labels, Legend,
|
|
67
|
+
Title) uses `--pk-rule`, 3:1 against the menu as the rule between groups, instead of `--pk-border`
|
|
68
|
+
(about 1.3:1) ([#205](https://github.com/eizedev/pivotkit/issues/205)).
|
|
69
|
+
- The filter's texts and Years combined read and write years before 0 and after 9999 (signed ISO
|
|
70
|
+
days), compare such days in time order, and write years before 1 AD as the table does ("2 BC");
|
|
71
|
+
Years combined keeps the first and last year a `Date` holds as far as it holds
|
|
72
|
+
([#349](https://github.com/eizedev/pivotkit/issues/349)).
|
|
73
|
+
- The import UI takes a plugin's table as pivotkit-core's `readFile` completes it; its own
|
|
74
|
+
`completeTable` is gone ([#130](https://github.com/eizedev/pivotkit/issues/130)).
|
|
75
|
+
|
|
76
|
+
## [0.6.0] - 2026-11-14
|
|
77
|
+
|
|
78
|
+
### Upgrading from 0.5
|
|
79
|
+
|
|
80
|
+
What a host checks; the [upgrade page](https://pivotkit.eize.dev/getting-started/upgrading/#from-0-5) has the details.
|
|
81
|
+
|
|
82
|
+
- Export → **CSV file (.csv)** is called **Table as CSV (.csv)** (German **Tabelle als CSV (.csv)**);
|
|
83
|
+
its label key `exportCsv` and its `onExport` kind `"csv"` stay. Tests or screenshots that look for
|
|
84
|
+
the old text take the new one.
|
|
85
|
+
- `exportData` (Export → Source data) is new and off by default.
|
|
86
|
+
- pivotkit-core moves to `^0.6.0` with it.
|
|
87
|
+
|
|
88
|
+
### Added
|
|
89
|
+
|
|
90
|
+
- `onSaveTemplate(name, view, { scope, source })` and `onPublishTemplate(name, view, { source })`
|
|
91
|
+
get the data shown as a view file names it (`{ id, name, params }`, `null` without a source id),
|
|
92
|
+
so a host that keeps views can keep a workbook's sheet with them; Publish of a view file or of a
|
|
93
|
+
view of the browser store made for other data gives that data ([#252](https://github.com/eizedev/pivotkit/issues/252)).
|
|
94
|
+
- `exportData` (default `false`): the Export menu's last group **Source data** with **All rows as CSV
|
|
95
|
+
(.csv)** and **All rows as JSON (.json)**: every row of the data shown, every column except derived
|
|
96
|
+
fields, under the fields' own names, values not formatted (`<fileName>-data.csv`,
|
|
97
|
+
`<fileName>-data.json`; `onExport` kinds `"data-csv"`, `"data-json"`). With the view file of
|
|
98
|
+
Download view, `pivotkit render` makes the report again. It holds what the report holds, also
|
|
99
|
+
columns no view places, so it is off unless the host turns it on (docs/security.md, "Source data").
|
|
100
|
+
|
|
101
|
+
### Changed
|
|
102
|
+
|
|
103
|
+
- The identifier rule of the field list (`isIdentifierName`), the names of groupings and a loaded
|
|
104
|
+
file's source id come from pivotkit-core; nothing changes in the report ([#253](https://github.com/eizedev/pivotkit/issues/253)).
|
|
105
|
+
- Export → **CSV file (.csv)** is called **Table as CSV (.csv)** (German **Tabelle als CSV (.csv)**),
|
|
106
|
+
and its "i" says it is the table, not the rows behind it; its `kind` stays `"csv"`.
|
|
107
|
+
- Depends on `pivotkit-core` `^0.6.0` (was `^0.5.0`) and `pivotkit-report` `^0.2.0` (was `^0.1.0`): a host
|
|
108
|
+
that also lists pivotkit-core updates both together, or it gets two copies.
|
|
109
|
+
|
|
110
|
+
### Fixed
|
|
111
|
+
|
|
112
|
+
- A view made on a sheet of a loaded workbook other than the first opens on that sheet again after
|
|
113
|
+
the same workbook is loaded anew: views saved, downloaded and linked from a workbook's sheet name it
|
|
114
|
+
in `source.params.sheet`; while a workbook is shown, Views lists the views of its other sheets with
|
|
115
|
+
"Sheet “…”" next to them, and opening one (or such a view file) reads that sheet of the file again
|
|
116
|
+
(a step Undo takes back) before the view is shown. The browser store keeps a view of a name per
|
|
117
|
+
sheet. A view whose sheet the workbook does not have says so ([#252](https://github.com/eizedev/pivotkit/issues/252)).
|
|
118
|
+
- A rule on the name whose text is emptied (select all and delete, the field's ×, or only spaces)
|
|
119
|
+
no longer keeps filtering by its last text while the field looks empty: the rule leaves the view
|
|
120
|
+
a moment later, its row stays as a rule not yet complete, and a new text applies it again in its
|
|
121
|
+
place among the rules, with its blank items kept as before ([#159](https://github.com/eizedev/pivotkit/issues/159)).
|
|
122
|
+
|
|
9
123
|
## [0.5.0] - 2026-11-13
|
|
10
124
|
|
|
11
125
|
### Upgrading from 0.4
|
|
12
126
|
|
|
13
|
-
What a host checks; the [upgrade page](https://pivotkit.eize.dev/getting-started/upgrading
|
|
127
|
+
What a host checks; the [upgrade page](https://pivotkit.eize.dev/getting-started/upgrading/#from-0-4) has the details.
|
|
14
128
|
|
|
15
129
|
- **Breaking:** views, view files and links are written in format version 2; pivotkit 0.4 refuses
|
|
16
130
|
them as newer. Version 1 loads with the same result.
|
|
@@ -935,7 +1049,9 @@ First release.
|
|
|
935
1049
|
weather (Open-Meteo), countries (World Bank), earthquakes (USGS), Nobel laureates and the release
|
|
936
1050
|
cycles of software products (endoflife.date).
|
|
937
1051
|
|
|
938
|
-
[Unreleased]: https://github.com/eizedev/pivotkit/compare/pivotkit-react@0.
|
|
1052
|
+
[Unreleased]: https://github.com/eizedev/pivotkit/compare/pivotkit-react@0.6.1...HEAD
|
|
1053
|
+
[0.6.1]: https://github.com/eizedev/pivotkit/compare/pivotkit-react@0.6.0...pivotkit-react@0.6.1
|
|
1054
|
+
[0.6.0]: https://github.com/eizedev/pivotkit/compare/pivotkit-react@0.5.0...pivotkit-react@0.6.0
|
|
939
1055
|
[0.5.0]: https://github.com/eizedev/pivotkit/compare/pivotkit-react@0.4.0...pivotkit-react@0.5.0
|
|
940
1056
|
[0.4.0]: https://github.com/eizedev/pivotkit/compare/pivotkit-react@0.3.0...pivotkit-react@0.4.0
|
|
941
1057
|
[0.3.0]: https://github.com/eizedev/pivotkit/compare/pivotkit-react@0.2.0...pivotkit-react@0.3.0
|
package/README.md
CHANGED
|
@@ -4,7 +4,9 @@ The pivot report builder of [pivotkit](https://pivotkit.eize.dev/) as a React 18
|
|
|
4
4
|
`<PivotReport>`: a searchable field list, four drop zones (Rows, Columns, Values, Filters) with drag
|
|
5
5
|
and drop and a menu on every field, table and chart (Apache ECharts), filters with value counts,
|
|
6
6
|
drill-down to the rows behind a value, undo and redo, saved and shared views as JSON files, and
|
|
7
|
-
Excel, CSV, HTML report, PNG and SVG export and printing.
|
|
7
|
+
Excel, CSV, HTML report, PNG and SVG export and printing. Where the host turns them on, people load
|
|
8
|
+
their own CSV, JSON or Excel file with a preview (`allowImport`) and download the rows behind the
|
|
9
|
+
report for the command line (`exportData`). Excel's PivotTable is the reference; the engine is
|
|
8
10
|
[pivotkit-core](https://www.npmjs.com/package/pivotkit-core).
|
|
9
11
|
|
|
10
12
|
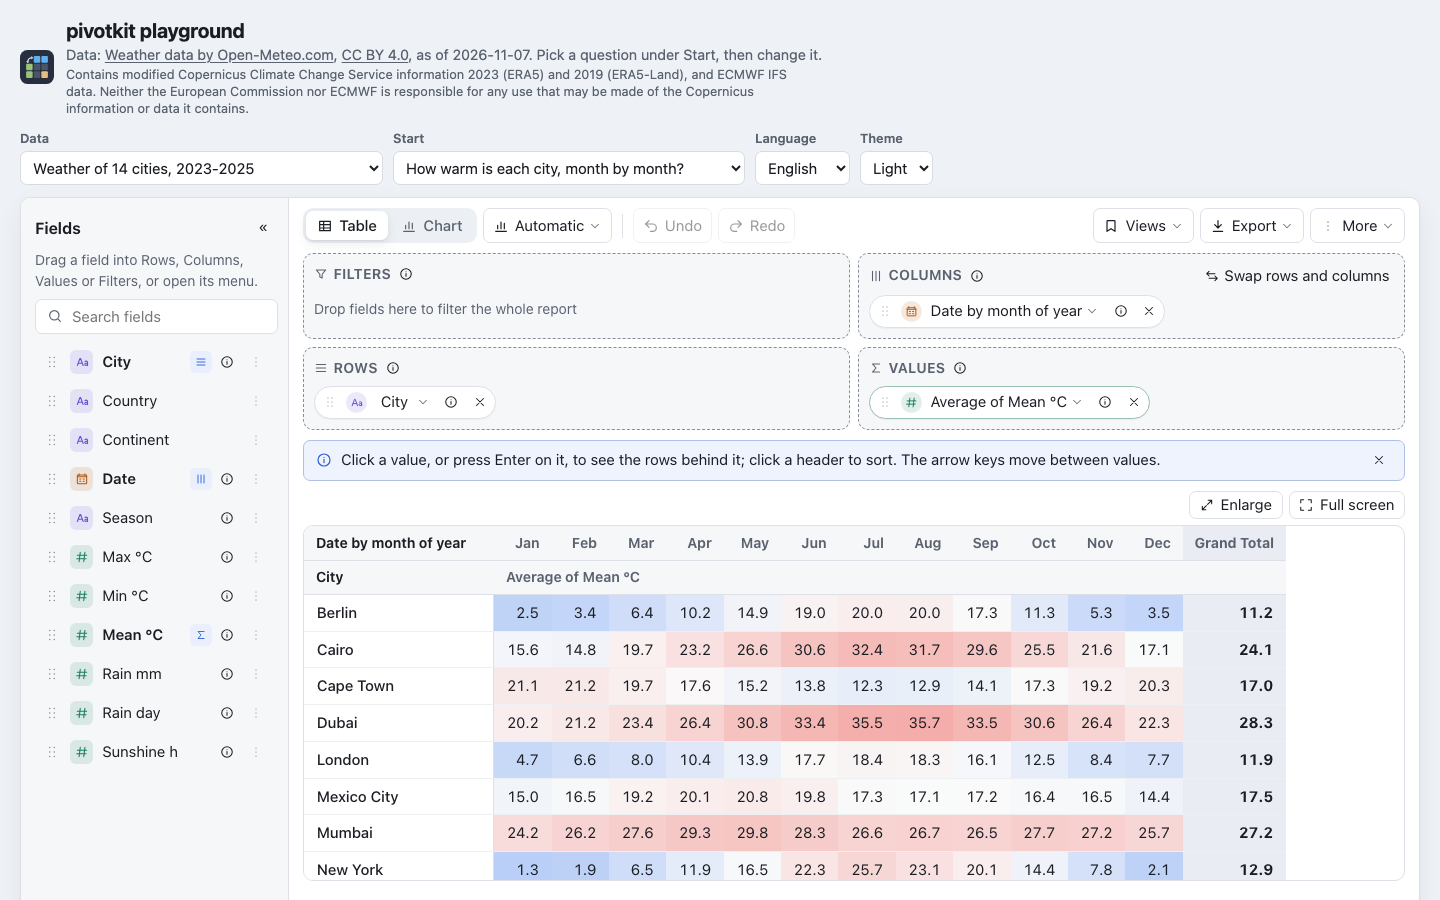
|
|
@@ -54,6 +56,7 @@ the data; it cannot run code.
|
|
|
54
56
|
| Topic | Page |
|
|
55
57
|
| --- | --- |
|
|
56
58
|
| Getting started: install, first report, saved views, clicks | [Getting started with React](https://pivotkit.eize.dev/getting-started/react/) |
|
|
59
|
+
| Loading files and the source data | [Load your own data](https://pivotkit.eize.dev/use/load-data/), [the table or the rows](https://pivotkit.eize.dev/use/export/#the-table-or-the-rows-behind-it) |
|
|
57
60
|
| Bundlers, import maps, PowerShell Universal | [Bundlers and import maps](https://pivotkit.eize.dev/getting-started/react/#bundlers-and-import-maps), [PowerShell Universal](https://pivotkit.eize.dev/getting-started/react/#powershell-universal) |
|
|
58
61
|
| Every prop | [Props](https://pivotkit.eize.dev/reference/react/#props), [props in detail](https://pivotkit.eize.dev/reference/react/#props-in-detail) |
|
|
59
62
|
| Controlled and uncontrolled | [Controlled and uncontrolled](https://pivotkit.eize.dev/reference/react/#controlled-and-uncontrolled) |
|
|
@@ -3,11 +3,11 @@ import {
|
|
|
3
3
|
Popover,
|
|
4
4
|
onTheWay,
|
|
5
5
|
useFormName
|
|
6
|
-
} from "./chunk-
|
|
6
|
+
} from "./chunk-JOWAEZAD.js";
|
|
7
7
|
import {
|
|
8
8
|
fill,
|
|
9
9
|
plural
|
|
10
|
-
} from "./chunk-
|
|
10
|
+
} from "./chunk-XN5HNKJ2.js";
|
|
11
11
|
|
|
12
12
|
// src/chart-types.js
|
|
13
13
|
import { chartPlan as corePlan } from "pivotkit-core";
|
|
@@ -435,7 +435,7 @@ function isEmptyView(view) {
|
|
|
435
435
|
}
|
|
436
436
|
|
|
437
437
|
// src/names.js
|
|
438
|
-
import { fieldLabel, relativeDateRange } from "pivotkit-core";
|
|
438
|
+
import { MAX_DATE_MS, fieldLabel, formatter, relativeDateRange } from "pivotkit-core";
|
|
439
439
|
var withNot = (f, text, labels) => hiddenNot(f) ? fill(labels.notRule, { rule: text }) : text;
|
|
440
440
|
function valueLabel(spec, labels) {
|
|
441
441
|
if (spec.label) {
|
|
@@ -485,9 +485,25 @@ function valueConditionText(view, f, labels, locale) {
|
|
|
485
485
|
}
|
|
486
486
|
return withNot(f, fill(labels.valueConditions.compare, { value, op: Object.hasOwn(OP_SIGNS, op) ? OP_SIGNS[op] : op, number: number(f.value) }), labels);
|
|
487
487
|
}
|
|
488
|
-
var
|
|
489
|
-
var
|
|
490
|
-
var
|
|
488
|
+
var dayPart = (iso) => iso.split("T")[0];
|
|
489
|
+
var dayMs = (iso) => Date.parse(`${dayPart(iso)}T00:00Z`);
|
|
490
|
+
var yearOf = (iso) => Number(iso.slice(0, iso.indexOf("-", 1)));
|
|
491
|
+
var monthOf = (iso) => Number(dayPart(iso).slice(-5, -3));
|
|
492
|
+
var isoYear = (y) => y >= 0 && y <= 9999 ? String(y).padStart(4, "0") : `${y < 0 ? "-" : "+"}${String(Math.abs(y)).padStart(6, "0")}`;
|
|
493
|
+
var midYear = (y) => {
|
|
494
|
+
const d = /* @__PURE__ */ new Date(0);
|
|
495
|
+
d.setUTCFullYear(y, 6, 1);
|
|
496
|
+
return d;
|
|
497
|
+
};
|
|
498
|
+
var yearText = (y, locale) => y >= 1 ? String(y) : midYear(y).toLocaleDateString(locale, { year: "numeric", era: "short", calendar: "gregory", timeZone: "UTC" });
|
|
499
|
+
var monthText = (iso, locale) => {
|
|
500
|
+
const y = yearOf(iso);
|
|
501
|
+
const at = Math.max(dayMs(`${isoYear(y)}-${String(monthOf(iso)).padStart(2, "0")}-01`) || -MAX_DATE_MS, -MAX_DATE_MS);
|
|
502
|
+
return new Date(at).toLocaleDateString(locale, { month: "short", year: "numeric", timeZone: "UTC", ...y < 1 ? { era: "short" } : {} });
|
|
503
|
+
};
|
|
504
|
+
var dayText = (iso, locale) => formatter("date", { locale })(dayMs(iso));
|
|
505
|
+
var isoDay = (ms) => new Date(ms).toISOString().split("T")[0];
|
|
506
|
+
var dayAfter = (iso, n = 1) => isoDay(dayMs(iso) + n * 864e5);
|
|
491
507
|
function relativeDays(f, timeZone, now, latest, more = {}) {
|
|
492
508
|
const range = datesOf(f, timeZone, now, latest, more);
|
|
493
509
|
return range && range.from !== null ? { from: range.from, to: range.to } : null;
|
|
@@ -495,61 +511,63 @@ function relativeDays(f, timeZone, now, latest, more = {}) {
|
|
|
495
511
|
var datesOf = (f, timeZone, now, latest, more = {}) => relativeDateRange(f.unit, f.count ?? 1, { timeZone, now, anchor: f.anchor, latest: latest ?? void 0, first: more.first ?? void 0, direction: f.direction, calendar: f.calendar, includeCurrent: f.includeCurrent, weekStart: more.weekStart });
|
|
496
512
|
var plainRange = (f) => ["last", "this"].includes(f.direction ?? "last") && f.calendar !== false && (f.anchor === void 0 || f.anchor === "today" || f.anchor === "latest") && ["year", "quarter", "month", "week", "day"].includes(f.unit);
|
|
497
513
|
function periodText(range, unit, locale) {
|
|
498
|
-
const
|
|
499
|
-
const quarter = (iso) => `Q${Math.floor((
|
|
500
|
-
const text = unit === "year" ?
|
|
514
|
+
const year = (iso) => yearText(yearOf(iso), locale);
|
|
515
|
+
const quarter = (iso) => `Q${Math.floor((monthOf(iso) - 1) / 3) + 1} ${year(iso)}`;
|
|
516
|
+
const text = unit === "year" ? year : unit === "quarter" ? quarter : unit === "month" ? (iso) => monthText(iso, locale) : (iso) => dayText(dayPart(iso), locale);
|
|
501
517
|
const [from, to] = [text(range.from), text(range.to)];
|
|
502
518
|
return from === to ? from : `${from}\u2013${to}`;
|
|
503
519
|
}
|
|
504
520
|
function rangeShare(range, unit, span, locale) {
|
|
505
521
|
const grain = unit === "quarter" ? "month" : unit === "week" ? "day" : unit;
|
|
506
|
-
range = { from: range.from
|
|
522
|
+
range = { from: dayPart(range.from), to: dayPart(range.to) };
|
|
507
523
|
const [first, last] = [periodStart(isoDay(span.min), grain), periodEnd(isoDay(span.max), grain)];
|
|
508
|
-
if (first <= range.from && last >= range.to) {
|
|
524
|
+
if (dayMs(first) <= dayMs(range.from) && dayMs(last) >= dayMs(range.to)) {
|
|
509
525
|
return null;
|
|
510
526
|
}
|
|
511
|
-
const from = range.from > first ? range.from : first;
|
|
512
|
-
const to = range.to < last ? range.to : last;
|
|
513
|
-
if (from > to) {
|
|
527
|
+
const from = dayMs(range.from) > dayMs(first) ? range.from : first;
|
|
528
|
+
const to = dayMs(range.to) < dayMs(last) ? range.to : last;
|
|
529
|
+
if (dayMs(from) > dayMs(to)) {
|
|
514
530
|
return { none: true };
|
|
515
531
|
}
|
|
516
532
|
const missing = [];
|
|
517
533
|
let count = 0;
|
|
518
534
|
const part = (a, b, dataYear) => {
|
|
519
535
|
const years = [];
|
|
520
|
-
const [ya, yb] = [
|
|
536
|
+
const [ya, yb] = [yearOf(a), yearOf(b)];
|
|
521
537
|
for (let y = ya; y <= yb; y++) {
|
|
522
538
|
if (y !== dataYear) {
|
|
523
539
|
years.push(y);
|
|
524
540
|
}
|
|
525
541
|
}
|
|
526
542
|
if (years.length) {
|
|
527
|
-
missing.push(years.length === 1 ?
|
|
543
|
+
missing.push(years.length === 1 ? yearText(years[0], locale) : `${yearText(years[0], locale)}\u2013${yearText(years[years.length - 1], locale)}`);
|
|
528
544
|
count += years.length;
|
|
529
545
|
}
|
|
530
546
|
if (ya <= dataYear && dataYear <= yb) {
|
|
531
|
-
const yearFrom = `${
|
|
532
|
-
const yearTo = `${
|
|
533
|
-
const rest = { from: a > yearFrom ? a : yearFrom, to: b < yearTo ? b : yearTo };
|
|
547
|
+
const yearFrom = `${isoYear(dataYear)}-01-01`;
|
|
548
|
+
const yearTo = `${isoYear(dataYear)}-12-31`;
|
|
549
|
+
const rest = { from: dayMs(a) > dayMs(yearFrom) ? a : yearFrom, to: dayMs(b) < dayMs(yearTo) ? b : yearTo };
|
|
534
550
|
missing.push(periodText(rest, unit, locale));
|
|
535
551
|
count += periodText({ from: rest.from, to: rest.from }, unit, locale) === periodText({ from: rest.to, to: rest.to }, unit, locale) ? 1 : 2;
|
|
536
552
|
}
|
|
537
553
|
};
|
|
538
|
-
if (range.from < first) {
|
|
539
|
-
part(range.from, dayAfter(first, -1),
|
|
554
|
+
if (dayMs(range.from) < dayMs(first)) {
|
|
555
|
+
part(range.from, dayAfter(first, -1), yearOf(first));
|
|
540
556
|
}
|
|
541
|
-
if (range.to > last) {
|
|
542
|
-
part(dayAfter(last), range.to,
|
|
557
|
+
if (dayMs(range.to) > dayMs(last)) {
|
|
558
|
+
part(dayAfter(last), range.to, yearOf(last));
|
|
543
559
|
}
|
|
544
560
|
return { none: false, data: periodText({ from, to }, unit, locale), missing, count };
|
|
545
561
|
}
|
|
546
|
-
var periodStart = (iso, unit) => unit === "year" ? `${iso
|
|
562
|
+
var periodStart = (iso, unit) => unit === "year" ? `${isoYear(yearOf(iso))}-01-01` : unit === "month" ? `${iso.slice(0, -3)}-01` : iso;
|
|
547
563
|
function periodEnd(iso, unit) {
|
|
548
564
|
if (unit === "day") {
|
|
549
565
|
return iso;
|
|
550
566
|
}
|
|
551
|
-
const [y, m] = [
|
|
552
|
-
|
|
567
|
+
const [y, m] = [yearOf(iso), monthOf(iso)];
|
|
568
|
+
const end = /* @__PURE__ */ new Date(0);
|
|
569
|
+
end.setUTCFullYear(y, unit === "year" ? 11 : m, unit === "year" ? 31 : 0);
|
|
570
|
+
return isoDay(Math.min(end.getTime(), MAX_DATE_MS) || MAX_DATE_MS);
|
|
553
571
|
}
|
|
554
572
|
function relativeText(f, labels, locale, timeZone, now, span, weekStart) {
|
|
555
573
|
if (!plainRange(f)) {
|
|
@@ -608,26 +626,28 @@ function otherRangeText(f, labels, locale, timeZone, now, span, weekStart) {
|
|
|
608
626
|
}
|
|
609
627
|
function precisionText(iso, precision, locale) {
|
|
610
628
|
if (precision === "year" || precision === "quarter" || precision === "month") {
|
|
611
|
-
const at = /* @__PURE__ */ new Date(`${iso.slice(0, 10)}T00:00Z`);
|
|
612
629
|
if (precision === "month") {
|
|
613
|
-
return
|
|
630
|
+
return monthText(iso, locale);
|
|
614
631
|
}
|
|
615
|
-
|
|
632
|
+
const year = yearText(yearOf(iso), locale);
|
|
633
|
+
return precision === "year" ? year : `Q${Math.floor((monthOf(iso) - 1) / 3) + 1} ${year}`;
|
|
616
634
|
}
|
|
617
635
|
return pointText(iso, locale);
|
|
618
636
|
}
|
|
619
|
-
var pointText = (iso, locale) => iso.
|
|
637
|
+
var pointText = (iso, locale) => iso.includes("T") ? formatter("datetime", { locale })(Date.parse(`${iso}Z`)) : dayText(iso, locale);
|
|
620
638
|
function wholeYears(from, to) {
|
|
621
|
-
const
|
|
622
|
-
|
|
639
|
+
const day = /^(?:\d{4}|[+-]\d{6})-\d{2}-\d{2}$/;
|
|
640
|
+
const whole = typeof from === "string" && typeof to === "string" && day.test(from) && day.test(to) && (from.endsWith("-01-01") || from === isoDay(-MAX_DATE_MS)) && (to.endsWith("-12-31") || to === isoDay(MAX_DATE_MS));
|
|
641
|
+
return whole ? [yearOf(from), yearOf(to)] : null;
|
|
623
642
|
}
|
|
624
643
|
function compareText(f, labels, locale, { date, labelOf }) {
|
|
625
644
|
const shown = (v) => typeof v === "string" ? precisionText(v, f.precision, locale) : labelOf?.(v) ?? (date ? String(v) : v.toLocaleString(locale, { maximumFractionDigits: 6 }));
|
|
626
645
|
const forms = labels.compareShort;
|
|
627
646
|
const op = ruleOp(f);
|
|
628
647
|
if (op === "between" || op === "notBetween") {
|
|
629
|
-
const
|
|
630
|
-
const
|
|
648
|
+
const order = (v) => typeof v === "string" ? dayMs(v) : v;
|
|
649
|
+
const [from, to] = f.value2 !== void 0 && order(f.value2) < order(f.value) ? [f.value2, f.value] : [f.value, f.value2];
|
|
650
|
+
const years = wholeYears(from, to)?.map((y) => yearText(y, locale));
|
|
631
651
|
if (years) {
|
|
632
652
|
return years[0] === years[1] ? fill(forms[op === "between" ? "=" : "!="], { value: years[0] }) : fill(forms[op], { from: years[0], to: years[1] });
|
|
633
653
|
}
|
|
@@ -1480,6 +1500,10 @@ export {
|
|
|
1480
1500
|
refLabel,
|
|
1481
1501
|
sortText,
|
|
1482
1502
|
valueConditionText,
|
|
1503
|
+
dayMs,
|
|
1504
|
+
yearOf,
|
|
1505
|
+
isoYear,
|
|
1506
|
+
yearText,
|
|
1483
1507
|
dayText,
|
|
1484
1508
|
isoDay,
|
|
1485
1509
|
relativeDays,
|
|
@@ -383,6 +383,7 @@ function Popover({ open, anchor, onClose, label, role = "dialog", align = "start
|
|
|
383
383
|
return void 0;
|
|
384
384
|
}
|
|
385
385
|
let last = null;
|
|
386
|
+
let placedHeight = -1;
|
|
386
387
|
const place = () => {
|
|
387
388
|
const el2 = ref.current;
|
|
388
389
|
const a = anchor.current;
|
|
@@ -390,7 +391,7 @@ function Popover({ open, anchor, onClose, label, role = "dialog", align = "start
|
|
|
390
391
|
return;
|
|
391
392
|
}
|
|
392
393
|
const r = a.getBoundingClientRect();
|
|
393
|
-
const size2 = { width: el2.offsetWidth, height: el2.scrollHeight };
|
|
394
|
+
const size2 = { width: el2.offsetWidth, height: placedHeight = el2.scrollHeight };
|
|
394
395
|
const viewport = viewportOf(el2.ownerDocument);
|
|
395
396
|
const place2 = keepPlace(last, placePopover(r, size2, viewport, align, { fill }), r, size2, viewport);
|
|
396
397
|
last = { top: place2.top, side: place2.side, anchorTop: r.top };
|
|
@@ -407,7 +408,7 @@ function Popover({ open, anchor, onClose, label, role = "dialog", align = "start
|
|
|
407
408
|
let rect = anchor.current?.getBoundingClientRect();
|
|
408
409
|
const follow = () => {
|
|
409
410
|
const next = anchor.current?.getBoundingClientRect();
|
|
410
|
-
if (next && rect && (next.x !== rect.x || next.y !== rect.y || next.width !== rect.width || next.height !== rect.height)) {
|
|
411
|
+
if (next && rect && (next.x !== rect.x || next.y !== rect.y || next.width !== rect.width || next.height !== rect.height) || ref.current?.scrollHeight !== placedHeight) {
|
|
411
412
|
place();
|
|
412
413
|
}
|
|
413
414
|
rect = next;
|
|
@@ -416,13 +417,14 @@ function Popover({ open, anchor, onClose, label, role = "dialog", align = "start
|
|
|
416
417
|
if (!sheet) {
|
|
417
418
|
frame = requestAnimationFrame(follow);
|
|
418
419
|
}
|
|
420
|
+
const onScroll = (e) => e.target instanceof Node && ref.current?.contains(e.target) || place();
|
|
419
421
|
window.addEventListener("resize", place);
|
|
420
|
-
window.addEventListener("scroll",
|
|
422
|
+
window.addEventListener("scroll", onScroll, true);
|
|
421
423
|
return () => {
|
|
422
424
|
cancelAnimationFrame(frame);
|
|
423
425
|
ro?.disconnect();
|
|
424
426
|
window.removeEventListener("resize", place);
|
|
425
|
-
window.removeEventListener("scroll",
|
|
427
|
+
window.removeEventListener("scroll", onScroll, true);
|
|
426
428
|
};
|
|
427
429
|
}, [open, anchor, align, sheet, layer, fill]);
|
|
428
430
|
useEscapeLayer(open, onClose);
|
|
@@ -1,7 +1,7 @@
|
|
|
1
1
|
import {
|
|
2
2
|
MENU_TEXTS,
|
|
3
3
|
mergeLabels
|
|
4
|
-
} from "./chunk-
|
|
4
|
+
} from "./chunk-XN5HNKJ2.js";
|
|
5
5
|
|
|
6
6
|
// src/menu-labels.js
|
|
7
7
|
var en = {
|
|
@@ -15,9 +15,11 @@ var en = {
|
|
|
15
15
|
along: "The direction the calculation walks: Rows goes down the rows of each column, Columns across the columns of each row. A running total adds up along it, a difference compares with the item before it.",
|
|
16
16
|
showAs: "Shows each value as a share, a difference, a running total or a rank instead of the number itself. For percentages, a tip above the result says what 100% is.",
|
|
17
17
|
exportXlsx: "Every number with all its decimals, formats kept, ready to calculate with.",
|
|
18
|
-
exportCsv: "
|
|
18
|
+
exportCsv: "The table as it is shown, with its totals and its percentages, as plain text. Not the rows behind it: that is Source data, below.",
|
|
19
19
|
exportHtml: "A page with the table as it is shown, the chart when the chart is shown, and the filters: opens in any browser, prints well.",
|
|
20
20
|
exportPrint: "The same report in the browser's print dialog: print it, or pick Save as PDF there.",
|
|
21
|
+
exportDataCsv: "All the original rows behind the report, before grouping, filters and totals, with every field. For your own analysis, or to build this report again elsewhere with its view (Views \u2192 Download view). Excel set to a comma decimal: open it with Data \u2192 From Text/CSV.",
|
|
22
|
+
exportDataJson: "The same rows as JSON, for a program: numbers as numbers, text as text, a blank as null.",
|
|
21
23
|
copyTable: "The table as it is shown, headers and totals included: tab-separated, pastes into Excel or Google Sheets as columns.",
|
|
22
24
|
copyDataJson: "The table's numbers with their labels as JSON, for a program. Not the view itself: that is Views \u2192 Copy view as JSON.",
|
|
23
25
|
drillCopy: "The rows as the panel shows them, with a header row: tab-separated, pastes into Excel or Google Sheets as columns.",
|
|
@@ -199,6 +201,8 @@ var en = {
|
|
|
199
201
|
storeTooLarge: "the views would take more than {max} characters",
|
|
200
202
|
storeRefused: "this browser did not keep it (storage blocked or full)",
|
|
201
203
|
storeChanged: "the views were changed in another tab; open the menu again",
|
|
204
|
+
// next to a saved view made on a workbook's sheet, while a workbook is shown
|
|
205
|
+
viewSheet: "Sheet \u201C{sheet}\u201D",
|
|
202
206
|
// what a save, a delete or a publish in the Views menu came to; "Rejected": the host refused
|
|
203
207
|
// without saying why (a rejected promise without a message)
|
|
204
208
|
toastSaved: "View \u201C{name}\u201D saved",
|
|
@@ -312,7 +316,7 @@ var en = {
|
|
|
312
316
|
exportDownload: "Download",
|
|
313
317
|
exportCopy: "Copy",
|
|
314
318
|
exportXlsx: "Excel workbook (.xlsx)",
|
|
315
|
-
exportCsv: "CSV
|
|
319
|
+
exportCsv: "Table as CSV (.csv)",
|
|
316
320
|
exportPng: "Chart image (.png)",
|
|
317
321
|
exportSvg: "Chart image (.svg)",
|
|
318
322
|
exportHtml: "HTML report (.html)",
|
|
@@ -320,6 +324,9 @@ var en = {
|
|
|
320
324
|
exportPrint: "Print or save as PDF\u2026",
|
|
321
325
|
exportPngNeedsChart: "Switch to Chart first.",
|
|
322
326
|
exportNeedsField: "Add a field first.",
|
|
327
|
+
exportDataGroup: "Source data",
|
|
328
|
+
exportDataCsv: "All rows as CSV (.csv)",
|
|
329
|
+
exportDataJson: "All rows as JSON (.json)",
|
|
323
330
|
copyTable: "Copy table",
|
|
324
331
|
copyDataJson: "Copy data as JSON",
|
|
325
332
|
toastTableCopied: "Table copied: tab-separated, pastes into Excel or Google Sheets as columns",
|
|
@@ -0,0 +1,36 @@
|
|
|
1
|
+
// src/sheet-views.js
|
|
2
|
+
var FILE_ID = /^([^]*)#[0-9a-f]{16}$/;
|
|
3
|
+
function fileOfId(id) {
|
|
4
|
+
const m = typeof id === "string" ? FILE_ID.exec(id) : null;
|
|
5
|
+
return m ? m[1] : null;
|
|
6
|
+
}
|
|
7
|
+
function sheetOfSource(source) {
|
|
8
|
+
const sheet = source && typeof source === "object" ? (
|
|
9
|
+
/** @type {any} */
|
|
10
|
+
source.params?.sheet
|
|
11
|
+
) : void 0;
|
|
12
|
+
return typeof sheet === "string" && sheet ? sheet : null;
|
|
13
|
+
}
|
|
14
|
+
function listedFor(entry, shown) {
|
|
15
|
+
if (!entry.sourceId || !shown.id || entry.sourceId === shown.id) {
|
|
16
|
+
return true;
|
|
17
|
+
}
|
|
18
|
+
return Boolean(entry.sheet && shown.sheet && fileOfId(entry.sourceId) !== null && fileOfId(entry.sourceId) === fileOfId(shown.id));
|
|
19
|
+
}
|
|
20
|
+
function sheetPlan(view, shown) {
|
|
21
|
+
const sheet = view.sheet;
|
|
22
|
+
if (!sheet || !shown.sheet || sheet === shown.sheet) {
|
|
23
|
+
return { kind: "none" };
|
|
24
|
+
}
|
|
25
|
+
const file = fileOfId(view.id);
|
|
26
|
+
if (file === null || file !== fileOfId(shown.id)) {
|
|
27
|
+
return { kind: "none" };
|
|
28
|
+
}
|
|
29
|
+
return { kind: shown.sheets.includes(sheet) ? "switch" : "missing", sheet };
|
|
30
|
+
}
|
|
31
|
+
|
|
32
|
+
export {
|
|
33
|
+
sheetOfSource,
|
|
34
|
+
listedFor,
|
|
35
|
+
sheetPlan
|
|
36
|
+
};
|
|
@@ -1,5 +1,5 @@
|
|
|
1
1
|
// src/labels.js
|
|
2
|
-
import {
|
|
2
|
+
import { GROUPING_NAMES, PivotkitError, REPORT_LABELS } from "pivotkit-core";
|
|
3
3
|
var en = {
|
|
4
4
|
/** the language of the texts, for the report's lang attribute */
|
|
5
5
|
lang: "en",
|
|
@@ -7,28 +7,7 @@ var en = {
|
|
|
7
7
|
report: "Pivot report",
|
|
8
8
|
core: (
|
|
9
9
|
/** @type {import("pivotkit-core").Labels} */
|
|
10
|
-
|
|
11
|
-
...DEFAULT_LABELS,
|
|
12
|
-
// a yes/no field in the table, the filter list and the drill-down: words, not true/false
|
|
13
|
-
true: "Yes",
|
|
14
|
-
false: "No",
|
|
15
|
-
aggregators: {
|
|
16
|
-
count: "Count",
|
|
17
|
-
countUnique: "Distinct count",
|
|
18
|
-
listUnique: "List of distinct values",
|
|
19
|
-
sum: "Sum",
|
|
20
|
-
average: "Average",
|
|
21
|
-
median: "Median",
|
|
22
|
-
min: "Minimum",
|
|
23
|
-
max: "Maximum",
|
|
24
|
-
stdev: "Standard deviation (sample)",
|
|
25
|
-
stdevp: "Standard deviation (population)",
|
|
26
|
-
var: "Variance (sample)",
|
|
27
|
-
varp: "Variance (population)",
|
|
28
|
-
first: "First value",
|
|
29
|
-
last: "Last value"
|
|
30
|
-
}
|
|
31
|
-
}
|
|
10
|
+
REPORT_LABELS.en
|
|
32
11
|
),
|
|
33
12
|
zones: { rows: "Rows", cols: "Columns", values: "Values", filters: "Filters" },
|
|
34
13
|
zoneHints: {
|
|
@@ -124,22 +103,10 @@ var en = {
|
|
|
124
103
|
hour: "Hour of day",
|
|
125
104
|
bin: "Ranges"
|
|
126
105
|
},
|
|
127
|
-
// a date grouping's name: "Date by month"; the unit as it reads inside it (unitInName)
|
|
128
|
-
derivedName:
|
|
129
|
-
unitInName: {
|
|
130
|
-
|
|
131
|
-
yearQuarter: "quarter",
|
|
132
|
-
yearMonth: "month",
|
|
133
|
-
yearWeek: "week",
|
|
134
|
-
day: "day",
|
|
135
|
-
quarter: "quarter of year",
|
|
136
|
-
month: "month of year",
|
|
137
|
-
week: "week of year",
|
|
138
|
-
weekday: "weekday",
|
|
139
|
-
hour: "hour of day",
|
|
140
|
-
bin: "ranges"
|
|
141
|
-
},
|
|
142
|
-
binsName: "{field} (by {size})",
|
|
106
|
+
// a date grouping's name: "Date by month"; the unit as it reads inside it (unitInName); pivotkit-core's GROUPING_NAMES
|
|
107
|
+
derivedName: GROUPING_NAMES.en.name,
|
|
108
|
+
unitInName: { ...GROUPING_NAMES.en.units },
|
|
109
|
+
binsName: GROUPING_NAMES.en.bins,
|
|
143
110
|
top: "Top",
|
|
144
111
|
topBadge: "Top {count}",
|
|
145
112
|
bottomBadge: "Bottom {count}",
|
|
@@ -390,47 +357,7 @@ var de = {
|
|
|
390
357
|
report: "Pivot-Bericht",
|
|
391
358
|
core: (
|
|
392
359
|
/** @type {import("pivotkit-core").Labels} */
|
|
393
|
-
|
|
394
|
-
...DEFAULT_LABELS,
|
|
395
|
-
blank: "(Leer)",
|
|
396
|
-
total: "{label} gesamt",
|
|
397
|
-
grandTotal: "Gesamtergebnis",
|
|
398
|
-
values: "Werte",
|
|
399
|
-
valueName: "{agg} von {field}",
|
|
400
|
-
countRows: "Anzahl",
|
|
401
|
-
true: "Ja",
|
|
402
|
-
false: "Nein",
|
|
403
|
-
aggregators: {
|
|
404
|
-
count: "Anzahl",
|
|
405
|
-
countUnique: "Anzahl verschiedener Werte",
|
|
406
|
-
listUnique: "Liste verschiedener Werte",
|
|
407
|
-
sum: "Summe",
|
|
408
|
-
average: "Durchschnitt",
|
|
409
|
-
median: "Median",
|
|
410
|
-
min: "Minimum",
|
|
411
|
-
max: "Maximum",
|
|
412
|
-
stdev: "Standardabweichung (Stichprobe)",
|
|
413
|
-
stdevp: "Standardabweichung (Grundgesamtheit)",
|
|
414
|
-
var: "Varianz (Stichprobe)",
|
|
415
|
-
varp: "Varianz (Grundgesamtheit)",
|
|
416
|
-
first: "Erster Wert",
|
|
417
|
-
last: "Letzter Wert"
|
|
418
|
-
},
|
|
419
|
-
showAsName: "{showAs} von {value}",
|
|
420
|
-
showAs: {
|
|
421
|
-
percentOfGrandTotal: "% des Gesamtergebnisses",
|
|
422
|
-
percentOfRowTotal: "% der Zeilensumme",
|
|
423
|
-
percentOfColumnTotal: "% der Spaltensumme",
|
|
424
|
-
percentOfParentRow: "% der \xFCbergeordneten Zeile",
|
|
425
|
-
percentOfParentColumn: "% der \xFCbergeordneten Spalte",
|
|
426
|
-
differenceFromPrevious: "Differenz zum vorherigen",
|
|
427
|
-
percentDifferenceFromPrevious: "% Differenz zum vorherigen",
|
|
428
|
-
runningTotal: "Laufende Summe",
|
|
429
|
-
percentRunningTotal: "% laufende Summe",
|
|
430
|
-
rankAscending: "Rang (kleinster zuerst)",
|
|
431
|
-
rankDescending: "Rang (gr\xF6\xDFter zuerst)"
|
|
432
|
-
}
|
|
433
|
-
}
|
|
360
|
+
REPORT_LABELS.de
|
|
434
361
|
),
|
|
435
362
|
zones: { rows: "Zeilen", cols: "Spalten", values: "Werte", filters: "Filter" },
|
|
436
363
|
zoneHints: {
|
|
@@ -515,21 +442,9 @@ var de = {
|
|
|
515
442
|
hour: "Stunde am Tag",
|
|
516
443
|
bin: "Bereiche"
|
|
517
444
|
},
|
|
518
|
-
derivedName:
|
|
519
|
-
unitInName: {
|
|
520
|
-
|
|
521
|
-
yearQuarter: "Quartal",
|
|
522
|
-
yearMonth: "Monat",
|
|
523
|
-
yearWeek: "Woche",
|
|
524
|
-
day: "Tag",
|
|
525
|
-
quarter: "Quartal im Jahr",
|
|
526
|
-
month: "Monat im Jahr",
|
|
527
|
-
week: "Woche im Jahr",
|
|
528
|
-
weekday: "Wochentag",
|
|
529
|
-
hour: "Stunde am Tag",
|
|
530
|
-
bin: "Bereichen"
|
|
531
|
-
},
|
|
532
|
-
binsName: "{field} (je {size})",
|
|
445
|
+
derivedName: GROUPING_NAMES.de.name,
|
|
446
|
+
unitInName: { ...GROUPING_NAMES.de.units },
|
|
447
|
+
binsName: GROUPING_NAMES.de.bins,
|
|
533
448
|
top: "Oberste",
|
|
534
449
|
topBadge: "Top {count}",
|
|
535
450
|
bottomBadge: "Letzte {count}",
|