pivotkit-react 0.5.0 → 0.6.0
This diff represents the content of publicly available package versions that have been released to one of the supported registries. The information contained in this diff is provided for informational purposes only and reflects changes between package versions as they appear in their respective public registries.
- package/CHANGELOG.md +50 -2
- package/README.md +4 -1
- package/dist/chunks/{chunk-2AT72SLA.js → chunk-2RAVX4DO.js} +1 -1
- package/dist/chunks/{chunk-3E4NB5RZ.js → chunk-7LERNGUW.js} +7 -1
- package/dist/chunks/{chunk-U5Q5I2D5.js → chunk-TR2HROIK.js} +10 -3
- package/dist/chunks/chunk-W2KIPREL.js +36 -0
- package/dist/chunks/{chunk-3WUGQPWV.js → chunk-XN5HNKJ2.js} +10 -95
- package/dist/chunks/{chunk-4RS72AAA.js → chunk-YXLANLGL.js} +8 -2
- package/dist/import-ui.js +63 -158
- package/dist/index.js +66 -23
- package/dist/labels.js +4 -4
- package/dist/menu-texts-de.js +1 -1
- package/dist/menus.js +139 -43
- package/package.json +3 -3
- package/types/export-run.d.ts +7 -3
- package/types/field-info.d.ts +3 -10
- package/types/import-host.d.ts +34 -8
- package/types/import-labels.d.ts +6 -0
- package/types/import-module.d.ts +1 -1
- package/types/import-steps.d.ts +8 -0
- package/types/import-ui.d.ts +18 -4
- package/types/index.d.ts +53 -12
- package/types/labels.d.ts +2 -22
- package/types/menu-labels.d.ts +6 -0
- package/types/menu-ops.d.ts +5 -3
- package/types/share-actions.d.ts +14 -0
- package/types/sheet-views.d.ts +60 -0
- package/types/templates.d.ts +21 -1
- package/types/toolbar-panels.d.ts +8 -6
- package/types/use-export.d.ts +2 -2
- package/types/view-save.d.ts +10 -6
- package/types/view-store.d.ts +21 -11
- package/types/import-source.d.ts +0 -32
package/CHANGELOG.md
CHANGED
|
@@ -6,11 +6,58 @@ All notable changes to `pivotkit-react` are documented in this file. The format
|
|
|
6
6
|
|
|
7
7
|
## [Unreleased]
|
|
8
8
|
|
|
9
|
+
## [0.6.0] - 2026-11-14
|
|
10
|
+
|
|
11
|
+
### Upgrading from 0.5
|
|
12
|
+
|
|
13
|
+
What a host checks; the [upgrade page](https://pivotkit.eize.dev/getting-started/upgrading/#from-0-5) has the details.
|
|
14
|
+
|
|
15
|
+
- Export → **CSV file (.csv)** is called **Table as CSV (.csv)** (German **Tabelle als CSV (.csv)**);
|
|
16
|
+
its label key `exportCsv` and its `onExport` kind `"csv"` stay. Tests or screenshots that look for
|
|
17
|
+
the old text take the new one.
|
|
18
|
+
- `exportData` (Export → Source data) is new and off by default.
|
|
19
|
+
- pivotkit-core moves to `^0.6.0` with it.
|
|
20
|
+
|
|
21
|
+
### Added
|
|
22
|
+
|
|
23
|
+
- `onSaveTemplate(name, view, { scope, source })` and `onPublishTemplate(name, view, { source })`
|
|
24
|
+
get the data shown as a view file names it (`{ id, name, params }`, `null` without a source id),
|
|
25
|
+
so a host that keeps views can keep a workbook's sheet with them; Publish of a view file or of a
|
|
26
|
+
view of the browser store made for other data gives that data ([#252](https://github.com/eizedev/pivotkit/issues/252)).
|
|
27
|
+
- `exportData` (default `false`): the Export menu's last group **Source data** with **All rows as CSV
|
|
28
|
+
(.csv)** and **All rows as JSON (.json)**: every row of the data shown, every column except derived
|
|
29
|
+
fields, under the fields' own names, values not formatted (`<fileName>-data.csv`,
|
|
30
|
+
`<fileName>-data.json`; `onExport` kinds `"data-csv"`, `"data-json"`). With the view file of
|
|
31
|
+
Download view, `pivotkit render` makes the report again. It holds what the report holds, also
|
|
32
|
+
columns no view places, so it is off unless the host turns it on (docs/security.md, "Source data").
|
|
33
|
+
|
|
34
|
+
### Changed
|
|
35
|
+
|
|
36
|
+
- The identifier rule of the field list (`isIdentifierName`), the names of groupings and a loaded
|
|
37
|
+
file's source id come from pivotkit-core; nothing changes in the report ([#253](https://github.com/eizedev/pivotkit/issues/253)).
|
|
38
|
+
- Export → **CSV file (.csv)** is called **Table as CSV (.csv)** (German **Tabelle als CSV (.csv)**),
|
|
39
|
+
and its "i" says it is the table, not the rows behind it; its `kind` stays `"csv"`.
|
|
40
|
+
- Depends on `pivotkit-core` `^0.6.0` (was `^0.5.0`) and `pivotkit-report` `^0.2.0` (was `^0.1.0`): a host
|
|
41
|
+
that also lists pivotkit-core updates both together, or it gets two copies.
|
|
42
|
+
|
|
43
|
+
### Fixed
|
|
44
|
+
|
|
45
|
+
- A view made on a sheet of a loaded workbook other than the first opens on that sheet again after
|
|
46
|
+
the same workbook is loaded anew: views saved, downloaded and linked from a workbook's sheet name it
|
|
47
|
+
in `source.params.sheet`; while a workbook is shown, Views lists the views of its other sheets with
|
|
48
|
+
"Sheet “…”" next to them, and opening one (or such a view file) reads that sheet of the file again
|
|
49
|
+
(a step Undo takes back) before the view is shown. The browser store keeps a view of a name per
|
|
50
|
+
sheet. A view whose sheet the workbook does not have says so ([#252](https://github.com/eizedev/pivotkit/issues/252)).
|
|
51
|
+
- A rule on the name whose text is emptied (select all and delete, the field's ×, or only spaces)
|
|
52
|
+
no longer keeps filtering by its last text while the field looks empty: the rule leaves the view
|
|
53
|
+
a moment later, its row stays as a rule not yet complete, and a new text applies it again in its
|
|
54
|
+
place among the rules, with its blank items kept as before ([#159](https://github.com/eizedev/pivotkit/issues/159)).
|
|
55
|
+
|
|
9
56
|
## [0.5.0] - 2026-11-13
|
|
10
57
|
|
|
11
58
|
### Upgrading from 0.4
|
|
12
59
|
|
|
13
|
-
What a host checks; the [upgrade page](https://pivotkit.eize.dev/getting-started/upgrading
|
|
60
|
+
What a host checks; the [upgrade page](https://pivotkit.eize.dev/getting-started/upgrading/#from-0-4) has the details.
|
|
14
61
|
|
|
15
62
|
- **Breaking:** views, view files and links are written in format version 2; pivotkit 0.4 refuses
|
|
16
63
|
them as newer. Version 1 loads with the same result.
|
|
@@ -935,7 +982,8 @@ First release.
|
|
|
935
982
|
weather (Open-Meteo), countries (World Bank), earthquakes (USGS), Nobel laureates and the release
|
|
936
983
|
cycles of software products (endoflife.date).
|
|
937
984
|
|
|
938
|
-
[Unreleased]: https://github.com/eizedev/pivotkit/compare/pivotkit-react@0.
|
|
985
|
+
[Unreleased]: https://github.com/eizedev/pivotkit/compare/pivotkit-react@0.6.0...HEAD
|
|
986
|
+
[0.6.0]: https://github.com/eizedev/pivotkit/compare/pivotkit-react@0.5.0...pivotkit-react@0.6.0
|
|
939
987
|
[0.5.0]: https://github.com/eizedev/pivotkit/compare/pivotkit-react@0.4.0...pivotkit-react@0.5.0
|
|
940
988
|
[0.4.0]: https://github.com/eizedev/pivotkit/compare/pivotkit-react@0.3.0...pivotkit-react@0.4.0
|
|
941
989
|
[0.3.0]: https://github.com/eizedev/pivotkit/compare/pivotkit-react@0.2.0...pivotkit-react@0.3.0
|
package/README.md
CHANGED
|
@@ -4,7 +4,9 @@ The pivot report builder of [pivotkit](https://pivotkit.eize.dev/) as a React 18
|
|
|
4
4
|
`<PivotReport>`: a searchable field list, four drop zones (Rows, Columns, Values, Filters) with drag
|
|
5
5
|
and drop and a menu on every field, table and chart (Apache ECharts), filters with value counts,
|
|
6
6
|
drill-down to the rows behind a value, undo and redo, saved and shared views as JSON files, and
|
|
7
|
-
Excel, CSV, HTML report, PNG and SVG export and printing.
|
|
7
|
+
Excel, CSV, HTML report, PNG and SVG export and printing. Where the host turns them on, people load
|
|
8
|
+
their own CSV, JSON or Excel file with a preview (`allowImport`) and download the rows behind the
|
|
9
|
+
report for the command line (`exportData`). Excel's PivotTable is the reference; the engine is
|
|
8
10
|
[pivotkit-core](https://www.npmjs.com/package/pivotkit-core).
|
|
9
11
|
|
|
10
12
|
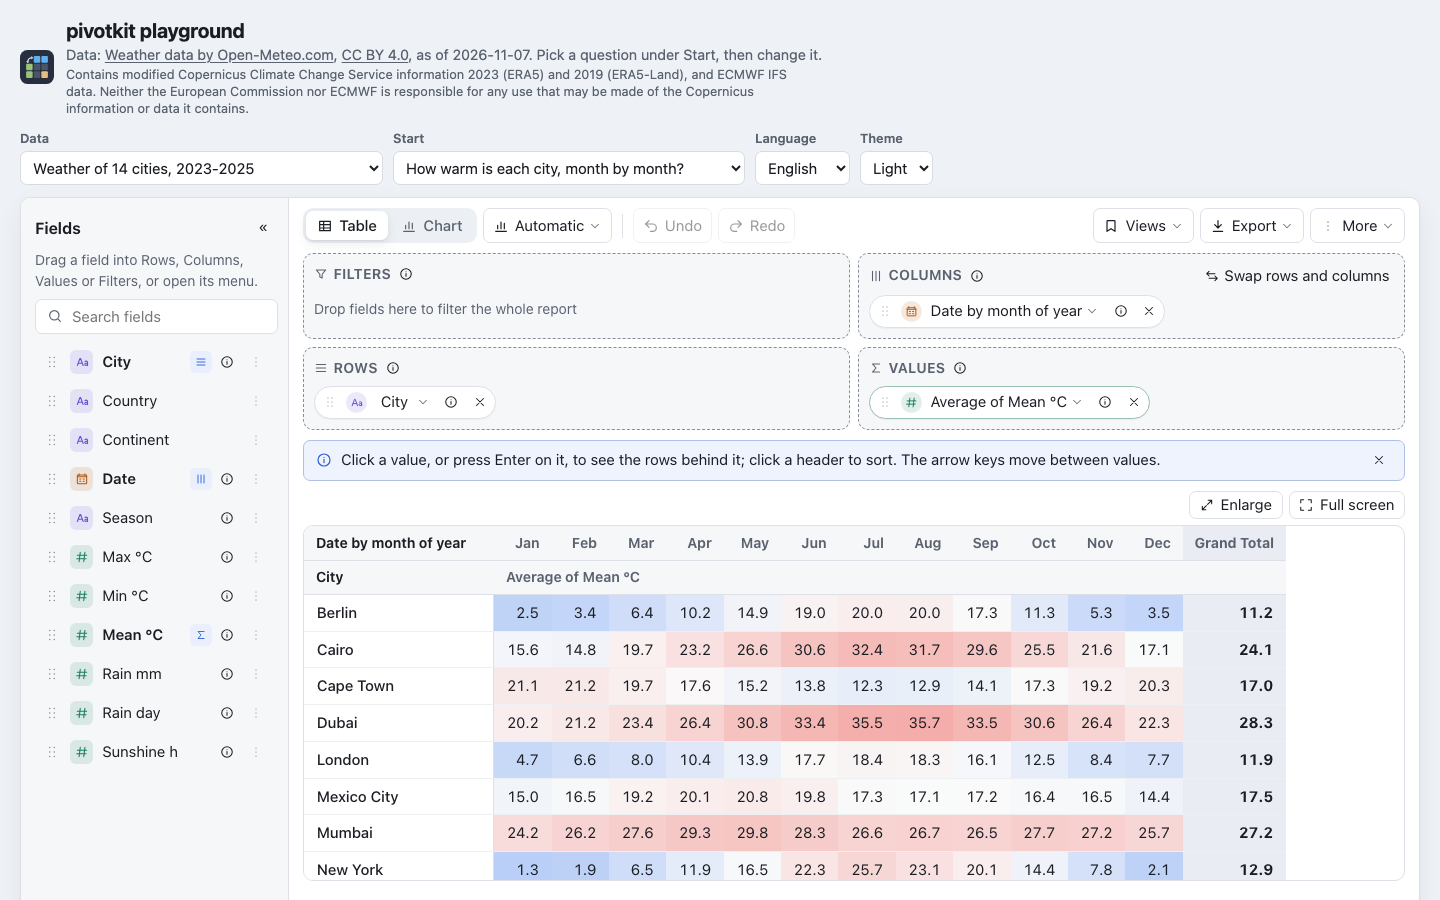
|
|
@@ -54,6 +56,7 @@ the data; it cannot run code.
|
|
|
54
56
|
| Topic | Page |
|
|
55
57
|
| --- | --- |
|
|
56
58
|
| Getting started: install, first report, saved views, clicks | [Getting started with React](https://pivotkit.eize.dev/getting-started/react/) |
|
|
59
|
+
| Loading files and the source data | [Load your own data](https://pivotkit.eize.dev/use/load-data/), [the table or the rows](https://pivotkit.eize.dev/use/export/#the-table-or-the-rows-behind-it) |
|
|
57
60
|
| Bundlers, import maps, PowerShell Universal | [Bundlers and import maps](https://pivotkit.eize.dev/getting-started/react/#bundlers-and-import-maps), [PowerShell Universal](https://pivotkit.eize.dev/getting-started/react/#powershell-universal) |
|
|
58
61
|
| Every prop | [Props](https://pivotkit.eize.dev/reference/react/#props), [props in detail](https://pivotkit.eize.dev/reference/react/#props-in-detail) |
|
|
59
62
|
| Controlled and uncontrolled | [Controlled and uncontrolled](https://pivotkit.eize.dev/reference/react/#controlled-and-uncontrolled) |
|
|
@@ -4,7 +4,7 @@ import {
|
|
|
4
4
|
mergeLabels,
|
|
5
5
|
messageOf,
|
|
6
6
|
plural
|
|
7
|
-
} from "./chunk-
|
|
7
|
+
} from "./chunk-XN5HNKJ2.js";
|
|
8
8
|
|
|
9
9
|
// src/import-labels.js
|
|
10
10
|
var en = {
|
|
@@ -49,6 +49,10 @@ var en = {
|
|
|
49
49
|
limitWhat: { rows: "rows", columns: "columns", fileBytes: "bytes", importCells: "values (rows x columns)", archiveEntries: "parts in its ZIP directory", unpackedBytes: "bytes unpacked" },
|
|
50
50
|
sourceLine: "{name}, only in this browser",
|
|
51
51
|
sourceSheet: "{name}, sheet \u201C{sheet}\u201D, only in this browser",
|
|
52
|
+
// a saved view made on a workbook's sheet that the workbook loaded now does not have (it loads on the sheet shown)
|
|
53
|
+
sheetMissing: "\u201C{name}\u201D was made for the sheet \u201C{sheet}\u201D, which {file} does not have.",
|
|
54
|
+
// the host refused the sheet a saved view was made on (onDataLoad): the view is not opened
|
|
55
|
+
sheetRefused: "\u201C{name}\u201D was not opened: the sheet \u201C{sheet}\u201D was not loaded.",
|
|
52
56
|
notes: {
|
|
53
57
|
ENCODING: "Read as {encoding}.",
|
|
54
58
|
SEPARATOR: "Values separated by {name}.",
|
|
@@ -111,6 +115,8 @@ var de = {
|
|
|
111
115
|
limitWhat: { rows: "Zeilen", columns: "Spalten", fileBytes: "Bytes", importCells: "Werte (Zeilen x Spalten)", archiveEntries: "Teile in ihrem ZIP-Verzeichnis", unpackedBytes: "entpackte Bytes" },
|
|
112
116
|
sourceLine: "{name}, nur in diesem Browser",
|
|
113
117
|
sourceSheet: "{name}, Blatt \u201E{sheet}\u201C, nur in diesem Browser",
|
|
118
|
+
sheetMissing: "\u201E{name}\u201C wurde f\xFCr das Blatt \u201E{sheet}\u201C gemacht, das {file} nicht hat.",
|
|
119
|
+
sheetRefused: "\u201E{name}\u201C wurde nicht ge\xF6ffnet: das Blatt \u201E{sheet}\u201C wurde nicht geladen.",
|
|
114
120
|
notes: {
|
|
115
121
|
ENCODING: "Gelesen als {encoding}.",
|
|
116
122
|
SEPARATOR: "Werte getrennt durch {name}.",
|
|
@@ -1,7 +1,7 @@
|
|
|
1
1
|
import {
|
|
2
2
|
MENU_TEXTS,
|
|
3
3
|
mergeLabels
|
|
4
|
-
} from "./chunk-
|
|
4
|
+
} from "./chunk-XN5HNKJ2.js";
|
|
5
5
|
|
|
6
6
|
// src/menu-labels.js
|
|
7
7
|
var en = {
|
|
@@ -15,9 +15,11 @@ var en = {
|
|
|
15
15
|
along: "The direction the calculation walks: Rows goes down the rows of each column, Columns across the columns of each row. A running total adds up along it, a difference compares with the item before it.",
|
|
16
16
|
showAs: "Shows each value as a share, a difference, a running total or a rank instead of the number itself. For percentages, a tip above the result says what 100% is.",
|
|
17
17
|
exportXlsx: "Every number with all its decimals, formats kept, ready to calculate with.",
|
|
18
|
-
exportCsv: "
|
|
18
|
+
exportCsv: "The table as it is shown, with its totals and its percentages, as plain text. Not the rows behind it: that is Source data, below.",
|
|
19
19
|
exportHtml: "A page with the table as it is shown, the chart when the chart is shown, and the filters: opens in any browser, prints well.",
|
|
20
20
|
exportPrint: "The same report in the browser's print dialog: print it, or pick Save as PDF there.",
|
|
21
|
+
exportDataCsv: "All the original rows behind the report, before grouping, filters and totals, with every field. For your own analysis, or to build this report again elsewhere with its view (Views \u2192 Download view). Excel set to a comma decimal: open it with Data \u2192 From Text/CSV.",
|
|
22
|
+
exportDataJson: "The same rows as JSON, for a program: numbers as numbers, text as text, a blank as null.",
|
|
21
23
|
copyTable: "The table as it is shown, headers and totals included: tab-separated, pastes into Excel or Google Sheets as columns.",
|
|
22
24
|
copyDataJson: "The table's numbers with their labels as JSON, for a program. Not the view itself: that is Views \u2192 Copy view as JSON.",
|
|
23
25
|
drillCopy: "The rows as the panel shows them, with a header row: tab-separated, pastes into Excel or Google Sheets as columns.",
|
|
@@ -199,6 +201,8 @@ var en = {
|
|
|
199
201
|
storeTooLarge: "the views would take more than {max} characters",
|
|
200
202
|
storeRefused: "this browser did not keep it (storage blocked or full)",
|
|
201
203
|
storeChanged: "the views were changed in another tab; open the menu again",
|
|
204
|
+
// next to a saved view made on a workbook's sheet, while a workbook is shown
|
|
205
|
+
viewSheet: "Sheet \u201C{sheet}\u201D",
|
|
202
206
|
// what a save, a delete or a publish in the Views menu came to; "Rejected": the host refused
|
|
203
207
|
// without saying why (a rejected promise without a message)
|
|
204
208
|
toastSaved: "View \u201C{name}\u201D saved",
|
|
@@ -312,7 +316,7 @@ var en = {
|
|
|
312
316
|
exportDownload: "Download",
|
|
313
317
|
exportCopy: "Copy",
|
|
314
318
|
exportXlsx: "Excel workbook (.xlsx)",
|
|
315
|
-
exportCsv: "CSV
|
|
319
|
+
exportCsv: "Table as CSV (.csv)",
|
|
316
320
|
exportPng: "Chart image (.png)",
|
|
317
321
|
exportSvg: "Chart image (.svg)",
|
|
318
322
|
exportHtml: "HTML report (.html)",
|
|
@@ -320,6 +324,9 @@ var en = {
|
|
|
320
324
|
exportPrint: "Print or save as PDF\u2026",
|
|
321
325
|
exportPngNeedsChart: "Switch to Chart first.",
|
|
322
326
|
exportNeedsField: "Add a field first.",
|
|
327
|
+
exportDataGroup: "Source data",
|
|
328
|
+
exportDataCsv: "All rows as CSV (.csv)",
|
|
329
|
+
exportDataJson: "All rows as JSON (.json)",
|
|
323
330
|
copyTable: "Copy table",
|
|
324
331
|
copyDataJson: "Copy data as JSON",
|
|
325
332
|
toastTableCopied: "Table copied: tab-separated, pastes into Excel or Google Sheets as columns",
|
|
@@ -0,0 +1,36 @@
|
|
|
1
|
+
// src/sheet-views.js
|
|
2
|
+
var FILE_ID = /^([^]*)#[0-9a-f]{16}$/;
|
|
3
|
+
function fileOfId(id) {
|
|
4
|
+
const m = typeof id === "string" ? FILE_ID.exec(id) : null;
|
|
5
|
+
return m ? m[1] : null;
|
|
6
|
+
}
|
|
7
|
+
function sheetOfSource(source) {
|
|
8
|
+
const sheet = source && typeof source === "object" ? (
|
|
9
|
+
/** @type {any} */
|
|
10
|
+
source.params?.sheet
|
|
11
|
+
) : void 0;
|
|
12
|
+
return typeof sheet === "string" && sheet ? sheet : null;
|
|
13
|
+
}
|
|
14
|
+
function listedFor(entry, shown) {
|
|
15
|
+
if (!entry.sourceId || !shown.id || entry.sourceId === shown.id) {
|
|
16
|
+
return true;
|
|
17
|
+
}
|
|
18
|
+
return Boolean(entry.sheet && shown.sheet && fileOfId(entry.sourceId) !== null && fileOfId(entry.sourceId) === fileOfId(shown.id));
|
|
19
|
+
}
|
|
20
|
+
function sheetPlan(view, shown) {
|
|
21
|
+
const sheet = view.sheet;
|
|
22
|
+
if (!sheet || !shown.sheet || sheet === shown.sheet) {
|
|
23
|
+
return { kind: "none" };
|
|
24
|
+
}
|
|
25
|
+
const file = fileOfId(view.id);
|
|
26
|
+
if (file === null || file !== fileOfId(shown.id)) {
|
|
27
|
+
return { kind: "none" };
|
|
28
|
+
}
|
|
29
|
+
return { kind: shown.sheets.includes(sheet) ? "switch" : "missing", sheet };
|
|
30
|
+
}
|
|
31
|
+
|
|
32
|
+
export {
|
|
33
|
+
sheetOfSource,
|
|
34
|
+
listedFor,
|
|
35
|
+
sheetPlan
|
|
36
|
+
};
|
|
@@ -1,5 +1,5 @@
|
|
|
1
1
|
// src/labels.js
|
|
2
|
-
import {
|
|
2
|
+
import { GROUPING_NAMES, PivotkitError, REPORT_LABELS } from "pivotkit-core";
|
|
3
3
|
var en = {
|
|
4
4
|
/** the language of the texts, for the report's lang attribute */
|
|
5
5
|
lang: "en",
|
|
@@ -7,28 +7,7 @@ var en = {
|
|
|
7
7
|
report: "Pivot report",
|
|
8
8
|
core: (
|
|
9
9
|
/** @type {import("pivotkit-core").Labels} */
|
|
10
|
-
|
|
11
|
-
...DEFAULT_LABELS,
|
|
12
|
-
// a yes/no field in the table, the filter list and the drill-down: words, not true/false
|
|
13
|
-
true: "Yes",
|
|
14
|
-
false: "No",
|
|
15
|
-
aggregators: {
|
|
16
|
-
count: "Count",
|
|
17
|
-
countUnique: "Distinct count",
|
|
18
|
-
listUnique: "List of distinct values",
|
|
19
|
-
sum: "Sum",
|
|
20
|
-
average: "Average",
|
|
21
|
-
median: "Median",
|
|
22
|
-
min: "Minimum",
|
|
23
|
-
max: "Maximum",
|
|
24
|
-
stdev: "Standard deviation (sample)",
|
|
25
|
-
stdevp: "Standard deviation (population)",
|
|
26
|
-
var: "Variance (sample)",
|
|
27
|
-
varp: "Variance (population)",
|
|
28
|
-
first: "First value",
|
|
29
|
-
last: "Last value"
|
|
30
|
-
}
|
|
31
|
-
}
|
|
10
|
+
REPORT_LABELS.en
|
|
32
11
|
),
|
|
33
12
|
zones: { rows: "Rows", cols: "Columns", values: "Values", filters: "Filters" },
|
|
34
13
|
zoneHints: {
|
|
@@ -124,22 +103,10 @@ var en = {
|
|
|
124
103
|
hour: "Hour of day",
|
|
125
104
|
bin: "Ranges"
|
|
126
105
|
},
|
|
127
|
-
// a date grouping's name: "Date by month"; the unit as it reads inside it (unitInName)
|
|
128
|
-
derivedName:
|
|
129
|
-
unitInName: {
|
|
130
|
-
|
|
131
|
-
yearQuarter: "quarter",
|
|
132
|
-
yearMonth: "month",
|
|
133
|
-
yearWeek: "week",
|
|
134
|
-
day: "day",
|
|
135
|
-
quarter: "quarter of year",
|
|
136
|
-
month: "month of year",
|
|
137
|
-
week: "week of year",
|
|
138
|
-
weekday: "weekday",
|
|
139
|
-
hour: "hour of day",
|
|
140
|
-
bin: "ranges"
|
|
141
|
-
},
|
|
142
|
-
binsName: "{field} (by {size})",
|
|
106
|
+
// a date grouping's name: "Date by month"; the unit as it reads inside it (unitInName); pivotkit-core's GROUPING_NAMES
|
|
107
|
+
derivedName: GROUPING_NAMES.en.name,
|
|
108
|
+
unitInName: { ...GROUPING_NAMES.en.units },
|
|
109
|
+
binsName: GROUPING_NAMES.en.bins,
|
|
143
110
|
top: "Top",
|
|
144
111
|
topBadge: "Top {count}",
|
|
145
112
|
bottomBadge: "Bottom {count}",
|
|
@@ -390,47 +357,7 @@ var de = {
|
|
|
390
357
|
report: "Pivot-Bericht",
|
|
391
358
|
core: (
|
|
392
359
|
/** @type {import("pivotkit-core").Labels} */
|
|
393
|
-
|
|
394
|
-
...DEFAULT_LABELS,
|
|
395
|
-
blank: "(Leer)",
|
|
396
|
-
total: "{label} gesamt",
|
|
397
|
-
grandTotal: "Gesamtergebnis",
|
|
398
|
-
values: "Werte",
|
|
399
|
-
valueName: "{agg} von {field}",
|
|
400
|
-
countRows: "Anzahl",
|
|
401
|
-
true: "Ja",
|
|
402
|
-
false: "Nein",
|
|
403
|
-
aggregators: {
|
|
404
|
-
count: "Anzahl",
|
|
405
|
-
countUnique: "Anzahl verschiedener Werte",
|
|
406
|
-
listUnique: "Liste verschiedener Werte",
|
|
407
|
-
sum: "Summe",
|
|
408
|
-
average: "Durchschnitt",
|
|
409
|
-
median: "Median",
|
|
410
|
-
min: "Minimum",
|
|
411
|
-
max: "Maximum",
|
|
412
|
-
stdev: "Standardabweichung (Stichprobe)",
|
|
413
|
-
stdevp: "Standardabweichung (Grundgesamtheit)",
|
|
414
|
-
var: "Varianz (Stichprobe)",
|
|
415
|
-
varp: "Varianz (Grundgesamtheit)",
|
|
416
|
-
first: "Erster Wert",
|
|
417
|
-
last: "Letzter Wert"
|
|
418
|
-
},
|
|
419
|
-
showAsName: "{showAs} von {value}",
|
|
420
|
-
showAs: {
|
|
421
|
-
percentOfGrandTotal: "% des Gesamtergebnisses",
|
|
422
|
-
percentOfRowTotal: "% der Zeilensumme",
|
|
423
|
-
percentOfColumnTotal: "% der Spaltensumme",
|
|
424
|
-
percentOfParentRow: "% der \xFCbergeordneten Zeile",
|
|
425
|
-
percentOfParentColumn: "% der \xFCbergeordneten Spalte",
|
|
426
|
-
differenceFromPrevious: "Differenz zum vorherigen",
|
|
427
|
-
percentDifferenceFromPrevious: "% Differenz zum vorherigen",
|
|
428
|
-
runningTotal: "Laufende Summe",
|
|
429
|
-
percentRunningTotal: "% laufende Summe",
|
|
430
|
-
rankAscending: "Rang (kleinster zuerst)",
|
|
431
|
-
rankDescending: "Rang (gr\xF6\xDFter zuerst)"
|
|
432
|
-
}
|
|
433
|
-
}
|
|
360
|
+
REPORT_LABELS.de
|
|
434
361
|
),
|
|
435
362
|
zones: { rows: "Zeilen", cols: "Spalten", values: "Werte", filters: "Filter" },
|
|
436
363
|
zoneHints: {
|
|
@@ -515,21 +442,9 @@ var de = {
|
|
|
515
442
|
hour: "Stunde am Tag",
|
|
516
443
|
bin: "Bereiche"
|
|
517
444
|
},
|
|
518
|
-
derivedName:
|
|
519
|
-
unitInName: {
|
|
520
|
-
|
|
521
|
-
yearQuarter: "Quartal",
|
|
522
|
-
yearMonth: "Monat",
|
|
523
|
-
yearWeek: "Woche",
|
|
524
|
-
day: "Tag",
|
|
525
|
-
quarter: "Quartal im Jahr",
|
|
526
|
-
month: "Monat im Jahr",
|
|
527
|
-
week: "Woche im Jahr",
|
|
528
|
-
weekday: "Wochentag",
|
|
529
|
-
hour: "Stunde am Tag",
|
|
530
|
-
bin: "Bereichen"
|
|
531
|
-
},
|
|
532
|
-
binsName: "{field} (je {size})",
|
|
445
|
+
derivedName: GROUPING_NAMES.de.name,
|
|
446
|
+
unitInName: { ...GROUPING_NAMES.de.units },
|
|
447
|
+
binsName: GROUPING_NAMES.de.bins,
|
|
533
448
|
top: "Oberste",
|
|
534
449
|
topBadge: "Top {count}",
|
|
535
450
|
bottomBadge: "Letzte {count}",
|
|
@@ -9,9 +9,11 @@ var de = {
|
|
|
9
9
|
along: "Die Richtung der Berechnung: Zeilen geht die Zeilen jeder Spalte hinunter, Spalten \xFCber die Spalten jeder Zeile. Eine laufende Summe addiert entlang, eine Differenz vergleicht mit dem Eintrag davor.",
|
|
10
10
|
showAs: "Zeigt jeden Wert als Anteil, Differenz, laufende Summe oder Rang statt der Zahl selbst. Bei Prozenten sagt ein Tipp \xFCber dem Ergebnis, was 100 % ist.",
|
|
11
11
|
exportXlsx: "Jede Zahl mit allen Nachkommastellen, Formate bleiben, bereit zum Rechnen.",
|
|
12
|
-
exportCsv: "
|
|
12
|
+
exportCsv: "Die Tabelle wie angezeigt, mit ihren Summen und Prozenten, als reiner Text. Nicht die Zeilen dahinter: Das sind die Quelldaten, unten.",
|
|
13
13
|
exportHtml: "Eine Seite mit der Tabelle wie angezeigt, dem Diagramm, wenn es angezeigt wird, und den Filtern: \xF6ffnet in jedem Browser, druckt gut.",
|
|
14
14
|
exportPrint: "Derselbe Bericht im Druckdialog des Browsers: drucken oder dort Als PDF speichern w\xE4hlen.",
|
|
15
|
+
exportDataCsv: "Alle urspr\xFCnglichen Zeilen hinter dem Bericht, vor Gruppierung, Filtern und Summen, mit jedem Feld. F\xFCr eigene Auswertungen oder um den Bericht mit seiner Ansicht (Ansichten \u2192 Ansicht herunterladen) anderswo neu zu erstellen. In Excel mit Dezimalkomma: \xFCber Daten \u2192 Aus Text/CSV \xF6ffnen.",
|
|
16
|
+
exportDataJson: "Dieselben Zeilen als JSON, f\xFCr ein Programm: Zahlen als Zahlen, Text als Text, ein leerer Wert als null.",
|
|
15
17
|
copyTable: "Die Tabelle wie angezeigt, mit \xDCberschriften und Summen: tabulatorgetrennt, wird in Excel oder Google Sheets in Spalten eingef\xFCgt.",
|
|
16
18
|
copyDataJson: "Die Zahlen der Tabelle mit ihren Beschriftungen als JSON, f\xFCr ein Programm. Nicht die Ansicht selbst: Das ist Ansichten \u2192 Ansicht als JSON kopieren.",
|
|
17
19
|
drillCopy: "Die Zeilen wie im Bereich angezeigt, mit einer \xDCberschriftenzeile: tabulatorgetrennt, wird in Excel oder Google Sheets in Spalten eingef\xFCgt.",
|
|
@@ -167,6 +169,7 @@ var de = {
|
|
|
167
169
|
storeTooLarge: "die Ansichten br\xE4uchten mehr als {max} Zeichen",
|
|
168
170
|
storeRefused: "dieser Browser hat sie nicht behalten (Speicher gesperrt oder voll)",
|
|
169
171
|
storeChanged: "die Ansichten wurden in einem anderen Tab ge\xE4ndert; das Men\xFC neu \xF6ffnen",
|
|
172
|
+
viewSheet: "Blatt \u201E{sheet}\u201C",
|
|
170
173
|
toastSaved: "Ansicht \u201E{name}\u201C gespeichert",
|
|
171
174
|
toastDeleted: "Ansicht \u201E{name}\u201C gel\xF6scht",
|
|
172
175
|
toastPublished: "Ansicht \u201E{name}\u201C ver\xF6ffentlicht",
|
|
@@ -273,7 +276,7 @@ var de = {
|
|
|
273
276
|
exportDownload: "Herunterladen",
|
|
274
277
|
exportCopy: "Kopieren",
|
|
275
278
|
exportXlsx: "Excel-Arbeitsmappe (.xlsx)",
|
|
276
|
-
exportCsv: "CSV
|
|
279
|
+
exportCsv: "Tabelle als CSV (.csv)",
|
|
277
280
|
exportPng: "Diagramm als Bild (.png)",
|
|
278
281
|
exportSvg: "Diagramm als Bild (.svg)",
|
|
279
282
|
exportHtml: "HTML-Bericht (.html)",
|
|
@@ -281,6 +284,9 @@ var de = {
|
|
|
281
284
|
exportPrint: "Drucken oder als PDF speichern\u2026",
|
|
282
285
|
exportPngNeedsChart: "Zuerst zum Diagramm wechseln.",
|
|
283
286
|
exportNeedsField: "Zuerst ein Feld hinzuf\xFCgen.",
|
|
287
|
+
exportDataGroup: "Quelldaten",
|
|
288
|
+
exportDataCsv: "Alle Zeilen als CSV (.csv)",
|
|
289
|
+
exportDataJson: "Alle Zeilen als JSON (.json)",
|
|
284
290
|
copyTable: "Tabelle kopieren",
|
|
285
291
|
copyDataJson: "Daten als JSON kopieren",
|
|
286
292
|
toastTableCopied: "Tabelle kopiert: tabulatorgetrennt, wird in Excel oder Google Sheets in Spalten eingef\xFCgt",
|