pivotkit-react 0.1.0 → 0.3.0
This diff represents the content of publicly available package versions that have been released to one of the supported registries. The information contained in this diff is provided for informational purposes only and reflects changes between package versions as they appear in their respective public registries.
- package/CHANGELOG.md +306 -1
- package/README.md +48 -298
- package/dist/chunks/{chunk-ILHFIV2P.js → chunk-32Z33U6S.js} +58 -78
- package/dist/chunks/chunk-7CC4JHDY.js +363 -0
- package/dist/chunks/chunk-APB4NW4O.js +434 -0
- package/dist/chunks/chunk-EM23V5GH.js +183 -0
- package/dist/chunks/{chunk-KKJO36W5.js → chunk-IOPAM4JD.js} +412 -365
- package/dist/chunks/chunk-RWYHJRQO.js +99 -0
- package/dist/chunks/unused-texts-K3VFH65P.js +10 -0
- package/dist/chunks/unused-texts-de-OW4TGIVX.js +6 -0
- package/dist/echarts.js +96 -11
- package/dist/index.js +654 -560
- package/dist/labels.js +13 -4
- package/dist/menu-texts-de.js +6 -0
- package/dist/menus.js +2905 -550
- package/dist/styles.css +738 -216
- package/package.json +2 -2
- package/types/chart-layout.d.ts +111 -0
- package/types/chart-types.d.ts +0 -91
- package/types/chip-menus.d.ts +20 -4
- package/types/dnd.d.ts +8 -4
- package/types/drill-panel.d.ts +5 -22
- package/types/drill-table.d.ts +71 -0
- package/types/drill.d.ts +0 -36
- package/types/filter-level.d.ts +16 -0
- package/types/filter.d.ts +31 -0
- package/types/help.d.ts +14 -0
- package/types/icons.d.ts +4 -0
- package/types/labels.d.ts +114 -101
- package/types/lazy-menus.d.ts +18 -6
- package/types/levels.d.ts +105 -0
- package/types/menu-fields.d.ts +80 -0
- package/types/menu-labels-de.d.ts +2 -0
- package/types/menu-labels.d.ts +270 -13
- package/types/menu-ops.d.ts +286 -0
- package/types/menu-texts.d.ts +2 -0
- package/types/menu-topics.d.ts +293 -0
- package/types/menus.d.ts +2 -2
- package/types/names.d.ts +160 -20
- package/types/overflow.d.ts +4 -1
- package/types/place.d.ts +44 -0
- package/types/popover.d.ts +10 -6
- package/types/section.d.ts +8 -28
- package/types/share-actions.d.ts +99 -0
- package/types/share.d.ts +0 -9
- package/types/table.d.ts +9 -3
- package/types/templates.d.ts +7 -1
- package/types/tips.d.ts +1 -34
- package/types/toolbar-panels.d.ts +20 -10
- package/types/unused-load.d.ts +23 -0
- package/types/unused-texts-de.d.ts +2 -0
- package/types/unused-texts.d.ts +136 -0
- package/types/unused.d.ts +22 -0
- package/types/use-view-history.d.ts +8 -4
- package/types/view-history.d.ts +23 -6
- package/types/view-ops.d.ts +80 -119
- package/types/view-save.d.ts +76 -0
- package/types/view-store.d.ts +13 -6
- package/types/zones.d.ts +5 -4
- package/dist/chunks/chunk-C32TYSHG.js +0 -441
- package/dist/chunks/chunk-XYP47DJ3.js +0 -123
package/README.md
CHANGED
|
@@ -1,15 +1,17 @@
|
|
|
1
1
|
# pivotkit-react
|
|
2
2
|
|
|
3
|
-
|
|
3
|
+
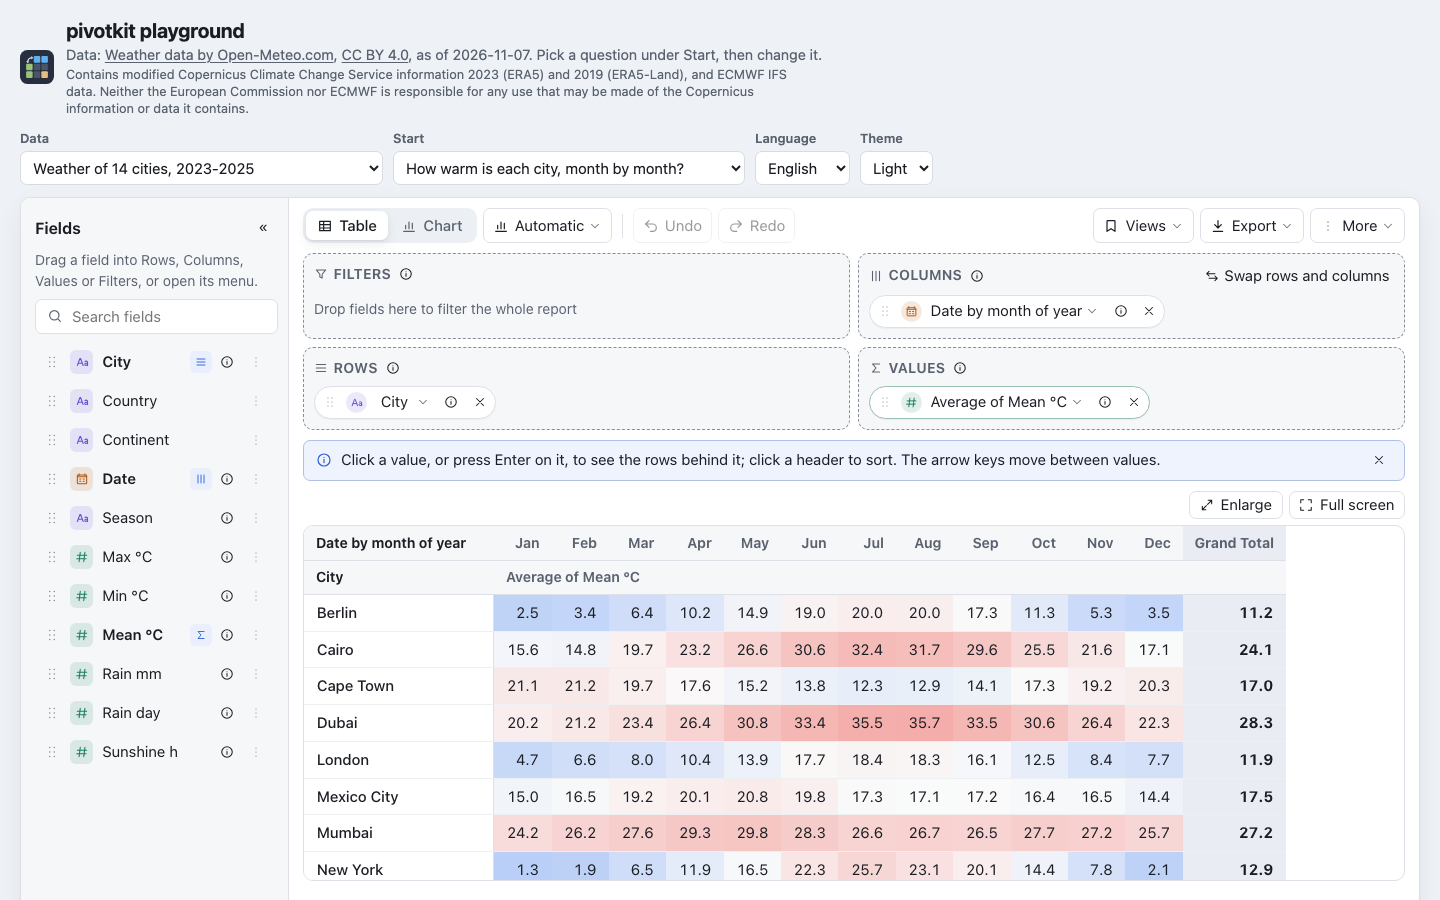
The pivot report builder of [pivotkit](https://pivotkit.eize.dev/) as a React 18/19 component,
|
|
4
|
+
`<PivotReport>`: a searchable field list, four drop zones (Rows, Columns, Values, Filters) with drag
|
|
5
|
+
and drop and a menu on every field, table and chart (Apache ECharts), filters with value counts,
|
|
6
|
+
drill-down to the rows behind a value, undo and redo, saved and shared views as JSON files, and
|
|
7
|
+
Excel, CSV and PNG export. Excel's PivotTable is the reference; the engine is
|
|
8
|
+
[pivotkit-core](https://www.npmjs.com/package/pivotkit-core).
|
|
4
9
|
|
|
5
|
-
|
|
10
|
+
|
|
6
11
|
|
|
7
|
-
|
|
8
|
-
|
|
9
|
-
(
|
|
10
|
-
saved and shared views as JSON files, and Excel, CSV and PNG export. The engine is [pivotkit-core](https://github.com/eizedev/pivotkit/tree/main/packages/pivotkit-core#readme).
|
|
11
|
-
|
|
12
|
-
Version 0.1.0. Try it in the [playground](https://pivotkit.eize.dev/demo/).
|
|
12
|
+
<sub>Weather data by [Open-Meteo.com](https://open-meteo.com/) ([CC BY 4.0](https://creativecommons.org/licenses/by/4.0/));
|
|
13
|
+
contains modified Copernicus Climate Change Service information
|
|
14
|
+
([attribution](https://pivotkit.eize.dev/learn/#query-it-live)).</sub>
|
|
13
15
|
|
|
14
16
|
## Install
|
|
15
17
|
|
|
@@ -17,25 +19,15 @@ Version 0.1.0. Try it in the [playground](https://pivotkit.eize.dev/demo/).
|
|
|
17
19
|
npm install pivotkit-react react react-dom echarts
|
|
18
20
|
```
|
|
19
21
|
|
|
20
|
-
React, ReactDOM and ECharts are peer dependencies: the host provides them, so there is one copy of
|
|
21
|
-
each in the page (PowerShell Universal provides React 18.3.1 at runtime). `pivotkit-core` (a caret
|
|
22
|
-
range on its current version) and `@dnd-kit/core` and `@dnd-kit/sortable` (pinned exactly) are
|
|
23
|
-
regular dependencies. A host that also uses pivotkit-core directly must use a version inside that
|
|
24
|
-
range: in 0.x a caret range spans patch versions only (`^0.1.0` matches 0.1.x), and npm shares
|
|
25
|
-
one copy of the core only when the ranges overlap.
|
|
26
|
-
|
|
27
22
|
| Peer | Range | Why a peer |
|
|
28
23
|
| --- | --- | --- |
|
|
29
|
-
| `react`, `react-dom` | `>=18.2 <20` | Hooks break with two copies of React in one page.
|
|
30
|
-
| `echarts` | `>=6.1.0 <7` | About 1 MB
|
|
24
|
+
| `react`, `react-dom` | `>=18.2 <20` | Hooks break with two copies of React in one page. Tested on React 18 and 19. |
|
|
25
|
+
| `echarts` | `>=6.1.0 <7` | About 1 MB, and its security updates stay with your app. Loaded on the first chart only. |
|
|
31
26
|
|
|
32
|
-
|
|
33
|
-
|
|
34
|
-
|
|
35
|
-
|
|
36
|
-
`echarts/renderers` stay bare too (named imports only). A host's bundler resolves them; a page without a bundler
|
|
37
|
-
maps each to a file with an import map (`tests/browser/pages/build.js` builds such a page, and the
|
|
38
|
-
browser tests load the package that way).
|
|
27
|
+
TypeScript declarations are included. pivotkit-core (a caret range) and @dnd-kit come with the
|
|
28
|
+
package. In 0.x a caret range spans patch
|
|
29
|
+
versions only (`^0.3.0` is 0.3.x): an app that also imports pivotkit-core itself must use a version
|
|
30
|
+
inside that range, since npm shares one copy only when the ranges overlap.
|
|
39
31
|
|
|
40
32
|
## Example
|
|
41
33
|
|
|
@@ -44,284 +36,42 @@ import { useState } from "react";
|
|
|
44
36
|
import { PivotReport } from "pivotkit-react";
|
|
45
37
|
import "pivotkit-react/styles.css";
|
|
46
38
|
|
|
47
|
-
const
|
|
48
|
-
{ name: "Tickets per team", view: { rows: ["Team"], cols: ["Priority"], values: [{ field: "Ticket", agg: "count" }] } }
|
|
49
|
-
];
|
|
50
|
-
|
|
51
|
-
export function TicketReport({ rows, saved, saveTemplate, deleteTemplate }) {
|
|
52
|
-
// controlled: the host keeps the view (and stores it); undo stays inside the report
|
|
53
|
-
const [view, setView] = useState(presets[0].view);
|
|
54
|
-
return (
|
|
55
|
-
<PivotReport
|
|
56
|
-
data={rows}
|
|
57
|
-
dataKey="tickets"
|
|
58
|
-
view={view}
|
|
59
|
-
onViewChange={setView}
|
|
60
|
-
templates={[...presets, ...saved.map((t) => ({ ...t, scope: "user", deletable: true }))]}
|
|
61
|
-
onSaveTemplate={(name, v) => saveTemplate({ name, view: v })}
|
|
62
|
-
onDeleteTemplate={(name, { scope }) => deleteTemplate(name, scope)}
|
|
63
|
-
fieldDefaults={{ "Lead hours": { agg: "average", format: "duration:h" } }}
|
|
64
|
-
onCellClick={({ row, col, count }) => console.log(row, col, count)}
|
|
65
|
-
locale="de-DE"
|
|
66
|
-
height={640}
|
|
67
|
-
/>
|
|
68
|
-
);
|
|
69
|
-
}
|
|
70
|
-
```
|
|
71
|
-
|
|
72
|
-
Without a host state, `defaultView={presets[0].view}` starts the report and it keeps the view itself.
|
|
73
|
-
The view is pivotkit-core's view object: plain JSON that is the preset, the saved view and the
|
|
74
|
-
undo step at once. It is user input and is normalized against the data; it cannot run code.
|
|
75
|
-
|
|
76
|
-
## Props
|
|
77
|
-
|
|
78
|
-
| Prop | Type | Default | What |
|
|
79
|
-
| --- | --- | --- | --- |
|
|
80
|
-
| `data` | `object[]` | | The rows; encoded once per array, or once per `dataKey`. |
|
|
81
|
-
| `dataKey` | `string \| number` | | The identity of `data`: a host that builds a new array on every render passes a key, and the rows are encoded again only when it changes. |
|
|
82
|
-
| `encoded` | `Encoded` | | Data already encoded with pivotkit-core's `encode()`, instead of `data`. |
|
|
83
|
-
| `view` | view | | Controlled: the view to show. Pass back what `onViewChange` gives; the undo history stays in the report however often the host renders. A view the host changes on its own becomes one undo step. |
|
|
84
|
-
| `defaultView` | view | empty | Uncontrolled: the start view. |
|
|
85
|
-
| `onViewChange` | `(view) => void` | | Every change, as a normalized view. |
|
|
86
|
-
| `templates` | `{ name?, view?, file?, scope?, deletable? }[]` | `[]` | The templates of the Views menu in two groups by `scope`: "Shared views" (`"shared"`) and "My views" (`"user"`); without `scope` a `deletable` entry is the user's own, every other one shared. `file`: a view file (object or text) instead of `view`, its name the default. The first three are also offered in the empty state. `deletable: true` shows a delete button for that entry; a shared one without it has an "i": "Only admins can change shared views." Names need not be unique: every entry is shown in order (a saved view may have a preset's name), and `onDeleteTemplate` gets the name. [Templates and shared views](https://pivotkit.eize.dev/concepts/templates/). |
|
|
87
|
-
| `onSaveTemplate` | `(name, view, { scope }) => unknown` | | Shows "Save current view" under My views (`scope` is `"user"`). "View “…” saved" is shown when it returns or the promise it returns resolves; an error when it throws or rejects: with the host's message when it gives one (an `Error`, a text), else "The server could not save the view." (`labels.toastSaveRejected`). It wins over `templateStore`. |
|
|
88
|
-
| `onDeleteTemplate` | `(name, { scope }) => unknown` | | Deletes a template marked `deletable` (`scope`: its group), after the user confirmed in the menu; the entry goes when it returns or its promise resolves; a failure is shown as for `onSaveTemplate` (`labels.toastDeleteRejected` without a message). |
|
|
89
|
-
| `onPublishTemplate` | `(name, view) => unknown` | | With `canPublish`: "Publish as shared view" next to each of the user's views, after a confirmation in place; the host adds it to its shared views. "View “…” published", a failure as for `onSaveTemplate`. |
|
|
90
|
-
| `canPublish` | `boolean` | `false` | The user may publish views for everyone (an admin, as the host decides). The report only shows what the host allows: the server must check who may save, publish or delete. |
|
|
91
|
-
| `templateStore` | `"browser"` | | The report keeps "My views" in `localStorage` under `pivotkit:views:<storageKey>`, per data (`source`): only this browser and device, lost when the site's data is cleared, not shared (the menu says so); at most 100 views and 500,000 characters; read after hydration. `onSaveTemplate` wins. |
|
|
92
|
-
| `fieldDefaults` | `{ [field]: { agg?, format?, drillFormat?, order?, label?, description?, href?, type? } }` | | The aggregator and the format a field gets when it is added to Values (an average for a duration, say). An aggregator that does not fit the field's type is ignored. Another aggregator picked in the value's menu keeps `format` while the result is in the field's unit (an average to a median), not for a count; a format the user chose stays the same way. In the drill-down, `drillFormat` (else `format`) formats the field's own values: `"text"` shows a numeric identifier as it is (40072, not 40,072), `"date"` a date without its time. `order` is the field's own order of items (`["Spring", "Summer", "Autumn", "Winter"]`): the field is sorted in it when it is placed on Rows or Columns (a `custom` sort in the view, so a template keeps it), and so is a field on Rows or Columns of a view or template without a sort entry for it; its menu offers "Custom order" and "Custom order, reversed", and "A to Z" stays a sort entry of its own; items not listed follow by label. `label` is the name shown for the field everywhere (chips, headers, value names, drill-down, chart, exports; views keep the field name); `description` (plain text) shows behind an "i" next to the field, in its chip menu and on its headers, with `href` (https) as "Learn more"; `type` is the column type it is read as. A field without them looks as without `fieldDefaults`. pivotkit-core's `fieldDefaultsFromSchema` builds it from a JSON Schema or OpenAPI document. |
|
|
93
|
-
| `onCellClick` | `({ row, col, value, valueIndex, text, count, rows }) => void` | | A click (or Enter) on a value or a chart point: key paths of its row and column, the value, the number of source rows and the first `drillDownLimit` of them. A blank cell with no rows behind it is not clickable. |
|
|
94
|
-
| `drillDown` | `boolean` | `true` | The panel with the rows behind a clicked value. |
|
|
95
|
-
| `drillDownLimit` | `number` | `1000` | Rows passed to the panel and to `onCellClick`; the panel's exports hold these rows and say when there are more ("1,000 of 4,212 rows"). |
|
|
96
|
-
| `locale` | `string` | `"en-US"` | Numbers, dates and sorting (a view's own `formatting.locale` wins), and the language of the labels: `de-*` picks German. |
|
|
97
|
-
| `timeZone` | `string` | `"UTC"` | The zone `data` is encoded in; see pivotkit-core. |
|
|
98
|
-
| `labels` | partial labels | | Texts merged over the language's labels, see below. |
|
|
99
|
-
| `theme` | `"auto" \| "light" \| "dark"` | `"auto"` | `auto` follows the nearest `data-theme="light\|dark"` above the report (`<html>`, or a shadow root's host), then `prefers-color-scheme`, and changes with them. |
|
|
100
|
-
| `height` | `number \| string` | `640` | The report's height, pixels or a CSS length; the table and the field list scroll inside it. With a height the report stays inside it; without one it grows past 640 px when it needs more (see Layout). |
|
|
101
|
-
| `grow` | `"on" \| "off"` | by `height` | Grow past the height to keep the result's least height: `"on"` without `height`, `"off"` with it. |
|
|
102
|
-
| `fieldList` | `"open" \| "collapsed"` | the user's choice | The field list of a wide report open or collapsed to a rail (« and the rail; remembered with the tips); with it, the user can still change it until the page is loaded again. |
|
|
103
|
-
| `limits` | `Partial<Limits>` | | pivotkit-core's limits. Data over `limits.rows`, or a layout over `limits.work`, `limits.groups`, `limits.pivotCells` or `limits.cells`, shows a message in place of the result that says what to change (`labels.tooManyRows`, `tooMuchWork`, `tooManyGroups`, `tooManyCells`, `tooLarge`). A field beyond `limits.axisFields` or `limits.values` is refused with a note (`zoneFull`); a saved view with more loads the fields that fit and says so above the result (`viewTrimmed`). |
|
|
104
|
-
| `label` | `string` | `labels.report` | The name of the report's region landmark ("Pivot report"). Several reports on one page need one name each (`label="Tickets per team"`), so a screen reader can tell them apart. |
|
|
105
|
-
| `className` | `string` | | Added to the root element `.pk-root`. |
|
|
106
|
-
| `fileName` | `string` | `"pivot"` | Name of exported files, without the extension; path separators and characters a file system refuses are replaced. |
|
|
107
|
-
| `tips` | `"on" \| "off" \| string \| string[]` | `"on"` | The tips above the result (one at a time, the most important first, each dismissible): all, none (and no switch in Options), or the tip ids allowed. The ids and when each shows are on the [documentation site](https://pivotkit.eize.dev/reference/react/#tips). |
|
|
108
|
-
| `storageKey` | `string` | | Remembers dismissed tips, the help switches and the folded or opened menu sections in `localStorage` (`pivotkit:tips:<key>`); one key per report on a page. Without it they stay dismissed until the page is loaded again. With `templateStore="browser"` the user's own views are kept under `pivotkit:views:<key>` too. |
|
|
109
|
-
| `dismissedTips` | `string[]` | | Dismissed tip ids from the host's own storage (`"*"`: all tips off; `"-explanations"`: "Show explanations" off; `"open:<section>"`, `"closed:<section>"`: a menu section opened or folded). |
|
|
110
|
-
| `onTipDismiss` | `({ id, dismissed }) => void` | | Every dismissal, "Show tips" off and on, the other help switches, "Show dismissed tips again", with the whole list to store. |
|
|
111
|
-
| `onExport` | `({ kind, fileName, blob, text, rows }) => unknown` | | Every exported file (`"xlsx"`, `"csv"`, `"png"`, or `"json"` for the [view file](https://pivotkit.eize.dev/reference/view-file/) of "Download view", `<name>.pivotkit.json`; the name with its extension, the file) before it is downloaded, and every copy before it goes on the clipboard (`"copy-table"`, `"copy-json"` from Export; `"drill-copy"`, `"drill-json"`, `"drill-csv"`, `"drill-xlsx"` from the drill-down panel; a copy has its `text` and the `fileName` it would have as a file, a drill-down export `rows: { shown, count }`); returning `false` skips the download or the copy, so the host can keep the file (upload it, say). |
|
|
112
|
-
| `fieldInfo`, `zoneInfo`, `settingInfo` | `"on" \| "off"` | | Decide the "i" of the field descriptions, of the zones and of the settings that need explaining, one kind each; without them the user's one switch "Show explanations" in Options, Help decides (on by default, remembered like the tips). Screen readers keep the field descriptions either way. |
|
|
113
|
-
| `chartOptions` | `object` | | Plain JSON merged over the chart's ECharts option; it wins over the view's chart settings. Functions, values that are not JSON, and options that are markup or addresses (a string `formatter`, `rich`, `link`, `image`) are left out with a warning. [Charts](https://pivotkit.eize.dev/concepts/charts/#chartoptions-for-developers). |
|
|
114
|
-
| `source` | `{ id, name? }` | | The data the report shows: it goes into the view files and links the report shares, and a view made for another `id` asks before it is loaded. [Sharing](https://pivotkit.eize.dev/concepts/sharing/#the-source-of-a-view-for-developers). |
|
|
115
|
-
| `sources` | `{ id, name? }[]` | | The other data the host can show: a view made for one of them offers "Switch to “name” and load". |
|
|
116
|
-
| `onSourceSwitch` | `({ source, view, name }) => void` | | The user chose to switch to that data: show it with `view` (as the file has it) as its start view. |
|
|
117
|
-
| `shareLink` | `boolean \| string` | off | "Copy link" in Views and opening shared links: `true` for the page's address without its query, a string as the base URL. The view is in the fragment, `#pivot=` or `#pivot-<storageKey>=`. [Sharing](https://pivotkit.eize.dev/concepts/sharing/). |
|
|
118
|
-
| `persistView` | `"session"` | | Keeps the view for the tab (`sessionStorage`, per `storageKey`); a reload shows it again. |
|
|
119
|
-
| `loading` | `boolean` | `false` | The host is loading data: the skeleton before the first data, the result covered on later loads. |
|
|
120
|
-
|
|
121
|
-
Exports: `PivotReport` and the types `PivotReportProps`, `CellClick`,
|
|
122
|
-
`ExportFile`, `Template`, `TemplateScope`, `FieldDefaults`, `TipDismiss`, `ViewSource`, `SourceSwitch`, `View`, `ViewInput` (a view as a host passes it), `UiLabels` and
|
|
123
|
-
`PartialLabels`. The stylesheet is `pivotkit-react/styles.css`. `pivotkit-react/labels` exports
|
|
124
|
-
`LABELS` (`{ en, de }`, every text), a subpath of its own: the menus' texts load with the menus, so
|
|
125
|
-
the report's first load stays small.
|
|
39
|
+
const start = { rows: ["Team"], cols: ["Priority"], values: [{ field: "Ticket", agg: "count" }] };
|
|
126
40
|
|
|
127
|
-
|
|
128
|
-
|
|
129
|
-
|
|
130
|
-
|
|
131
|
-
Rows; a field in Columns or Filters moves to Rows, one in Rows stays and the status line says
|
|
132
|
-
so, and the field's description says which); or use its menu "Add to Rows / Columns / Values / Filters". A date is grouped as soon as it
|
|
133
|
-
is placed, by the span of its values: up to 62 days by day, up to two years by month ("Jan 2025"),
|
|
134
|
-
up to six years by quarter, longer by year; the chip says so ("Created by month").
|
|
135
|
-
- Chips: drag to reorder or to another zone, drag back to the field list or press x to remove (a note
|
|
136
|
-
under the table offers Undo). A chip shows what is set on it: "3 of 4" for a filter, "Top 5", the
|
|
137
|
-
sort, a value condition ("Sum of Revenue > 1,000"). The menu of a row or column field has sort (by
|
|
138
|
-
label, largest or smallest first by any value that gives a number, and the custom order of the view
|
|
139
|
-
or of `fieldDefaults`), date grouping (along the time line: year, quarter, month, week, day; or
|
|
140
|
-
across years: quarter, month, week of the year, weekday, hour), number ranges (their size and where
|
|
141
|
-
they start, Excel's "Starting at"; a new size keeps the start, an empty start is 0, a start too far
|
|
142
|
-
from the field's numbers is refused with a note), top or bottom N by a chosen value, filter with a
|
|
143
|
-
value condition ("Value filter…"), and move. The menu of a value has the aggregator (sum,
|
|
144
|
-
count, average, minimum, maximum; the statistics under "More statistics"), "show as" (the header
|
|
145
|
-
then says it: "% of grand total of Revenue"), the number format (the rarer ones under "More
|
|
146
|
-
formats"), highlighting (colour scale, data bars), its name, and move; Remove stays at the foot of
|
|
147
|
-
every menu. Menus keep the wheel to themselves (the page behind never scrolls), fold their sections
|
|
148
|
-
(the frequent ones open, the choice remembered like the tips) and explain a setting with an "i" next
|
|
149
|
-
to it (totals, Show as, Along, the export formats, the chart's labels), which Options, Help, "Show
|
|
150
|
-
explanations" hides. An entry that would change nothing is disabled with a short reason under it
|
|
151
|
-
(a subtotal that needs two fields on its axis, the chart image without the chart).
|
|
152
|
-
- Filters: values with row counts, search, select all or none, "only this value", a text condition
|
|
153
|
-
(contains, begins with, ...). A field in the Filters zone filters the whole report.
|
|
154
|
-
- Tips above the result say what a top N does to totals and percentages ("Country shows the top 5
|
|
155
|
-
only: ..."), what 100 % is for a percentage, that a text field in Values is counted, what to do
|
|
156
|
-
when a filter leaves nothing, nothing is in Values or a date makes a column per day, and how to open
|
|
157
|
-
a value, and for charts: lines over dates, bars for a pie of many slices; one at a time, each with an x, switched off or back in Options, which also lists
|
|
158
|
-
the keyboard shortcuts.
|
|
159
|
-
- Field descriptions (`fieldDefaults`): an "i" next to a described field in the list and on its chips
|
|
160
|
-
shows the description on hover, focus or tap, with "Learn more"; the chip menu and the headers show
|
|
161
|
-
it too, and the field search finds it.
|
|
162
|
-
- Drill-down: a click on a value opens a panel with the rows behind it (a blank cell with no rows
|
|
163
|
-
behind it opens nothing; the arrow keys still stop on it), formatted as the table
|
|
164
|
-
formats them: dates as dates (with the time when the column has times), numbers in the locale,
|
|
165
|
-
yes/no fields as "Yes" and "No" (`labels.core.true`, `false`), and a field's `fieldDefaults` format.
|
|
166
|
-
- Table: sticky header and row labels, groups expand and collapse, subtotals and grand totals on and
|
|
167
|
-
off (Options), a click on a value opens its rows. Field names and value names in the header can be
|
|
168
|
-
dragged into a zone with the mouse; the chips' menus do the same from the keyboard. One value's name
|
|
169
|
-
is a single header over all of its columns, as in Excel. From 300 body rows on only the visible rows
|
|
170
|
-
are rendered. The table is as wide as its columns; the row label columns share at most 40 % of the
|
|
171
|
-
report's main area (each at least 5.5em, so a common word never breaks) and a value's name wraps beyond 30 %, so a long label wraps between words
|
|
172
|
-
and a phone still shows values next to it (from 300 rows on, where rows have one height, it is cut with an ellipsis: its full text is
|
|
173
|
-
the cell's title, and the status line shows the whole row label of a tapped label or of the focused value).
|
|
174
|
-
- Chart: automatic until a type is picked (lines over dates, also dates on Columns, swapped for the
|
|
175
|
-
chart alone; else bars), bars, stacked bars, horizontal bars, lines, area, pie, donut, heatmap (the
|
|
176
|
-
type next to Table and Chart in the toolbar), a pie's or a donut's labels outside or inside the slices; a click on a bar, a point or a heatmap cell opens its rows. At most 50 categories are
|
|
177
|
-
drawn, with a note; more than 8 series, or lines with the dates on Columns, get a hint with "Swap
|
|
178
|
-
rows and columns" (also above the Columns zone). The tooltip is built as DOM nodes with the data's
|
|
179
|
-
texts as text and its styles set through the CSSOM, so a Content-Security-Policy without
|
|
180
|
-
`style-src 'unsafe-inline'` allows it.
|
|
181
|
-
- Toolbar: Table or Chart, the chart type, Undo (Ctrl/Cmd+Z), Redo (Ctrl/Cmd+Shift+Z or Ctrl+Y),
|
|
182
|
-
Reset to the start view, Layout (a toggle with `aria-pressed`: the zones open or folded into one
|
|
183
|
-
line), Options, Views (Shared views, My views with save, delete and publish, and Share: link, JSON, the
|
|
184
|
-
[view file](https://pivotkit.eize.dev/reference/view-file/), load one; a view made for other data
|
|
185
|
-
asks first), Export (XLSX and CSV of the table, PNG of the chart). Every button has its text; when
|
|
186
|
-
the report is too narrow, Reset, Redo, Layout, Views, Options and the chart type move one by one
|
|
187
|
-
into a "More" menu, by the width only.
|
|
188
|
-
- Result: Enlarge (the result fills the report; Escape or the button restores) and Full screen (the
|
|
189
|
-
Fullscreen API, where the browser has it) at its top right.
|
|
190
|
-
- Notes ("Undone: Region removed", "Exported pivot.xlsx") appear in the status line under the table,
|
|
191
|
-
stay while the pointer or the focus is on them, and errors stay until closed. A loaded view says so
|
|
192
|
-
with Undo; what it left out stays above the result until dismissed. Adding a field shows none: the
|
|
193
|
-
chip is the feedback.
|
|
194
|
-
- Keyboard and screen readers: every control is a button or input of at least 24 x 24 px; menus move
|
|
195
|
-
with the arrow keys and close with Tab or Escape (also when the focus is elsewhere on the page); the
|
|
196
|
-
drill-down, the narrow field drawer and bottom sheets keep the focus inside and give it back. A chip
|
|
197
|
-
or field handle picks it up with Space; Left and Right move it within a zone, Up and Down to the zone
|
|
198
|
-
above or below, with its position announced ("Region is over Rows, position 2 of 3"); Space drops,
|
|
199
|
-
Escape cancels. The table's values move with the arrow keys and open with Enter, an empty one included
|
|
200
|
-
(a screen reader hears "No rows" or "No value", `labels.emptyCell`, `labels.emptyValue`); the table has a
|
|
201
|
-
name and a described hint. The chart canvas has a text alternative (type, values, counts, highest
|
|
202
|
-
and lowest value). The report's `lang` follows its labels. The report is a region landmark named
|
|
203
|
-
by `labels.report` ("Pivot report"), not a `<main>`, so it fits inside the host page's own main
|
|
204
|
-
landmark.
|
|
205
|
-
|
|
206
|
-
For hosts: while a popover, the drill-down or the narrow field drawer of the report is open, the
|
|
207
|
-
report listens for Escape on the whole document and closes its newest layer, also when the focus is
|
|
208
|
-
outside the report; it calls `preventDefault()` on that Escape and leaves one alone that is
|
|
209
|
-
`defaultPrevented` already. A host dialog opened over an open report layer handles Escape in its own
|
|
210
|
-
listener and calls `preventDefault()`, or closes the report's layer first.
|
|
211
|
-
|
|
212
|
-
## Layout
|
|
213
|
-
|
|
214
|
-
The report adapts to its own width, not the window's: wide (1024 px and more) has the field list on
|
|
215
|
-
the left and the zones in a 2 x 2 grid; medium narrows the field list; narrow (below 640 px) opens the
|
|
216
|
-
field list as a drawer from the toolbar and shows menus as bottom sheets. The zones stack, one line
|
|
217
|
-
each, whenever the area next to the field list is narrower than 640 px (a container query on that
|
|
218
|
-
area: the narrow layout, and a medium one such as a half-width card of 650 px). "Swap rows and
|
|
219
|
-
columns" shows its icon only, with its name for screen readers and as a tooltip, when the head of the
|
|
220
|
-
Columns zone is too narrow for the text. Only the table scrolls sideways.
|
|
221
|
-
|
|
222
|
-
Below 600 px of height (`COMPACT_HEIGHT` in `PivotReport.jsx`), 820 px in the narrow layout
|
|
223
|
-
(`COMPACT_HEIGHT_NARROW`), measured on the border box before the first paint, the report starts in
|
|
224
|
-
the compact layout: the zones fold into one line that says what is in them ("Rows: Team · Columns:
|
|
225
|
-
Priority · Values: Count of Ticket"), so the table keeps its room, and at most one tip shows. A click
|
|
226
|
-
on that line, or Layout, opens them; Layout folds them again and keeps its text and its place. The
|
|
227
|
-
user's choice is state of the mounted report, not part of the view. The result keeps a least height
|
|
228
|
-
(240 px, 280 px narrow): without a `height` the report grows past its 640 px when it needs more and the
|
|
229
|
-
page scrolls; with a `height` (pixels or a CSS length, `"100%"`, `"calc(100svh - 24px)"`) it stays
|
|
230
|
-
inside it and the table scrolls; `grow` decides it either way. `dist/menus.js` and `dist/chunks/` load
|
|
231
|
-
by relative dynamic import: a host that copies files by hand deploys the whole `dist/` folder. Details: [Layout](https://pivotkit.eize.dev/reference/react/#layout).
|
|
232
|
-
|
|
233
|
-
## Theming
|
|
234
|
-
|
|
235
|
-
Every colour, size and duration is a CSS custom property on `.pk-root`. The defaults have zero
|
|
236
|
-
specificity (`:where()`), so a plain rule on `.pk-root` or on your `className` overrides them. Light
|
|
237
|
-
and dark are selected with `data-pk-theme` on the root, which the `theme` prop sets.
|
|
238
|
-
|
|
239
|
-
```css
|
|
240
|
-
/* a host mapping its own theme, for example PowerShell Universal */
|
|
241
|
-
.pk-root {
|
|
242
|
-
--pk-accent: var(--host-primary);
|
|
243
|
-
--pk-radius: 4px;
|
|
244
|
-
}
|
|
245
|
-
html[data-theme="dark"] .pk-root {
|
|
246
|
-
--pk-surface: #101418;
|
|
247
|
-
--pk-text: #e6e6e6;
|
|
41
|
+
export function TicketReport({ rows }) {
|
|
42
|
+
// controlled: the app keeps the view (and stores it); undo stays inside the report
|
|
43
|
+
const [view, setView] = useState(start);
|
|
44
|
+
return <PivotReport data={rows} dataKey="tickets" view={view} onViewChange={setView} locale="de-DE" height={640} />;
|
|
248
45
|
}
|
|
249
46
|
```
|
|
250
47
|
|
|
251
|
-
|
|
252
|
-
|
|
253
|
-
|
|
254
|
-
|
|
255
|
-
|
|
256
|
-
|
|
257
|
-
|
|
|
258
|
-
|
|
|
259
|
-
|
|
|
260
|
-
|
|
|
261
|
-
|
|
|
262
|
-
|
|
|
263
|
-
|
|
|
264
|
-
|
|
|
265
|
-
|
|
|
266
|
-
|
|
|
267
|
-
|
|
|
268
|
-
| `--pk
|
|
269
|
-
|
|
|
270
|
-
|
|
|
271
|
-
|
|
|
272
|
-
|
|
|
273
|
-
|
|
|
274
|
-
|
|
275
|
-
|
|
276
|
-
|
|
277
|
-
|
|
278
|
-
## Labels
|
|
279
|
-
|
|
280
|
-
`locale` picks English or German; `labels` overrides single texts (merged deeply; an entry of the
|
|
281
|
-
wrong type is ignored). `labels.core` holds the texts pivotkit-core writes into the table and the
|
|
282
|
-
chart. Another language is a whole labels object with its own `lang` (the report's `lang`
|
|
283
|
-
attribute), passed as `labels`; there is no registry of languages.
|
|
284
|
-
|
|
285
|
-
```jsx
|
|
286
|
-
<PivotReport data={rows} locale="de-DE" labels={{ zones: { values: "Kennzahlen" }, core: { grandTotal: "Summe" } }} />
|
|
287
|
-
```
|
|
288
|
-
|
|
289
|
-
All keys are in `LABELS.en` (`import { LABELS } from "pivotkit-react/labels"`; `src/labels.js` and `src/menu-labels.js`); `{name}` placeholders are filled in. A count (`rowsCount`,
|
|
290
|
-
`drillCount`, `chartCategories`, `chartSeries`) is an object with one text per plural category of
|
|
291
|
-
the language, picked with `Intl.PluralRules` for the labels' `lang`:
|
|
292
|
-
`{ one: "{count} row", other: "{count} rows" }`; a language with more forms adds them (`few`,
|
|
293
|
-
`many`), a missing form falls back to `other`.
|
|
294
|
-
|
|
295
|
-
## Performance
|
|
296
|
-
|
|
297
|
-
The pivot is computed once per view and the table body is virtualized. Approximate numbers, measured
|
|
298
|
-
by hand in the playground on one Mac (Chromium, Firefox and WebKit from Playwright 1.64.1 on
|
|
299
|
-
darwin/arm64); no test backs them and other machines differ, in ms:
|
|
300
|
-
|
|
301
|
-
| Rows | `encode` (once) | `computePivot` | `toGrid` | Change to next frame |
|
|
302
|
-
| ---: | ---: | ---: | ---: | ---: |
|
|
303
|
-
| 2,000 | 4-7 | 1-4 | 0-3 | 11-34 |
|
|
304
|
-
| 4,000 | 6-8 | 2-3 | 0-2 | 10-37 |
|
|
305
|
-
| 100,000 | 93-117 | 8-31 | 0-18 | 18-64 |
|
|
306
|
-
| 100,000, 100,000 distinct row labels | 114 | 72 | 29 | 112 |
|
|
307
|
-
|
|
308
|
-
A change stays within a frame or two, so the engine runs on the main thread; a Web Worker would add
|
|
309
|
-
copying the columns and the grid between threads for no visible gain. The timings are in the
|
|
310
|
-
browser's performance timeline as `pivotkit:encode`, `pivotkit:computePivot` and `pivotkit:toGrid`.
|
|
311
|
-
|
|
312
|
-
## Development
|
|
313
|
-
|
|
314
|
-
```bash
|
|
315
|
-
npm run build -w pivotkit-react # dist/index.js and dist/styles.css (esbuild)
|
|
316
|
-
npm test -w pivotkit-react # build, then node --test: view changes, history, keyboard moves, labels, chart text, files, server render, contrast
|
|
317
|
-
npm run coverage -w pivotkit-react # the same with coverage of the .js modules (the .jsx components are covered by the browser tests, without a number)
|
|
318
|
-
npm run playground # the playground with rebuilds on http://localhost:5173
|
|
319
|
-
npm run test:browser # Playwright in Chromium, Firefox and WebKit: the playground, a host page with React from an import map, a shadow root
|
|
320
|
-
PIVOTKIT_REACT=19 npm run test:browser # the same on React 19, after npm ci --prefix tests/react19
|
|
321
|
-
```
|
|
322
|
-
|
|
323
|
-
The build compiles JSX to `React.createElement`, so the host needs `react` and `react-dom` only (no
|
|
324
|
-
JSX runtime), and keeps every dependency as an import for the host's bundler.
|
|
48
|
+
Without app state, `defaultView={start}` starts the report and it keeps the view itself. The view is
|
|
49
|
+
plain JSON: the preset, the saved view and the undo step at once. It is user input, checked against
|
|
50
|
+
the data; it cannot run code.
|
|
51
|
+
|
|
52
|
+
## Where in the docs
|
|
53
|
+
|
|
54
|
+
| Topic | Page |
|
|
55
|
+
| --- | --- |
|
|
56
|
+
| Getting started: install, first report, saved views, clicks | [Getting started with React](https://pivotkit.eize.dev/getting-started/react/) |
|
|
57
|
+
| Bundlers, import maps, PowerShell Universal | [Bundlers and import maps](https://pivotkit.eize.dev/getting-started/react/#bundlers-and-import-maps), [PowerShell Universal](https://pivotkit.eize.dev/getting-started/react/#powershell-universal) |
|
|
58
|
+
| Every prop | [Props](https://pivotkit.eize.dev/reference/react/#props), [props in detail](https://pivotkit.eize.dev/reference/react/#props-in-detail) |
|
|
59
|
+
| Controlled and uncontrolled | [Controlled and uncontrolled](https://pivotkit.eize.dev/reference/react/#controlled-and-uncontrolled) |
|
|
60
|
+
| Tips, layout, menus | [Tips](https://pivotkit.eize.dev/reference/react/#tips), [Layout](https://pivotkit.eize.dev/reference/react/#layout), [Menus](https://pivotkit.eize.dev/reference/react/#menus), [files the package loads](https://pivotkit.eize.dev/reference/react/#files-the-package-loads) |
|
|
61
|
+
| The view | [Views and saved views](https://pivotkit.eize.dev/concepts/views/) |
|
|
62
|
+
| Saved and shared views, links | [Templates and shared views](https://pivotkit.eize.dev/concepts/templates/), [Sharing](https://pivotkit.eize.dev/concepts/sharing/), [View file format](https://pivotkit.eize.dev/reference/view-file/) |
|
|
63
|
+
| Field names, descriptions, defaults | [Field descriptions and names](https://pivotkit.eize.dev/concepts/fields/) |
|
|
64
|
+
| Charts and `chartOptions` | [Charts](https://pivotkit.eize.dev/concepts/charts/#chartoptions-for-developers) |
|
|
65
|
+
| Theming: the `--pk-*` tokens | [Theming](https://pivotkit.eize.dev/reference/theming/) |
|
|
66
|
+
| Languages and labels | [Localisation](https://pivotkit.eize.dev/reference/localisation/) |
|
|
67
|
+
| Limits | [Locale, time zones, limits and errors](https://pivotkit.eize.dev/concepts/limits/#limits) |
|
|
68
|
+
| Performance | [Performance](https://pivotkit.eize.dev/reference/react/#performance) |
|
|
69
|
+
| Security | [Security](https://pivotkit.eize.dev/security/) |
|
|
70
|
+
| Browser support | [Browser support](https://pivotkit.eize.dev/browser-support/) |
|
|
71
|
+
| Recipes | [Recipes](https://pivotkit.eize.dev/embed/recipes/) |
|
|
72
|
+
| What the people using the report can do | [Use a report](https://pivotkit.eize.dev/use/), [Keyboard and screen readers](https://pivotkit.eize.dev/use/keyboard/) |
|
|
73
|
+
| Try it | [Live demo](https://pivotkit.eize.dev/demo/), [feature list](https://pivotkit.eize.dev/features/), [FAQ](https://pivotkit.eize.dev/faq/) |
|
|
74
|
+
| Changes | [CHANGELOG](https://github.com/eizedev/pivotkit/blob/main/packages/pivotkit-react/CHANGELOG.md) |
|
|
325
75
|
|
|
326
76
|
## License
|
|
327
77
|
|