orgchart 5.0.0 → 7.0.0
This diff represents the content of publicly available package versions that have been released to one of the supported registries. The information contained in this diff is provided for informational purposes only and reflects changes between package versions as they appear in their respective public registries.
- package/.github/workflows/publish.yml +35 -0
- package/README.md +214 -123
- package/README.zh-cn.md +232 -100
- package/README.zh-tw.md +232 -100
- package/bower.json +6 -9
- package/demo/10000-nodes.html +139 -0
- package/demo/ajax-datasource.html +46 -45
- package/demo/bottom2top.html +12 -9
- package/demo/center-on-selected-node.html +21 -17
- package/demo/color-coded.html +12 -9
- package/demo/css/style.css +28 -0
- package/demo/custom-icons.html +12 -9
- package/demo/custom-template.html +12 -9
- package/demo/data-prop-compact.html +11 -8
- package/demo/data-prop-hybrid.html +79 -50
- package/demo/default-collapsed.html +12 -9
- package/demo/drag-drop-hybrid-chart.html +17 -14
- package/demo/drag-drop.html +21 -16
- package/demo/edit-chart.html +144 -94
- package/demo/edit-hybrid-chart.html +177 -135
- package/demo/expand-to-given-depth.html +30 -22
- package/demo/export-chart-pdf.html +12 -9
- package/demo/export-chart-with-pictures.html +19 -12
- package/demo/export-chart.html +12 -9
- package/demo/family-tree.html +14 -11
- package/demo/familytree-custom-properties.html +108 -0
- package/demo/filter-node.html +104 -57
- package/demo/get-hierarchy.html +17 -12
- package/demo/get-related-nodes.html +27 -17
- package/demo/index.html +10 -3
- package/demo/integrate-map.html +32 -27
- package/demo/left2right.html +12 -9
- package/demo/level-offset.html +16 -15
- package/demo/link-node.html +12 -9
- package/demo/local-datasource.html +11 -8
- package/demo/minimap.html +224 -0
- package/demo/nodes-of-different-widths.html +11 -8
- package/demo/ondemand-loading-data.html +166 -112
- package/demo/option-createNode.html +28 -17
- package/demo/options-compact-drag.html +82 -0
- package/demo/options-export-navigation.html +76 -0
- package/demo/options-horizontal-template.html +80 -0
- package/demo/options-hybrid-navigation.html +71 -0
- package/demo/pan-zoom.html +20 -11
- package/demo/reload-data.html +17 -14
- package/demo/report-path.html +59 -29
- package/demo/responsive-design.html +14 -11
- package/demo/right2left.html +12 -9
- package/demo/toggle-sibs-resp.html +12 -9
- package/demo/ul-datasource.html +11 -8
- package/demo/vertical-level.html +12 -9
- package/dist/css/{jquery.orgchart.css → orgchart.css} +154 -80
- package/dist/css/orgchart.min.css +1 -0
- package/dist/js/orgchart.js +4474 -0
- package/dist/js/orgchart.min.js +2 -0
- package/dist/js/orgchart.min.js.map +1 -0
- package/gulpfile.js +42 -27
- package/package.json +33 -32
- package/src/css/{jquery.orgchart.css → orgchart.css} +154 -80
- package/src/js/orgchart.js +4474 -0
- package/test/compatibility/README.md +123 -0
- package/test/compatibility/browser.tests.js +1279 -0
- package/test/compatibility/options.tests.js +628 -0
- package/test/cypress/e2e/demo-interactions.cy.js +91 -0
- package/test/cypress/e2e/demo-rendering.cy.js +161 -0
- package/test/cypress/e2e/drag-drop-hybrid-chart.cy.js +23 -0
- package/test/cypress/e2e/edit-chart.cy.js +20 -0
- package/test/cypress/e2e/level-offset.cy.js +21 -0
- package/test/cypress/e2e/local-datasource.cy.js +16 -16
- package/test/cypress/e2e/minimap.cy.js +66 -0
- package/test/cypress/e2e/ondemand-loading-data.cy.js +34 -10
- package/test/cypress/e2e/pan-zoom.cy.js +165 -0
- package/test/cypress/e2e/report-path.cy.js +20 -0
- package/test/cypress/e2e/toggle-sibs-resp.cy.js +4 -4
- package/test/cypress/e2e/vertical-vevel.cy.js +7 -5
- package/test/e2e/local-datasource/test.js +1 -1
- package/test/integration/init-tests.js +192 -99
- package/test/integration/tests.js +1043 -57
- package/test/unit/lifecycle-builders-export.tests.js +1487 -0
- package/test/unit/minimap.tests.js +210 -0
- package/test/unit/tests.js +2372 -253
- package/dist/css/jquery.orgchart.min.css +0 -1
- package/dist/js/jquery.orgchart.js +0 -1741
- package/dist/js/jquery.orgchart.min.js +0 -5
- package/dist/js/jquery.orgchart.min.js.map +0 -1
- package/src/js/jquery.orgchart.js +0 -1741
package/README.md
CHANGED
|
@@ -1,4 +1,4 @@
|
|
|
1
|
-

|
|
2
2
|
|
|
3
3
|
# [简体文档](https://github.com/dabeng/OrgChart/blob/master/README.zh-cn.md), [繁體文档](https://github.com/dabeng/OrgChart/blob/master/README.zh-tw.md)
|
|
4
4
|
|
|
@@ -13,6 +13,8 @@ First of all, thanks a lot for [wesnolte](https://github.com/wesnolte)'s great w
|
|
|
13
13
|
Unfortunately, it's long time not to see the update of jOrgChart. on the other hand, I got some interesting ideas to add, so I choose to create a new repo.
|
|
14
14
|
- Since version 3.0, we use nested ul to construct tree-like chart instead of nested table.
|
|
15
15
|
- Since version 4.0, users build up the ajax datasoure by themselves.
|
|
16
|
+
- Since version 5.0, users are allowed to build up the family tree.
|
|
17
|
+
- Since version 6.0, The orgchart component has been reverted to native implementation and no longer relies on jQuery.
|
|
16
18
|
|
|
17
19
|
## Features
|
|
18
20
|
- Supports both local data and remote data (JSON).
|
|
@@ -32,7 +34,7 @@ Users could find the related CDN support for OrgChart's CSS and JavaScript.
|
|
|
32
34
|
[](https://cdnjs.com/libraries/orgchart) https://cdnjs.com/libraries/orgchart
|
|
33
35
|
|
|
34
36
|
## Installation
|
|
35
|
-
Of course, you can directly use the standalone build by including dist/js/
|
|
37
|
+
Of course, you can directly use the standalone build by including dist/js/orgchart.js and dist/css/orgchart.css in your webapps.
|
|
36
38
|
### Install with Bower
|
|
37
39
|
```
|
|
38
40
|
# From version 1.0.2 on, users can install orgchart and add it to bower.json dependencies
|
|
@@ -44,13 +46,19 @@ $ bower install orgchart
|
|
|
44
46
|
# From version 1.0.4 on, users can install orgchart with npm
|
|
45
47
|
$ npm install orgchart
|
|
46
48
|
```
|
|
47
|
-
require('orgchart')
|
|
49
|
+
In CommonJS environments, `require('orgchart')` exports the `OrgChart` constructor directly.
|
|
50
|
+
|
|
51
|
+
FYI, [How to use jQuery Orchart in React](https://stackblitz.com/edit/vitejs-vite-hqv4nbdt)
|
|
48
52
|
|
|
49
53
|
## [Demos on github pages](https://dabeng.github.io/OrgChart/)
|
|
50
54
|
## [Demos based on nested ul](https://codepen.io/collection/xKmPeK)
|
|
51
55
|
## [Demos based on nested table](https://codepen.io/collection/AWxGVb/) (obsolete)
|
|
52
56
|
|
|
53
57
|
### online demos
|
|
58
|
+
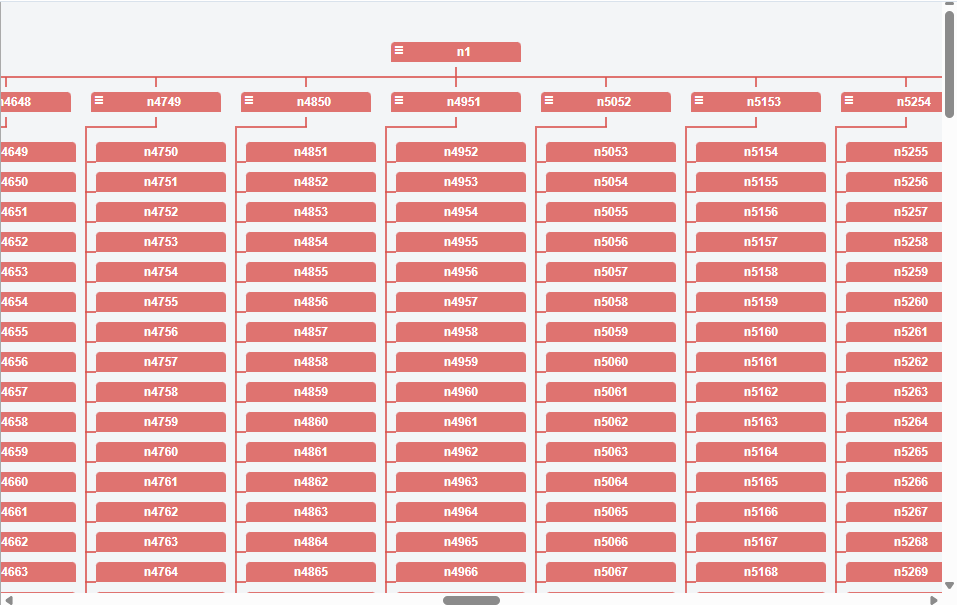
- [I want to render 10,000 nodes within 500 milliseconds](https://dabeng.github.io/OrgChart/10000-nodes.html)
|
|
59
|
+
|
|
60
|
+
|
|
61
|
+
|
|
54
62
|
- [using ul datasource](https://dabeng.github.io/OrgChart/ul-datasource.html)(this feature comes from [Tobyee's good idea :blush:](https://github.com/dabeng/OrgChart/issues/1))
|
|
55
63
|
|
|
56
64
|
- [using local datasource](https://dabeng.github.io/OrgChart/local-datasource.html)
|
|
@@ -75,7 +83,7 @@ require('orgchart') will load orgchart plugin onto the jQuery object. The orgcha
|
|
|
75
83
|
|
|
76
84
|

|
|
77
85
|
|
|
78
|
-
**Note:**
|
|
86
|
+
**Note:** the library manages expand/collapse controls only for loaded nodes. The demo creates separate request buttons and handles loading through application code; no relationship metadata or loading callback option is required.
|
|
79
87
|
|
|
80
88
|
- [I wanna customize the structure of node](https://dabeng.github.io/OrgChart/option-createNode.html)
|
|
81
89
|
|
|
@@ -125,7 +133,7 @@ This feature is inspired by the issues([Aligning Children Vertical](https://gith
|
|
|
125
133
|
|
|
126
134
|
From now on, users never have to worry about how to align a huge of nodes in one screen of browser. The option "verticalLevel" allows users to align child nodes vertically from the given level.
|
|
127
135
|
|
|
128
|
-
|
|
136
|
+
When combined with `compact`, `verticalLevel` determines the layout from its configured level onward. Direction, depth limits and drag/drop continue to use the actual node hierarchy.
|
|
129
137
|
|
|
130
138
|
- [I want to collapse some nodes by default](https://dabeng.github.io/OrgChart/default-collapsed.html)
|
|
131
139
|
|
|
@@ -165,40 +173,44 @@ You need the solution based on new datasource structure with **levelOffset data
|
|
|
165
173
|
|
|
166
174
|
**compact data property** is designed for your use case. Once node data includes a "compact" prop with truthy value, itself and its descendant nodes will be arranged with compact mode.
|
|
167
175
|
|
|
176
|
+
Compact layouts support `draggable`, `visibleLevel`, direction, pan, zoom and minimap together. Use `compact: true` to compact every branch, or a callback to select dense branches. `drag` is an alias for `draggable`; when both are supplied, `draggable` takes precedence. Compact drag/drop and node editing may rebuild the chart, so reacquire rendered node elements afterward.
|
|
177
|
+
|
|
178
|
+
Grouped family sources use the configured `nodeId` for every member and the same one-based depth as JSON and UL sources. Compact family children are arranged as household grids. Drag/drop and editing modify the selected member and its descendants, not its surrounding household; family mutations may rebuild rendered nodes. `getHierarchy()` preserves grouped family arrays, and related-node queries include all members with the same chart parent.
|
|
179
|
+
|
|
168
180
|
- [ I want to visualize genealogy/pedigree/family tree information](https://dabeng.github.io/OrgChart/family-tree.html)
|
|
169
181
|
|
|
170
182
|

|
|
171
183
|
|
|
172
|
-
We use the following two-dimensional array datasource to build up the Family Tree.
|
|
184
|
+
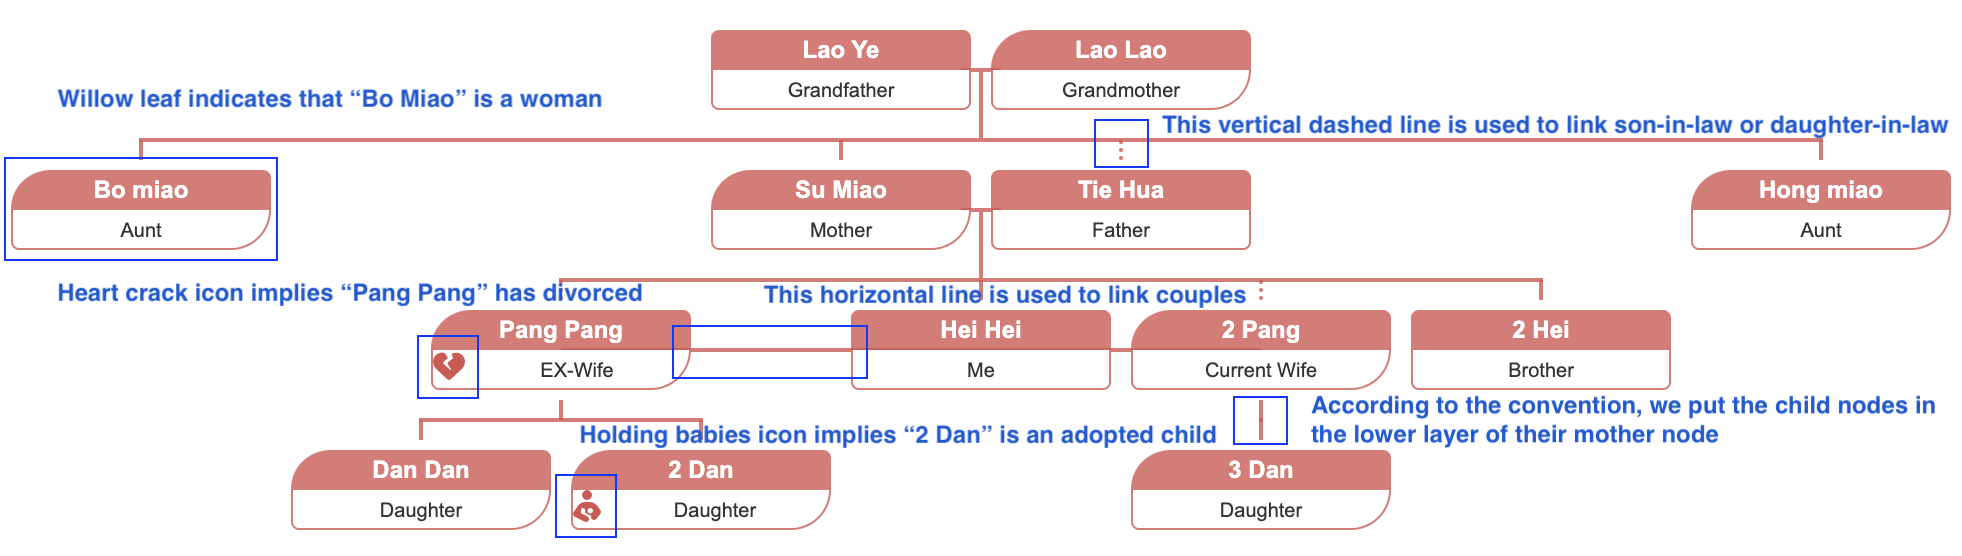
We use the following two-dimensional array datasource to build up the Family Tree. Here, prop "gender" is optional.
|
|
173
185
|
```
|
|
174
186
|
var datascource = [
|
|
175
187
|
[
|
|
176
|
-
{ 'id': '8', 'name': 'Lao Ye', 'title': 'Grandfather'
|
|
188
|
+
{ 'id': '8', 'name': 'Lao Ye', 'title': 'Grandfather' },
|
|
177
189
|
{
|
|
178
|
-
'id': '1', 'name': 'Lao Lao', 'title': 'Grandmother',
|
|
190
|
+
'id': '1', 'name': 'Lao Lao', 'title': 'Grandmother', 'outsider': true,
|
|
179
191
|
'children': [
|
|
180
192
|
[
|
|
181
|
-
{ 'id': '2', 'name': 'Bo miao', 'title': 'Aunt'
|
|
193
|
+
{ 'id': '2', 'name': 'Bo miao', 'title': 'Aunt' }
|
|
182
194
|
],
|
|
183
195
|
[
|
|
184
|
-
{ 'id': '3', 'name': 'Su Miao', 'title': 'Mother',
|
|
196
|
+
{ 'id': '3', 'name': 'Su Miao', 'title': 'Mother',
|
|
185
197
|
'children': [
|
|
186
198
|
[
|
|
187
199
|
|
|
188
|
-
{ 'id': '12', 'name': 'Pang Pang', 'title': 'Wife', '
|
|
200
|
+
{ 'id': '12', 'name': 'Pang Pang', 'title': 'Wife', 'outsider': true,
|
|
189
201
|
'children': [
|
|
190
|
-
[{ 'id': '7', 'name': 'Dan Dan', 'title': 'Daughter'
|
|
191
|
-
[{ 'id': '6', 'name': 'Er Dan', 'title': 'Daughter'
|
|
202
|
+
[{ 'id': '7', 'name': 'Dan Dan', 'title': 'Daughter' }],
|
|
203
|
+
[{ 'id': '6', 'name': 'Er Dan', 'title': 'Daughter' }],
|
|
192
204
|
]
|
|
193
205
|
},
|
|
194
|
-
{ 'id': '5', 'name': 'Hei Hei', 'title': 'Me'
|
|
206
|
+
{ 'id': '5', 'name': 'Hei Hei', 'title': 'Me' },
|
|
195
207
|
]
|
|
196
208
|
]
|
|
197
209
|
},
|
|
198
|
-
{ 'id': '9', 'name': 'Tie Hua', 'title': 'Father', '
|
|
210
|
+
{ 'id': '9', 'name': 'Tie Hua', 'title': 'Father', 'outsider': true }
|
|
199
211
|
],
|
|
200
212
|
[
|
|
201
|
-
{ 'id': '10', 'name': 'Hong miao', 'title': 'Aunt'
|
|
213
|
+
{ 'id': '10', 'name': 'Hong miao', 'title': 'Aunt' }
|
|
202
214
|
]
|
|
203
215
|
]
|
|
204
216
|
}
|
|
@@ -206,6 +218,16 @@ var datascource = [
|
|
|
206
218
|
];
|
|
207
219
|
```
|
|
208
220
|
|
|
221
|
+
- [I want to add property tags to family tree](https://dabeng.github.io/OrgChart/familytree-custom-properties.html)
|
|
222
|
+
|
|
223
|
+
|
|
224
|
+
|
|
225
|
+
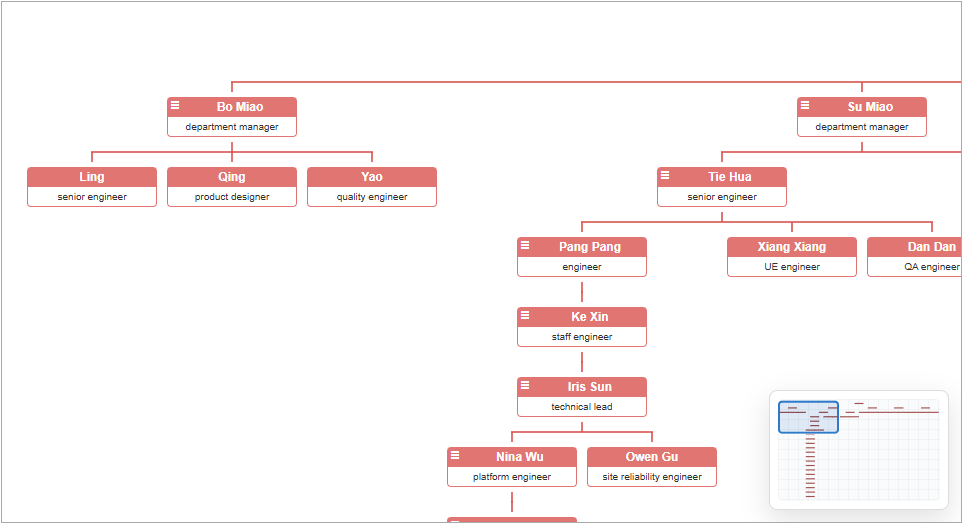
- [I want to navigate the orgchart with a minimap](https://dabeng.github.io/OrgChart/minimap.html)
|
|
226
|
+
|
|
227
|
+
|
|
228
|
+
|
|
229
|
+
Enable the `minimap` option to display an overview navigator. Drag its viewport to move the chart, or use the mouse wheel over the minimap to zoom.
|
|
230
|
+
|
|
209
231
|
### how to start up demos locally
|
|
210
232
|
|
|
211
233
|
- you have to install node.js v6+ because our unit tests are based on jsdom v11
|
|
@@ -219,7 +241,10 @@ var datascource = [
|
|
|
219
241
|
|
|
220
242
|
### Instantiation Statement
|
|
221
243
|
```js
|
|
222
|
-
var oc =
|
|
244
|
+
var oc = new OrgChart({
|
|
245
|
+
chartContainer: '#chartContainerId',
|
|
246
|
+
data: datasource
|
|
247
|
+
});
|
|
223
248
|
```
|
|
224
249
|
|
|
225
250
|
### Structure of Datasource
|
|
@@ -230,29 +255,26 @@ var oc = $('#chartContainerId').orgchart(options);
|
|
|
230
255
|
'collapsed': true, // By default, the children nodes of current node is hidden.
|
|
231
256
|
'className': 'top-level', // It's a optional property
|
|
232
257
|
// which will be used as className attribute of node.
|
|
233
|
-
'nodeTitle': 'name', // This property is used to retrieve
|
|
258
|
+
'nodeTitle': 'name', // This property is used to retrieve “title†value in datasource
|
|
234
259
|
'nodeContent': 'title',// This property is used to retrieve "content" value in datasource
|
|
235
|
-
'relationship': relationshipValue, // Note: when you activate ondemand loading nodes feature,
|
|
236
|
-
// you should use json datsource (local or remote) and set this property.
|
|
237
|
-
// This property implies that whether this node has parent, siblings, children.
|
|
238
|
-
// relationshipValue is a string composed of three "0/1" identifier.
|
|
239
|
-
// First character stands for wether current node has parent node;
|
|
240
|
-
// Scond character stands for wether current node has siblings nodes;
|
|
241
|
-
// Third character stands for wether current node has children node.
|
|
242
260
|
'children': [ // The property stands for nested nodes.
|
|
243
|
-
{ 'name': 'Bo Miao', 'title': 'department manager'
|
|
244
|
-
{ 'name': 'Su Miao', 'title': 'department manager',
|
|
261
|
+
{ 'name': 'Bo Miao', 'title': 'department manager' },
|
|
262
|
+
{ 'name': 'Su Miao', 'title': 'department manager',
|
|
245
263
|
'children': [
|
|
246
|
-
{ 'name': 'Tie Hua', 'title': 'senior engineer'
|
|
247
|
-
{ 'name': 'Hei Hei', 'title': 'senior engineer'
|
|
264
|
+
{ 'name': 'Tie Hua', 'title': 'senior engineer' },
|
|
265
|
+
{ 'name': 'Hei Hei', 'title': 'senior engineer' }
|
|
248
266
|
]
|
|
249
267
|
},
|
|
250
|
-
{ 'name': 'Yu Jie', 'title': 'department manager'
|
|
268
|
+
{ 'name': 'Yu Jie', 'title': 'department manager' }
|
|
251
269
|
],
|
|
252
270
|
'otherPro': anyValue // feel free to append any useful properties
|
|
253
271
|
};
|
|
254
272
|
```
|
|
255
273
|
|
|
274
|
+
Node relations are derived from the current loaded structure. Expand/collapse and compact-layout controls are created when a node is hovered, focused, or selected by touch, and removed when interaction ends. A control involved in loading is retained until loading finishes. Keyboard users can focus a node and activate its controls with Enter or Space.
|
|
275
|
+
|
|
276
|
+
The `createNode` callback runs without prebuilt interaction controls; customize icons through `icons` rather than querying initial arrow elements. For on-demand loading, create application-owned request buttons through `createNode` and handle requests with event delegation. Keep their behavior selectors separate from built-in controls, then insert loaded nodes with `addAncestors()`, `addChildren()`, or `addDescendants()`. `getNodeState()` describes loaded relations, not data that may exist on a server. The former relationship field and relation-preprocessing method are no longer supported.
|
|
277
|
+
|
|
256
278
|
### Data Props
|
|
257
279
|
<table>
|
|
258
280
|
<thead>
|
|
@@ -290,10 +312,10 @@ var oc = $('#chartContainerId').orgchart(options);
|
|
|
290
312
|
<tbody>
|
|
291
313
|
<tr>
|
|
292
314
|
<td>data</td>
|
|
293
|
-
<td>
|
|
315
|
+
<td>object / array / HTMLUListElement</td>
|
|
294
316
|
<td>yes</td>
|
|
295
317
|
<td></td>
|
|
296
|
-
<td>
|
|
318
|
+
<td>Datasource: a JSON tree object, grouped family-tree arrays, or an HTML ul element. UL data is normalized internally so later option changes retain edits.</td>
|
|
297
319
|
</tr>
|
|
298
320
|
<tr>
|
|
299
321
|
<td>pan</td>
|
|
@@ -309,19 +331,26 @@ var oc = $('#chartContainerId').orgchart(options);
|
|
|
309
331
|
<td>false</td>
|
|
310
332
|
<td>Users could zoomin/zoomout the orgchart by mouse wheel if they enable this option.</td>
|
|
311
333
|
</tr>
|
|
334
|
+
<tr>
|
|
335
|
+
<td>minimap</td>
|
|
336
|
+
<td>boolean</td>
|
|
337
|
+
<td>no</td>
|
|
338
|
+
<td>false</td>
|
|
339
|
+
<td>Displays an overview navigator. Drag its viewport to move the chart, or use the wheel over the minimap to zoom. Minimap wheel zoom remains available when zoom is false.</td>
|
|
340
|
+
</tr>
|
|
312
341
|
<tr>
|
|
313
342
|
<td>zoominLimit</td>
|
|
314
343
|
<td>number</td>
|
|
315
344
|
<td>no</td>
|
|
316
345
|
<td>7</td>
|
|
317
|
-
<td>
|
|
346
|
+
<td>Inclusive maximum scale. Zoom steps are clamped to this bound. Limits must be finite, positive, and ordered.</td>
|
|
318
347
|
</tr>
|
|
319
348
|
<tr>
|
|
320
349
|
<td>zoomoutLimit</td>
|
|
321
350
|
<td>number</td>
|
|
322
351
|
<td>no</td>
|
|
323
352
|
<td>0.5</td>
|
|
324
|
-
<td>
|
|
353
|
+
<td>Inclusive minimum scale. It must not exceed zoominLimit. Invalid limits throw a RangeError before the chart is replaced.</td>
|
|
325
354
|
</tr>
|
|
326
355
|
<tr>
|
|
327
356
|
<td>direction</td>
|
|
@@ -346,10 +375,10 @@ var oc = $('#chartContainerId').orgchart(options);
|
|
|
346
375
|
</tr>
|
|
347
376
|
<tr>
|
|
348
377
|
<td>visibleLevel</td>
|
|
349
|
-
<td>
|
|
378
|
+
<td>nonnegative integer or boolean</td>
|
|
350
379
|
<td>no</td>
|
|
351
380
|
<td>999</td>
|
|
352
|
-
<td>It indicates the
|
|
381
|
+
<td>It indicates the initially expanded depth. true uses the default depth (999); false shows the first level; 0 hides all initial nodes. Deeper branches can be expanded later.</td>
|
|
353
382
|
</tr>
|
|
354
383
|
<tr>
|
|
355
384
|
<td>nodeTitle</td>
|
|
@@ -358,13 +387,6 @@ var oc = $('#chartContainerId').orgchart(options);
|
|
|
358
387
|
<td>"name"</td>
|
|
359
388
|
<td>It sets one property of datasource as text content of title section of orgchart node. In fact, users can create a simple orghcart with only nodeTitle option.</td>
|
|
360
389
|
</tr>
|
|
361
|
-
<tr>
|
|
362
|
-
<td>parentNodeSymbol</td>
|
|
363
|
-
<td>string</td>
|
|
364
|
-
<td>no</td>
|
|
365
|
-
<td>"oci-menu"</td>
|
|
366
|
-
<td>Using your own icon to imply that the node has child nodes.</td>
|
|
367
|
-
</tr>
|
|
368
390
|
<tr>
|
|
369
391
|
<td>nodeContent</td>
|
|
370
392
|
<td>string</td>
|
|
@@ -391,7 +413,7 @@ var oc = $('#chartContainerId').orgchart(options);
|
|
|
391
413
|
<td>function</td>
|
|
392
414
|
<td>no</td>
|
|
393
415
|
<td></td>
|
|
394
|
-
<td>It's a callback function used to customize every orgchart node. It receives two parameters: "
|
|
416
|
+
<td>It's a callback function used to customize every orgchart node. It receives two parameters: "node" stands for the single node element; "data" stands for datasource of single node.</td>
|
|
395
417
|
</tr>
|
|
396
418
|
<tr>
|
|
397
419
|
<td>exportButton</td>
|
|
@@ -411,7 +433,7 @@ var oc = $('#chartContainerId').orgchart(options);
|
|
|
411
433
|
<td>exportFilename</td>
|
|
412
434
|
<td>string</td>
|
|
413
435
|
<td>no</td>
|
|
414
|
-
<td>"
|
|
436
|
+
<td>"OrgChart"</td>
|
|
415
437
|
<td>It's filename when you export current orgchart as a picture.</td>
|
|
416
438
|
</tr>
|
|
417
439
|
<tr>
|
|
@@ -421,6 +443,13 @@ var oc = $('#chartContainerId').orgchart(options);
|
|
|
421
443
|
<td>"png"</td>
|
|
422
444
|
<td>Available values are png and pdf.</td>
|
|
423
445
|
</tr>
|
|
446
|
+
<tr>
|
|
447
|
+
<td>exportScale</td>
|
|
448
|
+
<td>number</td>
|
|
449
|
+
<td>no</td>
|
|
450
|
+
<td>2</td>
|
|
451
|
+
<td>Canvas resolution multiplier for PNG and PDF exports; PDF pages retain the chart's logical dimensions. Nonpositive values fall back to 1.</td>
|
|
452
|
+
</tr>
|
|
424
453
|
<tr>
|
|
425
454
|
<td>chartClass</td>
|
|
426
455
|
<td>string</td>
|
|
@@ -447,14 +476,14 @@ var oc = $('#chartContainerId').orgchart(options);
|
|
|
447
476
|
<td>function</td>
|
|
448
477
|
<td>no</td>
|
|
449
478
|
<td></td>
|
|
450
|
-
<td>It can often be useful to know when your table has fully been initialised, data loaded and rendered. It receives one
|
|
479
|
+
<td>It can often be useful to know when your table has fully been initialised, data loaded and rendered. It receives one parameter: "chart" stands for the initialized chart element.</td>
|
|
451
480
|
</tr>
|
|
452
481
|
<tr>
|
|
453
482
|
<td>icons</td>
|
|
454
483
|
<td>json</td>
|
|
455
484
|
<td>no</td>
|
|
456
485
|
<td></td>
|
|
457
|
-
<td>Users can use this option to plug Font Awesome icons back in.
|
|
486
|
+
<td>Users can use this option to plug Font Awesome icons back in. Partial icon objects are merged with the defaults by field. Set icons.parentNode to customize the parent-node symbol.
|
|
458
487
|
<pre>
|
|
459
488
|
<code>
|
|
460
489
|
'icons': {
|
|
@@ -473,23 +502,57 @@ var oc = $('#chartContainerId').orgchart(options);
|
|
|
473
502
|
</tr>
|
|
474
503
|
<tr>
|
|
475
504
|
<td>compact</td>
|
|
476
|
-
<td>function</td>
|
|
505
|
+
<td>boolean or function</td>
|
|
477
506
|
<td>no</td>
|
|
478
507
|
<td></td>
|
|
479
|
-
<td>
|
|
508
|
+
<td>true compacts every branch; a callback receiving node data selects additional compact branches. Explicit compact data properties are preserved. Vertical/hybrid layout takes precedence at nodes where it applies.</td>
|
|
480
509
|
</tr>
|
|
481
510
|
</tbody>
|
|
482
511
|
</table>
|
|
483
512
|
|
|
484
513
|
### Methods
|
|
485
|
-
|
|
514
|
+
Create an instance with `new OrgChart(options)`. Its `chartContainer` and `chart` properties expose the native container and rendered chart elements.
|
|
515
|
+
|
|
516
|
+
```js
|
|
517
|
+
const oc = new OrgChart({ chartContainer: '#chartContainerId', data: datasource });
|
|
518
|
+
```
|
|
486
519
|
|
|
487
|
-
|
|
488
|
-
|
|
520
|
+
The public API is: `init`, `setOptions`, `attachMinimap`, `detachMinimap`, `updateMinimap`, `addAncestors`, `addDescendants`, `addParent`, `addSiblings`, `addChildren`, `removeNodes`, `getHierarchy`, `getNodeState`, `getParent`, `getChildren`, `getSiblings`, `getRelatedNodes`, `hideParent`, `showParent`, `hideChildren`, `showChildren`, `hideSiblings`, `showSiblings`, `setChartScale`, `export`, `exportPNG`, and `exportPDF`. Arguments that refer to nodes or charts are native `HTMLElement` instances.
|
|
521
|
+
|
|
522
|
+
#### API reference
|
|
523
|
+
| Call | Parameters | Return value and behavior |
|
|
524
|
+
| --- | --- | --- |
|
|
525
|
+
| `oc.init(options)` | Partial options object; use `data` to replace the data source. | Rebuilds the chart and returns `oc`. |
|
|
526
|
+
| `oc.setOptions(options)`<br>`oc.setOptions(name, value)` | Partial options object, or an option name and value. | Applies navigation/export settings in place; rebuilds for data, layout or node-rendering settings; returns `oc`. |
|
|
527
|
+
| `oc.attachMinimap()`<br>`oc.detachMinimap()`<br>`oc.updateMinimap(forceRefresh)` | `forceRefresh` is optional; `true` redraws preview nodes. | Creates, removes, or refreshes the minimap. Prefer `setOptions('minimap', value)` for normal enablement. |
|
|
528
|
+
| `oc.addAncestors(data, parentId)` | Ancestor data and the id of the ancestor node that receives the existing root. | Inserts ancestor hierarchy; no return value. |
|
|
529
|
+
| `oc.addDescendants(data, parent)` | Array of descendant data and a rendered parent `.node`. | Appends descendant hierarchy; no return value. |
|
|
530
|
+
| `oc.addParent(currentRoot, data)` | Rendered root `.node` and its new parent data. | Wraps the current root with a parent; no return value. |
|
|
531
|
+
| `oc.addSiblings(node, data)`<br>`oc.addChildren(node, data)` | Rendered `.node` and an array of sibling or child data. | Adds rendered nodes; no return value. |
|
|
532
|
+
| `oc.removeNodes(node)` | Rendered `.node` to remove. | Removes the node and its descendants; no return value. |
|
|
533
|
+
| `oc.getHierarchy(includeNodeData)` | Optional boolean, default `false`. | Returns a hierarchy object for tree sources or grouped arrays for family sources; returns an error string when the chart or required node ids are unavailable. |
|
|
534
|
+
| `oc.getNodeState(node, relation)` | Rendered `.node`; `relation` is `parent`, `children`, or `siblings`. | Returns `{ exist, visible }`. |
|
|
535
|
+
| `oc.getParent(node)` | Rendered `.node`. | Returns its parent `.node`, or `null`. |
|
|
536
|
+
| `oc.getChildren(node)`<br>`oc.getSiblings(node)` | Rendered `.node`. | Returns an array of direct child or sibling `.node` elements. |
|
|
537
|
+
| `oc.getRelatedNodes(node, relation)` | Rendered `.node`; `relation` is `parent`, `children`, or `siblings`. | Equivalent generalized query; parent returns a node or `null`, other relations return arrays. |
|
|
538
|
+
| `oc.hideParent(node)` / `oc.showParent(node)`<br>`oc.hideChildren(node)` / `oc.showChildren(node)` | Rendered `.node`. | Hides or reveals the related branch with the chart transition; no return value. |
|
|
539
|
+
| `oc.hideSiblings(node, direction)`<br>`oc.showSiblings(node, direction)` | Rendered `.node`; optional `direction` is `left` or `right`. | Hides or reveals siblings on one side, or all siblings when omitted; no return value. |
|
|
540
|
+
| `oc.setChartScale(chart, multiplier, zoomAnchor)` | Usually pass `oc.chart`; positive relative scale multiplier; optional viewport point `{ x, y }`. | Scales within configured zoom limits and keeps `zoomAnchor` fixed when supplied. |
|
|
541
|
+
| `oc.export(filename, extension)` | Optional filename and `png` or `pdf` extension. | Starts export using configured defaults; returns `false` if the chart cannot be exported. |
|
|
542
|
+
| `oc.exportPNG(canvas, filename)`<br>`oc.exportPDF(canvas, filename, exportScale)` | Prepared canvas; filename; PDF scale defaults to `1`. | Downloads the supplied canvas directly as PNG or PDF; normally call `export()` instead. |
|
|
489
543
|
|
|
490
544
|
#### init(newOptions)
|
|
491
545
|
It's the useful way when users want to re-initialize or refresh orgchart based on new options or reload new data.
|
|
492
546
|
|
|
547
|
+
#### setOptions(options) / setOptions(name, value)
|
|
548
|
+
Updates `pan`, `zoom`, `minimap`, zoom limits and export scale/filename/extension without rebuilding the chart. Other options rebuild the chart. Pass a partial options object, or an option name and value. Changes are retained by later `init()` calls; icon defaults are merged field by field. Reacquire node elements after a rebuild.
|
|
549
|
+
|
|
550
|
+
#### attachMinimap() / detachMinimap()
|
|
551
|
+
Creates or removes the minimap overlay for the current chart. Usually use `setOptions('minimap', true|false)` so the option state and overlay stay synchronized.
|
|
552
|
+
|
|
553
|
+
#### updateMinimap(forceRefresh)
|
|
554
|
+
Recalculates the minimap viewport after changing the chart transform or layout. Pass `true` to redraw the minimap node preview.
|
|
555
|
+
|
|
493
556
|
#### addAncestors(data, parentId)
|
|
494
557
|
Adds the ancestors for current orgchart.
|
|
495
558
|
<table>
|
|
@@ -520,7 +583,7 @@ Adds the ancestors for current orgchart.
|
|
|
520
583
|
</tbody>
|
|
521
584
|
</table>
|
|
522
585
|
|
|
523
|
-
#### addDescendants(data,
|
|
586
|
+
#### addDescendants(data, parent)
|
|
524
587
|
Adds the descendants for specified parent node.
|
|
525
588
|
<table>
|
|
526
589
|
<thead>
|
|
@@ -541,16 +604,16 @@ Adds the descendants for specified parent node.
|
|
|
541
604
|
<td>datasource for building descendants</td>
|
|
542
605
|
</tr>
|
|
543
606
|
<tr>
|
|
544
|
-
<td
|
|
545
|
-
<td>
|
|
607
|
+
<td>parent</td>
|
|
608
|
+
<td>HTMLElement</td>
|
|
546
609
|
<td>yes</td>
|
|
547
610
|
<td></td>
|
|
548
|
-
<td>append descendants to the
|
|
611
|
+
<td>append descendants to the parent node</td>
|
|
549
612
|
</tr>
|
|
550
613
|
</tbody>
|
|
551
614
|
</table>
|
|
552
615
|
|
|
553
|
-
#### addParent(data)
|
|
616
|
+
#### addParent(currentRoot, data)
|
|
554
617
|
Adds parent node(actullay it's always root node) for current orgchart.
|
|
555
618
|
<table>
|
|
556
619
|
<thead>
|
|
@@ -563,6 +626,13 @@ Adds parent node(actullay it's always root node) for current orgchart.
|
|
|
563
626
|
</tr>
|
|
564
627
|
</thead>
|
|
565
628
|
<tbody>
|
|
629
|
+
<tr>
|
|
630
|
+
<td>currentRoot</td>
|
|
631
|
+
<td>HTMLElement</td>
|
|
632
|
+
<td>yes</td>
|
|
633
|
+
<td></td>
|
|
634
|
+
<td>current root node that the new parent node will wrap</td>
|
|
635
|
+
</tr>
|
|
566
636
|
<tr>
|
|
567
637
|
<td>data</td>
|
|
568
638
|
<td>json object</td>
|
|
@@ -573,7 +643,7 @@ Adds parent node(actullay it's always root node) for current orgchart.
|
|
|
573
643
|
</tbody>
|
|
574
644
|
</table>
|
|
575
645
|
|
|
576
|
-
#### addSiblings(
|
|
646
|
+
#### addSiblings(node, data)
|
|
577
647
|
Adds sibling nodes for designated node.
|
|
578
648
|
<table>
|
|
579
649
|
<thead>
|
|
@@ -587,8 +657,8 @@ Adds sibling nodes for designated node.
|
|
|
587
657
|
</thead>
|
|
588
658
|
<tbody>
|
|
589
659
|
<tr>
|
|
590
|
-
<td
|
|
591
|
-
<td>
|
|
660
|
+
<td>node</td>
|
|
661
|
+
<td>HTMLElement</td>
|
|
592
662
|
<td>yes</td>
|
|
593
663
|
<td></td>
|
|
594
664
|
<td>we'll add sibling nodes based on this node</td>
|
|
@@ -603,7 +673,7 @@ Adds sibling nodes for designated node.
|
|
|
603
673
|
</tbody>
|
|
604
674
|
</table>
|
|
605
675
|
|
|
606
|
-
#### addChildren(
|
|
676
|
+
#### addChildren(node, data)
|
|
607
677
|
Adds child nodes for designed node.
|
|
608
678
|
<table>
|
|
609
679
|
<thead>
|
|
@@ -617,8 +687,8 @@ Adds child nodes for designed node.
|
|
|
617
687
|
</thead>
|
|
618
688
|
<tbody>
|
|
619
689
|
<tr>
|
|
620
|
-
<td
|
|
621
|
-
<td>
|
|
690
|
+
<td>node</td>
|
|
691
|
+
<td>HTMLElement</td>
|
|
622
692
|
<td>yes</td>
|
|
623
693
|
<td></td>
|
|
624
694
|
<td>we'll add child nodes based on this node</td>
|
|
@@ -633,7 +703,7 @@ Adds child nodes for designed node.
|
|
|
633
703
|
</tbody>
|
|
634
704
|
</table>
|
|
635
705
|
|
|
636
|
-
#### removeNodes(
|
|
706
|
+
#### removeNodes(node)
|
|
637
707
|
Removes the designated node and its descedant nodes.
|
|
638
708
|
<table>
|
|
639
709
|
<thead>
|
|
@@ -647,8 +717,8 @@ Removes the designated node and its descedant nodes.
|
|
|
647
717
|
</thead>
|
|
648
718
|
<tbody>
|
|
649
719
|
<tr>
|
|
650
|
-
<td
|
|
651
|
-
<td>
|
|
720
|
+
<td>node</td>
|
|
721
|
+
<td>HTMLElement</td>
|
|
652
722
|
<td>yes</td>
|
|
653
723
|
<td></td>
|
|
654
724
|
<td>node to be removed</td>
|
|
@@ -675,7 +745,7 @@ This method is designed to get the hierarchy relationships of orgchart for furth
|
|
|
675
745
|
</tr>
|
|
676
746
|
</table>
|
|
677
747
|
|
|
678
|
-
#### hideParent(
|
|
748
|
+
#### hideParent(node)
|
|
679
749
|
This method allows you to hide programatically the parent node of any specific node(.node element), if it has.
|
|
680
750
|
<table>
|
|
681
751
|
<tr>
|
|
@@ -686,15 +756,15 @@ This method allows you to hide programatically the parent node of any specific n
|
|
|
686
756
|
<th>Description</th>
|
|
687
757
|
</tr>
|
|
688
758
|
<tr>
|
|
689
|
-
<td
|
|
690
|
-
<td>
|
|
759
|
+
<td>node</td>
|
|
760
|
+
<td>HTMLElement</td>
|
|
691
761
|
<td>Yes</td>
|
|
692
762
|
<td></td>
|
|
693
|
-
<td>It
|
|
763
|
+
<td>It is the node element whose parent node should be hidden. Its sibling nodes will be hidden at the same time.</td>
|
|
694
764
|
</tr>
|
|
695
765
|
</table>
|
|
696
766
|
|
|
697
|
-
#### showParent(
|
|
767
|
+
#### showParent(node)
|
|
698
768
|
This method allows you to show programatically the parent node of any specific node(.node element), if it has.
|
|
699
769
|
<table>
|
|
700
770
|
<tr>
|
|
@@ -705,15 +775,15 @@ This method allows you to show programatically the parent node of any specific n
|
|
|
705
775
|
<th>Description</th>
|
|
706
776
|
</tr>
|
|
707
777
|
<tr>
|
|
708
|
-
<td
|
|
709
|
-
<td>
|
|
778
|
+
<td>node</td>
|
|
779
|
+
<td>HTMLElement</td>
|
|
710
780
|
<td>Yes</td>
|
|
711
781
|
<td></td>
|
|
712
|
-
<td>It
|
|
782
|
+
<td>It is the node element whose parent node should be shown</td>
|
|
713
783
|
</tr>
|
|
714
784
|
</table>
|
|
715
785
|
|
|
716
|
-
#### hideChildren(
|
|
786
|
+
#### hideChildren(node)
|
|
717
787
|
This method allows you to hide programatically the children of any specific node(.node element), if it has.
|
|
718
788
|
<table>
|
|
719
789
|
<tr>
|
|
@@ -724,15 +794,15 @@ This method allows you to hide programatically the children of any specific node
|
|
|
724
794
|
<th>Description</th>
|
|
725
795
|
</tr>
|
|
726
796
|
<tr>
|
|
727
|
-
<td
|
|
728
|
-
<td>
|
|
797
|
+
<td>node</td>
|
|
798
|
+
<td>HTMLElement</td>
|
|
729
799
|
<td>Yes</td>
|
|
730
800
|
<td></td>
|
|
731
|
-
<td>It
|
|
801
|
+
<td>It is the node element whose child nodes should be hidden</td>
|
|
732
802
|
</tr>
|
|
733
803
|
</table>
|
|
734
804
|
|
|
735
|
-
#### showChildren(
|
|
805
|
+
#### showChildren(node)
|
|
736
806
|
This method allows you to show programatically the children of any specific node(.node element), if it has.
|
|
737
807
|
<table>
|
|
738
808
|
<tr>
|
|
@@ -743,15 +813,15 @@ This method allows you to show programatically the children of any specific node
|
|
|
743
813
|
<th>Description</th>
|
|
744
814
|
</tr>
|
|
745
815
|
<tr>
|
|
746
|
-
<td
|
|
747
|
-
<td>
|
|
816
|
+
<td>node</td>
|
|
817
|
+
<td>HTMLElement</td>
|
|
748
818
|
<td>Yes</td>
|
|
749
819
|
<td></td>
|
|
750
|
-
<td>It
|
|
820
|
+
<td>It is the node element whose child nodes should be shown</td>
|
|
751
821
|
</tr>
|
|
752
822
|
</table>
|
|
753
823
|
|
|
754
|
-
#### hideSiblings(
|
|
824
|
+
#### hideSiblings(node, direction)
|
|
755
825
|
This method allows you to hide programatically the siblings of any specific node(.node element), if it has.
|
|
756
826
|
<table>
|
|
757
827
|
<tr>
|
|
@@ -762,11 +832,11 @@ This method allows you to hide programatically the siblings of any specific node
|
|
|
762
832
|
<th>Description</th>
|
|
763
833
|
</tr>
|
|
764
834
|
<tr>
|
|
765
|
-
<td
|
|
766
|
-
<td>
|
|
835
|
+
<td>node</td>
|
|
836
|
+
<td>HTMLElement</td>
|
|
767
837
|
<td>Yes</td>
|
|
768
838
|
<td></td>
|
|
769
|
-
<td>It
|
|
839
|
+
<td>It is the node element whose sibling nodes should be hidden</td>
|
|
770
840
|
</tr>
|
|
771
841
|
<tr>
|
|
772
842
|
<td>direction</td>
|
|
@@ -777,7 +847,7 @@ This method allows you to hide programatically the siblings of any specific node
|
|
|
777
847
|
</tr>
|
|
778
848
|
</table>
|
|
779
849
|
|
|
780
|
-
#### showSiblings(
|
|
850
|
+
#### showSiblings(node, direction)
|
|
781
851
|
This method allows you to show programatically the siblings of any specific node(.node element), if it has.
|
|
782
852
|
<table>
|
|
783
853
|
<tr>
|
|
@@ -788,11 +858,11 @@ This method allows you to show programatically the siblings of any specific node
|
|
|
788
858
|
<th>Description</th>
|
|
789
859
|
</tr>
|
|
790
860
|
<tr>
|
|
791
|
-
<td
|
|
792
|
-
<td>
|
|
861
|
+
<td>node</td>
|
|
862
|
+
<td>HTMLElement</td>
|
|
793
863
|
<td>Yes</td>
|
|
794
864
|
<td></td>
|
|
795
|
-
<td>It
|
|
865
|
+
<td>It is the node element whose sibling nodes should be shown</td>
|
|
796
866
|
</tr>
|
|
797
867
|
<tr>
|
|
798
868
|
<td>direction</td>
|
|
@@ -803,7 +873,7 @@ This method allows you to show programatically the siblings of any specific node
|
|
|
803
873
|
</tr>
|
|
804
874
|
</table>
|
|
805
875
|
|
|
806
|
-
#### getNodeState(
|
|
876
|
+
#### getNodeState(node, relation)
|
|
807
877
|
This method returns you the display state of related node of the specified node.
|
|
808
878
|
<table>
|
|
809
879
|
<tr>
|
|
@@ -814,11 +884,11 @@ This method returns you the display state of related node of the specified node.
|
|
|
814
884
|
<th>Description</th>
|
|
815
885
|
</tr>
|
|
816
886
|
<tr>
|
|
817
|
-
<td
|
|
818
|
-
<td>
|
|
887
|
+
<td>node</td>
|
|
888
|
+
<td>HTMLElement</td>
|
|
819
889
|
<td>Yes</td>
|
|
820
890
|
<td></td>
|
|
821
|
-
<td>It
|
|
891
|
+
<td>It is the node element whose related nodes' display state you want to inspect.</td>
|
|
822
892
|
</tr>
|
|
823
893
|
<tr>
|
|
824
894
|
<td>relation</td>
|
|
@@ -837,7 +907,7 @@ The returning object will have the following structure:
|
|
|
837
907
|
}
|
|
838
908
|
```
|
|
839
909
|
|
|
840
|
-
#### getRelatedNodes(
|
|
910
|
+
#### getRelatedNodes(node, relation)
|
|
841
911
|
This method returns you the nodes related to the specified node.
|
|
842
912
|
<table>
|
|
843
913
|
<tr>
|
|
@@ -848,11 +918,11 @@ This method returns you the nodes related to the specified node.
|
|
|
848
918
|
<th>Description</th>
|
|
849
919
|
</tr>
|
|
850
920
|
<tr>
|
|
851
|
-
<td
|
|
852
|
-
<td>
|
|
921
|
+
<td>node</td>
|
|
922
|
+
<td>HTMLElement</td>
|
|
853
923
|
<td>Yes</td>
|
|
854
924
|
<td></td>
|
|
855
|
-
<td>It
|
|
925
|
+
<td>It is the node element whose related nodes you want to inspect</td>
|
|
856
926
|
</tr>
|
|
857
927
|
<tr>
|
|
858
928
|
<td>relation</td>
|
|
@@ -863,7 +933,7 @@ This method returns you the nodes related to the specified node.
|
|
|
863
933
|
</tr>
|
|
864
934
|
</table>
|
|
865
935
|
|
|
866
|
-
#### getParent(
|
|
936
|
+
#### getParent(node)
|
|
867
937
|
This method returns you the parent node of the specified node.
|
|
868
938
|
<table>
|
|
869
939
|
<tr>
|
|
@@ -874,15 +944,15 @@ This method returns you the parent node of the specified node.
|
|
|
874
944
|
<th>Description</th>
|
|
875
945
|
</tr>
|
|
876
946
|
<tr>
|
|
877
|
-
<td
|
|
878
|
-
<td>
|
|
947
|
+
<td>node</td>
|
|
948
|
+
<td>HTMLElement</td>
|
|
879
949
|
<td>Yes</td>
|
|
880
950
|
<td></td>
|
|
881
|
-
<td>It
|
|
951
|
+
<td>It is the node element whose parent node you want to inspect</td>
|
|
882
952
|
</tr>
|
|
883
953
|
</table>
|
|
884
954
|
|
|
885
|
-
#### getSiblings(
|
|
955
|
+
#### getSiblings(node)
|
|
886
956
|
This method returns you the sibling nodes of the specified node.
|
|
887
957
|
<table>
|
|
888
958
|
<tr>
|
|
@@ -893,15 +963,15 @@ This method returns you the sibling nodes of the specified node.
|
|
|
893
963
|
<th>Description</th>
|
|
894
964
|
</tr>
|
|
895
965
|
<tr>
|
|
896
|
-
<td
|
|
897
|
-
<td>
|
|
966
|
+
<td>node</td>
|
|
967
|
+
<td>HTMLElement</td>
|
|
898
968
|
<td>Yes</td>
|
|
899
969
|
<td></td>
|
|
900
|
-
<td>It
|
|
970
|
+
<td>It is the node element whose sibling nodes you want to inspect</td>
|
|
901
971
|
</tr>
|
|
902
972
|
</table>
|
|
903
973
|
|
|
904
|
-
#### getChildren(
|
|
974
|
+
#### getChildren(node)
|
|
905
975
|
This method returns you the child nodes of the specified node.
|
|
906
976
|
<table>
|
|
907
977
|
<tr>
|
|
@@ -912,16 +982,18 @@ This method returns you the child nodes of the specified node.
|
|
|
912
982
|
<th>Description</th>
|
|
913
983
|
</tr>
|
|
914
984
|
<tr>
|
|
915
|
-
<td
|
|
916
|
-
<td>
|
|
985
|
+
<td>node</td>
|
|
986
|
+
<td>HTMLElement</td>
|
|
917
987
|
<td>Yes</td>
|
|
918
988
|
<td></td>
|
|
919
|
-
<td>It
|
|
989
|
+
<td>It is the node element whose child nodes you want to inspect</td>
|
|
920
990
|
</tr>
|
|
921
991
|
</table>
|
|
922
992
|
|
|
923
|
-
#### setChartScale(
|
|
993
|
+
#### setChartScale(chart, newScale, zoomAnchor)
|
|
924
994
|
This method helps you set the specified chart with new scale.
|
|
995
|
+
|
|
996
|
+
`zoomAnchor` is optional and has the form `{ x, y }` in viewport coordinates. When provided, that point remains fixed while the chart is scaled.
|
|
925
997
|
<table>
|
|
926
998
|
<tr>
|
|
927
999
|
<th>Name</th>
|
|
@@ -931,11 +1003,11 @@ This method helps you set the specified chart with new scale.
|
|
|
931
1003
|
<th>Description</th>
|
|
932
1004
|
</tr>
|
|
933
1005
|
<tr>
|
|
934
|
-
<td
|
|
935
|
-
<td>
|
|
1006
|
+
<td>chart</td>
|
|
1007
|
+
<td>HTMLElement</td>
|
|
936
1008
|
<td>Yes</td>
|
|
937
1009
|
<td></td>
|
|
938
|
-
<td>It
|
|
1010
|
+
<td>It is the chart element in your chart-container</td>
|
|
939
1011
|
</tr>
|
|
940
1012
|
<tr>
|
|
941
1013
|
<td>newScale</td>
|
|
@@ -972,7 +1044,21 @@ This method allow you to export current orgchart as png or pdf file.
|
|
|
972
1044
|
</tr>
|
|
973
1045
|
</table>
|
|
974
1046
|
|
|
1047
|
+
#### exportPNG(canvas, exportFilename)
|
|
1048
|
+
Exports a prepared canvas as a PNG download. This helper is useful when application code supplies its own canvas; most users should call `export()` instead.
|
|
1049
|
+
|
|
1050
|
+
#### exportPDF(canvas, exportFilename, exportScale)
|
|
1051
|
+
Exports a prepared canvas as a PDF download. `exportScale` is the canvas render scale and is used to preserve the PDF's logical dimensions; most users should call `export()` instead.
|
|
1052
|
+
|
|
975
1053
|
### Events
|
|
1054
|
+
OrgChart dispatches bubbling native `CustomEvent` objects. Subscribe with `addEventListener`; event payloads are available on `event.detail`.
|
|
1055
|
+
|
|
1056
|
+
```js
|
|
1057
|
+
oc.chart.addEventListener('nodedrop.orgchart', function (event) {
|
|
1058
|
+
const { draggedNode, dragZone, dropZone } = event.detail;
|
|
1059
|
+
});
|
|
1060
|
+
```
|
|
1061
|
+
|
|
976
1062
|
<table>
|
|
977
1063
|
<thead>
|
|
978
1064
|
<tr>
|
|
@@ -984,23 +1070,28 @@ This method allow you to export current orgchart as png or pdf file.
|
|
|
984
1070
|
<tbody>
|
|
985
1071
|
<tr>
|
|
986
1072
|
<td>nodedrop.orgchart</td>
|
|
987
|
-
<td>draggedNode, dragZone, dropZone</td>
|
|
988
|
-
<td>
|
|
1073
|
+
<td><code>event.detail</code>: draggedNode, dragZone, dropZone</td>
|
|
1074
|
+
<td>Fires on the chart before a node is moved. Call <code>event.preventDefault()</code> to cancel the drop.</td>
|
|
1075
|
+
</tr>
|
|
1076
|
+
<tr>
|
|
1077
|
+
<td>otherdropped.orgchart</td>
|
|
1078
|
+
<td><code>event.detail</code>: draggedItem, dropZone</td>
|
|
1079
|
+
<td>Fires on the chart when a non-OrgChart draggable item is dropped onto a node.</td>
|
|
989
1080
|
</tr>
|
|
990
1081
|
<tr>
|
|
991
1082
|
<td>init.orgchart</td>
|
|
992
|
-
<td>chart</td>
|
|
993
|
-
<td>
|
|
1083
|
+
<td>None; <code>event.target</code> is the chart element</td>
|
|
1084
|
+
<td>Fires after the chart has been rendered.</td>
|
|
994
1085
|
</tr>
|
|
995
1086
|
<tr>
|
|
996
1087
|
<td>show-[relation].orgchart</td>
|
|
997
1088
|
<td></td>
|
|
998
|
-
<td>
|
|
1089
|
+
<td>Fires on the node when related nodes become visible. <code>relation</code> is parent, children, or siblings.</td>
|
|
999
1090
|
</tr>
|
|
1000
1091
|
<tr>
|
|
1001
1092
|
<td>hide-[relation].orgchart</td>
|
|
1002
1093
|
<td></td>
|
|
1003
|
-
<td>
|
|
1094
|
+
<td>Fires on the node when related nodes are hidden. <code>relation</code> is parent, children, or siblings.</td>
|
|
1004
1095
|
</tr>
|
|
1005
1096
|
</tbody>
|
|
1006
1097
|
</table>
|
|
@@ -1011,9 +1102,9 @@ This use case is inspired by the [issue](https://github.com/dabeng/OrgChart/issu
|
|
|
1011
1102
|
|
|
1012
1103
|
Users can enable/disable exapand/collapse feature with className "noncollapsable" as shown below.
|
|
1013
1104
|
```js
|
|
1014
|
-
|
|
1105
|
+
oc.chart.classList.add('noncollapsable'); // deactivate
|
|
1015
1106
|
|
|
1016
|
-
|
|
1107
|
+
oc.chart.classList.remove('noncollapsable'); // activate
|
|
1017
1108
|
```
|
|
1018
1109
|
|
|
1019
1110
|
#### Why is the root node gone?
|
|
@@ -1022,7 +1113,7 @@ For details, please refer to the [issue](https://github.com/dabeng/OrgChart/issu
|
|
|
1022
1113
|
|
|
1023
1114
|
Users can embed any clear up logics into the click handler of the reset buttton as shown below.
|
|
1024
1115
|
```js
|
|
1025
|
-
|
|
1116
|
+
oc.chart.style.transform = ''; // remove transform settings
|
|
1026
1117
|
```
|
|
1027
1118
|
|
|
1028
1119
|
## Browser Compatibility
|