orgchart 4.0.1 → 6.0.0
This diff represents the content of publicly available package versions that have been released to one of the supported registries. The information contained in this diff is provided for informational purposes only and reflects changes between package versions as they appear in their respective public registries.
- package/.github/workflows/publish.yml +32 -0
- package/README.md +205 -89
- package/README.zh-cn.md +221 -68
- package/README.zh-tw.md +221 -68
- package/bower.json +6 -9
- package/demo/10000-nodes.html +139 -0
- package/demo/ajax-datasource.html +46 -45
- package/demo/bottom2top.html +12 -9
- package/demo/center-on-selected-node.html +21 -17
- package/demo/color-coded.html +12 -9
- package/demo/css/style.css +28 -0
- package/demo/custom-icons.html +12 -9
- package/demo/custom-template.html +12 -9
- package/demo/data-prop-compact.html +11 -8
- package/demo/data-prop-hybrid.html +79 -50
- package/demo/default-collapsed.html +12 -9
- package/demo/drag-drop-hybrid-chart.html +17 -14
- package/demo/drag-drop.html +21 -16
- package/demo/edit-chart.html +148 -94
- package/demo/edit-hybrid-chart.html +178 -135
- package/demo/expand-to-given-depth.html +30 -22
- package/demo/export-chart-pdf.html +12 -9
- package/demo/export-chart-with-pictures.html +19 -12
- package/demo/export-chart.html +12 -9
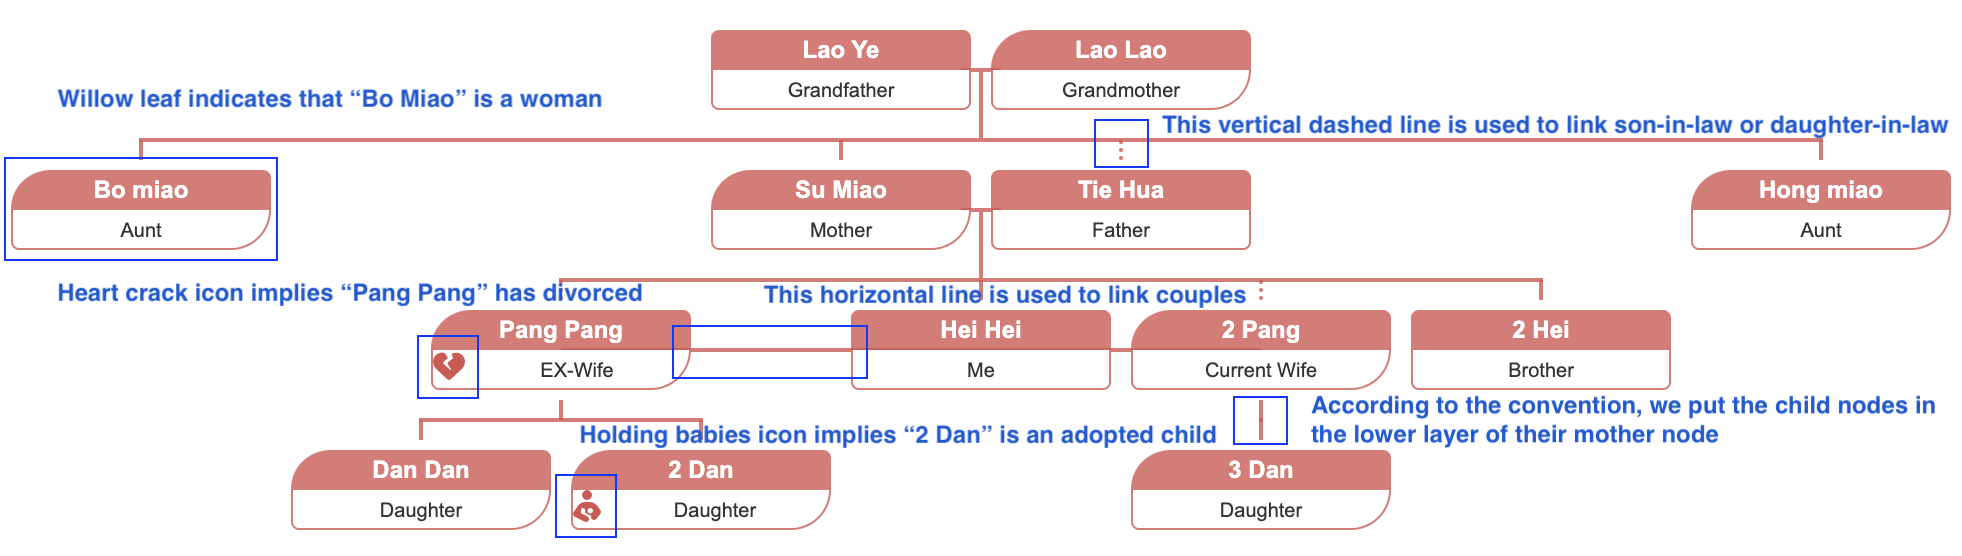
- package/demo/family-tree.html +100 -0
- package/demo/familytree-custom-properties.html +108 -0
- package/demo/filter-node.html +104 -57
- package/demo/get-hierarchy.html +17 -12
- package/demo/get-related-nodes.html +27 -17
- package/demo/index.html +7 -4
- package/demo/integrate-map.html +32 -27
- package/demo/left2right.html +12 -9
- package/demo/level-offset.html +16 -15
- package/demo/link-node.html +12 -9
- package/demo/local-datasource.html +11 -8
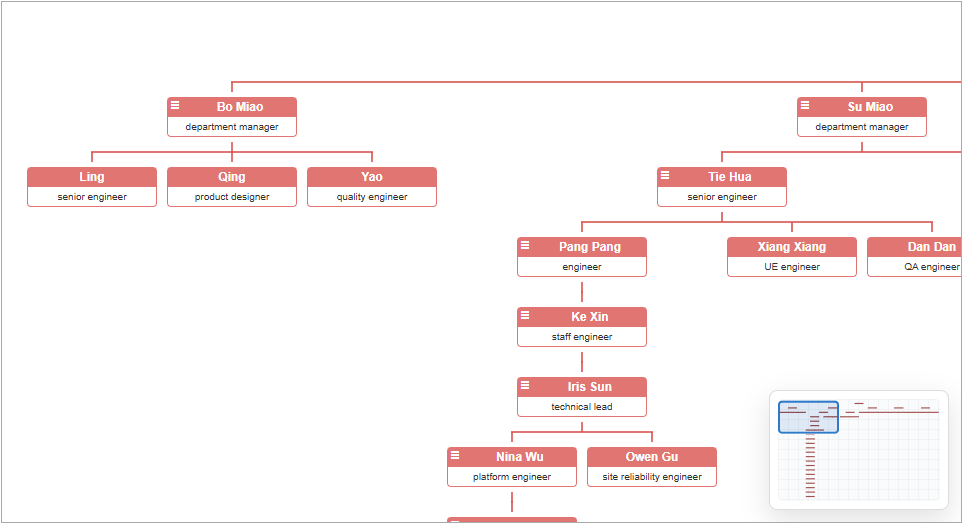
- package/demo/minimap.html +224 -0
- package/demo/nodes-of-different-widths.html +11 -8
- package/demo/ondemand-loading-data.html +88 -91
- package/demo/option-createNode.html +31 -20
- package/demo/pan-zoom.html +20 -11
- package/demo/reload-data.html +17 -14
- package/demo/report-path.html +59 -29
- package/demo/responsive-design.html +14 -11
- package/demo/right2left.html +12 -9
- package/demo/toggle-sibs-resp.html +12 -9
- package/demo/ul-datasource.html +11 -8
- package/demo/vertical-level.html +12 -9
- package/dist/css/{jquery.orgchart.css → orgchart.css} +210 -78
- package/dist/css/orgchart.min.css +1 -0
- package/dist/js/orgchart.js +4101 -0
- package/dist/js/orgchart.min.js +2 -0
- package/dist/js/orgchart.min.js.map +1 -0
- package/gulpfile.js +37 -26
- package/package.json +32 -32
- package/src/css/{jquery.orgchart.css → orgchart.css} +210 -78
- package/src/js/orgchart.js +4101 -0
- package/test/cypress/e2e/demo-interactions.cy.js +91 -0
- package/test/cypress/e2e/demo-rendering.cy.js +100 -0
- package/test/cypress/e2e/drag-drop-hybrid-chart.cy.js +22 -0
- package/test/cypress/e2e/edit-chart.cy.js +20 -0
- package/test/cypress/e2e/level-offset.cy.js +21 -0
- package/test/cypress/e2e/minimap.cy.js +66 -0
- package/test/cypress/e2e/pan-zoom.cy.js +165 -0
- package/test/cypress/e2e/report-path.cy.js +20 -0
- package/test/cypress/e2e/vertical-vevel.cy.js +5 -3
- package/test/e2e/local-datasource/test.js +1 -1
- package/test/integration/init-tests.js +168 -62
- package/test/integration/tests.js +1034 -56
- package/test/unit/lifecycle-builders-export.tests.js +1426 -0
- package/test/unit/minimap.tests.js +210 -0
- package/test/unit/tests.js +2372 -252
- package/demo/multiple-layers.html +0 -128
- package/dist/css/jquery.orgchart.min.css +0 -1
- package/dist/js/jquery.orgchart.js +0 -1686
- package/dist/js/jquery.orgchart.min.js +0 -5
- package/dist/js/jquery.orgchart.min.js.map +0 -1
- package/src/js/jquery.orgchart.js +0 -1686
package/README.md
CHANGED
|
@@ -9,10 +9,12 @@
|
|
|
9
9
|
# [React Version](https://github.com/dabeng/react-orgchart)
|
|
10
10
|
|
|
11
11
|
## Foreword
|
|
12
|
-
First of all, thanks a lot for [wesnolte](https://github.com/wesnolte)'s great work:blush: -- [jOrgChart](https://github.com/wesnolte/jOrgChart). The thought that using nested tables to build out the tree-like
|
|
12
|
+
First of all, thanks a lot for [wesnolte](https://github.com/wesnolte)'s great work:blush: -- [jOrgChart](https://github.com/wesnolte/jOrgChart). The thought that using nested tables to build out the tree-like organization chart is amazing. This idea is more simple and direct than its counterparts based on svg
|
|
13
13
|
Unfortunately, it's long time not to see the update of jOrgChart. on the other hand, I got some interesting ideas to add, so I choose to create a new repo.
|
|
14
14
|
- Since version 3.0, we use nested ul to construct tree-like chart instead of nested table.
|
|
15
15
|
- Since version 4.0, users build up the ajax datasoure by themselves.
|
|
16
|
+
- Since version 5.0, users are allowed to build up the family tree.
|
|
17
|
+
- Since version 6.0, The orgchart component has been reverted to native implementation and no longer relies on jQuery.
|
|
16
18
|
|
|
17
19
|
## Features
|
|
18
20
|
- Supports both local data and remote data (JSON).
|
|
@@ -23,7 +25,7 @@ Unfortunately, it's long time not to see the update of jOrgChart. on the other h
|
|
|
23
25
|
- Supports exporting chart as a picture or pdf document.
|
|
24
26
|
- Supports pan and zoom.
|
|
25
27
|
- Allows user to customize the internal structure for every node.
|
|
26
|
-
- Users can adopt multiple solutions to build up a huge organization chart(please refer
|
|
28
|
+
- Users can adopt multiple solutions to build up a huge organization chart(please refer hybrid layout sections).
|
|
27
29
|
- touch-enabled plugin for mobile device.
|
|
28
30
|
|
|
29
31
|
## CDN
|
|
@@ -32,7 +34,7 @@ Users could find the related CDN support for OrgChart's CSS and JavaScript.
|
|
|
32
34
|
[](https://cdnjs.com/libraries/orgchart) https://cdnjs.com/libraries/orgchart
|
|
33
35
|
|
|
34
36
|
## Installation
|
|
35
|
-
Of course, you can directly use the standalone build by including dist/js/
|
|
37
|
+
Of course, you can directly use the standalone build by including dist/js/orgchart.js and dist/css/orgchart.css in your webapps.
|
|
36
38
|
### Install with Bower
|
|
37
39
|
```
|
|
38
40
|
# From version 1.0.2 on, users can install orgchart and add it to bower.json dependencies
|
|
@@ -44,10 +46,12 @@ $ bower install orgchart
|
|
|
44
46
|
# From version 1.0.4 on, users can install orgchart with npm
|
|
45
47
|
$ npm install orgchart
|
|
46
48
|
```
|
|
47
|
-
require('orgchart')
|
|
49
|
+
In CommonJS environments, `require('orgchart')` exports the `OrgChart` constructor directly.
|
|
50
|
+
|
|
51
|
+
FYI, [How to use jQuery Orchart in React](https://stackblitz.com/edit/vitejs-vite-hqv4nbdt)
|
|
48
52
|
|
|
49
53
|
## [Demos on github pages](https://dabeng.github.io/OrgChart/)
|
|
50
|
-
## [Demos based on nested ul](https://codepen.io/collection/
|
|
54
|
+
## [Demos based on nested ul](https://codepen.io/collection/xKmPeK)
|
|
51
55
|
## [Demos based on nested table](https://codepen.io/collection/AWxGVb/) (obsolete)
|
|
52
56
|
|
|
53
57
|
### online demos
|
|
@@ -119,10 +123,6 @@ That's where getHierarchy() comes in.
|
|
|
119
123
|
|
|
120
124
|
It's a so easy task, we just need to append id or className property to node data.
|
|
121
125
|
|
|
122
|
-
- [I want a multiple-layers chart](https://dabeng.github.io/OrgChart/multiple-layers.html)
|
|
123
|
-
|
|
124
|
-
In fact, this is a wonderful solution to display a orgchart which includes a huge number of node data.
|
|
125
|
-
|
|
126
126
|
- [I want a hybrid(horizontal + vertical) chart](https://dabeng.github.io/OrgChart/vertical-level.html)
|
|
127
127
|
|
|
128
128
|
This feature is inspired by the issues([Aligning Children Vertical](https://github.com/dabeng/OrgChart/issues/46), [Hybrid(horizontal + vertical) OrgChart](https://github.com/dabeng/OrgChart/issues/61)). Thank [mfahadi](https://github.com/mfahadi) and [Destructrix](https://github.com/Destructrix) for their constructive suggestions:blush: Special thanks to [tedliang](https://github.com/tedliang) for his wonderful hybrid mode solution.
|
|
@@ -169,6 +169,57 @@ You need the solution based on new datasource structure with **levelOffset data
|
|
|
169
169
|
|
|
170
170
|
**compact data property** is designed for your use case. Once node data includes a "compact" prop with truthy value, itself and its descendant nodes will be arranged with compact mode.
|
|
171
171
|
|
|
172
|
+
- [ I want to visualize genealogy/pedigree/family tree information](https://dabeng.github.io/OrgChart/family-tree.html)
|
|
173
|
+
|
|
174
|
+

|
|
175
|
+
|
|
176
|
+
We use the following two-dimensional array datasource to build up the Family Tree. Here, prop "gender" is optional.
|
|
177
|
+
```
|
|
178
|
+
var datascource = [
|
|
179
|
+
[
|
|
180
|
+
{ 'id': '8', 'name': 'Lao Ye', 'title': 'Grandfather' },
|
|
181
|
+
{
|
|
182
|
+
'id': '1', 'name': 'Lao Lao', 'title': 'Grandmother', 'outsider': true,
|
|
183
|
+
'children': [
|
|
184
|
+
[
|
|
185
|
+
{ 'id': '2', 'name': 'Bo miao', 'title': 'Aunt' }
|
|
186
|
+
],
|
|
187
|
+
[
|
|
188
|
+
{ 'id': '3', 'name': 'Su Miao', 'title': 'Mother',
|
|
189
|
+
'children': [
|
|
190
|
+
[
|
|
191
|
+
|
|
192
|
+
{ 'id': '12', 'name': 'Pang Pang', 'title': 'Wife', 'outsider': true,
|
|
193
|
+
'children': [
|
|
194
|
+
[{ 'id': '7', 'name': 'Dan Dan', 'title': 'Daughter' }],
|
|
195
|
+
[{ 'id': '6', 'name': 'Er Dan', 'title': 'Daughter' }],
|
|
196
|
+
]
|
|
197
|
+
},
|
|
198
|
+
{ 'id': '5', 'name': 'Hei Hei', 'title': 'Me' },
|
|
199
|
+
]
|
|
200
|
+
]
|
|
201
|
+
},
|
|
202
|
+
{ 'id': '9', 'name': 'Tie Hua', 'title': 'Father', 'outsider': true }
|
|
203
|
+
],
|
|
204
|
+
[
|
|
205
|
+
{ 'id': '10', 'name': 'Hong miao', 'title': 'Aunt' }
|
|
206
|
+
]
|
|
207
|
+
]
|
|
208
|
+
}
|
|
209
|
+
]
|
|
210
|
+
];
|
|
211
|
+
```
|
|
212
|
+
|
|
213
|
+
- [I want to add property tags to family tree](https://dabeng.github.io/OrgChart/familytree-custom-properties.html)
|
|
214
|
+
|
|
215
|
+
|
|
216
|
+
|
|
217
|
+
- [I want to navigate the orgchart with a minimap](https://dabeng.github.io/OrgChart/minimap.html)
|
|
218
|
+
|
|
219
|
+
|
|
220
|
+
|
|
221
|
+
Enable the `minimap` option to display an overview navigator. Drag its viewport to move the chart, or use the mouse wheel over the minimap to zoom.
|
|
222
|
+
|
|
172
223
|
### how to start up demos locally
|
|
173
224
|
|
|
174
225
|
- you have to install node.js v6+ because our unit tests are based on jsdom v11
|
|
@@ -182,7 +233,10 @@ You need the solution based on new datasource structure with **levelOffset data
|
|
|
182
233
|
|
|
183
234
|
### Instantiation Statement
|
|
184
235
|
```js
|
|
185
|
-
var oc =
|
|
236
|
+
var oc = new OrgChart({
|
|
237
|
+
chartContainer: '#chartContainerId',
|
|
238
|
+
data: datasource
|
|
239
|
+
});
|
|
186
240
|
```
|
|
187
241
|
|
|
188
242
|
### Structure of Datasource
|
|
@@ -193,7 +247,7 @@ var oc = $('#chartContainerId').orgchart(options);
|
|
|
193
247
|
'collapsed': true, // By default, the children nodes of current node is hidden.
|
|
194
248
|
'className': 'top-level', // It's a optional property
|
|
195
249
|
// which will be used as className attribute of node.
|
|
196
|
-
'nodeTitle': 'name', // This property is used to retrieve
|
|
250
|
+
'nodeTitle': 'name', // This property is used to retrieve “title†value in datasource
|
|
197
251
|
'nodeContent': 'title',// This property is used to retrieve "content" value in datasource
|
|
198
252
|
'relationship': relationshipValue, // Note: when you activate ondemand loading nodes feature,
|
|
199
253
|
// you should use json datsource (local or remote) and set this property.
|
|
@@ -253,10 +307,10 @@ var oc = $('#chartContainerId').orgchart(options);
|
|
|
253
307
|
<tbody>
|
|
254
308
|
<tr>
|
|
255
309
|
<td>data</td>
|
|
256
|
-
<td>json or
|
|
310
|
+
<td>json or HTMLUListElement</td>
|
|
257
311
|
<td>yes</td>
|
|
258
312
|
<td></td>
|
|
259
|
-
<td>datasource
|
|
313
|
+
<td>datasource used to build out structure of orgchart. It can be a json object or an HTML ul element.</td>
|
|
260
314
|
</tr>
|
|
261
315
|
<tr>
|
|
262
316
|
<td>pan</td>
|
|
@@ -354,7 +408,7 @@ var oc = $('#chartContainerId').orgchart(options);
|
|
|
354
408
|
<td>function</td>
|
|
355
409
|
<td>no</td>
|
|
356
410
|
<td></td>
|
|
357
|
-
<td>It's a callback function used to customize every orgchart node. It receives two parameters: "
|
|
411
|
+
<td>It's a callback function used to customize every orgchart node. It receives two parameters: "node" stands for the single node element; "data" stands for datasource of single node.</td>
|
|
358
412
|
</tr>
|
|
359
413
|
<tr>
|
|
360
414
|
<td>exportButton</td>
|
|
@@ -410,7 +464,7 @@ var oc = $('#chartContainerId').orgchart(options);
|
|
|
410
464
|
<td>function</td>
|
|
411
465
|
<td>no</td>
|
|
412
466
|
<td></td>
|
|
413
|
-
<td>It can often be useful to know when your table has fully been initialised, data loaded and rendered. It receives one
|
|
467
|
+
<td>It can often be useful to know when your table has fully been initialised, data loaded and rendered. It receives one parameter: "chart" stands for the initialized chart element.</td>
|
|
414
468
|
</tr>
|
|
415
469
|
<tr>
|
|
416
470
|
<td>icons</td>
|
|
@@ -445,14 +499,48 @@ var oc = $('#chartContainerId').orgchart(options);
|
|
|
445
499
|
</table>
|
|
446
500
|
|
|
447
501
|
### Methods
|
|
448
|
-
|
|
502
|
+
Create an instance with `new OrgChart(options)`. Its `chartContainer` and `chart` properties expose the native container and rendered chart elements.
|
|
503
|
+
|
|
504
|
+
```js
|
|
505
|
+
const oc = new OrgChart({ chartContainer: '#chartContainerId', data: datasource });
|
|
506
|
+
```
|
|
449
507
|
|
|
450
|
-
|
|
451
|
-
|
|
508
|
+
The public API is: `init`, `setOptions`, `attachMinimap`, `detachMinimap`, `updateMinimap`, `addAncestors`, `addDescendants`, `addParent`, `addSiblings`, `addChildren`, `removeNodes`, `getHierarchy`, `getNodeState`, `getParent`, `getChildren`, `getSiblings`, `getRelatedNodes`, `hideParent`, `showParent`, `hideChildren`, `showChildren`, `hideSiblings`, `showSiblings`, `setChartScale`, `export`, `exportPNG`, and `exportPDF`. Arguments that refer to nodes or charts are native `HTMLElement` instances.
|
|
509
|
+
|
|
510
|
+
#### API reference
|
|
511
|
+
| Call | Parameters | Return value and behavior |
|
|
512
|
+
| --- | --- | --- |
|
|
513
|
+
| `oc.init(options)` | Partial options object; use `data` to replace the data source. | Rebuilds the chart and returns `oc`. |
|
|
514
|
+
| `oc.setOptions(options)`<br>`oc.setOptions(name, value)` | Object containing `data`, `pan`, `zoom`, or `minimap`; or one of the supported names with a boolean value. | Rebuilds for `data`; toggles pan, zoom, or minimap otherwise; returns `oc`. |
|
|
515
|
+
| `oc.attachMinimap()`<br>`oc.detachMinimap()`<br>`oc.updateMinimap(forceRefresh)` | `forceRefresh` is optional; `true` redraws preview nodes. | Creates, removes, or refreshes the minimap. Prefer `setOptions('minimap', value)` for normal enablement. |
|
|
516
|
+
| `oc.addAncestors(data, parentId)` | Ancestor data and the id of the ancestor node that receives the existing root. | Inserts ancestor hierarchy; no return value. |
|
|
517
|
+
| `oc.addDescendants(data, parent)` | Array of descendant data and a rendered parent `.node`. | Appends descendant hierarchy; no return value. |
|
|
518
|
+
| `oc.addParent(currentRoot, data)` | Rendered root `.node` and its new parent data. | Wraps the current root with a parent; no return value. |
|
|
519
|
+
| `oc.addSiblings(node, data)`<br>`oc.addChildren(node, data)` | Rendered `.node` and an array of sibling or child data. | Adds rendered nodes; no return value. |
|
|
520
|
+
| `oc.removeNodes(node)` | Rendered `.node` to remove. | Removes the node and its descendants; no return value. |
|
|
521
|
+
| `oc.getHierarchy(includeNodeData)` | Optional boolean, default `false`. | Returns the hierarchy object; returns an error string when the chart or required node ids are unavailable. |
|
|
522
|
+
| `oc.getNodeState(node, relation)` | Rendered `.node`; `relation` is `parent`, `children`, or `siblings`. | Returns `{ exist, visible }`. |
|
|
523
|
+
| `oc.getParent(node)` | Rendered `.node`. | Returns its parent `.node`, or `null`. |
|
|
524
|
+
| `oc.getChildren(node)`<br>`oc.getSiblings(node)` | Rendered `.node`. | Returns an array of direct child or sibling `.node` elements. |
|
|
525
|
+
| `oc.getRelatedNodes(node, relation)` | Rendered `.node`; `relation` is `parent`, `children`, or `siblings`. | Equivalent generalized query; parent returns a node or `null`, other relations return arrays. |
|
|
526
|
+
| `oc.hideParent(node)` / `oc.showParent(node)`<br>`oc.hideChildren(node)` / `oc.showChildren(node)` | Rendered `.node`. | Hides or reveals the related branch with the chart transition; no return value. |
|
|
527
|
+
| `oc.hideSiblings(node, direction)`<br>`oc.showSiblings(node, direction)` | Rendered `.node`; optional `direction` is `left` or `right`. | Hides or reveals siblings on one side, or all siblings when omitted; no return value. |
|
|
528
|
+
| `oc.setChartScale(chart, multiplier, zoomAnchor)` | Usually pass `oc.chart`; positive relative scale multiplier; optional viewport point `{ x, y }`. | Scales within configured zoom limits and keeps `zoomAnchor` fixed when supplied. |
|
|
529
|
+
| `oc.export(filename, extension)` | Optional filename and `png` or `pdf` extension. | Starts export using configured defaults; returns `false` if the chart cannot be exported. |
|
|
530
|
+
| `oc.exportPNG(canvas, filename)`<br>`oc.exportPDF(canvas, filename, exportScale)` | Prepared canvas; filename; PDF scale defaults to `1`. | Downloads the supplied canvas directly as PNG or PDF; normally call `export()` instead. |
|
|
452
531
|
|
|
453
532
|
#### init(newOptions)
|
|
454
533
|
It's the useful way when users want to re-initialize or refresh orgchart based on new options or reload new data.
|
|
455
534
|
|
|
535
|
+
#### setOptions(options) / setOptions(name, value)
|
|
536
|
+
Updates `pan`, `zoom`, or `minimap` without rebuilding the chart. Pass an options object, or a supported option name and boolean value. Passing an object containing `data` rebuilds the chart.
|
|
537
|
+
|
|
538
|
+
#### attachMinimap() / detachMinimap()
|
|
539
|
+
Creates or removes the minimap overlay for the current chart. Usually use `setOptions('minimap', true|false)` so the option state and overlay stay synchronized.
|
|
540
|
+
|
|
541
|
+
#### updateMinimap(forceRefresh)
|
|
542
|
+
Recalculates the minimap viewport after changing the chart transform or layout. Pass `true` to redraw the minimap node preview.
|
|
543
|
+
|
|
456
544
|
#### addAncestors(data, parentId)
|
|
457
545
|
Adds the ancestors for current orgchart.
|
|
458
546
|
<table>
|
|
@@ -483,7 +571,7 @@ Adds the ancestors for current orgchart.
|
|
|
483
571
|
</tbody>
|
|
484
572
|
</table>
|
|
485
573
|
|
|
486
|
-
#### addDescendants(data,
|
|
574
|
+
#### addDescendants(data, parent)
|
|
487
575
|
Adds the descendants for specified parent node.
|
|
488
576
|
<table>
|
|
489
577
|
<thead>
|
|
@@ -504,16 +592,16 @@ Adds the descendants for specified parent node.
|
|
|
504
592
|
<td>datasource for building descendants</td>
|
|
505
593
|
</tr>
|
|
506
594
|
<tr>
|
|
507
|
-
<td
|
|
508
|
-
<td>
|
|
595
|
+
<td>parent</td>
|
|
596
|
+
<td>HTMLElement</td>
|
|
509
597
|
<td>yes</td>
|
|
510
598
|
<td></td>
|
|
511
|
-
<td>append descendants to the
|
|
599
|
+
<td>append descendants to the parent node</td>
|
|
512
600
|
</tr>
|
|
513
601
|
</tbody>
|
|
514
602
|
</table>
|
|
515
603
|
|
|
516
|
-
#### addParent(data)
|
|
604
|
+
#### addParent(currentRoot, data)
|
|
517
605
|
Adds parent node(actullay it's always root node) for current orgchart.
|
|
518
606
|
<table>
|
|
519
607
|
<thead>
|
|
@@ -526,6 +614,13 @@ Adds parent node(actullay it's always root node) for current orgchart.
|
|
|
526
614
|
</tr>
|
|
527
615
|
</thead>
|
|
528
616
|
<tbody>
|
|
617
|
+
<tr>
|
|
618
|
+
<td>currentRoot</td>
|
|
619
|
+
<td>HTMLElement</td>
|
|
620
|
+
<td>yes</td>
|
|
621
|
+
<td></td>
|
|
622
|
+
<td>current root node that the new parent node will wrap</td>
|
|
623
|
+
</tr>
|
|
529
624
|
<tr>
|
|
530
625
|
<td>data</td>
|
|
531
626
|
<td>json object</td>
|
|
@@ -536,7 +631,7 @@ Adds parent node(actullay it's always root node) for current orgchart.
|
|
|
536
631
|
</tbody>
|
|
537
632
|
</table>
|
|
538
633
|
|
|
539
|
-
#### addSiblings(
|
|
634
|
+
#### addSiblings(node, data)
|
|
540
635
|
Adds sibling nodes for designated node.
|
|
541
636
|
<table>
|
|
542
637
|
<thead>
|
|
@@ -550,8 +645,8 @@ Adds sibling nodes for designated node.
|
|
|
550
645
|
</thead>
|
|
551
646
|
<tbody>
|
|
552
647
|
<tr>
|
|
553
|
-
<td
|
|
554
|
-
<td>
|
|
648
|
+
<td>node</td>
|
|
649
|
+
<td>HTMLElement</td>
|
|
555
650
|
<td>yes</td>
|
|
556
651
|
<td></td>
|
|
557
652
|
<td>we'll add sibling nodes based on this node</td>
|
|
@@ -566,7 +661,7 @@ Adds sibling nodes for designated node.
|
|
|
566
661
|
</tbody>
|
|
567
662
|
</table>
|
|
568
663
|
|
|
569
|
-
#### addChildren(
|
|
664
|
+
#### addChildren(node, data)
|
|
570
665
|
Adds child nodes for designed node.
|
|
571
666
|
<table>
|
|
572
667
|
<thead>
|
|
@@ -580,8 +675,8 @@ Adds child nodes for designed node.
|
|
|
580
675
|
</thead>
|
|
581
676
|
<tbody>
|
|
582
677
|
<tr>
|
|
583
|
-
<td
|
|
584
|
-
<td>
|
|
678
|
+
<td>node</td>
|
|
679
|
+
<td>HTMLElement</td>
|
|
585
680
|
<td>yes</td>
|
|
586
681
|
<td></td>
|
|
587
682
|
<td>we'll add child nodes based on this node</td>
|
|
@@ -596,7 +691,7 @@ Adds child nodes for designed node.
|
|
|
596
691
|
</tbody>
|
|
597
692
|
</table>
|
|
598
693
|
|
|
599
|
-
#### removeNodes(
|
|
694
|
+
#### removeNodes(node)
|
|
600
695
|
Removes the designated node and its descedant nodes.
|
|
601
696
|
<table>
|
|
602
697
|
<thead>
|
|
@@ -610,8 +705,8 @@ Removes the designated node and its descedant nodes.
|
|
|
610
705
|
</thead>
|
|
611
706
|
<tbody>
|
|
612
707
|
<tr>
|
|
613
|
-
<td
|
|
614
|
-
<td>
|
|
708
|
+
<td>node</td>
|
|
709
|
+
<td>HTMLElement</td>
|
|
615
710
|
<td>yes</td>
|
|
616
711
|
<td></td>
|
|
617
712
|
<td>node to be removed</td>
|
|
@@ -638,7 +733,7 @@ This method is designed to get the hierarchy relationships of orgchart for furth
|
|
|
638
733
|
</tr>
|
|
639
734
|
</table>
|
|
640
735
|
|
|
641
|
-
#### hideParent(
|
|
736
|
+
#### hideParent(node)
|
|
642
737
|
This method allows you to hide programatically the parent node of any specific node(.node element), if it has.
|
|
643
738
|
<table>
|
|
644
739
|
<tr>
|
|
@@ -649,15 +744,15 @@ This method allows you to hide programatically the parent node of any specific n
|
|
|
649
744
|
<th>Description</th>
|
|
650
745
|
</tr>
|
|
651
746
|
<tr>
|
|
652
|
-
<td
|
|
653
|
-
<td>
|
|
747
|
+
<td>node</td>
|
|
748
|
+
<td>HTMLElement</td>
|
|
654
749
|
<td>Yes</td>
|
|
655
750
|
<td></td>
|
|
656
|
-
<td>It
|
|
751
|
+
<td>It is the node element whose parent node should be hidden. Its sibling nodes will be hidden at the same time.</td>
|
|
657
752
|
</tr>
|
|
658
753
|
</table>
|
|
659
754
|
|
|
660
|
-
#### showParent(
|
|
755
|
+
#### showParent(node)
|
|
661
756
|
This method allows you to show programatically the parent node of any specific node(.node element), if it has.
|
|
662
757
|
<table>
|
|
663
758
|
<tr>
|
|
@@ -668,15 +763,15 @@ This method allows you to show programatically the parent node of any specific n
|
|
|
668
763
|
<th>Description</th>
|
|
669
764
|
</tr>
|
|
670
765
|
<tr>
|
|
671
|
-
<td
|
|
672
|
-
<td>
|
|
766
|
+
<td>node</td>
|
|
767
|
+
<td>HTMLElement</td>
|
|
673
768
|
<td>Yes</td>
|
|
674
769
|
<td></td>
|
|
675
|
-
<td>It
|
|
770
|
+
<td>It is the node element whose parent node should be shown</td>
|
|
676
771
|
</tr>
|
|
677
772
|
</table>
|
|
678
773
|
|
|
679
|
-
#### hideChildren(
|
|
774
|
+
#### hideChildren(node)
|
|
680
775
|
This method allows you to hide programatically the children of any specific node(.node element), if it has.
|
|
681
776
|
<table>
|
|
682
777
|
<tr>
|
|
@@ -687,15 +782,15 @@ This method allows you to hide programatically the children of any specific node
|
|
|
687
782
|
<th>Description</th>
|
|
688
783
|
</tr>
|
|
689
784
|
<tr>
|
|
690
|
-
<td
|
|
691
|
-
<td>
|
|
785
|
+
<td>node</td>
|
|
786
|
+
<td>HTMLElement</td>
|
|
692
787
|
<td>Yes</td>
|
|
693
788
|
<td></td>
|
|
694
|
-
<td>It
|
|
789
|
+
<td>It is the node element whose child nodes should be hidden</td>
|
|
695
790
|
</tr>
|
|
696
791
|
</table>
|
|
697
792
|
|
|
698
|
-
#### showChildren(
|
|
793
|
+
#### showChildren(node)
|
|
699
794
|
This method allows you to show programatically the children of any specific node(.node element), if it has.
|
|
700
795
|
<table>
|
|
701
796
|
<tr>
|
|
@@ -706,15 +801,15 @@ This method allows you to show programatically the children of any specific node
|
|
|
706
801
|
<th>Description</th>
|
|
707
802
|
</tr>
|
|
708
803
|
<tr>
|
|
709
|
-
<td
|
|
710
|
-
<td>
|
|
804
|
+
<td>node</td>
|
|
805
|
+
<td>HTMLElement</td>
|
|
711
806
|
<td>Yes</td>
|
|
712
807
|
<td></td>
|
|
713
|
-
<td>It
|
|
808
|
+
<td>It is the node element whose child nodes should be shown</td>
|
|
714
809
|
</tr>
|
|
715
810
|
</table>
|
|
716
811
|
|
|
717
|
-
#### hideSiblings(
|
|
812
|
+
#### hideSiblings(node, direction)
|
|
718
813
|
This method allows you to hide programatically the siblings of any specific node(.node element), if it has.
|
|
719
814
|
<table>
|
|
720
815
|
<tr>
|
|
@@ -725,11 +820,11 @@ This method allows you to hide programatically the siblings of any specific node
|
|
|
725
820
|
<th>Description</th>
|
|
726
821
|
</tr>
|
|
727
822
|
<tr>
|
|
728
|
-
<td
|
|
729
|
-
<td>
|
|
823
|
+
<td>node</td>
|
|
824
|
+
<td>HTMLElement</td>
|
|
730
825
|
<td>Yes</td>
|
|
731
826
|
<td></td>
|
|
732
|
-
<td>It
|
|
827
|
+
<td>It is the node element whose sibling nodes should be hidden</td>
|
|
733
828
|
</tr>
|
|
734
829
|
<tr>
|
|
735
830
|
<td>direction</td>
|
|
@@ -740,7 +835,7 @@ This method allows you to hide programatically the siblings of any specific node
|
|
|
740
835
|
</tr>
|
|
741
836
|
</table>
|
|
742
837
|
|
|
743
|
-
#### showSiblings(
|
|
838
|
+
#### showSiblings(node, direction)
|
|
744
839
|
This method allows you to show programatically the siblings of any specific node(.node element), if it has.
|
|
745
840
|
<table>
|
|
746
841
|
<tr>
|
|
@@ -751,11 +846,11 @@ This method allows you to show programatically the siblings of any specific node
|
|
|
751
846
|
<th>Description</th>
|
|
752
847
|
</tr>
|
|
753
848
|
<tr>
|
|
754
|
-
<td
|
|
755
|
-
<td>
|
|
849
|
+
<td>node</td>
|
|
850
|
+
<td>HTMLElement</td>
|
|
756
851
|
<td>Yes</td>
|
|
757
852
|
<td></td>
|
|
758
|
-
<td>It
|
|
853
|
+
<td>It is the node element whose sibling nodes should be shown</td>
|
|
759
854
|
</tr>
|
|
760
855
|
<tr>
|
|
761
856
|
<td>direction</td>
|
|
@@ -766,7 +861,7 @@ This method allows you to show programatically the siblings of any specific node
|
|
|
766
861
|
</tr>
|
|
767
862
|
</table>
|
|
768
863
|
|
|
769
|
-
#### getNodeState(
|
|
864
|
+
#### getNodeState(node, relation)
|
|
770
865
|
This method returns you the display state of related node of the specified node.
|
|
771
866
|
<table>
|
|
772
867
|
<tr>
|
|
@@ -777,11 +872,11 @@ This method returns you the display state of related node of the specified node.
|
|
|
777
872
|
<th>Description</th>
|
|
778
873
|
</tr>
|
|
779
874
|
<tr>
|
|
780
|
-
<td
|
|
781
|
-
<td>
|
|
875
|
+
<td>node</td>
|
|
876
|
+
<td>HTMLElement</td>
|
|
782
877
|
<td>Yes</td>
|
|
783
878
|
<td></td>
|
|
784
|
-
<td>It
|
|
879
|
+
<td>It is the node element whose related nodes' display state you want to inspect.</td>
|
|
785
880
|
</tr>
|
|
786
881
|
<tr>
|
|
787
882
|
<td>relation</td>
|
|
@@ -800,7 +895,7 @@ The returning object will have the following structure:
|
|
|
800
895
|
}
|
|
801
896
|
```
|
|
802
897
|
|
|
803
|
-
#### getRelatedNodes(
|
|
898
|
+
#### getRelatedNodes(node, relation)
|
|
804
899
|
This method returns you the nodes related to the specified node.
|
|
805
900
|
<table>
|
|
806
901
|
<tr>
|
|
@@ -811,11 +906,11 @@ This method returns you the nodes related to the specified node.
|
|
|
811
906
|
<th>Description</th>
|
|
812
907
|
</tr>
|
|
813
908
|
<tr>
|
|
814
|
-
<td
|
|
815
|
-
<td>
|
|
909
|
+
<td>node</td>
|
|
910
|
+
<td>HTMLElement</td>
|
|
816
911
|
<td>Yes</td>
|
|
817
912
|
<td></td>
|
|
818
|
-
<td>It
|
|
913
|
+
<td>It is the node element whose related nodes you want to inspect</td>
|
|
819
914
|
</tr>
|
|
820
915
|
<tr>
|
|
821
916
|
<td>relation</td>
|
|
@@ -826,7 +921,7 @@ This method returns you the nodes related to the specified node.
|
|
|
826
921
|
</tr>
|
|
827
922
|
</table>
|
|
828
923
|
|
|
829
|
-
#### getParent(
|
|
924
|
+
#### getParent(node)
|
|
830
925
|
This method returns you the parent node of the specified node.
|
|
831
926
|
<table>
|
|
832
927
|
<tr>
|
|
@@ -837,15 +932,15 @@ This method returns you the parent node of the specified node.
|
|
|
837
932
|
<th>Description</th>
|
|
838
933
|
</tr>
|
|
839
934
|
<tr>
|
|
840
|
-
<td
|
|
841
|
-
<td>
|
|
935
|
+
<td>node</td>
|
|
936
|
+
<td>HTMLElement</td>
|
|
842
937
|
<td>Yes</td>
|
|
843
938
|
<td></td>
|
|
844
|
-
<td>It
|
|
939
|
+
<td>It is the node element whose parent node you want to inspect</td>
|
|
845
940
|
</tr>
|
|
846
941
|
</table>
|
|
847
942
|
|
|
848
|
-
#### getSiblings(
|
|
943
|
+
#### getSiblings(node)
|
|
849
944
|
This method returns you the sibling nodes of the specified node.
|
|
850
945
|
<table>
|
|
851
946
|
<tr>
|
|
@@ -856,15 +951,15 @@ This method returns you the sibling nodes of the specified node.
|
|
|
856
951
|
<th>Description</th>
|
|
857
952
|
</tr>
|
|
858
953
|
<tr>
|
|
859
|
-
<td
|
|
860
|
-
<td>
|
|
954
|
+
<td>node</td>
|
|
955
|
+
<td>HTMLElement</td>
|
|
861
956
|
<td>Yes</td>
|
|
862
957
|
<td></td>
|
|
863
|
-
<td>It
|
|
958
|
+
<td>It is the node element whose sibling nodes you want to inspect</td>
|
|
864
959
|
</tr>
|
|
865
960
|
</table>
|
|
866
961
|
|
|
867
|
-
#### getChildren(
|
|
962
|
+
#### getChildren(node)
|
|
868
963
|
This method returns you the child nodes of the specified node.
|
|
869
964
|
<table>
|
|
870
965
|
<tr>
|
|
@@ -875,16 +970,18 @@ This method returns you the child nodes of the specified node.
|
|
|
875
970
|
<th>Description</th>
|
|
876
971
|
</tr>
|
|
877
972
|
<tr>
|
|
878
|
-
<td
|
|
879
|
-
<td>
|
|
973
|
+
<td>node</td>
|
|
974
|
+
<td>HTMLElement</td>
|
|
880
975
|
<td>Yes</td>
|
|
881
976
|
<td></td>
|
|
882
|
-
<td>It
|
|
977
|
+
<td>It is the node element whose child nodes you want to inspect</td>
|
|
883
978
|
</tr>
|
|
884
979
|
</table>
|
|
885
980
|
|
|
886
|
-
#### setChartScale(
|
|
981
|
+
#### setChartScale(chart, newScale, zoomAnchor)
|
|
887
982
|
This method helps you set the specified chart with new scale.
|
|
983
|
+
|
|
984
|
+
`zoomAnchor` is optional and has the form `{ x, y }` in viewport coordinates. When provided, that point remains fixed while the chart is scaled.
|
|
888
985
|
<table>
|
|
889
986
|
<tr>
|
|
890
987
|
<th>Name</th>
|
|
@@ -894,11 +991,11 @@ This method helps you set the specified chart with new scale.
|
|
|
894
991
|
<th>Description</th>
|
|
895
992
|
</tr>
|
|
896
993
|
<tr>
|
|
897
|
-
<td
|
|
898
|
-
<td>
|
|
994
|
+
<td>chart</td>
|
|
995
|
+
<td>HTMLElement</td>
|
|
899
996
|
<td>Yes</td>
|
|
900
997
|
<td></td>
|
|
901
|
-
<td>It
|
|
998
|
+
<td>It is the chart element in your chart-container</td>
|
|
902
999
|
</tr>
|
|
903
1000
|
<tr>
|
|
904
1001
|
<td>newScale</td>
|
|
@@ -935,7 +1032,21 @@ This method allow you to export current orgchart as png or pdf file.
|
|
|
935
1032
|
</tr>
|
|
936
1033
|
</table>
|
|
937
1034
|
|
|
1035
|
+
#### exportPNG(canvas, exportFilename)
|
|
1036
|
+
Exports a prepared canvas as a PNG download. This helper is useful when application code supplies its own canvas; most users should call `export()` instead.
|
|
1037
|
+
|
|
1038
|
+
#### exportPDF(canvas, exportFilename, exportScale)
|
|
1039
|
+
Exports a prepared canvas as a PDF download. `exportScale` is the canvas render scale and is used to preserve the PDF's logical dimensions; most users should call `export()` instead.
|
|
1040
|
+
|
|
938
1041
|
### Events
|
|
1042
|
+
OrgChart dispatches bubbling native `CustomEvent` objects. Subscribe with `addEventListener`; event payloads are available on `event.detail`.
|
|
1043
|
+
|
|
1044
|
+
```js
|
|
1045
|
+
oc.chart.addEventListener('nodedrop.orgchart', function (event) {
|
|
1046
|
+
const { draggedNode, dragZone, dropZone } = event.detail;
|
|
1047
|
+
});
|
|
1048
|
+
```
|
|
1049
|
+
|
|
939
1050
|
<table>
|
|
940
1051
|
<thead>
|
|
941
1052
|
<tr>
|
|
@@ -947,23 +1058,28 @@ This method allow you to export current orgchart as png or pdf file.
|
|
|
947
1058
|
<tbody>
|
|
948
1059
|
<tr>
|
|
949
1060
|
<td>nodedrop.orgchart</td>
|
|
950
|
-
<td>draggedNode, dragZone, dropZone</td>
|
|
951
|
-
<td>
|
|
1061
|
+
<td><code>event.detail</code>: draggedNode, dragZone, dropZone</td>
|
|
1062
|
+
<td>Fires on the chart before a node is moved. Call <code>event.preventDefault()</code> to cancel the drop.</td>
|
|
1063
|
+
</tr>
|
|
1064
|
+
<tr>
|
|
1065
|
+
<td>otherdropped.orgchart</td>
|
|
1066
|
+
<td><code>event.detail</code>: draggedItem, dropZone</td>
|
|
1067
|
+
<td>Fires on the chart when a non-OrgChart draggable item is dropped onto a node.</td>
|
|
952
1068
|
</tr>
|
|
953
1069
|
<tr>
|
|
954
1070
|
<td>init.orgchart</td>
|
|
955
|
-
<td>chart</td>
|
|
956
|
-
<td>
|
|
1071
|
+
<td>None; <code>event.target</code> is the chart element</td>
|
|
1072
|
+
<td>Fires after the chart has been rendered.</td>
|
|
957
1073
|
</tr>
|
|
958
1074
|
<tr>
|
|
959
1075
|
<td>show-[relation].orgchart</td>
|
|
960
1076
|
<td></td>
|
|
961
|
-
<td>
|
|
1077
|
+
<td>Fires on the node when related nodes become visible. <code>relation</code> is parent, children, or siblings.</td>
|
|
962
1078
|
</tr>
|
|
963
1079
|
<tr>
|
|
964
1080
|
<td>hide-[relation].orgchart</td>
|
|
965
1081
|
<td></td>
|
|
966
|
-
<td>
|
|
1082
|
+
<td>Fires on the node when related nodes are hidden. <code>relation</code> is parent, children, or siblings.</td>
|
|
967
1083
|
</tr>
|
|
968
1084
|
</tbody>
|
|
969
1085
|
</table>
|
|
@@ -974,9 +1090,9 @@ This use case is inspired by the [issue](https://github.com/dabeng/OrgChart/issu
|
|
|
974
1090
|
|
|
975
1091
|
Users can enable/disable exapand/collapse feature with className "noncollapsable" as shown below.
|
|
976
1092
|
```js
|
|
977
|
-
|
|
1093
|
+
oc.chart.classList.add('noncollapsable'); // deactivate
|
|
978
1094
|
|
|
979
|
-
|
|
1095
|
+
oc.chart.classList.remove('noncollapsable'); // activate
|
|
980
1096
|
```
|
|
981
1097
|
|
|
982
1098
|
#### Why is the root node gone?
|
|
@@ -985,7 +1101,7 @@ For details, please refer to the [issue](https://github.com/dabeng/OrgChart/issu
|
|
|
985
1101
|
|
|
986
1102
|
Users can embed any clear up logics into the click handler of the reset buttton as shown below.
|
|
987
1103
|
```js
|
|
988
|
-
|
|
1104
|
+
oc.chart.style.transform = ''; // remove transform settings
|
|
989
1105
|
```
|
|
990
1106
|
|
|
991
1107
|
## Browser Compatibility
|