math-exercises 3.0.191 → 3.0.193
This diff represents the content of publicly available package versions that have been released to one of the supported registries. The information contained in this diff is provided for informational purposes only and reflects changes between package versions as they appear in their respective public registries.
- package/lib/exercises/math/dataRepresentations/barChart/barChartInterpreting.d.ts +53 -0
- package/lib/exercises/math/dataRepresentations/barChart/barChartInterpreting.d.ts.map +1 -0
- package/lib/exercises/math/dataRepresentations/barChart/barChartInterpreting.js +543 -0
- package/lib/exercises/math/dataRepresentations/barChart/barChartReading.d.ts +94 -0
- package/lib/exercises/math/dataRepresentations/barChart/barChartReading.d.ts.map +1 -0
- package/lib/exercises/math/dataRepresentations/barChart/barChartReading.js +280 -0
- package/lib/exercises/math/dataRepresentations/barChart/index.d.ts +3 -0
- package/lib/exercises/math/dataRepresentations/barChart/index.d.ts.map +1 -0
- package/lib/exercises/math/dataRepresentations/barChart/index.js +2 -0
- package/lib/exercises/math/dataRepresentations/boxPlot/boxPlotInterpreting.d.ts +7 -0
- package/lib/exercises/math/dataRepresentations/boxPlot/boxPlotInterpreting.d.ts.map +1 -0
- package/lib/exercises/math/dataRepresentations/boxPlot/boxPlotInterpreting.js +223 -0
- package/lib/exercises/math/dataRepresentations/boxPlot/boxPlotReading.d.ts +9 -0
- package/lib/exercises/math/dataRepresentations/boxPlot/boxPlotReading.d.ts.map +1 -0
- package/lib/exercises/math/dataRepresentations/boxPlot/boxPlotReading.js +133 -0
- package/lib/exercises/math/dataRepresentations/boxPlot/boxPlotReadingPercentages.d.ts +11 -0
- package/lib/exercises/math/dataRepresentations/boxPlot/boxPlotReadingPercentages.d.ts.map +1 -0
- package/lib/exercises/math/dataRepresentations/boxPlot/boxPlotReadingPercentages.js +198 -0
- package/lib/exercises/math/dataRepresentations/boxPlot/compareBoxPlot.d.ts +13 -0
- package/lib/exercises/math/dataRepresentations/boxPlot/compareBoxPlot.d.ts.map +1 -0
- package/lib/exercises/math/dataRepresentations/boxPlot/compareBoxPlot.js +192 -0
- package/lib/exercises/math/dataRepresentations/boxPlot/index.d.ts +5 -0
- package/lib/exercises/math/dataRepresentations/boxPlot/index.d.ts.map +1 -0
- package/lib/exercises/math/dataRepresentations/boxPlot/index.js +4 -0
- package/lib/exercises/math/dataRepresentations/dataToGraphGraphToData.d.ts.map +1 -1
- package/lib/exercises/math/dataRepresentations/dataToGraphGraphToData.js +1 -1
- package/lib/exercises/math/dataRepresentations/index.d.ts +4 -7
- package/lib/exercises/math/dataRepresentations/index.d.ts.map +1 -1
- package/lib/exercises/math/dataRepresentations/index.js +4 -11
- package/lib/exercises/math/dataRepresentations/tables/buildDoubleTableFromContext.d.ts +7 -0
- package/lib/exercises/math/dataRepresentations/tables/buildDoubleTableFromContext.d.ts.map +1 -0
- package/lib/exercises/math/dataRepresentations/tables/buildDoubleTableFromContext.js +222 -0
- package/lib/exercises/math/dataRepresentations/tables/fillDoubleTable.d.ts +7 -0
- package/lib/exercises/math/dataRepresentations/tables/fillDoubleTable.d.ts.map +1 -0
- package/lib/exercises/math/dataRepresentations/tables/fillDoubleTable.js +187 -0
- package/lib/exercises/math/dataRepresentations/tables/index.d.ts +4 -0
- package/lib/exercises/math/dataRepresentations/tables/index.d.ts.map +1 -0
- package/lib/exercises/math/dataRepresentations/tables/index.js +3 -0
- package/lib/exercises/math/dataRepresentations/tables/tableReading.d.ts +8 -0
- package/lib/exercises/math/dataRepresentations/tables/tableReading.d.ts.map +1 -0
- package/lib/exercises/math/dataRepresentations/tables/tableReading.js +109 -0
- package/lib/exercises/math/derivation/applications/findYearForDecreasingPopulation.d.ts +8 -0
- package/lib/exercises/math/derivation/applications/findYearForDecreasingPopulation.d.ts.map +1 -0
- package/lib/exercises/math/derivation/applications/findYearForDecreasingPopulation.js +145 -0
- package/lib/exercises/math/derivation/applications/index.d.ts +1 -0
- package/lib/exercises/math/derivation/applications/index.d.ts.map +1 -1
- package/lib/exercises/math/derivation/applications/index.js +1 -0
- package/lib/exercises/math/functions/exponentials/computeImageByExponentialFunctionInSituation.d.ts +10 -0
- package/lib/exercises/math/functions/exponentials/computeImageByExponentialFunctionInSituation.d.ts.map +1 -0
- package/lib/exercises/math/functions/exponentials/computeImageByExponentialFunctionInSituation.js +96 -0
- package/lib/exercises/math/functions/exponentials/computeImageByExponentialFunctionWithUnitChange.d.ts +11 -0
- package/lib/exercises/math/functions/exponentials/computeImageByExponentialFunctionWithUnitChange.d.ts.map +1 -0
- package/lib/exercises/math/functions/exponentials/computeImageByExponentialFunctionWithUnitChange.js +116 -0
- package/lib/exercises/math/functions/exponentials/index.d.ts +3 -0
- package/lib/exercises/math/functions/exponentials/index.d.ts.map +1 -1
- package/lib/exercises/math/functions/exponentials/index.js +3 -0
- package/lib/exercises/math/functions/exponentials/modelizeSituationByExponentialFunction.d.ts +9 -0
- package/lib/exercises/math/functions/exponentials/modelizeSituationByExponentialFunction.d.ts.map +1 -0
- package/lib/exercises/math/functions/exponentials/modelizeSituationByExponentialFunction.js +105 -0
- package/lib/exercises/math/functions/exponentials/plausibleExponentialFunctionExpressionFromGraph.js +2 -2
- package/lib/exercises/math/probaStat/conditional/fillTableConditionalProbabilitySituation.d.ts.map +1 -1
- package/lib/exercises/math/probaStat/conditional/fillTableConditionalProbabilitySituation.js +7 -2
- package/lib/exercises/math/probaStat/stats1var/marginalAndConditionalFrequency.d.ts.map +1 -1
- package/lib/exercises/math/probaStat/stats1var/marginalAndConditionalFrequency.js +131 -61
- package/lib/exercises/math/probaStat/stats2var/buildDataTableFromScatterplot.d.ts +8 -0
- package/lib/exercises/math/probaStat/stats2var/buildDataTableFromScatterplot.d.ts.map +1 -0
- package/lib/exercises/math/probaStat/stats2var/buildDataTableFromScatterplot.js +114 -0
- package/lib/exercises/math/probaStat/stats2var/buildScatterPlotFromDataTable.d.ts +8 -0
- package/lib/exercises/math/probaStat/stats2var/buildScatterPlotFromDataTable.d.ts.map +1 -0
- package/lib/exercises/math/probaStat/stats2var/buildScatterPlotFromDataTable.js +110 -0
- package/lib/exercises/math/probaStat/stats2var/index.d.ts +2 -0
- package/lib/exercises/math/probaStat/stats2var/index.d.ts.map +1 -1
- package/lib/exercises/math/probaStat/stats2var/index.js +2 -0
- package/lib/exercises/math/sequences/geometric/graph/compareGeometricReasonWithOneFromGraph.d.ts +8 -0
- package/lib/exercises/math/sequences/geometric/graph/compareGeometricReasonWithOneFromGraph.d.ts.map +1 -0
- package/lib/exercises/math/sequences/geometric/graph/compareGeometricReasonWithOneFromGraph.js +87 -0
- package/lib/exercises/math/sequences/geometric/graph/index.d.ts +4 -1
- package/lib/exercises/math/sequences/geometric/graph/index.d.ts.map +1 -1
- package/lib/exercises/math/sequences/geometric/graph/index.js +4 -1
- package/lib/exercises/math/sequences/geometric/graph/plausibleGeometricSequenceExpressionFromGraph.d.ts +12 -0
- package/lib/exercises/math/sequences/geometric/graph/plausibleGeometricSequenceExpressionFromGraph.d.ts.map +1 -0
- package/lib/exercises/math/sequences/geometric/graph/plausibleGeometricSequenceExpressionFromGraph.js +133 -0
- package/lib/exercises/math/sequences/geometric/graph/readGeometricExpressionFromGraph.d.ts +8 -0
- package/lib/exercises/math/sequences/geometric/graph/readGeometricExpressionFromGraph.d.ts.map +1 -0
- package/lib/exercises/math/sequences/geometric/graph/readGeometricExpressionFromGraph.js +132 -0
- package/lib/exercises/math/sequences/geometric/graph/recognizeGeometricFromGraph.d.ts +11 -0
- package/lib/exercises/math/sequences/geometric/graph/recognizeGeometricFromGraph.d.ts.map +1 -0
- package/lib/exercises/math/sequences/geometric/graph/recognizeGeometricFromGraph.js +137 -0
- package/lib/exercises/math/sequences/geometric/index.d.ts +1 -0
- package/lib/exercises/math/sequences/geometric/index.d.ts.map +1 -1
- package/lib/exercises/math/sequences/geometric/index.js +1 -0
- package/lib/index.d.ts +71 -25
- package/lib/index.d.ts.map +1 -1
- package/package.json +1 -1
|
@@ -0,0 +1,280 @@
|
|
|
1
|
+
import { addValidProp, shuffleProps, tryToAddWrongProp, propWhile, } from "../../../../exercises/exercise.js";
|
|
2
|
+
import { getDistinctQuestions } from "../../../../exercises/utils/getDistinctQuestions.js";
|
|
3
|
+
import { handleVEAError } from "../../../../utils/errors/handleVEAError.js";
|
|
4
|
+
import { randint } from "../../../../math/utils/random/randint.js";
|
|
5
|
+
import { GeogebraConstructor } from "../../../../geogebra/geogebraConstructor.js";
|
|
6
|
+
import { valueParser } from "../../../../tree/parsers/valueParser.js";
|
|
7
|
+
import { random } from "../../../../utils/alea/random.js";
|
|
8
|
+
const getPropositions = (n, { answer, ...identifiers }) => {
|
|
9
|
+
const propositions = [];
|
|
10
|
+
const { data } = identifiers;
|
|
11
|
+
addValidProp(propositions, answer);
|
|
12
|
+
propWhile(propositions, n, () => {
|
|
13
|
+
tryToAddWrongProp(propositions, random(data).frenchify());
|
|
14
|
+
});
|
|
15
|
+
return shuffleProps(propositions, n);
|
|
16
|
+
};
|
|
17
|
+
const getAnswer = (identifiers) => {
|
|
18
|
+
const { data, itemAsked } = identifiers;
|
|
19
|
+
return data[itemAsked].frenchify();
|
|
20
|
+
};
|
|
21
|
+
const getInstruction = (identifiers) => {
|
|
22
|
+
const { labels, itemAsked } = identifiers;
|
|
23
|
+
return `Un producteur trie sa récolte de pommes selon leur diamètre. Le diagramme en bâtons ci-dessous représente ses résultats.
|
|
24
|
+
|
|
25
|
+
Combien de pommes de $${labels[itemAsked]}\\ \\textrm{cm}$ de diamètre le producteur a-t-il récoltées ?
|
|
26
|
+
`;
|
|
27
|
+
};
|
|
28
|
+
const getHint = (identifiers) => {
|
|
29
|
+
const { labels, itemAsked } = identifiers;
|
|
30
|
+
return `Trouve le bâton qui correspond aux pommes de $${labels[itemAsked]}\\ \\textrm{cm}$ et lis la graduation correspondant à sa hauteur.`;
|
|
31
|
+
};
|
|
32
|
+
const getCorrection = (identifiers) => {
|
|
33
|
+
const { labels, itemAsked, data } = identifiers;
|
|
34
|
+
return `Le bâton qui correspond aux pommes de $${labels[itemAsked]}\\ \\textrm{cm}$ est le $${itemAsked + 1}^{\\text{${itemAsked > 0 ? "e" : "er"}}}$ en partant de la gauche.
|
|
35
|
+
La graduation correspondante est $${data[itemAsked].frenchify()}$.
|
|
36
|
+
|
|
37
|
+
Le producteur a récolté $${data[itemAsked].frenchify()}$ pommes de $${labels[itemAsked]}\\ \\textrm{cm}$.
|
|
38
|
+
`;
|
|
39
|
+
};
|
|
40
|
+
const getKeys = () => {
|
|
41
|
+
return [];
|
|
42
|
+
};
|
|
43
|
+
const isAnswerValid = (ans, { answer }) => {
|
|
44
|
+
try {
|
|
45
|
+
const parsed = valueParser(ans);
|
|
46
|
+
if (parsed === false)
|
|
47
|
+
return false;
|
|
48
|
+
const ansNb = answer.unfrenchify();
|
|
49
|
+
return Math.abs(parsed - ansNb) < 20;
|
|
50
|
+
}
|
|
51
|
+
catch (err) {
|
|
52
|
+
return handleVEAError(err);
|
|
53
|
+
}
|
|
54
|
+
};
|
|
55
|
+
const getGGBOptions = (identifiers) => {
|
|
56
|
+
const { labels, data } = identifiers;
|
|
57
|
+
const commands = [
|
|
58
|
+
`B = BarChart({1,2,3,4,5}, {${data.join(",")}}, 0.5)`,
|
|
59
|
+
...labels.map((l, i) => `Text("\\footnotesize ${l}", (${i + 1}, 50), true, true, 0, -1)`),
|
|
60
|
+
`Text("\\footnotesize Diamètre\\ (en \\ cm)", (3, -100), true, true, 0, -1)`,
|
|
61
|
+
`ShowLabel(B,false)`,
|
|
62
|
+
`SetColor(B, "#FE0045AB")`,
|
|
63
|
+
];
|
|
64
|
+
const ggb = new GeogebraConstructor({
|
|
65
|
+
commands,
|
|
66
|
+
gridDistance: [10000, 50],
|
|
67
|
+
fontSize: 16,
|
|
68
|
+
lockedAxesRatio: 1 / 400,
|
|
69
|
+
xAxis: {
|
|
70
|
+
// hideNumbers: true,
|
|
71
|
+
showPositive: true,
|
|
72
|
+
hidden: true,
|
|
73
|
+
},
|
|
74
|
+
yAxis: {
|
|
75
|
+
showPositive: true,
|
|
76
|
+
label: "$\\footnotesize Nombre\\ de\\ pommes$",
|
|
77
|
+
steps: 100,
|
|
78
|
+
},
|
|
79
|
+
});
|
|
80
|
+
return ggb.getOptions({
|
|
81
|
+
coords: [-0.2, 5.2, -300, 1100],
|
|
82
|
+
});
|
|
83
|
+
};
|
|
84
|
+
const getBarChartReadingQuestion = () => {
|
|
85
|
+
const data = [];
|
|
86
|
+
const labels = ["11", "12", "13", "15", "16"];
|
|
87
|
+
for (let i = 0; i < labels.length; i++) {
|
|
88
|
+
data.push(50 *
|
|
89
|
+
randint(1, i < 3 ? 18 : 20, //pour ne pas que les 2 premieres barres touchent le label de l'axe
|
|
90
|
+
data.map((d) => d / 50)));
|
|
91
|
+
}
|
|
92
|
+
const itemAsked = randint(0, 5);
|
|
93
|
+
const identifiers = {
|
|
94
|
+
labels,
|
|
95
|
+
data,
|
|
96
|
+
itemAsked,
|
|
97
|
+
};
|
|
98
|
+
return getQuestionFromIdentifiers(identifiers);
|
|
99
|
+
};
|
|
100
|
+
const getQuestionFromIdentifiers = (identifiers) => {
|
|
101
|
+
const question = {
|
|
102
|
+
answer: getAnswer(identifiers),
|
|
103
|
+
instruction: getInstruction(identifiers),
|
|
104
|
+
keys: getKeys(identifiers),
|
|
105
|
+
answerFormat: "tex",
|
|
106
|
+
identifiers,
|
|
107
|
+
hint: getHint(identifiers),
|
|
108
|
+
correction: getCorrection(identifiers),
|
|
109
|
+
ggbOptions: getGGBOptions(identifiers),
|
|
110
|
+
};
|
|
111
|
+
return question;
|
|
112
|
+
};
|
|
113
|
+
export const barChartReading = {
|
|
114
|
+
id: "barChartReading",
|
|
115
|
+
label: "Lecture d'un diagramme en bâtons",
|
|
116
|
+
isSingleStep: true,
|
|
117
|
+
generator: (nb, opts) => getDistinctQuestions(() => getBarChartReadingQuestion(opts), nb),
|
|
118
|
+
qcmTimer: 60,
|
|
119
|
+
freeTimer: 60,
|
|
120
|
+
getPropositions,
|
|
121
|
+
isAnswerValid,
|
|
122
|
+
subject: "Mathématiques",
|
|
123
|
+
getQuestionFromIdentifiers,
|
|
124
|
+
hasGeogebra: true,
|
|
125
|
+
getHint,
|
|
126
|
+
getCorrection,
|
|
127
|
+
hasHintAndCorrection: true,
|
|
128
|
+
};
|
|
129
|
+
// !signtable
|
|
130
|
+
// const options = { svg: true };
|
|
131
|
+
// const d3n = new D3Node(options);
|
|
132
|
+
// const d3 = d3n.d3;
|
|
133
|
+
// const width = 600;
|
|
134
|
+
// const height = 250;
|
|
135
|
+
// const svg = d3n.createSVG(width, height);
|
|
136
|
+
// // Define table structure
|
|
137
|
+
// const rows = 3;
|
|
138
|
+
// const cols = 5;
|
|
139
|
+
// const cellWidth = 120;
|
|
140
|
+
// const cellHeight = 50;
|
|
141
|
+
// const startX = 50;
|
|
142
|
+
// const startY = 50;
|
|
143
|
+
// // Define table values
|
|
144
|
+
// const headers = ["x", "-\\infty", "-2", "0", "+\\infty"];
|
|
145
|
+
// const firstRow = ["f'(x)", "+", "0", "-", ""];
|
|
146
|
+
// const secondRow = ["f(x)", "\\nearrow", "max", "\\searrow", ""];
|
|
147
|
+
// // Draw table grid
|
|
148
|
+
// for (let r = 0; r < rows; r++) {
|
|
149
|
+
// for (let c = 0; c < cols; c++) {
|
|
150
|
+
// svg
|
|
151
|
+
// .append("rect")
|
|
152
|
+
// .attr("x", startX + c * cellWidth)
|
|
153
|
+
// .attr("y", startY + r * cellHeight)
|
|
154
|
+
// .attr("width", cellWidth)
|
|
155
|
+
// .attr("height", cellHeight)
|
|
156
|
+
// .attr("stroke", "black")
|
|
157
|
+
// .attr("fill", "black");
|
|
158
|
+
// }
|
|
159
|
+
// }
|
|
160
|
+
// // Function to render LaTeX with KaTeX
|
|
161
|
+
// const renderLatex = (formula: any) =>
|
|
162
|
+
// katex.renderToString(formula, { throwOnError: false });
|
|
163
|
+
// // Add LaTeX text using <foreignObject> for proper positioning
|
|
164
|
+
// const addLatexText = (x: any, y: any, latex: any) => {
|
|
165
|
+
// svg
|
|
166
|
+
// .append("foreignObject")
|
|
167
|
+
// .attr("x", x - cellWidth / 2)
|
|
168
|
+
// .attr("y", y - cellHeight / 2)
|
|
169
|
+
// .attr("width", cellWidth)
|
|
170
|
+
// .attr("height", cellHeight)
|
|
171
|
+
// .html(`<div xmlns="http://www.w3.org/1999/xhtml"
|
|
172
|
+
// style="display: flex; align-items: center; justify-content: center; width: 100%; height: 100%;">
|
|
173
|
+
// ${renderLatex(latex)}
|
|
174
|
+
// </div>`);
|
|
175
|
+
// };
|
|
176
|
+
// // Insert header row
|
|
177
|
+
// headers.forEach((text, i) =>
|
|
178
|
+
// addLatexText(startX + i * cellWidth + cellWidth / 2, startY + 25, text),
|
|
179
|
+
// );
|
|
180
|
+
// // Insert first row (derivative sign changes)
|
|
181
|
+
// firstRow.forEach((text, i) =>
|
|
182
|
+
// addLatexText(
|
|
183
|
+
// startX + i * cellWidth + cellWidth / 2,
|
|
184
|
+
// startY + cellHeight + 25,
|
|
185
|
+
// text,
|
|
186
|
+
// ),
|
|
187
|
+
// );
|
|
188
|
+
// // Insert second row (function increasing/decreasing)
|
|
189
|
+
// secondRow.forEach((text, i) =>
|
|
190
|
+
// addLatexText(
|
|
191
|
+
// startX + i * cellWidth + cellWidth / 2,
|
|
192
|
+
// startY + 2 * cellHeight + 25,
|
|
193
|
+
// text,
|
|
194
|
+
// ),
|
|
195
|
+
// );
|
|
196
|
+
/***Final version */
|
|
197
|
+
/**
|
|
198
|
+
*
|
|
199
|
+
* const newspapers = [
|
|
200
|
+
{ name: "Le Figaro", sales: 320000 },
|
|
201
|
+
{ name: "Les Échos", sales: 130000 },
|
|
202
|
+
{ name: "La Croix", sales: 90000 },
|
|
203
|
+
{ name: "L'Équipe", sales: 210000 },
|
|
204
|
+
{ name: "Le Monde", sales: 330000 },
|
|
205
|
+
{ name: "Le Parisien", sales: 270000 },
|
|
206
|
+
{ name: "Libération", sales: 70000 },
|
|
207
|
+
{ name: "L'Humanité", sales: 30000 },
|
|
208
|
+
];
|
|
209
|
+
|
|
210
|
+
const width = 600,
|
|
211
|
+
height = 400,
|
|
212
|
+
margin = { top: 20, right: 30, bottom: 100, left: 60 };
|
|
213
|
+
const d3n = new D3Node();
|
|
214
|
+
const d3 = d3n.d3;
|
|
215
|
+
|
|
216
|
+
const svg = d3n.createSVG(width, height);
|
|
217
|
+
|
|
218
|
+
const xScale = d3
|
|
219
|
+
.scaleBand()
|
|
220
|
+
.domain(newspapers.map((d) => d.name))
|
|
221
|
+
.range([margin.left, width - margin.right])
|
|
222
|
+
.padding(0.1);
|
|
223
|
+
|
|
224
|
+
const yScale = d3
|
|
225
|
+
.scaleLinear()
|
|
226
|
+
.domain([0, d3.max(newspapers, (d: any) => d.sales)])
|
|
227
|
+
.nice()
|
|
228
|
+
.range([height - margin.bottom, margin.top]);
|
|
229
|
+
|
|
230
|
+
svg
|
|
231
|
+
.append("g")
|
|
232
|
+
.attr("transform", `translate(0,${height - margin.bottom})`)
|
|
233
|
+
.call(d3.axisBottom(xScale).tickSize(0))
|
|
234
|
+
.selectAll("text")
|
|
235
|
+
.style("text-anchor", "end")
|
|
236
|
+
.attr("transform", "rotate(-30)");
|
|
237
|
+
|
|
238
|
+
svg
|
|
239
|
+
.append("g")
|
|
240
|
+
.attr("transform", `translate(${margin.left},0)`)
|
|
241
|
+
.call(
|
|
242
|
+
d3
|
|
243
|
+
.axisLeft(yScale)
|
|
244
|
+
.ticks(5)
|
|
245
|
+
.tickFormat((d: any) =>
|
|
246
|
+
d.toString().replace(/\B(?=(\d{3})+(?!\d))/g, " "),
|
|
247
|
+
),
|
|
248
|
+
);
|
|
249
|
+
|
|
250
|
+
svg
|
|
251
|
+
.append("text")
|
|
252
|
+
.attr("x", margin.left)
|
|
253
|
+
.attr("y", margin.top)
|
|
254
|
+
.attr("text-anchor", "start")
|
|
255
|
+
.style("font-size", "14px")
|
|
256
|
+
.style("font-weight", "bold")
|
|
257
|
+
.text("Nombre d'exemplaires vendus");
|
|
258
|
+
|
|
259
|
+
svg
|
|
260
|
+
.selectAll(".bar")
|
|
261
|
+
.data(newspapers)
|
|
262
|
+
.enter()
|
|
263
|
+
.append("rect")
|
|
264
|
+
.attr("class", "bar")
|
|
265
|
+
.attr("x", (d: any) => xScale(d.name))
|
|
266
|
+
.attr("y", (d: any) => yScale(d.sales))
|
|
267
|
+
.attr("width", xScale.bandwidth())
|
|
268
|
+
.attr("height", (d: any) => height - margin.bottom - yScale(d.sales))
|
|
269
|
+
.attr("fill", "steelblue");
|
|
270
|
+
|
|
271
|
+
const svgString = d3n.svgString();
|
|
272
|
+
return `BBteeeezfst :
|
|
273
|
+
|
|
274
|
+
ofzie
|
|
275
|
+
should read this
|
|
276
|
+
${svgString}
|
|
277
|
+
should read this
|
|
278
|
+
zef
|
|
279
|
+
`;
|
|
280
|
+
*/
|
|
@@ -0,0 +1 @@
|
|
|
1
|
+
{"version":3,"file":"index.d.ts","sourceRoot":"","sources":["../../../../../src/exercises/math/dataRepresentations/barChart/index.ts"],"names":[],"mappings":"AAAA,cAAc,2BAA2B,CAAC;AAC1C,cAAc,sBAAsB,CAAC"}
|
|
@@ -0,0 +1 @@
|
|
|
1
|
+
{"version":3,"file":"boxPlotInterpreting.d.ts","sourceRoot":"","sources":["../../../../../src/exercises/math/dataRepresentations/boxPlot/boxPlotInterpreting.ts"],"names":[],"mappings":"AAAA,OAAO,EACL,QAAQ,EAYT,MAAM,6BAA6B,CAAC;AAYrC,KAAK,WAAW,GAAG;IACjB,SAAS,EAAE,MAAM,EAAE,CAAC;CACrB,CAAC;AAgRF,eAAO,MAAM,mBAAmB,EAAE,QAAQ,CAAC,WAAW,CAmBrD,CAAC"}
|
|
@@ -0,0 +1,223 @@
|
|
|
1
|
+
import { addValidProp, shuffleProps, tryToAddWrongProp, } from "../../../../exercises/exercise.js";
|
|
2
|
+
import { getDistinctQuestions } from "../../../../exercises/utils/getDistinctQuestions.js";
|
|
3
|
+
import { GeogebraConstructor } from "../../../../geogebra/geogebraConstructor.js";
|
|
4
|
+
import { randint } from "../../../../math/utils/random/randint.js";
|
|
5
|
+
import { multiply } from "../../../../tree/nodes/operators/multiplyNode.js";
|
|
6
|
+
import { substract } from "../../../../tree/nodes/operators/substractNode.js";
|
|
7
|
+
import { coinFlip } from "../../../../utils/alea/coinFlip.js";
|
|
8
|
+
import { randomMany } from "../../../../utils/alea/random.js";
|
|
9
|
+
import { getAllPicks } from "../../../../utils/arrays/getAllPicks.js";
|
|
10
|
+
const getAvailableQuestionObjs = (quartiles) => {
|
|
11
|
+
const [q0, q1, _, q3, q4] = quartiles;
|
|
12
|
+
const arrQuartileIndexAvailable = [
|
|
13
|
+
0,
|
|
14
|
+
...(q0 !== q1 ? [1] : []),
|
|
15
|
+
2,
|
|
16
|
+
...(q3 !== q4 ? [3] : []),
|
|
17
|
+
4,
|
|
18
|
+
];
|
|
19
|
+
return getAllPicks(arrQuartileIndexAvailable)
|
|
20
|
+
.filter((quartileIndexesPicked) => quartileIndexesPicked.length === 2)
|
|
21
|
+
.flatMap((quartileIndexesPicked) => {
|
|
22
|
+
return [
|
|
23
|
+
...(quartileIndexesPicked[0] === 0 ? ["below"] : []),
|
|
24
|
+
"between",
|
|
25
|
+
...(quartileIndexesPicked[1] === 4 ? ["above"] : []),
|
|
26
|
+
].map((typeQ) => {
|
|
27
|
+
return {
|
|
28
|
+
typeQ: typeQ,
|
|
29
|
+
quartileIndexes: quartileIndexesPicked,
|
|
30
|
+
};
|
|
31
|
+
});
|
|
32
|
+
});
|
|
33
|
+
};
|
|
34
|
+
const getPercentageNode = (quartileIndexes) => {
|
|
35
|
+
return multiply(substract(quartileIndexes[1], quartileIndexes[0]), 25).simplify();
|
|
36
|
+
};
|
|
37
|
+
const getFrenchStringForPercentage = (n) => {
|
|
38
|
+
switch (n) {
|
|
39
|
+
case 25:
|
|
40
|
+
return `Un quart des`;
|
|
41
|
+
case 50:
|
|
42
|
+
return `La moitié des`;
|
|
43
|
+
case 75:
|
|
44
|
+
return `Trois quarts des`;
|
|
45
|
+
case 100:
|
|
46
|
+
return `Tous les`;
|
|
47
|
+
default:
|
|
48
|
+
return "";
|
|
49
|
+
}
|
|
50
|
+
};
|
|
51
|
+
const getTexPercentage = (n) => {
|
|
52
|
+
return coinFlip()
|
|
53
|
+
? `$${n.frenchify()}\\%$ des`
|
|
54
|
+
: getFrenchStringForPercentage(n);
|
|
55
|
+
};
|
|
56
|
+
const getValidProp = (quartiles, questionObj) => {
|
|
57
|
+
const { typeQ, quartileIndexes } = questionObj;
|
|
58
|
+
const percentageNode = getPercentageNode(quartileIndexes);
|
|
59
|
+
const texPercentage = getTexPercentage(percentageNode.evaluate());
|
|
60
|
+
switch (typeQ) {
|
|
61
|
+
case "below":
|
|
62
|
+
return `${texPercentage} élèves ont eu $${quartiles[quartileIndexes[1]]}$ ou moins.`;
|
|
63
|
+
case "between":
|
|
64
|
+
return `${texPercentage} élèves ont eu entre $${quartiles[quartileIndexes[0]]}$ et $${quartiles[quartileIndexes[1]]}$.`;
|
|
65
|
+
case "above":
|
|
66
|
+
return `${texPercentage} élèves ont eu $${quartiles[quartileIndexes[0]]}$ ou plus.`;
|
|
67
|
+
}
|
|
68
|
+
};
|
|
69
|
+
const getInvalidProps = (quartiles, questionObj) => {
|
|
70
|
+
const { typeQ, quartileIndexes } = questionObj;
|
|
71
|
+
const validPercentageNode = getPercentageNode(quartileIndexes);
|
|
72
|
+
const validPercentage = validPercentageNode.evaluate();
|
|
73
|
+
const invalidPercentages = [0, 25, 50, 75, 100].filter((n) => n > validPercentage);
|
|
74
|
+
switch (typeQ) {
|
|
75
|
+
case "below":
|
|
76
|
+
return invalidPercentages.map((n) => `${getTexPercentage(n)} élèves ont eu $${quartiles[quartileIndexes[1]]}$ ou moins.`);
|
|
77
|
+
case "between":
|
|
78
|
+
return invalidPercentages.map((n) => `${getTexPercentage(n)} élèves ont eu entre $${quartiles[quartileIndexes[0]]}$ et $${quartiles[quartileIndexes[1]]}$.`);
|
|
79
|
+
case "above":
|
|
80
|
+
return invalidPercentages.map((n) => `${getTexPercentage(n)} élèves ont eu $${quartiles[quartileIndexes[0]]}$ ou plus.`);
|
|
81
|
+
}
|
|
82
|
+
};
|
|
83
|
+
const getInstruction = (identifiers) => {
|
|
84
|
+
const { quartiles } = identifiers;
|
|
85
|
+
return `Voici la boîtes à moustaches correspondant aux notes du bac en mathématiques.
|
|
86
|
+
|
|
87
|
+
On observe que $Q1 = ${quartiles[1].frenchify()}$, que la médiane vaut $${quartiles[2].frenchify()}$
|
|
88
|
+
et que $Q3 = ${quartiles[3].frenchify()}$.
|
|
89
|
+
|
|
90
|
+
On peut alors en déduire que :
|
|
91
|
+
`;
|
|
92
|
+
};
|
|
93
|
+
const getHint = () => {
|
|
94
|
+
return `Il y a autant d'élèves qui ont eu la médiane ou plus que d'élèves qui ont eu la médiane ou moins.
|
|
95
|
+
|
|
96
|
+
Au moins $25\\%$ des élèves ont eu $Q1$ ou moins que $Q1$.
|
|
97
|
+
|
|
98
|
+
Au moins $75\\%$ des élèves ont eu $Q3$ ou moins que $Q3$.`;
|
|
99
|
+
};
|
|
100
|
+
const getCorrection = (identifiers) => {
|
|
101
|
+
const { quartiles } = identifiers;
|
|
102
|
+
const [q0, q1, _, q3, q4] = quartiles;
|
|
103
|
+
const questionObjs = [
|
|
104
|
+
{ typeQ: "below", quartileIndexes: [0, 1] },
|
|
105
|
+
...(q0 !== q1
|
|
106
|
+
? [{ typeQ: "between", quartileIndexes: [1, 2] }]
|
|
107
|
+
: [{ typeQ: "between", quartileIndexes: [0, 2] }]),
|
|
108
|
+
...(q3 !== q4
|
|
109
|
+
? [{ typeQ: "between", quartileIndexes: [2, 3] }]
|
|
110
|
+
: [{ typeQ: "between", quartileIndexes: [2, 4] }]),
|
|
111
|
+
{ typeQ: "above", quartileIndexes: [3, 4] },
|
|
112
|
+
];
|
|
113
|
+
const validProps = questionObjs.map((questionObj) => getValidProp(quartiles, questionObj));
|
|
114
|
+
return `Voici quelques commentaires sur la répartition des notes des élèves :
|
|
115
|
+
|
|
116
|
+
${validProps.join(`
|
|
117
|
+
|
|
118
|
+
`)}`;
|
|
119
|
+
};
|
|
120
|
+
const getPropositions = (n, { quartiles }) => {
|
|
121
|
+
const propositions = [];
|
|
122
|
+
const questionObjs = getAvailableQuestionObjs(quartiles);
|
|
123
|
+
const nbValid = randint(1, 4);
|
|
124
|
+
const allValidProps = [
|
|
125
|
+
...questionObjs.map((questionObj) => getValidProp(quartiles, questionObj)),
|
|
126
|
+
`Aucun élève n'a eu en dessous de $${quartiles[0]}$`,
|
|
127
|
+
`Aucun élève n'a eu au dessus de $${quartiles[4]}$`,
|
|
128
|
+
];
|
|
129
|
+
const validProps = randomMany(allValidProps, nbValid);
|
|
130
|
+
validProps.forEach((validProp) => {
|
|
131
|
+
addValidProp(propositions, validProp, "raw");
|
|
132
|
+
});
|
|
133
|
+
const nbInvalid = n - nbValid;
|
|
134
|
+
const allInvalidProps = [
|
|
135
|
+
...questionObjs.flatMap((questionObj) => getInvalidProps(quartiles, questionObj)),
|
|
136
|
+
`Aucun élève n'a eu en dessous de $${quartiles[2]}$`,
|
|
137
|
+
`Aucun élève n'a eu au dessus de $${quartiles[2]}$`,
|
|
138
|
+
];
|
|
139
|
+
const invalidProps = randomMany(allInvalidProps, nbInvalid);
|
|
140
|
+
invalidProps.forEach((invalidProp) => {
|
|
141
|
+
tryToAddWrongProp(propositions, invalidProp, "raw");
|
|
142
|
+
});
|
|
143
|
+
return shuffleProps(propositions, n);
|
|
144
|
+
};
|
|
145
|
+
const getGGBOptions = (identifiers) => {
|
|
146
|
+
const { quartiles } = identifiers;
|
|
147
|
+
const [q0, q1, q2, q3, q4] = quartiles;
|
|
148
|
+
const yOffset = 2;
|
|
149
|
+
const yScale = 0.8;
|
|
150
|
+
const commands = [
|
|
151
|
+
`BM = BoxPlot(${yOffset}, ${yScale}, ${q0}, ${q1}, ${q2}, ${q3}, ${q4})`,
|
|
152
|
+
`ShowLabel(BM, false)`,
|
|
153
|
+
];
|
|
154
|
+
const ggb = new GeogebraConstructor({
|
|
155
|
+
commands,
|
|
156
|
+
forbidShiftDragZoom: false,
|
|
157
|
+
lockedAxesRatio: false,
|
|
158
|
+
// gridDistance: [0.5, 1],
|
|
159
|
+
xAxis: {
|
|
160
|
+
hideNumbers: false,
|
|
161
|
+
steps: 1,
|
|
162
|
+
},
|
|
163
|
+
yAxis: {
|
|
164
|
+
hidden: true,
|
|
165
|
+
},
|
|
166
|
+
maxHeight: 100,
|
|
167
|
+
fontSize: 20,
|
|
168
|
+
});
|
|
169
|
+
return ggb.getOptions({
|
|
170
|
+
coords: ggb.getAdaptedCoords({
|
|
171
|
+
xMin: q0,
|
|
172
|
+
xMax: q4,
|
|
173
|
+
yMin: -2,
|
|
174
|
+
yMax: 5,
|
|
175
|
+
}),
|
|
176
|
+
});
|
|
177
|
+
};
|
|
178
|
+
const getBoxInterpretingQuestion = () => {
|
|
179
|
+
const arrBounds = [
|
|
180
|
+
{ min: 0, max: 8 },
|
|
181
|
+
{ min: 12, max: 20 },
|
|
182
|
+
];
|
|
183
|
+
const [q0, q1] = [0, 1]
|
|
184
|
+
.map((_) => randint(arrBounds[0].min, arrBounds[0].max))
|
|
185
|
+
.toSorted((i1, i2) => i1 - i2);
|
|
186
|
+
const [q3, q4] = [0, 1]
|
|
187
|
+
.map((_) => randint(arrBounds[1].min, arrBounds[1].max))
|
|
188
|
+
.toSorted((i1, i2) => i1 - i2);
|
|
189
|
+
const q2 = randint(q1, q3, [q1]); //we prevent q2 from being equal to q1 or q3
|
|
190
|
+
const quartiles = [q0, q1, q2, q3, q4];
|
|
191
|
+
const identifiers = { quartiles };
|
|
192
|
+
return getQuestionFromIdentifiers(identifiers);
|
|
193
|
+
};
|
|
194
|
+
const getQuestionFromIdentifiers = (identifiers) => {
|
|
195
|
+
return {
|
|
196
|
+
instruction: getInstruction(identifiers),
|
|
197
|
+
keys: [],
|
|
198
|
+
answerFormat: "tex",
|
|
199
|
+
identifiers,
|
|
200
|
+
hint: getHint(identifiers),
|
|
201
|
+
correction: getCorrection(identifiers),
|
|
202
|
+
ggbOptions: getGGBOptions(identifiers),
|
|
203
|
+
};
|
|
204
|
+
};
|
|
205
|
+
export const boxPlotInterpreting = {
|
|
206
|
+
id: "boxPlotInterpreting",
|
|
207
|
+
label: "Interpréter une boite à moustaches",
|
|
208
|
+
isSingleStep: true,
|
|
209
|
+
generator: (nb, opts) => getDistinctQuestions(() => getBoxInterpretingQuestion(opts), nb),
|
|
210
|
+
qcmTimer: 60,
|
|
211
|
+
freeTimer: 60,
|
|
212
|
+
getPropositions,
|
|
213
|
+
subject: "Mathématiques",
|
|
214
|
+
getHint,
|
|
215
|
+
getCorrection,
|
|
216
|
+
getInstruction,
|
|
217
|
+
getGGBOptions,
|
|
218
|
+
hasGeogebra: true,
|
|
219
|
+
getQuestionFromIdentifiers,
|
|
220
|
+
hasHintAndCorrection: true,
|
|
221
|
+
answerType: "QCM",
|
|
222
|
+
isQCM: true,
|
|
223
|
+
};
|
|
@@ -0,0 +1,9 @@
|
|
|
1
|
+
import { Exercise } from "../../../../exercises/exercise.js";
|
|
2
|
+
type QuartileIndex = 0 | 1 | 2 | 3 | 4;
|
|
3
|
+
type Identifiers = {
|
|
4
|
+
quartileIndex: QuartileIndex;
|
|
5
|
+
quartiles: number[];
|
|
6
|
+
};
|
|
7
|
+
export declare const boxPlotReading: Exercise<Identifiers>;
|
|
8
|
+
export {};
|
|
9
|
+
//# sourceMappingURL=boxPlotReading.d.ts.map
|
|
@@ -0,0 +1 @@
|
|
|
1
|
+
{"version":3,"file":"boxPlotReading.d.ts","sourceRoot":"","sources":["../../../../../src/exercises/math/dataRepresentations/boxPlot/boxPlotReading.ts"],"names":[],"mappings":"AAAA,OAAO,EACL,QAAQ,EAeT,MAAM,6BAA6B,CAAC;AAMrC,KAAK,aAAa,GAAG,CAAC,GAAG,CAAC,GAAG,CAAC,GAAG,CAAC,GAAG,CAAC,CAAC;AAEvC,KAAK,WAAW,GAAG;IACjB,aAAa,EAAE,aAAa,CAAC;IAC7B,SAAS,EAAE,MAAM,EAAE,CAAC;CACrB,CAAC;AA0IF,eAAO,MAAM,cAAc,EAAE,QAAQ,CAAC,WAAW,CAmBhD,CAAC"}
|
|
@@ -0,0 +1,133 @@
|
|
|
1
|
+
import { addValidProp, shuffleProps, tryToAddWrongProp, } from "../../../../exercises/exercise.js";
|
|
2
|
+
import { getDistinctQuestions } from "../../../../exercises/utils/getDistinctQuestions.js";
|
|
3
|
+
import { numberVEA } from "../../../../exercises/vea/numberVEA.js";
|
|
4
|
+
import { GeogebraConstructor } from "../../../../geogebra/geogebraConstructor.js";
|
|
5
|
+
import { randint } from "../../../../math/utils/random/randint.js";
|
|
6
|
+
const getPropositions = (n, { answer, quartiles }) => {
|
|
7
|
+
const propositions = [];
|
|
8
|
+
addValidProp(propositions, answer);
|
|
9
|
+
[0, 1, 2, 3, 4].forEach((qIndex) => {
|
|
10
|
+
tryToAddWrongProp(propositions, quartiles[qIndex].frenchify());
|
|
11
|
+
});
|
|
12
|
+
return shuffleProps(propositions, n);
|
|
13
|
+
};
|
|
14
|
+
const getAnswer = (identifiers) => {
|
|
15
|
+
const { quartileIndex, quartiles } = identifiers;
|
|
16
|
+
return quartiles[quartileIndex].frenchify();
|
|
17
|
+
};
|
|
18
|
+
const getFrenchStringForOfQuartile = (quartileIndex) => {
|
|
19
|
+
switch (quartileIndex) {
|
|
20
|
+
case 0:
|
|
21
|
+
return "du minimum";
|
|
22
|
+
case 1:
|
|
23
|
+
return "du premier quartile";
|
|
24
|
+
case 2:
|
|
25
|
+
return "de la médiane";
|
|
26
|
+
case 3:
|
|
27
|
+
return "du troisième quartile";
|
|
28
|
+
case 4:
|
|
29
|
+
return "du maximum";
|
|
30
|
+
}
|
|
31
|
+
};
|
|
32
|
+
const getInstruction = (identifiers) => {
|
|
33
|
+
const { quartileIndex } = identifiers;
|
|
34
|
+
return `On a représenté une série statistique à une variable sous forme d'une boîte à moustaches.
|
|
35
|
+
|
|
36
|
+
Quelle est la valeur ${getFrenchStringForOfQuartile(quartileIndex)} ?
|
|
37
|
+
`;
|
|
38
|
+
};
|
|
39
|
+
const getHint = () => {
|
|
40
|
+
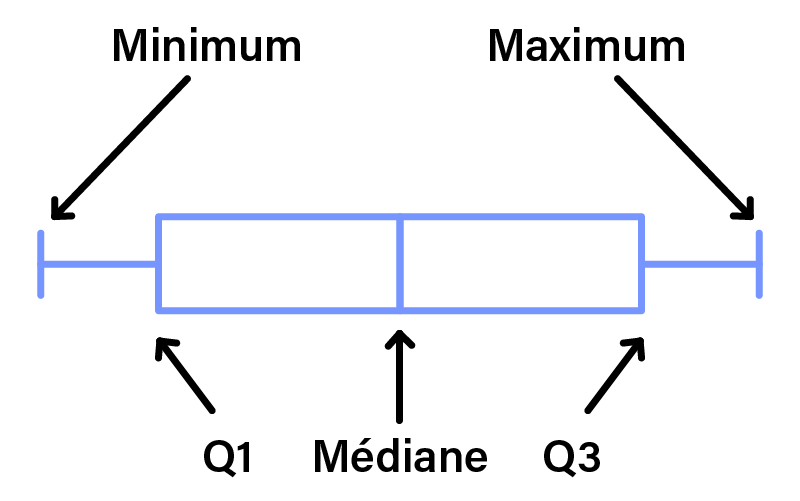
return `Une boîte à moustaches permet de lire les indicateurs statistiques d'une série. Chaque trait vertical représente un indicateur. Ces indicateurs sont rangés dans l'ordre : minimum, premier quartile, médiane, troisième quartile, maximum.`;
|
|
41
|
+
};
|
|
42
|
+
const getCorrection = (identifiers) => {
|
|
43
|
+
const { quartileIndex, quartiles } = identifiers;
|
|
44
|
+
//https://heureuxhasarddocsbucket.s3.eu-west-3.amazonaws.com/mathliveV2/activities/quizzes/generator/boxplot.png
|
|
45
|
+
return `Une boîte à moustache permet de lire les indicateurs statistiques d'une série :
|
|
46
|
+
|
|
47
|
+
|
|
48
|
+
|
|
49
|
+
La valeur ${getFrenchStringForOfQuartile(quartileIndex)} est donc ici $ ${quartiles[quartileIndex]} $.`;
|
|
50
|
+
};
|
|
51
|
+
const getGGBOptions = (identifiers) => {
|
|
52
|
+
const { quartiles } = identifiers;
|
|
53
|
+
const [q0, q1, q2, q3, q4] = quartiles;
|
|
54
|
+
const yOffset = 2;
|
|
55
|
+
const yScale = 0.8;
|
|
56
|
+
const commands = [
|
|
57
|
+
`BM = BoxPlot(${yOffset}, ${yScale}, ${q0}, ${q1}, ${q2}, ${q3}, ${q4})`,
|
|
58
|
+
`ShowLabel(BM, false)`,
|
|
59
|
+
];
|
|
60
|
+
const ggb = new GeogebraConstructor({
|
|
61
|
+
commands,
|
|
62
|
+
forbidShiftDragZoom: false,
|
|
63
|
+
lockedAxesRatio: false,
|
|
64
|
+
// gridDistance: [0.5, 1],
|
|
65
|
+
xAxis: {
|
|
66
|
+
hideNumbers: false,
|
|
67
|
+
steps: 1,
|
|
68
|
+
},
|
|
69
|
+
yAxis: {
|
|
70
|
+
hidden: true,
|
|
71
|
+
},
|
|
72
|
+
maxHeight: 100,
|
|
73
|
+
fontSize: 20,
|
|
74
|
+
});
|
|
75
|
+
return ggb.getOptions({
|
|
76
|
+
coords: ggb.getAdaptedCoords({
|
|
77
|
+
xMin: q0,
|
|
78
|
+
xMax: q4,
|
|
79
|
+
yMin: -2,
|
|
80
|
+
yMax: 5,
|
|
81
|
+
}),
|
|
82
|
+
});
|
|
83
|
+
};
|
|
84
|
+
const getKeys = () => {
|
|
85
|
+
return [];
|
|
86
|
+
};
|
|
87
|
+
const isAnswerValid = (ans, { answer }) => {
|
|
88
|
+
return numberVEA(ans, answer);
|
|
89
|
+
};
|
|
90
|
+
const getBoxPlotReadingQuestion = () => {
|
|
91
|
+
const [q0, q1] = [0, 1]
|
|
92
|
+
.map((_) => randint(0, 8))
|
|
93
|
+
.toSorted((i1, i2) => i1 - i2);
|
|
94
|
+
const [q3, q4] = [0, 1]
|
|
95
|
+
.map((_) => randint(12, 20))
|
|
96
|
+
.toSorted((i1, i2) => i1 - i2);
|
|
97
|
+
const q2 = randint(q1, q3, [q1]); //we prevent q2 from being equal to q1 or q3
|
|
98
|
+
const quartiles = [q0, q1, q2, q3, q4];
|
|
99
|
+
const quartileIndex = randint(0, 5);
|
|
100
|
+
const identifiers = { quartileIndex, quartiles };
|
|
101
|
+
return getQuestionFromIdentifiers(identifiers);
|
|
102
|
+
};
|
|
103
|
+
const getQuestionFromIdentifiers = (identifiers) => {
|
|
104
|
+
return {
|
|
105
|
+
answer: getAnswer(identifiers),
|
|
106
|
+
instruction: getInstruction(identifiers),
|
|
107
|
+
keys: getKeys(identifiers),
|
|
108
|
+
answerFormat: "tex",
|
|
109
|
+
identifiers,
|
|
110
|
+
hint: getHint(identifiers),
|
|
111
|
+
correction: getCorrection(identifiers),
|
|
112
|
+
ggbOptions: getGGBOptions(identifiers),
|
|
113
|
+
};
|
|
114
|
+
};
|
|
115
|
+
export const boxPlotReading = {
|
|
116
|
+
id: "boxPlotReading",
|
|
117
|
+
label: "Lire les indicateurs statistiques sur une boîte à moustaches",
|
|
118
|
+
isSingleStep: true,
|
|
119
|
+
generator: (nb, opts) => getDistinctQuestions(() => getBoxPlotReadingQuestion(opts), nb),
|
|
120
|
+
qcmTimer: 60,
|
|
121
|
+
freeTimer: 60,
|
|
122
|
+
getPropositions,
|
|
123
|
+
isAnswerValid,
|
|
124
|
+
subject: "Mathématiques",
|
|
125
|
+
getHint,
|
|
126
|
+
getCorrection,
|
|
127
|
+
getInstruction,
|
|
128
|
+
getAnswer,
|
|
129
|
+
getGGBOptions,
|
|
130
|
+
hasGeogebra: true,
|
|
131
|
+
getQuestionFromIdentifiers,
|
|
132
|
+
hasHintAndCorrection: true,
|
|
133
|
+
};
|
|
@@ -0,0 +1,11 @@
|
|
|
1
|
+
import { Exercise } from "../../../../exercises/exercise.js";
|
|
2
|
+
type QuartileIndex = 0 | 1 | 2 | 3 | 4;
|
|
3
|
+
type QuestionType = "below" | "between" | "above";
|
|
4
|
+
type Identifiers = {
|
|
5
|
+
quartiles: number[];
|
|
6
|
+
arrQuartileIndex: QuartileIndex[];
|
|
7
|
+
typeQ: QuestionType;
|
|
8
|
+
};
|
|
9
|
+
export declare const boxPlotReadingPercentages: Exercise<Identifiers>;
|
|
10
|
+
export {};
|
|
11
|
+
//# sourceMappingURL=boxPlotReadingPercentages.d.ts.map
|