llm-usage-metrics 0.7.1 → 0.8.0
This diff represents the content of publicly available package versions that have been released to one of the supported registries. The information contained in this diff is provided for informational purposes only and reflects changes between package versions as they appear in their respective public registries.
- package/README.md +130 -289
- package/dist/index.js +29443 -8889
- package/package.json +27 -10
- package/dist/index.d.ts +0 -1
- package/dist/index.js.map +0 -1
package/README.md
CHANGED
|
@@ -1,374 +1,215 @@
|
|
|
1
|
-
<
|
|
1
|
+
<p align="center">
|
|
2
|
+
<img src="https://ayagmar.github.io/llm-usage-metrics/favicon.svg" width="72" height="72" alt="LLM Usage Metrics logo">
|
|
3
|
+
</p>
|
|
2
4
|
|
|
3
|
-
<
|
|
5
|
+
<h1 align="center">llm-usage-metrics</h1>
|
|
4
6
|
|
|
5
|
-
|
|
7
|
+
<p align="center">
|
|
8
|
+
Local usage reports for AI coding tools.
|
|
9
|
+
</p>
|
|
6
10
|
|
|
7
|
-
|
|
11
|
+
<p align="center">
|
|
12
|
+
<a href="https://www.npmjs.com/package/llm-usage-metrics"><img src="https://img.shields.io/npm/v/llm-usage-metrics.svg?style=flat-square&color=b65331" alt="npm version"></a>
|
|
13
|
+
<a href="https://www.npmjs.com/package/llm-usage-metrics"><img src="https://img.shields.io/npm/dt/llm-usage-metrics.svg?style=flat-square&color=5f655b" alt="npm downloads"></a>
|
|
14
|
+
<a href="https://github.com/ayagmar/llm-usage-metrics/actions/workflows/ci.yml"><img src="https://img.shields.io/github/actions/workflow/status/ayagmar/llm-usage-metrics/ci.yml?style=flat-square&label=CI" alt="CI status"></a>
|
|
15
|
+
<a href="https://codecov.io/gh/ayagmar/llm-usage-metrics"><img src="https://img.shields.io/codecov/c/github/ayagmar/llm-usage-metrics?style=flat-square" alt="test coverage"></a>
|
|
16
|
+
<a href="https://deepwiki.com/ayagmar/llm-usage-metrics"><img src="https://deepwiki.com/badge.svg" alt="Ask DeepWiki"></a>
|
|
17
|
+
</p>
|
|
8
18
|
|
|
9
|
-
|
|
10
|
-
|
|
11
|
-
|
|
12
|
-
|
|
13
|
-
|
|
19
|
+
<p align="center">
|
|
20
|
+
<a href="https://ayagmar.github.io/llm-usage-metrics/">Documentation</a> ·
|
|
21
|
+
<a href="https://ayagmar.github.io/llm-usage-metrics/getting-started/">Getting started</a> ·
|
|
22
|
+
<a href="https://ayagmar.github.io/llm-usage-metrics/cli-reference/">CLI reference</a> ·
|
|
23
|
+
<a href="./CONTRIBUTING.md">Contributing</a>
|
|
24
|
+
</p>
|
|
14
25
|
|
|
15
|
-
|
|
16
|
-
[⚡ Quick Start](#quick-start) ·
|
|
17
|
-
[📊 Examples](#usage) ·
|
|
18
|
-
[🤝 Contributing](./CONTRIBUTING.md)
|
|
26
|
+
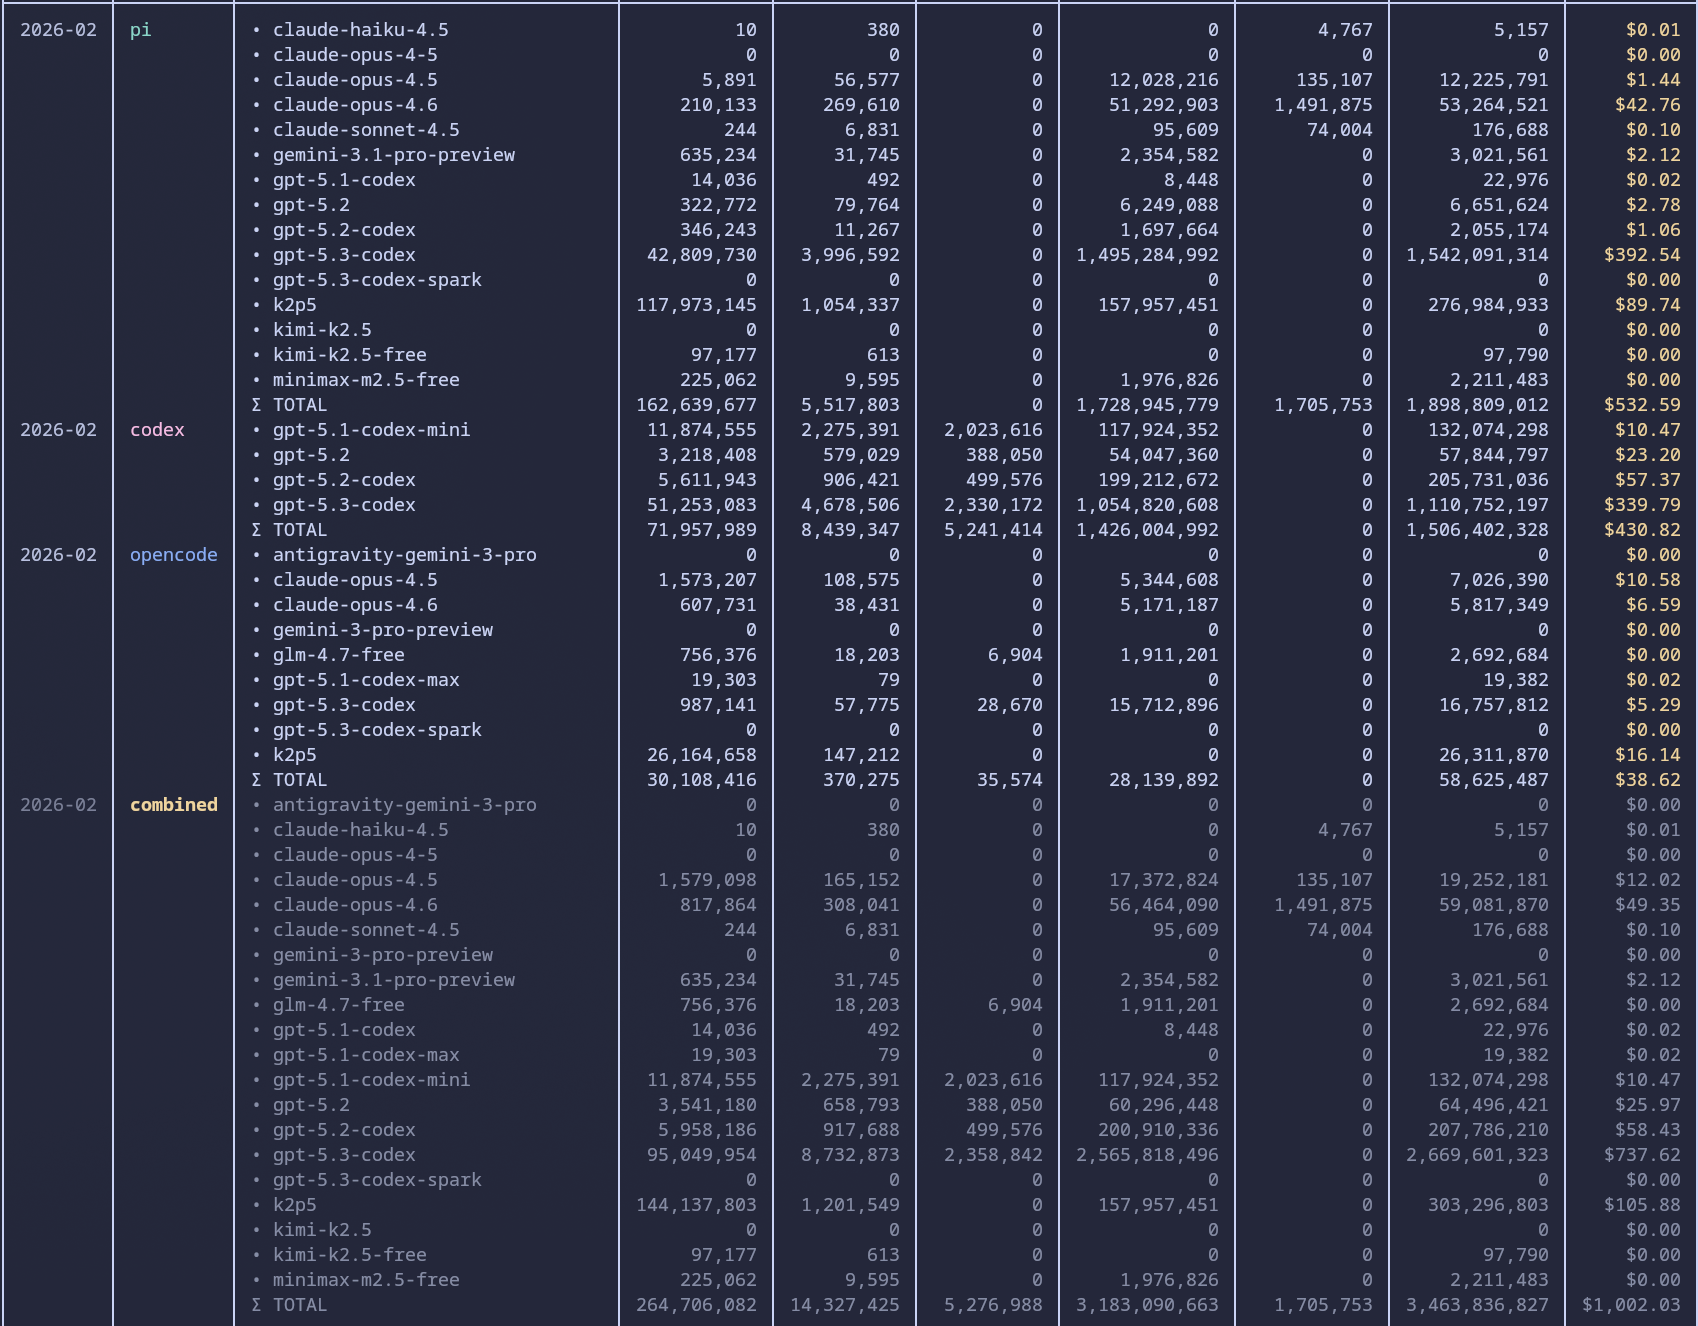
`llm-usage-metrics` reads local session data from 16 AI coding tools and converts it into one normalized usage history. Use it to review tokens and estimated cost, compare periods, find expensive sessions, correlate usage with local Git activity, or export the result.
|
|
19
27
|
|
|
20
|
-
|
|
28
|
+
The CLI parses session content on your machine. It discovers standard source locations and includes a bundled pricing snapshot, so the first report can run without configuration or network access.
|
|
21
29
|
|
|
22
|
-
|
|
30
|
+
## Quick start
|
|
23
31
|
|
|
24
|
-
|
|
25
|
-
|
|
26
|
-
## ✨ Features
|
|
27
|
-
|
|
28
|
-
- **Zero-Config Discovery** — Automatically finds `.pi`, `.codex`, `.gemini`, `.factory`, and OpenCode session data
|
|
29
|
-
- **LiteLLM Pricing** — Real-time pricing sync with offline caching support
|
|
30
|
-
- **Flexible Reports** — Daily, weekly, and monthly aggregations
|
|
31
|
-
- **Efficiency Reports** — Correlate cost/tokens with repository commit outcomes
|
|
32
|
-
- **Optimize Reports** — Counterfactual candidate-model pricing against observed token mix
|
|
33
|
-
- **Trends Reports** — Daily cost or token trend views with combined or per-source output
|
|
34
|
-
- **Multiple Outputs** — Terminal tables, JSON, or Markdown
|
|
35
|
-
- **Smart Filtering** — By source, billing provider, model, and date ranges
|
|
36
|
-
|
|
37
|
-
## 🚀 Quick Start
|
|
32
|
+
Requires Node.js 24 or newer.
|
|
38
33
|
|
|
39
34
|
```bash
|
|
40
|
-
#
|
|
41
|
-
|
|
42
|
-
|
|
43
|
-
# Or run without installing
|
|
44
|
-
npx llm-usage-metrics@latest daily
|
|
35
|
+
# Run without installing
|
|
36
|
+
npx --yes llm-usage-metrics@latest daily
|
|
45
37
|
|
|
46
|
-
#
|
|
38
|
+
# Or install the llm-usage command
|
|
39
|
+
npm install -g llm-usage-metrics
|
|
47
40
|
llm-usage daily
|
|
48
41
|
```
|
|
49
42
|
|
|
50
|
-
|
|
51
|
-
|
|
52
|
-
|
|
53
|
-
|
|
54
|
-
</div>
|
|
55
|
-
|
|
56
|
-
## 📋 Supported Sources
|
|
57
|
-
|
|
58
|
-
| Source | Pattern | Discovery |
|
|
59
|
-
| --------------- | ---------------------------------------- | -------------------------------- |
|
|
60
|
-
| **pi** | `~/.pi/agent/sessions/**/*.jsonl` | Automatic |
|
|
61
|
-
| **codex** | `~/.codex/sessions/**/*.jsonl` | Automatic |
|
|
62
|
-
| **Gemini CLI** | `~/.gemini/tmp/*/chats/*.json` | Automatic |
|
|
63
|
-
| **Droid CLI** | `~/.factory/sessions/**/*.settings.json` | Automatic |
|
|
64
|
-
| **OpenCode** | `~/.opencode/opencode.db` | Auto or explicit `--opencode-db` |
|
|
65
|
-
| **Claude Code** | `~/.claude/projects/**/*.jsonl` | Automatic |
|
|
66
|
-
|
|
67
|
-
OpenCode source support requires Node.js 24+ runtime with built-in `node:sqlite`.
|
|
68
|
-
|
|
69
|
-
For `droid`, `Input`, `Output`, `Reasoning`, `Cache Read`, and `Cache Write` come directly from session files, and `totalTokens` is billable raw tokens (`Input + Output + Cache Read + Cache Write`, excluding `Reasoning`). Factory dashboard totals may differ because Factory applies standard-token normalization/multipliers.
|
|
70
|
-
|
|
71
|
-
## 🎯 Usage
|
|
72
|
-
|
|
73
|
-
### Basic Reports
|
|
43
|
+
If the report is empty, check source discovery:
|
|
74
44
|
|
|
75
45
|
```bash
|
|
76
|
-
|
|
77
|
-
llm-usage daily
|
|
78
|
-
|
|
79
|
-
# Weekly with timezone
|
|
80
|
-
llm-usage weekly --timezone Europe/Paris
|
|
81
|
-
|
|
82
|
-
# Monthly date range
|
|
83
|
-
llm-usage monthly --since 2026-01-01 --until 2026-01-31
|
|
46
|
+
llm-usage doctor
|
|
84
47
|
```
|
|
85
48
|
|
|
86
|
-
|
|
87
|
-
|
|
88
|
-
```bash
|
|
89
|
-
# JSON for pipelines
|
|
90
|
-
llm-usage daily --json
|
|
91
|
-
|
|
92
|
-
# Markdown for documentation
|
|
93
|
-
llm-usage daily --markdown
|
|
94
|
-
|
|
95
|
-
# Detailed per-model breakdown
|
|
96
|
-
llm-usage monthly --per-model-columns
|
|
97
|
-
|
|
98
|
-
# Write a share SVG image
|
|
99
|
-
llm-usage monthly --share
|
|
100
|
-
```
|
|
49
|
+
## Reports
|
|
101
50
|
|
|
102
|
-
|
|
51
|
+
| Question | Command |
|
|
52
|
+
| --------------------------------------------------------- | ----------------------------------------- |
|
|
53
|
+
| How much did I use by day, week, or month? | `llm-usage daily`, `weekly`, `monthly` |
|
|
54
|
+
| How did one period change from another? | `llm-usage compare` |
|
|
55
|
+
| Which conversations or repositories used the most? | `llm-usage session` |
|
|
56
|
+
| How is daily usage moving? | `llm-usage trends` |
|
|
57
|
+
| How does repo-attributed usage line up with Git activity? | `llm-usage efficiency monthly` |
|
|
58
|
+
| What would the same token mix cost on another model? | `llm-usage optimize monthly` |
|
|
59
|
+
| What did the year add up to? | `llm-usage wrapped` |
|
|
60
|
+
| How do I get the raw normalized events out? | `llm-usage events` |
|
|
61
|
+
| Which sources and local stores are healthy? | `llm-usage doctor` |
|
|
62
|
+
| Which departed files can leave the event ledger? | `llm-usage prune` |
|
|
63
|
+
| What configuration is active, and which file is it from? | `llm-usage config show`, `config path` |
|
|
64
|
+
| Which JSON Schema does my installed version emit? | `llm-usage schema usage`, `schema --list` |
|
|
103
65
|
|
|
104
|
-
|
|
66
|
+
Common examples:
|
|
105
67
|
|
|
106
68
|
```bash
|
|
107
|
-
#
|
|
108
|
-
llm-usage
|
|
109
|
-
|
|
110
|
-
# Token trends for the last 7 days
|
|
111
|
-
llm-usage trends --metric tokens --days 7
|
|
69
|
+
# A chosen calendar range
|
|
70
|
+
llm-usage monthly --since 2026-06-01 --until 2026-06-30
|
|
112
71
|
|
|
113
|
-
#
|
|
114
|
-
llm-usage
|
|
115
|
-
```
|
|
72
|
+
# Current local month compared with the previous month
|
|
73
|
+
llm-usage compare
|
|
116
74
|
|
|
117
|
-
|
|
75
|
+
# Ten highest-cost conversations
|
|
76
|
+
llm-usage session --top 10
|
|
118
77
|
|
|
119
|
-
|
|
120
|
-
|
|
121
|
-
```bash
|
|
122
|
-
# Daily efficiency in current repository
|
|
123
|
-
llm-usage efficiency daily
|
|
78
|
+
# Usage grouped by repository
|
|
79
|
+
llm-usage session --by-repo
|
|
124
80
|
|
|
125
|
-
#
|
|
126
|
-
llm-usage
|
|
81
|
+
# Last 14 local days as a token series
|
|
82
|
+
llm-usage trends --metric tokens --days 14
|
|
127
83
|
|
|
128
|
-
#
|
|
129
|
-
llm-usage
|
|
84
|
+
# Candidate-model pricing against observed usage
|
|
85
|
+
llm-usage optimize monthly \
|
|
86
|
+
--provider openai \
|
|
87
|
+
--candidate-model gpt-4.1 \
|
|
88
|
+
--candidate-model gpt-5-codex
|
|
130
89
|
|
|
131
|
-
#
|
|
132
|
-
llm-usage
|
|
90
|
+
# Normalized events as JSONL, e.g. total tokens per line via jq
|
|
91
|
+
llm-usage events --since 2026-06-01 | jq '.totalTokens'
|
|
133
92
|
```
|
|
134
93
|
|
|
135
|
-
|
|
94
|
+
## Supported sources
|
|
136
95
|
|
|
137
|
-
|
|
96
|
+
| Source | Local format |
|
|
97
|
+
| ---------------------- | ------------- |
|
|
98
|
+
| pi | JSONL |
|
|
99
|
+
| codex | JSONL |
|
|
100
|
+
| Gemini CLI | JSON |
|
|
101
|
+
| Droid CLI | settings JSON |
|
|
102
|
+
| OpenCode | SQLite |
|
|
103
|
+
| OpenClaw | JSONL |
|
|
104
|
+
| Claude Code | JSONL |
|
|
105
|
+
| GitHub Copilot CLI | OTEL JSONL |
|
|
106
|
+
| Goose | SQLite |
|
|
107
|
+
| Amp | JSON |
|
|
108
|
+
| Qwen CLI | JSONL |
|
|
109
|
+
| Kimi CLI and Kimi Code | wire JSONL |
|
|
110
|
+
| Cline | task JSON |
|
|
111
|
+
| RooCode | task JSON |
|
|
112
|
+
| KiloCode | task JSON |
|
|
113
|
+
| Antigravity | SQLite |
|
|
138
114
|
|
|
139
|
-
-
|
|
140
|
-
- `Input`, `Output`, `Reasoning`, `Cache Read`, `Cache Write`, `Total`, and `Cost` come from repo-attributed usage events.
|
|
141
|
-
- `Tokens/Commit` uses `(Input + Output + Reasoning) / Commits` and excludes cache read/write tokens.
|
|
142
|
-
- `$/Commit` uses `Cost / Commits`.
|
|
143
|
-
- `$/1k Lines` uses `Cost / (ΔLines / 1000)`.
|
|
144
|
-
- `Commits/$` uses `Commits / Cost` (shown only when `Cost > 0`).
|
|
115
|
+
Each source adapter owns discovery and source-specific token normalization. Reports operate on the same `UsageEvent` shape after parsing. The [source documentation](https://ayagmar.github.io/llm-usage-metrics/sources/) lists default paths, override flags, and adapter-specific semantics.
|
|
145
116
|
|
|
146
|
-
|
|
147
|
-
When a denominator is zero, derived values in emitted rows render as `-`.
|
|
148
|
-
When pricing is incomplete, terminal/markdown output prefixes affected USD metrics with `~`.
|
|
117
|
+
SQLite-backed sources use the built-in `node:sqlite` module.
|
|
149
118
|
|
|
150
|
-
|
|
119
|
+
## Filters and configuration
|
|
151
120
|
|
|
152
121
|
```bash
|
|
153
|
-
|
|
154
|
-
llm-usage
|
|
155
|
-
llm-usage efficiency monthly --repo-dir /path/to/repo --source gemini
|
|
156
|
-
llm-usage efficiency monthly --repo-dir /path/to/repo --source droid
|
|
157
|
-
llm-usage efficiency monthly --repo-dir /path/to/repo --source opencode
|
|
158
|
-
llm-usage efficiency monthly --repo-dir /path/to/repo --source claude
|
|
159
|
-
```
|
|
160
|
-
|
|
161
|
-
Note: usage filters (`--source`, `--provider`, `--model`, `--pi-dir`, `--codex-dir`, `--gemini-dir`, `--droid-dir`, `--claude-dir`, `--opencode-db`, `--source-dir`) also constrain commit attribution: only commit days with matching repo-attributed usage events are counted.
|
|
162
|
-
|
|
163
|
-
### Optimize Reports
|
|
164
|
-
|
|
165
|
-
```bash
|
|
166
|
-
# Counterfactual pricing across candidate models
|
|
167
|
-
llm-usage optimize monthly --provider openai --candidate-model gpt-4.1 --candidate-model gpt-5-codex
|
|
168
|
-
|
|
169
|
-
# Keep only the cheapest candidate in JSON output
|
|
170
|
-
llm-usage optimize weekly --provider openai --candidate-model gpt-4.1,gpt-5-codex --top 1 --json
|
|
171
|
-
|
|
172
|
-
# Write a monthly share SVG
|
|
173
|
-
llm-usage optimize monthly --provider openai --candidate-model gpt-4.1 --candidate-model gpt-5-codex --share
|
|
174
|
-
```
|
|
175
|
-
|
|
176
|
-
`--provider` filters by billing entity. Provider aliases are normalized to billing roots (for example, `openai-codex` is treated as `openai`).
|
|
177
|
-
|
|
178
|
-
### Filtering
|
|
122
|
+
# Filter by source tool
|
|
123
|
+
llm-usage monthly --source codex,claude
|
|
179
124
|
|
|
180
|
-
|
|
181
|
-
# By source
|
|
182
|
-
llm-usage monthly --source pi,codex,gemini,droid,claude
|
|
183
|
-
|
|
184
|
-
# By provider
|
|
125
|
+
# Filter by normalized billing provider
|
|
185
126
|
llm-usage monthly --provider openai
|
|
186
127
|
|
|
187
|
-
#
|
|
188
|
-
llm-usage monthly --model
|
|
189
|
-
|
|
190
|
-
# Combined filters
|
|
191
|
-
llm-usage monthly --source opencode --provider openai --model gpt-4.1
|
|
192
|
-
```
|
|
193
|
-
|
|
194
|
-
Use `--source` to scope where events came from (`pi`, `codex`, `gemini`, `droid`, `opencode`, `claude`), and `--provider` to scope the billing entity behind those events.
|
|
128
|
+
# Filter by exact model or substring
|
|
129
|
+
llm-usage monthly --model codex
|
|
195
130
|
|
|
196
|
-
|
|
197
|
-
|
|
198
|
-
```bash
|
|
199
|
-
# Custom directories
|
|
200
|
-
llm-usage daily --source-dir pi=/path/to/pi --source-dir codex=/path/to/codex --source-dir gemini=/path/to/.gemini --source-dir droid=/path/to/.factory/sessions --source-dir claude=/path/to/.claude/projects
|
|
201
|
-
|
|
202
|
-
# Explicit Gemini/Droid/Claude/OpenCode paths
|
|
203
|
-
llm-usage daily --gemini-dir /path/to/.gemini
|
|
204
|
-
llm-usage daily --droid-dir /path/to/.factory/sessions
|
|
205
|
-
llm-usage daily --claude-dir /path/to/.claude/projects
|
|
206
|
-
llm-usage daily --opencode-db /path/to/opencode.db
|
|
131
|
+
# Create a commented TOML config with editor schema support
|
|
132
|
+
llm-usage config init
|
|
207
133
|
```
|
|
208
134
|
|
|
209
|
-
|
|
210
|
-
|
|
211
|
-
```bash
|
|
212
|
-
# Use cached pricing only
|
|
213
|
-
llm-usage monthly --pricing-offline
|
|
214
|
-
|
|
215
|
-
# Continue even if pricing fetch fails
|
|
216
|
-
llm-usage monthly --ignore-pricing-failures
|
|
217
|
-
|
|
218
|
-
# Override per-model pricing from a local JSON file
|
|
219
|
-
llm-usage monthly --pricing-overrides ./pricing-overrides.json
|
|
220
|
-
```
|
|
135
|
+
`--source` identifies the tool that wrote an event. `--provider` identifies the billing entity behind its model. A Codex session can have `source=codex` and `provider=openai`.
|
|
221
136
|
|
|
222
|
-
|
|
137
|
+
The config precedence order is CLI flags, environment variables, TOML config, then built-in defaults. See [Configuration](https://ayagmar.github.io/llm-usage-metrics/configuration/) for every key and source path override.
|
|
223
138
|
|
|
224
|
-
|
|
139
|
+
## Pricing
|
|
225
140
|
|
|
226
|
-
|
|
227
|
-
- CPU: Intel Core Ultra 9 185H (22 logical CPUs)
|
|
228
|
-
- RAM: 62 GiB
|
|
229
|
-
- Storage: NVMe SSD
|
|
141
|
+
The CLI keeps a valid cost supplied by a source. When a source has no cost, it estimates one from LiteLLM pricing.
|
|
230
142
|
|
|
231
|
-
|
|
143
|
+
Pricing loads from a fresh cache, a network refresh, a stale cache, or the bundled snapshot. Use offline mode to skip the network request:
|
|
232
144
|
|
|
233
145
|
```bash
|
|
234
|
-
|
|
235
|
-
ccusage-codex monthly
|
|
236
|
-
llm-usage monthly --provider openai --source codex
|
|
237
|
-
|
|
238
|
-
# multi-source comparison for one provider (openai)
|
|
239
|
-
ccusage-codex monthly
|
|
240
|
-
llm-usage monthly --provider openai --source pi,codex,gemini,opencode
|
|
146
|
+
llm-usage monthly --pricing-offline
|
|
241
147
|
```
|
|
242
148
|
|
|
243
|
-
|
|
149
|
+
Cost rendering makes incomplete data visible:
|
|
244
150
|
|
|
245
|
-
|
|
151
|
+
- `$12.34` means the full row has resolved cost.
|
|
152
|
+
- `~$12.34` means the known cost is partial.
|
|
153
|
+
- `-` means no contributing event has a resolved cost.
|
|
246
154
|
|
|
247
|
-
|
|
248
|
-
| ---------------------------------------------------------------------- | ---------- | ---------: | -------: |
|
|
249
|
-
| `ccusage-codex monthly` | no cache | 16.785 | 17.288 |
|
|
250
|
-
| `ccusage-codex monthly --offline` | with cache | 16.995 | 17.594 |
|
|
251
|
-
| `llm-usage monthly --provider openai --source codex` | no cache | 3.651 | 3.760 |
|
|
252
|
-
| `llm-usage monthly --provider openai --source codex --pricing-offline` | with cache | 0.746 | 0.724 |
|
|
155
|
+
The pricing request never includes session content. See [Pricing](https://ayagmar.github.io/llm-usage-metrics/pricing/) for rate matching, overrides, and error behavior.
|
|
253
156
|
|
|
254
|
-
|
|
157
|
+
## Local event ledger
|
|
255
158
|
|
|
256
|
-
|
|
257
|
-
|
|
258
|
-
| Tool | Cache mode | Median (s) | Mean (s) |
|
|
259
|
-
| ----------------------------------------------------------------------------------------- | ---------- | ---------: | -------: |
|
|
260
|
-
| `ccusage-codex monthly` | no cache | 17.297 | 17.463 |
|
|
261
|
-
| `ccusage-codex monthly --offline` | with cache | 16.698 | 16.745 |
|
|
262
|
-
| `llm-usage monthly --provider openai --source pi,codex,gemini,opencode` | no cache | 4.767 | 4.864 |
|
|
263
|
-
| `llm-usage monthly --provider openai --source pi,codex,gemini,opencode --pricing-offline` | with cache | 0.941 | 0.951 |
|
|
264
|
-
|
|
265
|
-
Speedups (median): `3.63x` faster cold, `17.75x` faster cached.
|
|
266
|
-
|
|
267
|
-
Full methodology, cache-mode definition, and scope caveats are documented in the Astro docs: [Benchmarks](https://ayagmar.github.io/llm-usage-metrics/benchmarks/).
|
|
268
|
-
|
|
269
|
-
Re-run direct parity benchmark locally:
|
|
159
|
+
A SQLite event ledger stores normalized events and parse diagnostics. Unchanged files can skip parsing on later runs. The ledger also supports retained history for files that have left the disk:
|
|
270
160
|
|
|
271
161
|
```bash
|
|
272
|
-
|
|
162
|
+
llm-usage monthly --history
|
|
273
163
|
```
|
|
274
164
|
|
|
275
|
-
|
|
165
|
+
`prune` is a dry run unless you pass `--apply`:
|
|
276
166
|
|
|
277
167
|
```bash
|
|
278
|
-
|
|
168
|
+
llm-usage prune --suppressed
|
|
169
|
+
llm-usage prune --departed-before 2026-01-01 --apply
|
|
279
170
|
```
|
|
280
171
|
|
|
281
|
-
|
|
172
|
+
Deleting the ledger also deletes retained history. Read [Caching](https://ayagmar.github.io/llm-usage-metrics/caching/) before clearing it as a troubleshooting step.
|
|
173
|
+
|
|
174
|
+
## Output
|
|
282
175
|
|
|
283
176
|
```bash
|
|
284
|
-
|
|
285
|
-
|
|
286
|
-
|
|
287
|
-
--json-output ./tmp/production-benchmark-openai-codex.json \
|
|
288
|
-
--markdown-output ./tmp/production-benchmark-openai-codex.md
|
|
289
|
-
|
|
290
|
-
pnpm run perf:production-benchmark -- \
|
|
291
|
-
--runs 5 \
|
|
292
|
-
--llm-source pi,codex,gemini,opencode \
|
|
293
|
-
--json-output ./tmp/production-benchmark-openai-multi-source.json \
|
|
294
|
-
--markdown-output ./tmp/production-benchmark-openai-multi-source.md
|
|
177
|
+
llm-usage daily --json
|
|
178
|
+
llm-usage daily --markdown
|
|
179
|
+
llm-usage monthly --share
|
|
295
180
|
```
|
|
296
181
|
|
|
297
|
-
|
|
298
|
-
|
|
299
|
-
### Environment Variables
|
|
300
|
-
|
|
301
|
-
| Variable | Description |
|
|
302
|
-
| -------------------------------- | ---------------------------------- |
|
|
303
|
-
| `LLM_USAGE_SKIP_UPDATE_CHECK` | Skip update check (`1`) |
|
|
304
|
-
| `LLM_USAGE_UPDATE_CACHE_SCOPE` | Update cache scope |
|
|
305
|
-
| `LLM_USAGE_PRICING_CACHE_TTL_MS` | Pricing cache duration |
|
|
306
|
-
| `LLM_USAGE_PARSE_MAX_PARALLEL` | Max parallel file parses (`1-64`) |
|
|
307
|
-
| `LLM_USAGE_PARSE_CACHE_ENABLED` | Enable parse cache (`1/0`) |
|
|
308
|
-
| `LLM_USAGE_PROFILE_RUNTIME` | Emit runtime profiling diagnostics |
|
|
182
|
+
Report data goes to `stdout`. Discovery, pricing, config, and skipped-row diagnostics go to `stderr`, which keeps JSON and Markdown safe to redirect. JSON output is wrapped in a versioned envelope: `{ "schemaVersion": 1, "report": "usage", "data": ... }`. Scripts written against pre-0.8.0 JSON should follow the [migration guide](https://ayagmar.github.io/llm-usage-metrics/migrating-to-0-8/).
|
|
309
183
|
|
|
310
|
-
|
|
184
|
+
Terminal, JSON, and Markdown availability varies by report. Usage, trends, wrapped, efficiency, and optimize can write supported share SVGs. The [output guide](https://ayagmar.github.io/llm-usage-metrics/output-formats/) contains the format matrix and file names.
|
|
311
185
|
|
|
312
|
-
|
|
186
|
+
## Performance
|
|
313
187
|
|
|
314
|
-
|
|
188
|
+
The repository publishes absolute cold and warm runtimes on real local corpora. The comparison includes the runs where `ccusage` is faster and the warm Claude run where the event ledger is faster. It also records the machine, commands, cache state, dataset size, and five-run distribution.
|
|
315
189
|
|
|
316
|
-
|
|
317
|
-
|
|
318
|
-
- 1-hour cache TTL
|
|
319
|
-
- Fresh cached update results are used immediately without any network call
|
|
320
|
-
- Stale or missing cache triggers a bounded fetch (default 1s timeout) so the update prompt stays consistent across commands, instead of silently skipping the run that refreshes the cache
|
|
321
|
-
- Skipped for `--help`, `--version`, `npx`, and direct source/development runs
|
|
322
|
-
- Prompts only in interactive TTY sessions
|
|
323
|
-
|
|
324
|
-
Disable with:
|
|
325
|
-
|
|
326
|
-
```bash
|
|
327
|
-
LLM_USAGE_SKIP_UPDATE_CHECK=1 llm-usage daily
|
|
328
|
-
```
|
|
190
|
+
Read and reproduce the [benchmark](https://ayagmar.github.io/llm-usage-metrics/benchmarks/) before applying its results to another workload.
|
|
329
191
|
|
|
330
|
-
##
|
|
192
|
+
## Development
|
|
331
193
|
|
|
332
194
|
```bash
|
|
333
|
-
# Install dependencies
|
|
334
195
|
pnpm install
|
|
335
|
-
|
|
336
|
-
# Run quality checks
|
|
337
196
|
pnpm run lint
|
|
338
197
|
pnpm run typecheck
|
|
339
198
|
pnpm run test
|
|
340
199
|
pnpm run format:check
|
|
341
|
-
|
|
342
|
-
# Build
|
|
343
200
|
pnpm run build
|
|
344
|
-
|
|
345
|
-
# Run locally
|
|
346
|
-
pnpm cli daily
|
|
347
201
|
```
|
|
348
202
|
|
|
349
|
-
|
|
350
|
-
|
|
351
|
-
- **[Getting Started](https://ayagmar.github.io/llm-usage-metrics/getting-started/)** — Installation and first steps
|
|
352
|
-
- **[CLI Reference](https://ayagmar.github.io/llm-usage-metrics/cli-reference/)** — Complete command reference
|
|
353
|
-
- **[Efficiency](https://ayagmar.github.io/llm-usage-metrics/efficiency/)** — Efficiency report semantics and interpretation
|
|
354
|
-
- **[Optimize](https://ayagmar.github.io/llm-usage-metrics/optimize/)** — Counterfactual candidate-model pricing semantics
|
|
355
|
-
- **[Data Sources](https://ayagmar.github.io/llm-usage-metrics/sources/)** — Source configuration
|
|
356
|
-
- **[Configuration](https://ayagmar.github.io/llm-usage-metrics/configuration/)** — Environment variables
|
|
357
|
-
- **[Security](https://ayagmar.github.io/llm-usage-metrics/security/)** — Current security controls, dependency hygiene, and contributor steps
|
|
358
|
-
- **[Benchmarks](https://ayagmar.github.io/llm-usage-metrics/benchmarks/)** — Production benchmark methodology and results
|
|
359
|
-
- **[Architecture](https://ayagmar.github.io/llm-usage-metrics/architecture/)** — Technical overview
|
|
360
|
-
|
|
361
|
-
## 🔐 Security
|
|
203
|
+
Site commands:
|
|
362
204
|
|
|
363
|
-
|
|
364
|
-
|
|
365
|
-
|
|
366
|
-
|
|
367
|
-
|
|
368
|
-
Contributions are welcome! See [CONTRIBUTING.md](./CONTRIBUTING.md) for guidelines.
|
|
205
|
+
```bash
|
|
206
|
+
pnpm run site:check
|
|
207
|
+
pnpm run site:build
|
|
208
|
+
pnpm run site:dev
|
|
209
|
+
```
|
|
369
210
|
|
|
370
|
-
|
|
211
|
+
See [CONTRIBUTING.md](./CONTRIBUTING.md) and [docs/development.md](./docs/development.md) for the contributor workflow.
|
|
371
212
|
|
|
372
|
-
##
|
|
213
|
+
## License
|
|
373
214
|
|
|
374
|
-
MIT
|
|
215
|
+
[MIT](./LICENSE)
|