headreel 1.5.0 → 1.6.0
This diff represents the content of publicly available package versions that have been released to one of the supported registries. The information contained in this diff is provided for informational purposes only and reflects changes between package versions as they appear in their respective public registries.
- package/README.md +23 -6
- package/dist/core/camera.js +68 -0
- package/dist/styles/highlights-reel/sketch.js +10 -51
- package/dist/styles/index.js +2 -0
- package/dist/styles/trail-profile/index.js +16 -0
- package/dist/styles/trail-profile/options.js +8 -0
- package/dist/styles/trail-profile/palette.js +50 -0
- package/dist/styles/trail-profile/profile.js +231 -0
- package/dist/styles/trail-profile/sketch.js +485 -0
- package/dist/styles/trail-profile/trail.js +278 -0
- package/package.json +1 -1
package/README.md
CHANGED
|
@@ -5,7 +5,7 @@
|
|
|
5
5
|
[](https://github.com/arifszn/headreel/actions/workflows/ci.yml)
|
|
6
6
|
[](LICENSE)
|
|
7
7
|
|
|
8
|
-
|
|
8
|
+
Animated banners for your GitHub profile, made from your GitHub activity.
|
|
9
9
|
|
|
10
10
|
|
|
11
11
|
|
|
@@ -18,8 +18,7 @@ Pick one way to make your banner:
|
|
|
18
18
|
|
|
19
19
|
The Action is on the [GitHub Marketplace](https://github.com/marketplace/actions/headreel).
|
|
20
20
|
|
|
21
|
-
1.
|
|
22
|
-
2. Add `.github/workflows/headreel.yml`:
|
|
21
|
+
1. Add `.github/workflows/headreel.yml` to your repository:
|
|
23
22
|
|
|
24
23
|
```yaml
|
|
25
24
|
name: headreel
|
|
@@ -45,8 +44,8 @@ The Action is on the [GitHub Marketplace](https://github.com/marketplace/actions
|
|
|
45
44
|
website: https://example.com
|
|
46
45
|
```
|
|
47
46
|
|
|
48
|
-
|
|
49
|
-
|
|
47
|
+
2. Run the workflow once from the **Actions** tab. It adds `headreel.gif` to the `headreel` branch.
|
|
48
|
+
3. Add the image line to your `README.md`. The workflow run page shows it, ready to copy. It looks like this:
|
|
50
49
|
|
|
51
50
|
```markdown
|
|
52
51
|

|
|
@@ -68,7 +67,7 @@ Run this command. Replace `octocat` with your GitHub username.
|
|
|
68
67
|
npx headreel --style contribution-city --user octocat --tagline "Open source maintainer" --website https://example.com
|
|
69
68
|
```
|
|
70
69
|
|
|
71
|
-
The command saves `headreel.gif` in the current folder. Add the file to your
|
|
70
|
+
The command saves `headreel.gif` in the current folder. Add the file to your repository, and add `` to its `README.md`.
|
|
72
71
|
|
|
73
72
|
You need:
|
|
74
73
|
|
|
@@ -180,6 +179,24 @@ Set the style with `style: <name>` in the Action, or `--style <name>` in the com
|
|
|
180
179
|
<tr>
|
|
181
180
|
<td>
|
|
182
181
|
|
|
182
|
+
### Trail Profile
|
|
183
|
+
|
|
184
|
+
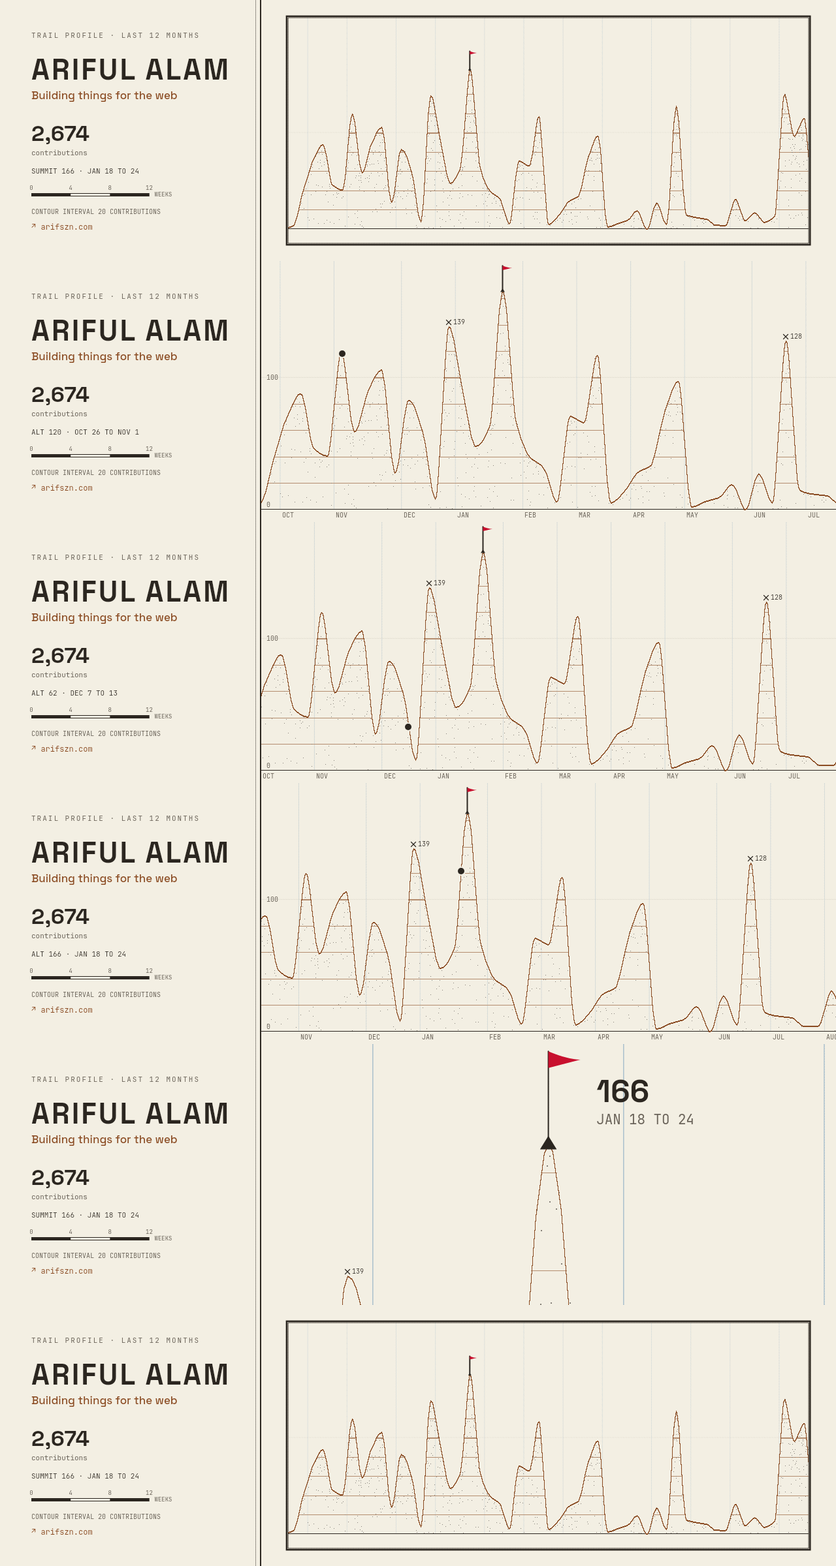
`trail-profile`: your last 12 months as a hiking trail's elevation profile on printed survey paper. Each week's contributions are the trail's elevation, drawn as a profile line with contour strata and engraved relief below it. A hiker marker walks the trail to your busiest week, the summit, and holds on its flag.
|
|
185
|
+
|
|
186
|
+
|
|
187
|
+
|
|
188
|
+
| Option | Default | Description |
|
|
189
|
+
| -------- | -------- | ---------------------------------------------------------------------------------------------- |
|
|
190
|
+
| `accent` | `sienna` | Profile line, strata and links: `sienna`, `cobalt`, `green` or `violet`. The paper stays buff. |
|
|
191
|
+
|
|
192
|
+
</td>
|
|
193
|
+
</tr>
|
|
194
|
+
</table>
|
|
195
|
+
|
|
196
|
+
<table>
|
|
197
|
+
<tr>
|
|
198
|
+
<td>
|
|
199
|
+
|
|
183
200
|
### Repo Galaxy
|
|
184
201
|
|
|
185
202
|
`repo-galaxy`: your most starred repositories orbit a sun. A bigger planet has more stars, and its color is the repository's main language. Repositories you pushed to recently orbit closer to the sun.
|
|
@@ -0,0 +1,68 @@
|
|
|
1
|
+
/**
|
|
2
|
+
* One camera over one world: a key list `{ frame, x, y, z }` interpolated with
|
|
3
|
+
* a single travel curve, so almost all motion happens in the middle third of a
|
|
4
|
+
* move (Highlights Reel's camera, shared with Trail Profile).
|
|
5
|
+
*
|
|
6
|
+
* Zoom travels in log space, so leaving a deep push-in pulls back as fast as it
|
|
7
|
+
* pans. A long move dips its zoom at the midpoint and pushes in to land; short
|
|
8
|
+
* hops stay flat. Held shots are still, and `frameFloat` wraps so `t = 1` snaps
|
|
9
|
+
* bitwise to `t = 0`, closing the loop to the pixel.
|
|
10
|
+
*/
|
|
11
|
+
/** The default travel curve: almost all motion happens in the middle third. */
|
|
12
|
+
export const easeQuartic = (t) => t < 0.5 ? 8 * t ** 4 : 1 - (-2 * t + 2) ** 4 / 2;
|
|
13
|
+
/** A gentler cruise, used for long flights: cubic in-out. */
|
|
14
|
+
export const easeCubic = (t) => (t < 0.5 ? 4 * t ** 3 : 1 - (-2 * t + 2) ** 3 / 2);
|
|
15
|
+
const clamp01 = (v) => Math.min(1, Math.max(0, v));
|
|
16
|
+
/** The camera between keys: one curve, with a zoom dip on long moves. */
|
|
17
|
+
export function shotAt(keys, frame, opts) {
|
|
18
|
+
const ease = opts.ease ?? easeQuartic;
|
|
19
|
+
if (frame <= keys[0].frame) {
|
|
20
|
+
return { x: keys[0].x, y: keys[0].y, z: keys[0].z };
|
|
21
|
+
}
|
|
22
|
+
const last = keys[keys.length - 1];
|
|
23
|
+
if (frame >= last.frame) {
|
|
24
|
+
return { x: last.x, y: last.y, z: last.z };
|
|
25
|
+
}
|
|
26
|
+
let index = 0;
|
|
27
|
+
while (index < keys.length - 2 && keys[index + 1].frame <= frame) {
|
|
28
|
+
index++;
|
|
29
|
+
}
|
|
30
|
+
const from = keys[index];
|
|
31
|
+
const to = keys[index + 1];
|
|
32
|
+
const t = clamp01((frame - from.frame) / (to.frame - from.frame));
|
|
33
|
+
const travelled = ease(t);
|
|
34
|
+
const distance = Math.hypot(to.x - from.x, to.y - from.y);
|
|
35
|
+
const dip = distance > opts.travel
|
|
36
|
+
? 1 - 0.22 * Math.sin(Math.PI * t) * Math.min(1, distance / opts.span)
|
|
37
|
+
: 1;
|
|
38
|
+
return {
|
|
39
|
+
x: from.x + (to.x - from.x) * travelled,
|
|
40
|
+
y: from.y + (to.y - from.y) * travelled,
|
|
41
|
+
z: from.z * (to.z / from.z) ** travelled * dip,
|
|
42
|
+
};
|
|
43
|
+
}
|
|
44
|
+
/**
|
|
45
|
+
* The camera at a moment of the loop. Held shots are still: any drift, even in
|
|
46
|
+
* whole-pixel steps, reads as the scene stepping or the type vibrating.
|
|
47
|
+
*/
|
|
48
|
+
export function cameraAt(keys, frameFloat, frames, opts) {
|
|
49
|
+
// t = 1 snaps to 0, so the last frame is bit-identical to the first.
|
|
50
|
+
const t = frameFloat >= frames ? 0 : (((frameFloat / frames) % 1) + 1) % 1;
|
|
51
|
+
return shotAt(keys, t * frames, opts);
|
|
52
|
+
}
|
|
53
|
+
/** How fast the frame is moving, in screen pixels, zoom included. */
|
|
54
|
+
export function speedAt(keys, frameFloat, frames, opts) {
|
|
55
|
+
const now = cameraAt(keys, frameFloat, frames, opts);
|
|
56
|
+
const before = cameraAt(keys, frameFloat - 1, frames, opts);
|
|
57
|
+
return ((Math.hypot(now.x - before.x, now.y - before.y) + Math.abs(now.z - before.z) * 700) * now.z);
|
|
58
|
+
}
|
|
59
|
+
/**
|
|
60
|
+
* Applies the world transform, snapped to whole screen pixels. At a fixed zoom
|
|
61
|
+
* the drift then moves the scene in 1 px steps instead of resampling every
|
|
62
|
+
* glyph each frame at a new sub-pixel offset, which reads as vibrating type.
|
|
63
|
+
* `(cx, cy)` is the viewport's centre in screen space.
|
|
64
|
+
*/
|
|
65
|
+
export function applyCamera(ctx, cam, cx, cy) {
|
|
66
|
+
ctx.translate(Math.round(cx - cam.x * cam.z), Math.round(cy - cam.y * cam.z));
|
|
67
|
+
ctx.scale(cam.z, cam.z);
|
|
68
|
+
}
|
|
@@ -1,3 +1,4 @@
|
|
|
1
|
+
import { applyCamera, cameraAt, speedAt } from '../../core/camera.js';
|
|
1
2
|
import { fitIdentity } from '../../core/text.js';
|
|
2
3
|
import { FRAMES, LAYOUT, plateAt, stationOf, } from './reel.js';
|
|
3
4
|
/**
|
|
@@ -26,8 +27,8 @@ const TAU = Math.PI * 2;
|
|
|
26
27
|
export const IDENTITY_COLUMN = 440 - 48;
|
|
27
28
|
const clamp01 = (v) => Math.min(1, Math.max(0, v));
|
|
28
29
|
const easeOutCubic = (t) => 1 - (1 - t) ** 3;
|
|
29
|
-
/**
|
|
30
|
-
const
|
|
30
|
+
/** Camera tuning: moves longer than `travel` dip their zoom, scaled to `span`. */
|
|
31
|
+
const CAMERA = { travel: LAYOUT.travel, span: 2400 };
|
|
31
32
|
function smoothstep(e0, e1, x) {
|
|
32
33
|
const t = clamp01((x - e0) / (e1 - e0));
|
|
33
34
|
return t * t * (3 - 2 * t);
|
|
@@ -88,51 +89,10 @@ export function createReelSketch(reel, identity) {
|
|
|
88
89
|
website: identity.website && `↗ ${displayUrl(identity.website)}`,
|
|
89
90
|
}, IDENTITY_COLUMN);
|
|
90
91
|
// --- camera ---------------------------------------------------------------
|
|
91
|
-
/** The camera
|
|
92
|
-
|
|
93
|
-
const keys = reel.plan.keys;
|
|
94
|
-
if (frame <= keys[0].frame) {
|
|
95
|
-
return { x: keys[0].x, y: keys[0].y, z: keys[0].z };
|
|
96
|
-
}
|
|
97
|
-
const last = keys[keys.length - 1];
|
|
98
|
-
if (frame >= last.frame) {
|
|
99
|
-
return { x: last.x, y: last.y, z: last.z };
|
|
100
|
-
}
|
|
101
|
-
let index = 0;
|
|
102
|
-
while (index < keys.length - 2 && keys[index + 1].frame <= frame) {
|
|
103
|
-
index++;
|
|
104
|
-
}
|
|
105
|
-
const from = keys[index];
|
|
106
|
-
const to = keys[index + 1];
|
|
107
|
-
const t = clamp01((frame - from.frame) / (to.frame - from.frame));
|
|
108
|
-
const travelled = travelEase(t);
|
|
109
|
-
const distance = Math.hypot(to.x - from.x, to.y - from.y);
|
|
110
|
-
// Zoom travels in log space, so leaving a deep push-in pulls back as fast
|
|
111
|
-
// as it pans. A long move also dips at its midpoint and pushes in to land.
|
|
112
|
-
const dip = distance > LAYOUT.travel
|
|
113
|
-
? 1 - 0.22 * Math.sin(Math.PI * t) * Math.min(1, distance / 2400)
|
|
114
|
-
: 1;
|
|
115
|
-
return {
|
|
116
|
-
x: from.x + (to.x - from.x) * travelled,
|
|
117
|
-
y: from.y + (to.y - from.y) * travelled,
|
|
118
|
-
z: from.z * (to.z / from.z) ** travelled * dip,
|
|
119
|
-
};
|
|
120
|
-
}
|
|
121
|
-
/**
|
|
122
|
-
* The camera at a moment of the loop. Held shots are still: any drift, even
|
|
123
|
-
* in whole-pixel steps, reads as the cards stepping or the type vibrating.
|
|
124
|
-
*/
|
|
125
|
-
function camera(frameFloat) {
|
|
126
|
-
// t = 1 snaps to 0, so the last frame is bit-identical to the first.
|
|
127
|
-
const t = frameFloat >= FRAMES ? 0 : (((frameFloat / FRAMES) % 1) + 1) % 1;
|
|
128
|
-
return rawShot(t * FRAMES);
|
|
129
|
-
}
|
|
92
|
+
/** The camera at a moment of the loop (see `core/camera.ts`). */
|
|
93
|
+
const camera = (frameFloat) => cameraAt(reel.plan.keys, frameFloat, FRAMES, CAMERA);
|
|
130
94
|
/** How fast the frame is moving, in screen pixels, zoom included. */
|
|
131
|
-
|
|
132
|
-
const now = camera(frameFloat);
|
|
133
|
-
const before = camera(frameFloat - 1);
|
|
134
|
-
return ((Math.hypot(now.x - before.x, now.y - before.y) + Math.abs(now.z - before.z) * 700) * now.z);
|
|
135
|
-
}
|
|
95
|
+
const speedOf = (frameFloat) => speedAt(reel.plan.keys, frameFloat, FRAMES, CAMERA);
|
|
136
96
|
/** A card builds while the camera arrives; an empty window means already finished. */
|
|
137
97
|
function buildAt(window, frameFloat) {
|
|
138
98
|
if (window.end <= window.start)
|
|
@@ -535,11 +495,10 @@ export function createReelSketch(reel, identity) {
|
|
|
535
495
|
setFill(ctx, PALETTE.desk);
|
|
536
496
|
ctx.fillRect(0, 0, W, H);
|
|
537
497
|
ctx.save();
|
|
538
|
-
// Snap the world to whole screen pixels
|
|
539
|
-
// moves the cards in 1 px steps instead of resampling
|
|
540
|
-
// frame at a new sub-pixel offset
|
|
541
|
-
ctx
|
|
542
|
-
ctx.scale(cam.z, cam.z);
|
|
498
|
+
// Snap the world to whole screen pixels (see `applyCamera`): at a fixed
|
|
499
|
+
// zoom the drift then moves the cards in 1 px steps instead of resampling
|
|
500
|
+
// every glyph each frame at a new sub-pixel offset.
|
|
501
|
+
applyCamera(ctx, cam, W / 2, H / 2);
|
|
543
502
|
drawDots(ctx, cam, speed);
|
|
544
503
|
for (let i = 0; i < reel.cards.length; i++)
|
|
545
504
|
drawMarks(ctx, i);
|
package/dist/styles/index.js
CHANGED
|
@@ -3,6 +3,7 @@ import { highlightsReel } from './highlights-reel/index.js';
|
|
|
3
3
|
import { nowPlaying } from './now-playing/index.js';
|
|
4
4
|
import { receipt } from './receipt/index.js';
|
|
5
5
|
import { repoGalaxy } from './repo-galaxy/index.js';
|
|
6
|
+
import { trailProfile } from './trail-profile/index.js';
|
|
6
7
|
/** Built-in styles, keyed by id. */
|
|
7
8
|
export const styles = {
|
|
8
9
|
[contributionCity.id]: contributionCity,
|
|
@@ -10,4 +11,5 @@ export const styles = {
|
|
|
10
11
|
[nowPlaying.id]: nowPlaying,
|
|
11
12
|
[receipt.id]: receipt,
|
|
12
13
|
[repoGalaxy.id]: repoGalaxy,
|
|
14
|
+
[trailProfile.id]: trailProfile,
|
|
13
15
|
};
|
|
@@ -0,0 +1,16 @@
|
|
|
1
|
+
import { contributionsSchema, fetchContributions, } from '../../core/data/contributions.js';
|
|
2
|
+
import { buildTrail, FRAMES } from './trail.js';
|
|
3
|
+
import { options } from './options.js';
|
|
4
|
+
import { paletteOf, pinnedOf } from './palette.js';
|
|
5
|
+
import { createTrailSketch } from './sketch.js';
|
|
6
|
+
export const trailProfile = {
|
|
7
|
+
id: 'trail-profile',
|
|
8
|
+
fps: 25,
|
|
9
|
+
frames: FRAMES,
|
|
10
|
+
pinned: (o) => pinnedOf(paletteOf(o)),
|
|
11
|
+
data: { name: 'contributions', schema: contributionsSchema, fetch: fetchContributions },
|
|
12
|
+
options,
|
|
13
|
+
createSketch({ data, identity, options, rng }) {
|
|
14
|
+
return createTrailSketch(buildTrail(data, identity, paletteOf(options)), rng);
|
|
15
|
+
},
|
|
16
|
+
};
|
|
@@ -0,0 +1,50 @@
|
|
|
1
|
+
/** `over` at `alpha` over `base`, both opaque. */
|
|
2
|
+
export function blend(over, base, alpha) {
|
|
3
|
+
return [
|
|
4
|
+
Math.round(over[0] * alpha + base[0] * (1 - alpha)),
|
|
5
|
+
Math.round(over[1] * alpha + base[1] * (1 - alpha)),
|
|
6
|
+
Math.round(over[2] * alpha + base[2] * (1 - alpha)),
|
|
7
|
+
];
|
|
8
|
+
}
|
|
9
|
+
/** Survey-map contour brown, new to this style; the others keep shared names. */
|
|
10
|
+
const ACCENT_VALUES = {
|
|
11
|
+
sienna: [138, 75, 34], // #8A4B22
|
|
12
|
+
cobalt: [47, 85, 212], // #2F55D4
|
|
13
|
+
green: [31, 107, 58], // #1F6B3A
|
|
14
|
+
violet: [106, 63, 200], // #6A3FC8
|
|
15
|
+
};
|
|
16
|
+
const BASE = {
|
|
17
|
+
paper: [243, 239, 227], // #F3EFE3
|
|
18
|
+
ink: [43, 38, 32], // #2B2620
|
|
19
|
+
muted: [107, 99, 88], // #6B6358
|
|
20
|
+
graticule: [47, 111, 168], // #2F6FA8
|
|
21
|
+
flag: [200, 16, 46], // #C8102E
|
|
22
|
+
};
|
|
23
|
+
export function paletteOf(options) {
|
|
24
|
+
const accent = ACCENT_VALUES[options.accent];
|
|
25
|
+
const paper = BASE.paper;
|
|
26
|
+
return {
|
|
27
|
+
...BASE,
|
|
28
|
+
accent,
|
|
29
|
+
// Pre-blended solids, drawn opaque so the encoder can pin them: alpha
|
|
30
|
+
// strokes anti-alias into a ramp of near-identical colors that dithers
|
|
31
|
+
// and re-shuffles every frame the camera moves.
|
|
32
|
+
strata: blend(accent, paper, 0.6),
|
|
33
|
+
graticule: blend(BASE.graticule, paper, 0.35),
|
|
34
|
+
stipple: blend(BASE.ink, paper, 0.55),
|
|
35
|
+
grid: blend(BASE.ink, paper, 0.15),
|
|
36
|
+
};
|
|
37
|
+
}
|
|
38
|
+
/** Flat colors the encoder keeps exact and undithered. */
|
|
39
|
+
export function pinnedOf(palette) {
|
|
40
|
+
return [
|
|
41
|
+
palette.paper,
|
|
42
|
+
palette.ink,
|
|
43
|
+
palette.accent,
|
|
44
|
+
palette.flag,
|
|
45
|
+
palette.strata,
|
|
46
|
+
palette.graticule,
|
|
47
|
+
palette.stipple,
|
|
48
|
+
palette.grid,
|
|
49
|
+
];
|
|
50
|
+
}
|
|
@@ -0,0 +1,231 @@
|
|
|
1
|
+
/**
|
|
2
|
+
* The contribution calendar as a trail profile: one column per week, each
|
|
3
|
+
* week's total the trail's elevation at that point of the year.
|
|
4
|
+
*
|
|
5
|
+
* Elevation is built so the busiest week is always the highest point, and the
|
|
6
|
+
* line never shows a peak the data does not have: weekly totals sit at their
|
|
7
|
+
* column centres and are joined with monotone cubic interpolation
|
|
8
|
+
* (Fritsch-Carlson), which never overshoots. The profile peaks at exactly the
|
|
9
|
+
* summit total at the busiest week (ties go to the latest week), and it stays
|
|
10
|
+
* on the ground line across empty weeks and the flat margins.
|
|
11
|
+
*
|
|
12
|
+
* Heights are in contributions per week. The profile is sampled once (every 4
|
|
13
|
+
* world units) and simplified (Ramer-Douglas-Peucker, epsilon 1); the strata
|
|
14
|
+
* spans, the x ranges where the trail is above each level, are computed once
|
|
15
|
+
* here. Nothing is derived per frame.
|
|
16
|
+
*/
|
|
17
|
+
/** One week column; one empty column flanks the calendar on each side. */
|
|
18
|
+
export const CELL = 48;
|
|
19
|
+
/** The sheet is 2.2:1, the viewport's aspect, so the wide shot fills the frame. */
|
|
20
|
+
export const WORLD_H = 1200;
|
|
21
|
+
/** World y of elevation 0, and of the summit (the busiest week). */
|
|
22
|
+
export const GROUND_Y = 1080;
|
|
23
|
+
export const SUMMIT_Y = 300;
|
|
24
|
+
/** Profile sampling pitch and simplification, world units. */
|
|
25
|
+
const SAMPLE = 4;
|
|
26
|
+
const SPAN_SAMPLE = 2;
|
|
27
|
+
const RDP_EPSILON = 1;
|
|
28
|
+
export const MAX_LEVELS = 8;
|
|
29
|
+
const clamp = (v, lo, hi) => Math.min(hi, Math.max(lo, v));
|
|
30
|
+
/**
|
|
31
|
+
* The contour interval: the smallest of 1, 2, 5, 10, 20, 50, ... that gives at
|
|
32
|
+
* most `MAX_LEVELS` levels up to the summit, never below 1 contribution.
|
|
33
|
+
*/
|
|
34
|
+
export function contourInterval(summit) {
|
|
35
|
+
const series = [];
|
|
36
|
+
for (let pow = 1; pow <= 1e6; pow *= 10)
|
|
37
|
+
series.push(pow, pow * 2, pow * 5);
|
|
38
|
+
return series.find((step) => Math.floor(summit / step) <= MAX_LEVELS) ?? series.at(-1);
|
|
39
|
+
}
|
|
40
|
+
/**
|
|
41
|
+
* Fritsch-Carlson monotone cubic interpolation over uniformly spaced nodes:
|
|
42
|
+
* the curve never overshoots, so it stays 0 across a run of empty weeks and
|
|
43
|
+
* peaks at exactly the node value at a peak node.
|
|
44
|
+
*/
|
|
45
|
+
export function monotoneCubic(nodes, pitch, x0) {
|
|
46
|
+
const n = nodes.length;
|
|
47
|
+
const delta = [];
|
|
48
|
+
for (let i = 0; i < n - 1; i++)
|
|
49
|
+
delta.push((nodes[i + 1] - nodes[i]) / pitch);
|
|
50
|
+
const m = Array.from({ length: n });
|
|
51
|
+
m[0] = delta[0] ?? 0;
|
|
52
|
+
m[n - 1] = delta[n - 2] ?? 0;
|
|
53
|
+
for (let i = 1; i < n - 1; i++) {
|
|
54
|
+
if (delta[i - 1] * delta[i] <= 0) {
|
|
55
|
+
m[i] = 0;
|
|
56
|
+
continue;
|
|
57
|
+
}
|
|
58
|
+
// Weighted harmonic mean of the two segment slopes (equal pitches here),
|
|
59
|
+
// which never exceeds either in magnitude, so the curve stays monotone.
|
|
60
|
+
m[i] = (2 * delta[i - 1] * delta[i]) / (delta[i - 1] + delta[i]);
|
|
61
|
+
}
|
|
62
|
+
return (x) => {
|
|
63
|
+
if (n === 1)
|
|
64
|
+
return nodes[0];
|
|
65
|
+
const u = clamp((x - x0) / pitch, 0, n - 1);
|
|
66
|
+
const i = Math.min(Math.floor(u), n - 2);
|
|
67
|
+
const t = u - i;
|
|
68
|
+
const t2 = t * t;
|
|
69
|
+
const t3 = t2 * t;
|
|
70
|
+
return ((2 * t3 - 3 * t2 + 1) * nodes[i] +
|
|
71
|
+
(t3 - 2 * t2 + t) * pitch * m[i] +
|
|
72
|
+
(-2 * t3 + 3 * t2) * nodes[i + 1] +
|
|
73
|
+
(t3 - t2) * pitch * m[i + 1]);
|
|
74
|
+
};
|
|
75
|
+
}
|
|
76
|
+
/** Ramer-Douglas-Peucker, iterative. */
|
|
77
|
+
function simplify(points, epsilon) {
|
|
78
|
+
if (points.length < 3)
|
|
79
|
+
return points;
|
|
80
|
+
const keep = new Uint8Array(points.length);
|
|
81
|
+
keep[0] = 1;
|
|
82
|
+
keep[points.length - 1] = 1;
|
|
83
|
+
const stack = [[0, points.length - 1]];
|
|
84
|
+
while (stack.length > 0) {
|
|
85
|
+
const [lo, hi] = stack.pop();
|
|
86
|
+
if (hi - lo < 2)
|
|
87
|
+
continue;
|
|
88
|
+
const [ax, ay] = points[lo];
|
|
89
|
+
const [bx, by] = points[hi];
|
|
90
|
+
const dx = bx - ax;
|
|
91
|
+
const dy = by - ay;
|
|
92
|
+
const len = Math.hypot(dx, dy) || 1;
|
|
93
|
+
let far = -1;
|
|
94
|
+
let dist = 0;
|
|
95
|
+
for (let i = lo + 1; i < hi; i++) {
|
|
96
|
+
const [px, py] = points[i];
|
|
97
|
+
const d = Math.abs((px - ax) * dy - (py - ay) * dx) / len;
|
|
98
|
+
if (d > dist) {
|
|
99
|
+
dist = d;
|
|
100
|
+
far = i;
|
|
101
|
+
}
|
|
102
|
+
}
|
|
103
|
+
if (dist > epsilon && far > 0) {
|
|
104
|
+
keep[far] = 1;
|
|
105
|
+
stack.push([lo, far], [far, hi]);
|
|
106
|
+
}
|
|
107
|
+
}
|
|
108
|
+
return points.filter((_, i) => keep[i]);
|
|
109
|
+
}
|
|
110
|
+
/** The x ranges where the trail is at or above `level` contributions. */
|
|
111
|
+
function spansAbove(trail, level, x0, x1) {
|
|
112
|
+
const spans = [];
|
|
113
|
+
const f = (x) => trail(x) - level;
|
|
114
|
+
let start = null;
|
|
115
|
+
let prevX = x0;
|
|
116
|
+
let prevF = f(x0);
|
|
117
|
+
if (prevF >= 0)
|
|
118
|
+
start = x0;
|
|
119
|
+
for (let x = x0 + SPAN_SAMPLE; x <= x1 + 1e-9; x += SPAN_SAMPLE) {
|
|
120
|
+
const curF = f(x);
|
|
121
|
+
if (prevF < 0 && curF >= 0 && start === null) {
|
|
122
|
+
start = prevX + (SPAN_SAMPLE * -prevF) / (curF - prevF);
|
|
123
|
+
}
|
|
124
|
+
else if (prevF >= 0 && curF < 0 && start !== null) {
|
|
125
|
+
spans.push([start, prevX + (SPAN_SAMPLE * prevF) / (prevF - curF)]);
|
|
126
|
+
start = null;
|
|
127
|
+
}
|
|
128
|
+
prevX = x;
|
|
129
|
+
prevF = curF;
|
|
130
|
+
}
|
|
131
|
+
if (start !== null)
|
|
132
|
+
spans.push([start, x1]);
|
|
133
|
+
return spans;
|
|
134
|
+
}
|
|
135
|
+
export function buildProfile(contributions) {
|
|
136
|
+
const cols = contributions.weeks.length;
|
|
137
|
+
const world = { w: (cols + 2) * CELL, h: WORLD_H };
|
|
138
|
+
const mapArea = { x0: CELL, y0: 48, x1: world.w - CELL, y1: world.h - 48 };
|
|
139
|
+
const weekX = (i) => mapArea.x0 + (i + 0.5) * CELL;
|
|
140
|
+
// Weekly totals; days outside the window are skipped.
|
|
141
|
+
const weeks = contributions.weeks.map((week) => {
|
|
142
|
+
let total = 0;
|
|
143
|
+
for (const day of week) {
|
|
144
|
+
if (day.date < contributions.from || day.date > contributions.to)
|
|
145
|
+
continue;
|
|
146
|
+
total += day.count;
|
|
147
|
+
}
|
|
148
|
+
return { from: week[0].date, to: week.at(-1).date, total };
|
|
149
|
+
});
|
|
150
|
+
// The busiest week; ties go to the latest.
|
|
151
|
+
let summitWeek = -1;
|
|
152
|
+
let summitTotal = 0;
|
|
153
|
+
weeks.forEach(({ total }, i) => {
|
|
154
|
+
if (total >= summitTotal && total > 0) {
|
|
155
|
+
summitTotal = total;
|
|
156
|
+
summitWeek = i;
|
|
157
|
+
}
|
|
158
|
+
});
|
|
159
|
+
// Zero nodes in the margins keep the sheet's edges flat ground.
|
|
160
|
+
const trail = monotoneCubic([0, ...weeks.map((w) => w.total), 0], CELL, mapArea.x0 - CELL / 2);
|
|
161
|
+
const scale = (GROUND_Y - SUMMIT_Y) / (summitTotal || 1);
|
|
162
|
+
const profileY = (x) => GROUND_Y - trail(x) * scale;
|
|
163
|
+
const line = [];
|
|
164
|
+
for (let x = mapArea.x0; x <= mapArea.x1 + 1e-9; x += SAMPLE) {
|
|
165
|
+
line.push([Math.min(x, mapArea.x1), profileY(Math.min(x, mapArea.x1))]);
|
|
166
|
+
}
|
|
167
|
+
const summit = summitWeek >= 0
|
|
168
|
+
? {
|
|
169
|
+
week: summitWeek,
|
|
170
|
+
total: summitTotal,
|
|
171
|
+
from: weeks[summitWeek].from,
|
|
172
|
+
to: weeks[summitWeek].to,
|
|
173
|
+
x: weekX(summitWeek),
|
|
174
|
+
y: profileY(weekX(summitWeek)),
|
|
175
|
+
}
|
|
176
|
+
: null;
|
|
177
|
+
const levels = [];
|
|
178
|
+
let interval = 0;
|
|
179
|
+
if (summit) {
|
|
180
|
+
interval = contourInterval(summit.total);
|
|
181
|
+
for (let k = 1; k * interval <= summit.total + 1e-9; k++) {
|
|
182
|
+
const height = k * interval;
|
|
183
|
+
levels.push({
|
|
184
|
+
height,
|
|
185
|
+
y: GROUND_Y - height * scale,
|
|
186
|
+
kind: k % 5 === 0 ? 'index' : 'intermediate',
|
|
187
|
+
spans: spansAbove(trail, height, mapArea.x0, mapArea.x1),
|
|
188
|
+
});
|
|
189
|
+
}
|
|
190
|
+
}
|
|
191
|
+
// Spot heights: the next 3 busiest weeks that are local maxima of the
|
|
192
|
+
// profile, at least 4 weeks from the summit and from each other.
|
|
193
|
+
const spots = [];
|
|
194
|
+
if (summit) {
|
|
195
|
+
const order = weeks
|
|
196
|
+
.map(({ total }, i) => ({ total, i }))
|
|
197
|
+
.filter(({ total, i }) => total > 0 && i !== summit.week)
|
|
198
|
+
.sort((a, b) => b.total - a.total || a.i - b.i);
|
|
199
|
+
const isPeak = (i) => {
|
|
200
|
+
const left = i > 0 ? weeks[i - 1].total : 0;
|
|
201
|
+
const right = i < weeks.length - 1 ? weeks[i + 1].total : 0;
|
|
202
|
+
const v = weeks[i].total;
|
|
203
|
+
return v >= left && v >= right && (v > left || v > right);
|
|
204
|
+
};
|
|
205
|
+
const taken = [summit.week];
|
|
206
|
+
for (const { total, i } of order) {
|
|
207
|
+
if (spots.length >= 3)
|
|
208
|
+
break;
|
|
209
|
+
if (!isPeak(i))
|
|
210
|
+
continue;
|
|
211
|
+
if (taken.some((w) => Math.abs(w - i) < 4))
|
|
212
|
+
continue;
|
|
213
|
+
taken.push(i);
|
|
214
|
+
spots.push({ week: i, total, x: weekX(i), y: profileY(weekX(i)) });
|
|
215
|
+
}
|
|
216
|
+
}
|
|
217
|
+
return {
|
|
218
|
+
cols,
|
|
219
|
+
world,
|
|
220
|
+
mapArea,
|
|
221
|
+
weeks,
|
|
222
|
+
interval,
|
|
223
|
+
levels,
|
|
224
|
+
line: simplify(line, RDP_EPSILON),
|
|
225
|
+
summit,
|
|
226
|
+
spots,
|
|
227
|
+
profileY,
|
|
228
|
+
weekX,
|
|
229
|
+
weekAt: (x) => clamp(Math.floor((x - mapArea.x0) / CELL), 0, cols - 1),
|
|
230
|
+
};
|
|
231
|
+
}
|
|
@@ -0,0 +1,485 @@
|
|
|
1
|
+
import { applyCamera, cameraAt } from '../../core/camera.js';
|
|
2
|
+
import { altimeterLine, FRAMES, LAYOUT, markerAt, summitDates } from './trail.js';
|
|
3
|
+
import { CELL, GROUND_Y } from './profile.js';
|
|
4
|
+
import {} from './palette.js';
|
|
5
|
+
/**
|
|
6
|
+
* A printed trail profile sheet, walked by one camera.
|
|
7
|
+
*
|
|
8
|
+
* Everything that covers area is flat and pinned (paper, collar), and the
|
|
9
|
+
* sheet's line work is rasterized like a plotter: the profile and the ground
|
|
10
|
+
* line as pure 1px pixel runs, the strata as horizontal spans, the relief as
|
|
11
|
+
* engraved stipple dots. This is not only the printed look the style wants -
|
|
12
|
+
* measured on the top-down draft this style replaces, anti-aliased strokes
|
|
13
|
+
* re-derive their fringes on every camera move, which dithers across a
|
|
14
|
+
* hundred colors and re-shuffles every frame, bloating the GIF to 20 MB;
|
|
15
|
+
* rasterized onto whole pixels the loop is a few MB.
|
|
16
|
+
*
|
|
17
|
+
* The collar, text, graticule, grid, spot heights, summit, marker and
|
|
18
|
+
* neatline stay vector through the raw context (style set right before each
|
|
19
|
+
* draw; see Highlights Reel's note on p5's cached fill state). Small type
|
|
20
|
+
* that would read as dithered noise at the wide shot (grid and month labels,
|
|
21
|
+
* spot figures, the summit label) fades in with zoom, as Highlights Reel's
|
|
22
|
+
* busiest-week rule does for its day cells.
|
|
23
|
+
*/
|
|
24
|
+
const SANS = '"Space Grotesk"';
|
|
25
|
+
const MONO = '"JetBrains Mono"';
|
|
26
|
+
const TAU = Math.PI * 2;
|
|
27
|
+
const { width: W, height: H, viewport, collar: COLLAR } = LAYOUT;
|
|
28
|
+
/** Camera dip tuning: moves longer than `travel` dip, scaled to `span`. */
|
|
29
|
+
const CAMERA = { travel: LAYOUT.travel, span: LAYOUT.span };
|
|
30
|
+
/** Hairline weights in screen px: the neatline's heavy rule. */
|
|
31
|
+
const LINE = { neatHeavy: 2.4, neatThin: 1 };
|
|
32
|
+
/** Small type appears as the camera closes in (zoom thresholds). */
|
|
33
|
+
const LABEL_Z = { sheet: [0.36, 0.42], summit: [1.15, 1.5] };
|
|
34
|
+
/** Screen size of the sheet's small type. */
|
|
35
|
+
const LABEL_SIZE = 10;
|
|
36
|
+
/** Stipple relief: engraving pitch, and the density under the profile line. */
|
|
37
|
+
const STIPPLE_PITCH = 10;
|
|
38
|
+
const STIPPLE_BASE = 0.05;
|
|
39
|
+
const STIPPLE_MAX = 0.3;
|
|
40
|
+
function viewOf(cam) {
|
|
41
|
+
return {
|
|
42
|
+
ox: Math.round(viewport.cx - cam.x * cam.z),
|
|
43
|
+
oy: Math.round(viewport.cy - cam.y * cam.z),
|
|
44
|
+
z: cam.z,
|
|
45
|
+
};
|
|
46
|
+
}
|
|
47
|
+
const clamp01 = (v) => Math.min(1, Math.max(0, v));
|
|
48
|
+
function smoothstep(e0, e1, x) {
|
|
49
|
+
const t = clamp01((x - e0) / (e1 - e0));
|
|
50
|
+
return t * t * (3 - 2 * t);
|
|
51
|
+
}
|
|
52
|
+
function rgba(color, alpha = 1) {
|
|
53
|
+
return `rgba(${color[0]},${color[1]},${color[2]},${alpha})`;
|
|
54
|
+
}
|
|
55
|
+
function setFill(ctx, color, alpha = 1) {
|
|
56
|
+
ctx.fillStyle = rgba(color, alpha);
|
|
57
|
+
}
|
|
58
|
+
function setStroke(ctx, color, alpha = 1) {
|
|
59
|
+
ctx.strokeStyle = rgba(color, alpha);
|
|
60
|
+
}
|
|
61
|
+
function setFont(ctx, o) {
|
|
62
|
+
ctx.font = `${o.bold ? 700 : 400} ${o.size}px ${o.mono ? MONO : SANS}`;
|
|
63
|
+
ctx.textAlign = o.align ?? 'left';
|
|
64
|
+
ctx.textBaseline = o.baseline ?? 'alphabetic';
|
|
65
|
+
ctx.letterSpacing = `${o.tracking ?? 0}px`;
|
|
66
|
+
}
|
|
67
|
+
function drawText(ctx, str, x, y, o) {
|
|
68
|
+
setFont(ctx, o);
|
|
69
|
+
setFill(ctx, o.color, o.alpha ?? 1);
|
|
70
|
+
ctx.fillText(str, x, y);
|
|
71
|
+
if (o.tracking)
|
|
72
|
+
ctx.letterSpacing = '0px';
|
|
73
|
+
}
|
|
74
|
+
/**
|
|
75
|
+
* The relief, engraved: one stipple dot per jittered grid cell where a seeded
|
|
76
|
+
* draw falls under the cell's density. Density is highest just below the
|
|
77
|
+
* profile line and falls off with depth, so the silhouette reads at the wide
|
|
78
|
+
* shot; flat ground takes no dots, because there is nothing under it. Dots
|
|
79
|
+
* are placed once, in world space, and plotted as single pixels every frame.
|
|
80
|
+
*/
|
|
81
|
+
function stippleDots(model, next) {
|
|
82
|
+
const { mapArea, profileY } = model.profile;
|
|
83
|
+
const dots = [];
|
|
84
|
+
for (let y = STIPPLE_PITCH / 2; y < GROUND_Y; y += STIPPLE_PITCH) {
|
|
85
|
+
for (let x = STIPPLE_PITCH / 2; x < mapArea.x1; x += STIPPLE_PITCH) {
|
|
86
|
+
if (x < mapArea.x0)
|
|
87
|
+
continue;
|
|
88
|
+
const surface = profileY(x);
|
|
89
|
+
if (y <= surface)
|
|
90
|
+
continue;
|
|
91
|
+
const depth = (y - surface) / (GROUND_Y - surface);
|
|
92
|
+
const density = STIPPLE_BASE + STIPPLE_MAX * (1 - depth) ** 3;
|
|
93
|
+
if (next() >= density)
|
|
94
|
+
continue;
|
|
95
|
+
const jx = (next() - 0.5) * 0.8 * STIPPLE_PITCH;
|
|
96
|
+
const jy = (next() - 0.5) * 0.8 * STIPPLE_PITCH;
|
|
97
|
+
dots.push(x + jx, y + jy);
|
|
98
|
+
}
|
|
99
|
+
}
|
|
100
|
+
return dots;
|
|
101
|
+
}
|
|
102
|
+
/**
|
|
103
|
+
* A plotter hairline between two screen-integer points: Bresenham, batching
|
|
104
|
+
* pixels on the same row into one fillRect so a mostly-horizontal line is a
|
|
105
|
+
* few wide runs instead of one call per pixel. Segments that round to the
|
|
106
|
+
* same pixel are a single dot. `across` shifts the whole line one pixel
|
|
107
|
+
* sideways for the profile line's and the index strata's weight.
|
|
108
|
+
*/
|
|
109
|
+
function plotHairline(ctx, ax, ay, bx, by, across) {
|
|
110
|
+
const ox = across?.[0] ?? 0;
|
|
111
|
+
const oy = across?.[1] ?? 0;
|
|
112
|
+
let x = Math.round(ax) + ox;
|
|
113
|
+
let y = Math.round(ay) + oy;
|
|
114
|
+
const endX = Math.round(bx) + ox;
|
|
115
|
+
const endY = Math.round(by) + oy;
|
|
116
|
+
const dx = Math.abs(endX - x);
|
|
117
|
+
const dy = -Math.abs(endY - y);
|
|
118
|
+
if (dx === 0 && dy === 0) {
|
|
119
|
+
ctx.fillRect(x, y, 1, 1);
|
|
120
|
+
return;
|
|
121
|
+
}
|
|
122
|
+
const sx = x < endX ? 1 : -1;
|
|
123
|
+
const sy = y < endY ? 1 : -1;
|
|
124
|
+
let err = dx + dy;
|
|
125
|
+
let runX = x;
|
|
126
|
+
let runY = y;
|
|
127
|
+
for (;;) {
|
|
128
|
+
const lastX = x;
|
|
129
|
+
const e2 = 2 * err;
|
|
130
|
+
if (e2 >= dy) {
|
|
131
|
+
err += dy;
|
|
132
|
+
x += sx;
|
|
133
|
+
}
|
|
134
|
+
if (e2 <= dx) {
|
|
135
|
+
// The row changed: flush the run and start the next.
|
|
136
|
+
ctx.fillRect(Math.min(runX, lastX), runY, Math.abs(lastX - runX) + 1, 1);
|
|
137
|
+
err += dx;
|
|
138
|
+
y += sy;
|
|
139
|
+
runY = y;
|
|
140
|
+
runX = x;
|
|
141
|
+
}
|
|
142
|
+
if (x === endX && y === endY)
|
|
143
|
+
break;
|
|
144
|
+
}
|
|
145
|
+
ctx.fillRect(Math.min(runX, endX), runY, Math.abs(endX - runX) + 1, 1);
|
|
146
|
+
}
|
|
147
|
+
/** A hairline polyline, plotted with an optional second pass one pixel over. */
|
|
148
|
+
function plotPolyline(ctx, view, line, across) {
|
|
149
|
+
for (let i = 1; i < line.length; i++) {
|
|
150
|
+
const ax = view.ox + line[i - 1][0] * view.z;
|
|
151
|
+
const ay = view.oy + line[i - 1][1] * view.z;
|
|
152
|
+
const bx = view.ox + line[i][0] * view.z;
|
|
153
|
+
const by = view.oy + line[i][1] * view.z;
|
|
154
|
+
plotHairline(ctx, ax, ay, bx, by, null);
|
|
155
|
+
if (across)
|
|
156
|
+
plotHairline(ctx, ax, ay, bx, by, across);
|
|
157
|
+
}
|
|
158
|
+
}
|
|
159
|
+
export function createTrailSketch(model, next) {
|
|
160
|
+
const P = model.palette;
|
|
161
|
+
const { profile } = model;
|
|
162
|
+
const { mapArea, world } = profile;
|
|
163
|
+
// Pure geometry, computed once.
|
|
164
|
+
let dots = [];
|
|
165
|
+
function setup(p) {
|
|
166
|
+
dots = stippleDots(model, next);
|
|
167
|
+
void p;
|
|
168
|
+
}
|
|
169
|
+
/** World point to screen integer, under the current view. */
|
|
170
|
+
const toScreen = (view, x, y) => [
|
|
171
|
+
Math.round(view.ox + x * view.z),
|
|
172
|
+
Math.round(view.oy + y * view.z),
|
|
173
|
+
];
|
|
174
|
+
// --- world layers ---------------------------------------------------------
|
|
175
|
+
/**
|
|
176
|
+
* The elevation grid: a hairline at each index level across the sheet.
|
|
177
|
+
* Like the graticule, the lines are world-weight, so the resting wide sheet
|
|
178
|
+
* reads ruled but faint. Its labels are screen-space (`drawSheetLabels`).
|
|
179
|
+
*/
|
|
180
|
+
function drawGrid(ctx) {
|
|
181
|
+
if (!profile.summit)
|
|
182
|
+
return;
|
|
183
|
+
const indexLevels = profile.levels.filter((l) => l.kind === 'index');
|
|
184
|
+
ctx.lineJoin = 'round';
|
|
185
|
+
setStroke(ctx, P.grid);
|
|
186
|
+
ctx.lineWidth = 1;
|
|
187
|
+
ctx.beginPath();
|
|
188
|
+
for (const level of indexLevels) {
|
|
189
|
+
ctx.moveTo(mapArea.x0, level.y);
|
|
190
|
+
ctx.lineTo(mapArea.x1, level.y);
|
|
191
|
+
}
|
|
192
|
+
ctx.stroke();
|
|
193
|
+
}
|
|
194
|
+
/** The graticule: a month line from the ground to the top neatline. */
|
|
195
|
+
function drawGraticule(ctx) {
|
|
196
|
+
ctx.lineJoin = 'round';
|
|
197
|
+
setStroke(ctx, P.graticule);
|
|
198
|
+
ctx.lineWidth = 1;
|
|
199
|
+
ctx.beginPath();
|
|
200
|
+
for (const mark of model.months) {
|
|
201
|
+
const x = mapArea.x0 + mark.week * CELL;
|
|
202
|
+
ctx.moveTo(x, GROUND_Y);
|
|
203
|
+
ctx.lineTo(x, mapArea.y0);
|
|
204
|
+
}
|
|
205
|
+
ctx.stroke();
|
|
206
|
+
}
|
|
207
|
+
/**
|
|
208
|
+
* The plotted sheet: strata, stipple, the ground line and the profile,
|
|
209
|
+
* rasterized in screen space and clipped to the map area, because printed
|
|
210
|
+
* sheets stop at the neatline. The dots and hairlines land on whole pixels
|
|
211
|
+
* at exact colors, so a still camera reproduces the sheet pixel for pixel
|
|
212
|
+
* and a moving one changes only the pixels a line actually crossed.
|
|
213
|
+
*/
|
|
214
|
+
function drawRaster(ctx, cam, view) {
|
|
215
|
+
ctx.save();
|
|
216
|
+
ctx.setTransform(1, 0, 0, 1, 0, 0);
|
|
217
|
+
const [mx0, my0] = toScreen(view, mapArea.x0, mapArea.y0);
|
|
218
|
+
const [mx1, my1] = toScreen(view, mapArea.x1, mapArea.y1);
|
|
219
|
+
ctx.beginPath();
|
|
220
|
+
ctx.rect(mx0, my0, mx1 - mx0, my1 - my0);
|
|
221
|
+
ctx.clip();
|
|
222
|
+
const hw = (W - viewport.left) / 2 / cam.z + 8;
|
|
223
|
+
const hh = H / 2 / cam.z + 8;
|
|
224
|
+
const bounds = { x0: cam.x - hw, x1: cam.x + hw, y0: cam.y - hh, y1: cam.y + hh };
|
|
225
|
+
// Strata: the x spans where the trail is above each level, index levels
|
|
226
|
+
// plotted twice for their weight.
|
|
227
|
+
setFill(ctx, P.strata);
|
|
228
|
+
for (const level of profile.levels) {
|
|
229
|
+
if (level.y < bounds.y0 || level.y > bounds.y1)
|
|
230
|
+
continue;
|
|
231
|
+
const across = level.kind === 'index' ? [0, 1] : null;
|
|
232
|
+
for (const [x0, x1] of level.spans) {
|
|
233
|
+
if (x1 < bounds.x0 || x0 > bounds.x1)
|
|
234
|
+
continue;
|
|
235
|
+
const ly = view.oy + level.y * view.z;
|
|
236
|
+
const ax = view.ox + x0 * view.z;
|
|
237
|
+
const bx = view.ox + x1 * view.z;
|
|
238
|
+
plotHairline(ctx, ax, ly, bx, ly, null);
|
|
239
|
+
if (across)
|
|
240
|
+
plotHairline(ctx, ax, ly, bx, ly, across);
|
|
241
|
+
}
|
|
242
|
+
}
|
|
243
|
+
// Stipple relief. Close in, the world pitch would thin to specks, so the
|
|
244
|
+
// dots double with the summit zoom.
|
|
245
|
+
const dot = cam.z > 1.15 ? 2 : 1;
|
|
246
|
+
setFill(ctx, P.stipple);
|
|
247
|
+
for (let d = 0; d < dots.length; d += 2) {
|
|
248
|
+
const x = dots[d];
|
|
249
|
+
const y = dots[d + 1];
|
|
250
|
+
if (x < mapArea.x0 || x > mapArea.x1 || y < mapArea.y0 || y > mapArea.y1)
|
|
251
|
+
continue;
|
|
252
|
+
if (x < bounds.x0 || x > bounds.x1 || y < bounds.y0 || y > bounds.y1)
|
|
253
|
+
continue;
|
|
254
|
+
const [sx, sy] = toScreen(view, x, y);
|
|
255
|
+
ctx.fillRect(sx, sy, dot, dot);
|
|
256
|
+
}
|
|
257
|
+
// The ground line and the profile, plotted like the rest of the line work.
|
|
258
|
+
setFill(ctx, P.ink);
|
|
259
|
+
const gy = view.oy + GROUND_Y * view.z;
|
|
260
|
+
plotHairline(ctx, view.ox + mapArea.x0 * view.z, gy, view.ox + mapArea.x1 * view.z, gy, null);
|
|
261
|
+
if (profile.summit) {
|
|
262
|
+
setFill(ctx, P.accent);
|
|
263
|
+
plotPolyline(ctx, view, profile.line, [0, 1]);
|
|
264
|
+
}
|
|
265
|
+
ctx.restore();
|
|
266
|
+
}
|
|
267
|
+
/** The summit: survey triangle on the profile, flag on a pole, its figure. */
|
|
268
|
+
function drawSummit(ctx, cam, t, labelAlpha) {
|
|
269
|
+
const summit = profile.summit;
|
|
270
|
+
if (!summit)
|
|
271
|
+
return;
|
|
272
|
+
const poleTop = summit.y - 88;
|
|
273
|
+
// Survey triangle at the highest point.
|
|
274
|
+
setFill(ctx, P.ink);
|
|
275
|
+
ctx.beginPath();
|
|
276
|
+
ctx.moveTo(summit.x, summit.y - 7);
|
|
277
|
+
ctx.lineTo(summit.x + 8, summit.y + 6);
|
|
278
|
+
ctx.lineTo(summit.x - 8, summit.y + 6);
|
|
279
|
+
ctx.closePath();
|
|
280
|
+
ctx.fill();
|
|
281
|
+
setStroke(ctx, P.ink);
|
|
282
|
+
ctx.lineWidth = 2 / cam.z;
|
|
283
|
+
ctx.beginPath();
|
|
284
|
+
ctx.moveTo(summit.x, summit.y);
|
|
285
|
+
ctx.lineTo(summit.x, poleTop);
|
|
286
|
+
ctx.stroke();
|
|
287
|
+
// The flag waves only while the camera holds the summit, about one cycle
|
|
288
|
+
// per 40 frames (at least two), amplitude eased to 0 at both ends of the
|
|
289
|
+
// hold, so the wide shots at the seam match (the flag is always planted).
|
|
290
|
+
const { start, end } = model.plan.summitHold;
|
|
291
|
+
const u = end > start ? clamp01((t * FRAMES - start) / (end - start)) : 0;
|
|
292
|
+
const envelope = Math.sin(Math.PI * u);
|
|
293
|
+
const cycles = Math.max(2, Math.round((end - start) / 40));
|
|
294
|
+
const phase = cycles * TAU * u;
|
|
295
|
+
const tipX = 34 + 4 * Math.sin(phase) * envelope;
|
|
296
|
+
const sag = 3 * Math.sin(phase + 1) * envelope;
|
|
297
|
+
setFill(ctx, P.flag);
|
|
298
|
+
ctx.beginPath();
|
|
299
|
+
ctx.moveTo(summit.x, poleTop);
|
|
300
|
+
ctx.quadraticCurveTo(summit.x + tipX * 0.6, poleTop + 8 + sag, summit.x + tipX, poleTop + 8);
|
|
301
|
+
ctx.lineTo(summit.x, poleTop + 16);
|
|
302
|
+
ctx.closePath();
|
|
303
|
+
ctx.fill();
|
|
304
|
+
if (labelAlpha <= 0.02)
|
|
305
|
+
return;
|
|
306
|
+
// Beside the pole's lower half: at the hold zoom the figure's ascender
|
|
307
|
+
// would cross the frame's top edge if it sat at the flag.
|
|
308
|
+
drawText(ctx, String(summit.total), summit.x + 46, summit.y - 40, {
|
|
309
|
+
size: 30,
|
|
310
|
+
bold: true,
|
|
311
|
+
color: P.ink,
|
|
312
|
+
alpha: labelAlpha,
|
|
313
|
+
});
|
|
314
|
+
drawText(ctx, summitDates(summit.from, summit.to), summit.x + 46, summit.y - 18, {
|
|
315
|
+
size: 13,
|
|
316
|
+
mono: true,
|
|
317
|
+
color: P.muted,
|
|
318
|
+
alpha: labelAlpha,
|
|
319
|
+
});
|
|
320
|
+
}
|
|
321
|
+
/** Double frame around the map: thin inner, heavy outer. */
|
|
322
|
+
function drawNeatline(ctx, cam) {
|
|
323
|
+
ctx.lineJoin = 'miter';
|
|
324
|
+
const off = 7;
|
|
325
|
+
setStroke(ctx, P.ink);
|
|
326
|
+
ctx.lineWidth = LINE.neatHeavy / cam.z;
|
|
327
|
+
ctx.strokeRect(mapArea.x0 - off, mapArea.y0 - off, mapArea.x1 - mapArea.x0 + 2 * off, mapArea.y1 - mapArea.y0 + 2 * off);
|
|
328
|
+
ctx.lineWidth = LINE.neatThin / cam.z;
|
|
329
|
+
ctx.strokeRect(mapArea.x0, mapArea.y0, mapArea.x1 - mapArea.x0, mapArea.y1 - mapArea.y0);
|
|
330
|
+
}
|
|
331
|
+
// --- screen layers --------------------------------------------------------
|
|
332
|
+
/**
|
|
333
|
+
* The sheet's small type, at a fixed screen size so it reads at the walk
|
|
334
|
+
* zoom without swelling at the summit: elevation labels on the west
|
|
335
|
+
* neatline (or the viewport's edge), month labels under the ground line, and the spot heights (`×`
|
|
336
|
+
* and figure). Anchored to world points through the snapped view, so it
|
|
337
|
+
* moves with the sheet pixel for pixel.
|
|
338
|
+
*/
|
|
339
|
+
function drawSheetLabels(ctx, view, alpha) {
|
|
340
|
+
if (alpha <= 0.02 || !profile.summit)
|
|
341
|
+
return;
|
|
342
|
+
const label = { size: LABEL_SIZE, mono: true, color: P.muted, alpha };
|
|
343
|
+
// Elevation labels ride the west neatline, or the viewport's left edge
|
|
344
|
+
// once the walk has panned the neatline out of view.
|
|
345
|
+
const wx = Math.max(toScreen(view, mapArea.x0, 0)[0], viewport.left + 4);
|
|
346
|
+
for (const level of profile.levels) {
|
|
347
|
+
if (level.kind !== 'index')
|
|
348
|
+
continue;
|
|
349
|
+
const [, y] = toScreen(view, 0, level.y);
|
|
350
|
+
drawText(ctx, String(level.height), wx + 4, y + 4, label);
|
|
351
|
+
}
|
|
352
|
+
const [, gy] = toScreen(view, 0, GROUND_Y);
|
|
353
|
+
drawText(ctx, '0', wx + 4, gy - 3, label);
|
|
354
|
+
for (const mark of model.months) {
|
|
355
|
+
const [x] = toScreen(view, mapArea.x0 + mark.week * CELL, 0);
|
|
356
|
+
drawText(ctx, mark.label, x + 3, gy + 13, label);
|
|
357
|
+
}
|
|
358
|
+
const r = 3.5;
|
|
359
|
+
ctx.lineJoin = 'round';
|
|
360
|
+
ctx.lineWidth = 1.2;
|
|
361
|
+
setStroke(ctx, P.ink, alpha);
|
|
362
|
+
ctx.beginPath();
|
|
363
|
+
for (const spot of profile.spots) {
|
|
364
|
+
const [x, y] = toScreen(view, spot.x, spot.y);
|
|
365
|
+
ctx.moveTo(x - r, y - r - 6);
|
|
366
|
+
ctx.lineTo(x + r, y + r - 6);
|
|
367
|
+
ctx.moveTo(x + r, y - r - 6);
|
|
368
|
+
ctx.lineTo(x - r, y + r - 6);
|
|
369
|
+
}
|
|
370
|
+
ctx.stroke();
|
|
371
|
+
for (const spot of profile.spots) {
|
|
372
|
+
const [x, y] = toScreen(view, spot.x, spot.y);
|
|
373
|
+
drawText(ctx, String(spot.total), x + 7, y - 3, { ...label, color: P.ink });
|
|
374
|
+
}
|
|
375
|
+
}
|
|
376
|
+
/**
|
|
377
|
+
* The hiker: an ink bead with a paper ring, centred on the profile line.
|
|
378
|
+
* Drawn in screen space at a fixed size, so the walker does not balloon
|
|
379
|
+
* with the zoom; it fades in on the descend and out on the summit arrival.
|
|
380
|
+
*/
|
|
381
|
+
function drawMarker(ctx, view, marker) {
|
|
382
|
+
if (!marker || marker.alpha <= 0.02)
|
|
383
|
+
return;
|
|
384
|
+
const [sx, sy] = toScreen(view, marker.x, marker.y);
|
|
385
|
+
ctx.globalAlpha = marker.alpha;
|
|
386
|
+
setFill(ctx, P.paper);
|
|
387
|
+
ctx.beginPath();
|
|
388
|
+
ctx.arc(sx, sy, 7, 0, TAU);
|
|
389
|
+
ctx.fill();
|
|
390
|
+
setFill(ctx, P.ink);
|
|
391
|
+
ctx.beginPath();
|
|
392
|
+
ctx.arc(sx, sy, 5, 0, TAU);
|
|
393
|
+
ctx.fill();
|
|
394
|
+
ctx.globalAlpha = 1;
|
|
395
|
+
}
|
|
396
|
+
// --- collar ---------------------------------------------------------------
|
|
397
|
+
function drawScaleBar(ctx) {
|
|
398
|
+
const { px, segments } = model.collar.scale;
|
|
399
|
+
const x = COLLAR.left;
|
|
400
|
+
const y = 296;
|
|
401
|
+
const h = 5;
|
|
402
|
+
setFill(ctx, P.ink);
|
|
403
|
+
ctx.fillRect(x, y, px, h);
|
|
404
|
+
ctx.fillRect(x + 2 * px, y, px, h);
|
|
405
|
+
setStroke(ctx, P.ink);
|
|
406
|
+
ctx.lineWidth = 1;
|
|
407
|
+
ctx.strokeRect(x + 0.5, y + 0.5, segments * px - 1, h - 1);
|
|
408
|
+
for (let k = 0; k <= segments; k++) {
|
|
409
|
+
drawText(ctx, String(k * 4), x + k * px, y - 5, {
|
|
410
|
+
size: 9,
|
|
411
|
+
mono: true,
|
|
412
|
+
align: 'center',
|
|
413
|
+
color: P.muted,
|
|
414
|
+
});
|
|
415
|
+
}
|
|
416
|
+
drawText(ctx, 'WEEKS', x + segments * px + 8, y + 5, { size: 9, mono: true, color: P.muted });
|
|
417
|
+
}
|
|
418
|
+
function drawCollar(ctx, altimeter) {
|
|
419
|
+
const c = model.collar;
|
|
420
|
+
setFill(ctx, P.paper);
|
|
421
|
+
ctx.fillRect(0, 0, viewport.left, H);
|
|
422
|
+
// The double rule on the collar's right edge.
|
|
423
|
+
setFill(ctx, P.ink, 0.45);
|
|
424
|
+
ctx.fillRect(391, 0, 1, H);
|
|
425
|
+
setFill(ctx, P.ink);
|
|
426
|
+
ctx.fillRect(398, 0, 2, H);
|
|
427
|
+
const x = COLLAR.left;
|
|
428
|
+
drawText(ctx, 'TRAIL PROFILE · LAST 12 MONTHS', x, 58, {
|
|
429
|
+
size: 11,
|
|
430
|
+
mono: true,
|
|
431
|
+
tracking: 2,
|
|
432
|
+
color: P.muted,
|
|
433
|
+
});
|
|
434
|
+
drawText(ctx, c.name.text, x, 122, {
|
|
435
|
+
size: c.name.size,
|
|
436
|
+
bold: true,
|
|
437
|
+
tracking: 3,
|
|
438
|
+
color: P.ink,
|
|
439
|
+
});
|
|
440
|
+
if (c.tagline) {
|
|
441
|
+
drawText(ctx, c.tagline.text, x, 152, { size: c.tagline.size, color: P.accent });
|
|
442
|
+
}
|
|
443
|
+
drawText(ctx, c.total, x, 216, { size: 34, bold: true, color: P.ink });
|
|
444
|
+
drawText(ctx, 'contributions', x, 238, { size: 11, mono: true, color: P.muted });
|
|
445
|
+
if (altimeter) {
|
|
446
|
+
drawText(ctx, altimeter, x, 266, { size: 11, mono: true, color: P.ink });
|
|
447
|
+
}
|
|
448
|
+
drawScaleBar(ctx);
|
|
449
|
+
if (c.intervalText) {
|
|
450
|
+
drawText(ctx, c.intervalText, x, 328, { size: 10, mono: true, color: P.muted });
|
|
451
|
+
}
|
|
452
|
+
if (c.website) {
|
|
453
|
+
drawText(ctx, c.website.text, x, 352, { size: c.website.size, mono: true, color: P.accent });
|
|
454
|
+
}
|
|
455
|
+
}
|
|
456
|
+
// --- frame ----------------------------------------------------------------
|
|
457
|
+
function draw(p, _frame, t) {
|
|
458
|
+
const ctx = p.drawingContext;
|
|
459
|
+
const frameFloat = t * FRAMES;
|
|
460
|
+
const cam = cameraAt(model.plan.keys, frameFloat, FRAMES, CAMERA);
|
|
461
|
+
const view = viewOf(cam);
|
|
462
|
+
const sheetAlpha = smoothstep(LABEL_Z.sheet[0], LABEL_Z.sheet[1], cam.z);
|
|
463
|
+
const summitAlpha = smoothstep(LABEL_Z.summit[0], LABEL_Z.summit[1], cam.z);
|
|
464
|
+
setFill(ctx, P.paper);
|
|
465
|
+
ctx.fillRect(0, 0, W, H);
|
|
466
|
+
ctx.save();
|
|
467
|
+
ctx.beginPath();
|
|
468
|
+
ctx.rect(viewport.left, 0, W - viewport.left, H);
|
|
469
|
+
ctx.clip();
|
|
470
|
+
applyCamera(ctx, cam, viewport.cx, viewport.cy);
|
|
471
|
+
setFill(ctx, P.paper);
|
|
472
|
+
ctx.fillRect(0, 0, world.w, world.h);
|
|
473
|
+
drawGrid(ctx);
|
|
474
|
+
drawGraticule(ctx);
|
|
475
|
+
drawRaster(ctx, cam, view);
|
|
476
|
+
drawSummit(ctx, cam, t, summitAlpha);
|
|
477
|
+
drawNeatline(ctx, cam);
|
|
478
|
+
ctx.setTransform(1, 0, 0, 1, 0, 0);
|
|
479
|
+
drawSheetLabels(ctx, view, sheetAlpha);
|
|
480
|
+
drawMarker(ctx, view, markerAt(profile, model.plan, frameFloat));
|
|
481
|
+
ctx.restore();
|
|
482
|
+
drawCollar(ctx, altimeterLine(profile, model.plan, frameFloat));
|
|
483
|
+
}
|
|
484
|
+
return { setup, draw };
|
|
485
|
+
}
|
|
@@ -0,0 +1,278 @@
|
|
|
1
|
+
import { canvasMeasure, fitLine } from '../../core/text.js';
|
|
2
|
+
import { buildProfile, CELL } from './profile.js';
|
|
3
|
+
/**
|
|
4
|
+
* The survey sheet as filmed: where the collar's type sits, and one walk from
|
|
5
|
+
* the year's first week to the summit and back (Highlights Reel's camera, in
|
|
6
|
+
* `core/camera.ts`). Everything here is a pure function of the data; the
|
|
7
|
+
* sketch only draws.
|
|
8
|
+
*/
|
|
9
|
+
export const FRAMES = 480;
|
|
10
|
+
const W = 1280;
|
|
11
|
+
const H = 400;
|
|
12
|
+
/** The map's viewport: right of the collar. */
|
|
13
|
+
const VIEWPORT_LEFT = 400;
|
|
14
|
+
export const LAYOUT = {
|
|
15
|
+
width: W,
|
|
16
|
+
height: H,
|
|
17
|
+
viewport: { left: VIEWPORT_LEFT, cx: (VIEWPORT_LEFT + W) / 2, cy: H / 2 },
|
|
18
|
+
/** Margin around the sheet at the wide shot, screen px. */
|
|
19
|
+
wideMargin: 24,
|
|
20
|
+
/** The summit holds close. */
|
|
21
|
+
summitZ: 1.6,
|
|
22
|
+
/** Camera dip tuning: moves longer than `travel` dip, scaled to `span`. */
|
|
23
|
+
travel: 700,
|
|
24
|
+
span: 1600,
|
|
25
|
+
/** Collar text column. */
|
|
26
|
+
collar: { left: 48, right: 368 },
|
|
27
|
+
/**
|
|
28
|
+
* The walk. The camera frames the whole elevation band, from above the
|
|
29
|
+
* flag to the month labels, so it never chases the walker up and down: `y`
|
|
30
|
+
* and `z` are fixed and only `x` pans. The walker keeps one speed along the
|
|
31
|
+
* trail (screen px per frame, at `z`), eased in and out over `ramp` frames.
|
|
32
|
+
* A walk shorter than `max` frames gives its spare frames to the holds; a
|
|
33
|
+
* longer trail starts the walk that far before the summit.
|
|
34
|
+
*/
|
|
35
|
+
walk: { z: 0.43, y: 660, speed: 7, ramp: 20, min: 60, max: 215 },
|
|
36
|
+
/** The walk's horizontal view keeps this margin past the map, world units. */
|
|
37
|
+
panMargin: 40,
|
|
38
|
+
/**
|
|
39
|
+
* Segment lengths, in frames, with the walk at `walk.max`; they add up to
|
|
40
|
+
* `FRAMES`. A shorter walk splits its spare frames between the two holds.
|
|
41
|
+
*/
|
|
42
|
+
segments: { wideHold: 55, descend: 40, arrive: 40, summitHold: 80, pullBack: 50 },
|
|
43
|
+
};
|
|
44
|
+
const MONTHS = ['JAN', 'FEB', 'MAR', 'APR', 'MAY', 'JUN', 'JUL', 'AUG', 'SEP', 'OCT', 'NOV', 'DEC'];
|
|
45
|
+
/** "2026-03-12" .. "2026-03-18" -> "MAR 12 TO 18" (crossing months spells both). */
|
|
46
|
+
export function summitDates(from, to) {
|
|
47
|
+
const [, fm, fd] = from.split('-').map(Number);
|
|
48
|
+
const [, tm, td] = to.split('-').map(Number);
|
|
49
|
+
return fm === tm
|
|
50
|
+
? `${MONTHS[fm - 1]} ${fd} TO ${td}`
|
|
51
|
+
: `${MONTHS[fm - 1]} ${fd} TO ${MONTHS[tm - 1]} ${td}`;
|
|
52
|
+
}
|
|
53
|
+
/** The wide shot: the whole sheet in the viewport with `wideMargin` to spare. */
|
|
54
|
+
export function wideShot(profile) {
|
|
55
|
+
const z = Math.min((W - VIEWPORT_LEFT - LAYOUT.wideMargin) / profile.world.w, (H - LAYOUT.wideMargin) / profile.world.h);
|
|
56
|
+
return { x: profile.world.w / 2, y: profile.world.h / 2, z };
|
|
57
|
+
}
|
|
58
|
+
/** Weeks the months start in, for the graticule and the labels under the ground. */
|
|
59
|
+
export function monthMarks(contributions) {
|
|
60
|
+
const marks = [];
|
|
61
|
+
contributions.weeks.forEach((week, i) => {
|
|
62
|
+
for (const day of week) {
|
|
63
|
+
if (day.date < contributions.from || day.date > contributions.to)
|
|
64
|
+
continue;
|
|
65
|
+
const [, m, d] = day.date.split('-').map(Number);
|
|
66
|
+
if (d === 1) {
|
|
67
|
+
marks.push({ week: i, label: MONTHS[m - 1] });
|
|
68
|
+
break;
|
|
69
|
+
}
|
|
70
|
+
}
|
|
71
|
+
});
|
|
72
|
+
return marks;
|
|
73
|
+
}
|
|
74
|
+
const clamp01 = (v) => Math.min(1, Math.max(0, v));
|
|
75
|
+
/**
|
|
76
|
+
* The walker at a loop frame: standing at the walk's start while it fades in,
|
|
77
|
+
* walking the baked path to the summit, then fading out as the camera pushes
|
|
78
|
+
* in, so the survey triangle takes over and the wide holds match.
|
|
79
|
+
*/
|
|
80
|
+
export function markerAt(profile, plan, frame) {
|
|
81
|
+
const { path, walk, fadeIn, fadeOut } = plan;
|
|
82
|
+
if (!profile.summit || path.length === 0)
|
|
83
|
+
return null;
|
|
84
|
+
const f = Math.floor(frame);
|
|
85
|
+
let x;
|
|
86
|
+
let alpha = 1;
|
|
87
|
+
let walking = false;
|
|
88
|
+
if (f < walk.start) {
|
|
89
|
+
x = path[0];
|
|
90
|
+
alpha = clamp01((frame - fadeIn.start) / (fadeIn.end - fadeIn.start));
|
|
91
|
+
}
|
|
92
|
+
else if (f < walk.end) {
|
|
93
|
+
x = path[f - walk.start];
|
|
94
|
+
walking = true;
|
|
95
|
+
}
|
|
96
|
+
else {
|
|
97
|
+
x = path.at(-1);
|
|
98
|
+
alpha = 1 - clamp01((frame - fadeOut.start) / (fadeOut.end - fadeOut.start));
|
|
99
|
+
}
|
|
100
|
+
return { x, y: profile.profileY(x), alpha, walking };
|
|
101
|
+
}
|
|
102
|
+
/**
|
|
103
|
+
* Distance along the trail at walk frame `f` of `n`, for a trail `length`
|
|
104
|
+
* long: a sine ramp up over `ramp` frames, a steady cruise, and the mirror
|
|
105
|
+
* ramp down, so velocity is continuous and the cruise is one speed.
|
|
106
|
+
*/
|
|
107
|
+
export function walkDistance(f, n, ramp, length) {
|
|
108
|
+
const v = length / (n - ramp);
|
|
109
|
+
const up = (g) => v * (g / 2 - (ramp / (2 * Math.PI)) * Math.sin((Math.PI * g) / ramp));
|
|
110
|
+
if (f <= 0)
|
|
111
|
+
return 0;
|
|
112
|
+
if (f >= n)
|
|
113
|
+
return length;
|
|
114
|
+
if (f < ramp)
|
|
115
|
+
return up(f);
|
|
116
|
+
if (f <= n - ramp)
|
|
117
|
+
return v * (ramp / 2 + (f - ramp));
|
|
118
|
+
return length - up(n - f);
|
|
119
|
+
}
|
|
120
|
+
/**
|
|
121
|
+
* The walker's path: its x at each walk frame, at one speed along the trail
|
|
122
|
+
* (arc length, so it slows on the climbs instead of shooting up them). The
|
|
123
|
+
* walk takes as many frames as the trail needs at `walk.speed`, within
|
|
124
|
+
* `walk.min` and `walk.max`; a trail too long for `walk.max` starts that far
|
|
125
|
+
* before the summit.
|
|
126
|
+
*/
|
|
127
|
+
function walkPath(profile) {
|
|
128
|
+
const { speed, ramp, min, max, z } = LAYOUT.walk;
|
|
129
|
+
const to = profile.summit.x;
|
|
130
|
+
// Cumulative arc length from the first week, sampled every world unit.
|
|
131
|
+
const xs = [];
|
|
132
|
+
const arc = [];
|
|
133
|
+
let s = 0;
|
|
134
|
+
let prevY = profile.profileY(profile.weekX(0));
|
|
135
|
+
for (let x = profile.weekX(0);; x = Math.min(x + 1, to)) {
|
|
136
|
+
const y = profile.profileY(x);
|
|
137
|
+
if (xs.length > 0)
|
|
138
|
+
s += Math.hypot(x - xs.at(-1), y - prevY);
|
|
139
|
+
xs.push(x);
|
|
140
|
+
arc.push(s);
|
|
141
|
+
prevY = y;
|
|
142
|
+
if (x >= to)
|
|
143
|
+
break;
|
|
144
|
+
}
|
|
145
|
+
const maxLength = ((max - ramp) * speed) / z;
|
|
146
|
+
const length = Math.min(s, maxLength);
|
|
147
|
+
const n = Math.min(max, Math.max(min, Math.round((length * z) / speed + ramp)));
|
|
148
|
+
const offset = s - length;
|
|
149
|
+
const path = [];
|
|
150
|
+
let i = 0;
|
|
151
|
+
for (let f = 0; f <= n; f++) {
|
|
152
|
+
const target = offset + walkDistance(f, n, ramp, length);
|
|
153
|
+
while (i < arc.length - 2 && arc[i + 1] < target)
|
|
154
|
+
i++;
|
|
155
|
+
const a = arc[i];
|
|
156
|
+
const b = arc[i + 1] ?? a;
|
|
157
|
+
const u = b > a ? clamp01((target - a) / (b - a)) : 0;
|
|
158
|
+
path.push(xs[i] + ((xs[i + 1] ?? xs[i]) - xs[i]) * u);
|
|
159
|
+
}
|
|
160
|
+
path[n] = to;
|
|
161
|
+
return path;
|
|
162
|
+
}
|
|
163
|
+
/**
|
|
164
|
+
* The walk's camera: fixed `y` and `z`, and an `x` that pans in step with
|
|
165
|
+
* the walker across the whole sheet, so the view's left edge sits at the
|
|
166
|
+
* map's west margin at the first week and its right edge at the east margin
|
|
167
|
+
* at the last. The pan is a straight line of the walker's x: no kinks.
|
|
168
|
+
*/
|
|
169
|
+
function walkCam(profile, x) {
|
|
170
|
+
const { z, y } = LAYOUT.walk;
|
|
171
|
+
const half = (W - VIEWPORT_LEFT) / 2 / z;
|
|
172
|
+
const lo = profile.mapArea.x0 - LAYOUT.panMargin + half;
|
|
173
|
+
const hi = profile.mapArea.x1 + LAYOUT.panMargin - half;
|
|
174
|
+
const first = profile.weekX(0);
|
|
175
|
+
const last = profile.weekX(profile.cols - 1);
|
|
176
|
+
const u = last > first ? clamp01((x - first) / (last - first)) : 0.5;
|
|
177
|
+
return { x: hi > lo ? lo + (hi - lo) * u : profile.world.w / 2, y, z };
|
|
178
|
+
}
|
|
179
|
+
const EMPTY = { start: 0, end: 0 };
|
|
180
|
+
/**
|
|
181
|
+
* The camera plan. The walk is baked as one key per frame, so GIF frames
|
|
182
|
+
* sample it exactly and nothing re-eases.
|
|
183
|
+
*/
|
|
184
|
+
function buildPlan(profile) {
|
|
185
|
+
const wide = wideShot(profile);
|
|
186
|
+
if (!profile.summit) {
|
|
187
|
+
// The empty state: the camera holds the wide shot for the whole loop.
|
|
188
|
+
return {
|
|
189
|
+
keys: [
|
|
190
|
+
{ frame: 0, ...wide },
|
|
191
|
+
{ frame: FRAMES, ...wide },
|
|
192
|
+
],
|
|
193
|
+
summitHold: EMPTY,
|
|
194
|
+
walk: EMPTY,
|
|
195
|
+
fadeIn: EMPTY,
|
|
196
|
+
fadeOut: EMPTY,
|
|
197
|
+
path: [],
|
|
198
|
+
};
|
|
199
|
+
}
|
|
200
|
+
const seg = LAYOUT.segments;
|
|
201
|
+
const path = walkPath(profile);
|
|
202
|
+
const walkFrames = path.length - 1;
|
|
203
|
+
const spare = LAYOUT.walk.max - walkFrames;
|
|
204
|
+
const wideHold = seg.wideHold + Math.floor(spare / 2);
|
|
205
|
+
const summitHold = seg.summitHold + Math.ceil(spare / 2);
|
|
206
|
+
const walkStart = wideHold + seg.descend;
|
|
207
|
+
const walkEnd = walkStart + walkFrames;
|
|
208
|
+
const holdStart = walkEnd + seg.arrive;
|
|
209
|
+
const holdEnd = holdStart + summitHold;
|
|
210
|
+
const keys = [
|
|
211
|
+
{ frame: 0, ...wide },
|
|
212
|
+
{ frame: wideHold, ...wide },
|
|
213
|
+
];
|
|
214
|
+
path.forEach((x, f) => keys.push({ frame: walkStart + f, ...walkCam(profile, x) }));
|
|
215
|
+
const summit = { x: profile.summit.x, y: profile.summit.y + 30, z: LAYOUT.summitZ };
|
|
216
|
+
keys.push({ frame: holdStart, ...summit });
|
|
217
|
+
keys.push({ frame: holdEnd, ...summit });
|
|
218
|
+
keys.push({ frame: FRAMES, ...wide });
|
|
219
|
+
return {
|
|
220
|
+
keys,
|
|
221
|
+
summitHold: { start: holdStart, end: holdEnd },
|
|
222
|
+
walk: { start: walkStart, end: walkEnd },
|
|
223
|
+
fadeIn: { start: wideHold, end: walkStart },
|
|
224
|
+
fadeOut: { start: walkEnd, end: holdStart },
|
|
225
|
+
path,
|
|
226
|
+
};
|
|
227
|
+
}
|
|
228
|
+
/**
|
|
229
|
+
* The collar's altimeter line: the summit at rest, and the week under the
|
|
230
|
+
* walker (its total and dates) while it walks, switching back at arrival.
|
|
231
|
+
*/
|
|
232
|
+
export function altimeterLine(profile, plan, frame) {
|
|
233
|
+
const summit = profile.summit;
|
|
234
|
+
if (!summit)
|
|
235
|
+
return null;
|
|
236
|
+
const marker = markerAt(profile, plan, frame);
|
|
237
|
+
if (marker?.walking) {
|
|
238
|
+
const week = profile.weeks[profile.weekAt(marker.x)];
|
|
239
|
+
return `ALT ${week.total} · ${summitDates(week.from, week.to)}`;
|
|
240
|
+
}
|
|
241
|
+
return `SUMMIT ${summit.total} · ${summitDates(summit.from, summit.to)}`;
|
|
242
|
+
}
|
|
243
|
+
function buildCollar(profile, identity, zWide, total) {
|
|
244
|
+
const column = LAYOUT.collar.right - LAYOUT.collar.left;
|
|
245
|
+
return {
|
|
246
|
+
name: fitLine(identity.name.toUpperCase(), column, 44, 30, canvasMeasure('Space Grotesk', 700, 3)),
|
|
247
|
+
tagline: identity.tagline
|
|
248
|
+
? fitLine(identity.tagline, column, 17, 17, canvasMeasure('Space Grotesk', 400))
|
|
249
|
+
: null,
|
|
250
|
+
website: identity.website
|
|
251
|
+
? fitLine(`↗ ${displayUrl(identity.website)}`, column, 12, 12, canvasMeasure('JetBrains Mono', 400))
|
|
252
|
+
: null,
|
|
253
|
+
total: total.toLocaleString('en-US'),
|
|
254
|
+
...(profile.summit
|
|
255
|
+
? {
|
|
256
|
+
summitLine: `SUMMIT ${profile.summit.total} · ${summitDates(profile.summit.from, profile.summit.to)}`,
|
|
257
|
+
intervalText: `CONTOUR INTERVAL ${profile.interval} CONTRIBUTIONS`,
|
|
258
|
+
}
|
|
259
|
+
: { summitLine: null, intervalText: null }),
|
|
260
|
+
scale: { weeksPerSegment: 4, segments: 3, px: 4 * CELL * zWide },
|
|
261
|
+
};
|
|
262
|
+
}
|
|
263
|
+
/** "https://www.example.com/" -> "www.example.com" */
|
|
264
|
+
function displayUrl(url) {
|
|
265
|
+
return url.replace(/^[a-z]+:\/\//i, '').replace(/\/+$/, '');
|
|
266
|
+
}
|
|
267
|
+
export function buildTrail(data, identity, palette) {
|
|
268
|
+
const profile = buildProfile(data);
|
|
269
|
+
const zWide = wideShot(profile).z;
|
|
270
|
+
return {
|
|
271
|
+
profile,
|
|
272
|
+
collar: buildCollar(profile, identity, zWide, data.total),
|
|
273
|
+
months: monthMarks(data),
|
|
274
|
+
plan: buildPlan(profile),
|
|
275
|
+
palette,
|
|
276
|
+
zWide,
|
|
277
|
+
};
|
|
278
|
+
}
|