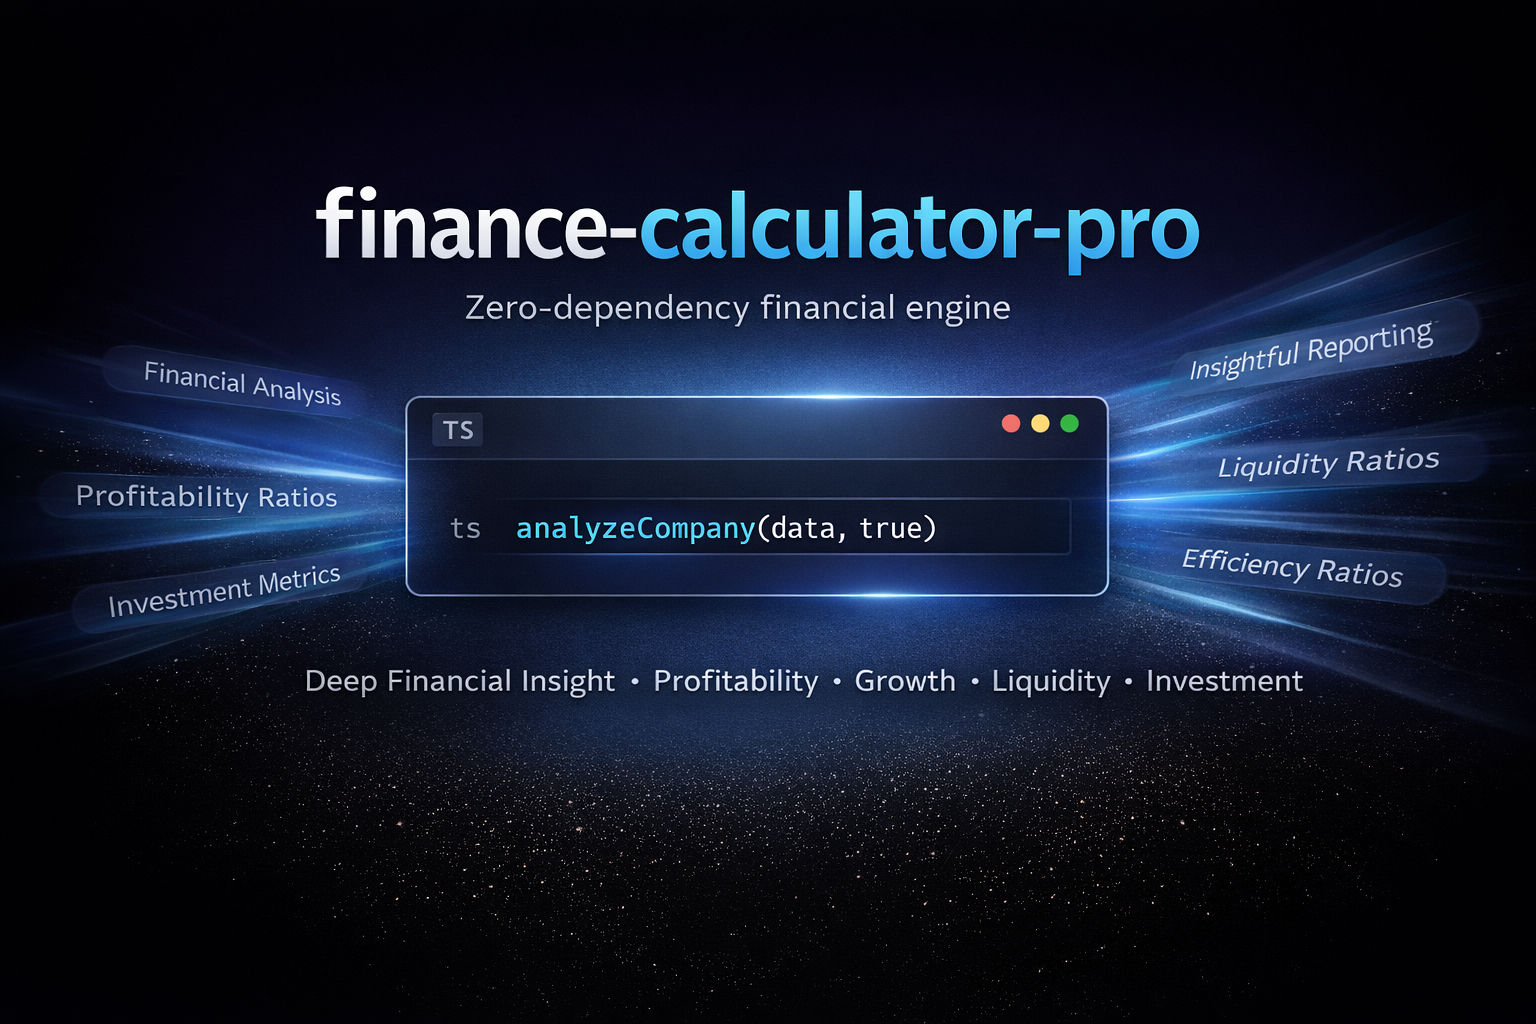
finance-calculator-pro 1.0.5 → 1.1.0
This diff represents the content of publicly available package versions that have been released to one of the supported registries. The information contained in this diff is provided for informational purposes only and reflects changes between package versions as they appear in their respective public registries.
- package/README.md +319 -260
- package/dist/index.d.mts +442 -8
- package/dist/index.d.ts +442 -8
- package/dist/index.js +418 -38
- package/dist/index.mjs +403 -38
- package/package.json +46 -8
package/README.md
CHANGED
|
@@ -1,348 +1,407 @@
|
|
|
1
1
|
# finance-calculator-pro
|
|
2
2
|
|
|
3
3
|
[](https://www.npmjs.com/package/finance-calculator-pro)
|
|
4
|
-
|
|
4
|
+
[](https://www.npmjs.com/package/finance-calculator-pro)
|
|
5
|
+
[](https://www.typescriptlang.org/)
|
|
6
|
+
[](https://www.npmjs.com/package/finance-calculator-pro?activeTab=dependencies)
|
|
7
|
+
[](https://opensource.org/licenses/MIT)
|
|
8
|
+
|
|
9
|
+
📖 **[View the Official Documentation & Live Playground →](https://boffincoders.github.io/finance-calculator/)**
|
|
5
10
|
|
|
6
11
|
|
|
7
12
|
|
|
8
|
-
|
|
13
|
+
> **Zero-dependency financial analysis engine for JavaScript and TypeScript.**
|
|
14
|
+
> Calculate 30+ fundamental analysis metrics — valuation ratios, profitability metrics, liquidity ratios, solvency indicators, efficiency metrics, earnings quality signals, and bankruptcy risk scores — from raw financial data. No API calls. No heavy dependencies. Works in Node.js, browsers, and edge runtimes.
|
|
15
|
+
|
|
16
|
+
---
|
|
17
|
+
|
|
18
|
+
## What is finance-calculator-pro?
|
|
9
19
|
|
|
10
|
-
|
|
20
|
+
`finance-calculator-pro` is a modular financial metrics library that transforms raw company fundamentals (income statement, balance sheet, cash flow data) into structured analysis — complete with computed values, signal ratings (`Good` / `Bad` / `Neutral`), and human-readable insights.
|
|
21
|
+
|
|
22
|
+
Built for:
|
|
23
|
+
- 📊 **Stock screener** and equity research tools
|
|
24
|
+
- 💼 **Portfolio analysis** dashboards
|
|
25
|
+
- 🏦 **FinTech applications** and investment platforms
|
|
26
|
+
- 🔍 **Fundamental analysis** pipelines (pairs naturally with [`yahoo-finance2`](https://www.npmjs.com/package/yahoo-finance2))
|
|
27
|
+
- 🎓 **Financial education** tools and calculators
|
|
28
|
+
|
|
29
|
+
---
|
|
11
30
|
|
|
12
31
|
## Installation
|
|
13
32
|
|
|
14
33
|
```bash
|
|
15
34
|
npm install finance-calculator-pro
|
|
35
|
+
# or
|
|
36
|
+
yarn add finance-calculator-pro
|
|
37
|
+
# or
|
|
38
|
+
pnpm add finance-calculator-pro
|
|
16
39
|
```
|
|
17
40
|
|
|
41
|
+
Works with **Node.js ≥ 16**. Ships as **CJS + ESM + TypeScript type declarations**. Zero runtime dependencies.
|
|
42
|
+
|
|
18
43
|
---
|
|
19
44
|
|
|
20
45
|
## 🏢 Enterprise Support & FinTech Development
|
|
21
46
|
|
|
22
|
-
**finance-calculator-pro** is engineered and maintained by **Boffin Coders**, a
|
|
47
|
+
**finance-calculator-pro** is engineered and maintained by **[Boffin Coders](https://boffincoders.com)**, a software development agency specialising in FinTech, financial dashboards, and enterprise-grade data platforms.
|
|
23
48
|
|
|
24
|
-
|
|
25
|
-
👉 **[Let's talk about your next project!](https://boffincoders.com)**
|
|
49
|
+
Building a stock screener, neo-bank, or internal financial analysis tool? [Let's talk →](https://boffincoders.com)
|
|
26
50
|
|
|
27
51
|
---
|
|
28
52
|
|
|
29
|
-
##
|
|
30
|
-
|
|
31
|
-
|
|
32
|
-
|
|
33
|
-
|
|
34
|
-
|
|
35
|
-
|
|
36
|
-
|
|
37
|
-
|
|
38
|
-
|
|
39
|
-
|
|
40
|
-
|
|
41
|
-
-
|
|
42
|
-
|
|
43
|
-
|
|
44
|
-
|
|
45
|
-
|
|
46
|
-
|
|
47
|
-
|
|
48
|
-
|
|
49
|
-
|
|
50
|
-
|
|
51
|
-
|
|
52
|
-
|
|
53
|
-
|
|
54
|
-
|
|
55
|
-
|
|
56
|
-
|
|
57
|
-
|
|
58
|
-
###
|
|
59
|
-
|
|
60
|
-
|
|
61
|
-
|
|
62
|
-
|
|
63
|
-
-
|
|
64
|
-
|
|
65
|
-
|
|
66
|
-
|
|
67
|
-
|
|
68
|
-
|
|
69
|
-
|
|
53
|
+
## Metrics Reference — 30+ Fundamental Analysis Metrics
|
|
54
|
+
|
|
55
|
+
### Valuation Ratios
|
|
56
|
+
| Metric | Function | Formula |
|
|
57
|
+
|---|---|---|
|
|
58
|
+
| Price-to-Earnings (P/E) | `pe()` | `Price / EPS` |
|
|
59
|
+
| Price-to-Book (P/B) | `pb()` | `Price / Book Value Per Share` |
|
|
60
|
+
| Price-to-Sales (P/S) | `ps()` | `Price / Revenue Per Share` |
|
|
61
|
+
| Price/Earnings-to-Growth (PEG) | `peg()` | `P/E / Earnings Growth Rate` |
|
|
62
|
+
| EV/EBITDA (Enterprise Multiple) | `evEbitda()` | `Enterprise Value / EBITDA` |
|
|
63
|
+
| EV / Revenue | `evRevenue()` | `Enterprise Value / Revenue` |
|
|
64
|
+
| EV / Free Cash Flow | `evFcf()` | `Enterprise Value / FCF` |
|
|
65
|
+
| Price-to-Cash-Flow (P/CF) | `priceToCashFlow()` | `Market Cap / Operating Cash Flow` |
|
|
66
|
+
| Earnings Yield | `earningsYield()` | `EPS / Price` |
|
|
67
|
+
| Dividend Yield | `dividendYield()` | `Annual Dividend / Price` |
|
|
68
|
+
| Discounted Cash Flow (DCF) | `calculateDCF()` | Terminal value + discounted FCF streams |
|
|
69
|
+
| Graham Number | `grahamNumber()` | `√(22.5 × EPS × Book Value)` |
|
|
70
|
+
|
|
71
|
+
### Profitability Metrics
|
|
72
|
+
| Metric | Function | Formula |
|
|
73
|
+
|---|---|---|
|
|
74
|
+
| Return on Assets (ROA) | `roa()` | `Net Income / Total Assets` |
|
|
75
|
+
| Return on Equity (ROE) | `roe()` | `Net Income / Total Equity` |
|
|
76
|
+
| Return on Invested Capital (ROIC) | `roic()` | `NOPAT / Invested Capital` |
|
|
77
|
+
| Gross Margin | `grossMargin()` | `Gross Profit / Revenue` |
|
|
78
|
+
| Operating Margin | `operatingMargin()` | `Operating Income / Revenue` |
|
|
79
|
+
| Net Profit Margin | `netProfitMargin()` | `Net Income / Revenue` |
|
|
80
|
+
| Free Cash Flow Margin | `fcfMargin()` | `FCF / Revenue` |
|
|
81
|
+
|
|
82
|
+
### Liquidity Ratios
|
|
83
|
+
| Metric | Function | Formula |
|
|
84
|
+
|---|---|---|
|
|
85
|
+
| Current Ratio | `currentRatio()` | `Current Assets / Current Liabilities` |
|
|
86
|
+
| Quick Ratio (Acid-Test) | `quickRatio()` | `(Current Assets − Inventory) / Current Liabilities` |
|
|
87
|
+
| Debt-to-Equity | `debtToEquity()` | `Total Debt / Total Equity` |
|
|
88
|
+
| Interest Coverage Ratio | `interestCoverage()` | `EBIT / Interest Expense` |
|
|
89
|
+
|
|
90
|
+
### Solvency & Leverage Metrics
|
|
91
|
+
| Metric | Function | Formula |
|
|
92
|
+
|---|---|---|
|
|
93
|
+
| Net Debt | `netDebt()` | `Total Debt − Cash & Equivalents` |
|
|
94
|
+
| Net Debt / EBITDA | `netDebtToEbitda()` | `(Debt − Cash) / EBITDA` |
|
|
95
|
+
| Debt-to-Assets | `debtToAssets()` | `Total Debt / Total Assets` |
|
|
96
|
+
|
|
97
|
+
### Efficiency Metrics
|
|
98
|
+
| Metric | Function | Formula |
|
|
99
|
+
|---|---|---|
|
|
100
|
+
| Asset Turnover | `assetTurnover()` | `Revenue / Average Assets` |
|
|
101
|
+
| Inventory Turnover | `inventoryTurnover()` | `COGS / Average Inventory` |
|
|
102
|
+
| Receivables Turnover | `receivablesTurnover()` | `Revenue / Trade Receivables` |
|
|
103
|
+
| Days Sales Outstanding (DSO) | `daysSalesOutstanding()` | `365 / Receivables Turnover` |
|
|
104
|
+
|
|
105
|
+
### Earnings Quality Metrics
|
|
106
|
+
| Metric | Function | Formula |
|
|
107
|
+
|---|---|---|
|
|
108
|
+
| Payout Ratio | `payoutRatio()` | `Annual Dividend / EPS` |
|
|
109
|
+
| Cash Conversion Ratio (CCR) | `cashConversionRatio()` | `Operating Cash Flow / Net Income` |
|
|
110
|
+
|
|
111
|
+
### Risk & Bankruptcy Prediction
|
|
112
|
+
| Metric | Function | Notes |
|
|
113
|
+
|---|---|---|
|
|
114
|
+
| Altman Z-Score | `altmanZScore()` | Z > 2.99 = safe, 1.81–2.99 = grey zone, < 1.81 = distress |
|
|
115
|
+
| Piotroski F-Score | `piotroski()` | 9-signal scorecard; 8–9 = strong, 0–2 = weak |
|
|
116
|
+
| Sharpe Ratio | `sharpe()` | Risk-adjusted return vs risk-free rate |
|
|
117
|
+
| Target Upside | `targetUpside()` | % gap to analyst target price |
|
|
118
|
+
|
|
119
|
+
### Growth & Timeseries Analysis
|
|
120
|
+
- **YoY Growth** — Year-over-year revenue, net income, EPS growth rates
|
|
121
|
+
- **QoQ Growth** — Quarter-over-quarter sequential growth
|
|
122
|
+
- **CAGR** — Compound Annual Growth Rate over any period
|
|
123
|
+
- **Fundamental Trends** — Multi-period margin trends, FCF conversion tracking
|
|
70
124
|
|
|
71
125
|
---
|
|
72
126
|
|
|
73
|
-
##
|
|
74
|
-
|
|
75
|
-
To use the massive aggregator functions (like `analyzeCompany` or `analyzeValuation`), you just pass an object of shape `CompanySnapshotInput`.
|
|
76
|
-
|
|
77
|
-
**EVERY FIELD IS OPTIONAL**. If you omit a field, the engine simply skips the metric that calculates it and safely returns `null` for that metric!
|
|
78
|
-
|
|
79
|
-
### `CompanySnapshotInput` (Used for Snapshot Analyzers)
|
|
80
|
-
```typescript
|
|
81
|
-
interface CompanySnapshotInput {
|
|
82
|
-
price?: number;
|
|
83
|
-
marketCap?: number;
|
|
84
|
-
totalRevenue?: number;
|
|
85
|
-
grossProfit?: number;
|
|
86
|
-
operatingIncome?: number;
|
|
87
|
-
netIncome?: number;
|
|
88
|
-
freeCashFlow?: number;
|
|
89
|
-
eps?: number;
|
|
90
|
-
bookValuePerShare?: number;
|
|
91
|
-
revenuePerShare?: number;
|
|
92
|
-
totalAssets?: number;
|
|
93
|
-
totalLiabilities?: number;
|
|
94
|
-
totalEquity?: number;
|
|
95
|
-
totalDebt?: number;
|
|
96
|
-
cashAndEquivalents?: number;
|
|
97
|
-
inventory?: number;
|
|
98
|
-
interestExpense?: number;
|
|
99
|
-
costOfRevenue?: number;
|
|
100
|
-
annualDividendPerShare?: number;
|
|
101
|
-
expectedEarningsGrowthRate?: number;
|
|
102
|
-
ebitda?: number;
|
|
103
|
-
workingCapital?: number;
|
|
104
|
-
retainedEarnings?: number;
|
|
105
|
-
ebit?: number;
|
|
106
|
-
taxRate?: number;
|
|
107
|
-
returns?: number; // for sharpe
|
|
108
|
-
riskFree?: number; // for sharpe
|
|
109
|
-
stdDev?: number; // for sharpe
|
|
110
|
-
analystTargetPrice?: number;
|
|
111
|
-
}
|
|
112
|
-
```
|
|
113
|
-
|
|
114
|
-
### `FundamentalTimeseriesInput` (Used for Trend Analyzers)
|
|
115
|
-
These metrics look at arrays chronologically from **oldest** to **newest**.
|
|
116
|
-
```typescript
|
|
117
|
-
interface FundamentalTimeseriesInput {
|
|
118
|
-
revenue: number[];
|
|
119
|
-
netIncome: number[];
|
|
120
|
-
costOfRevenue?: number[];
|
|
121
|
-
operatingIncome?: number[];
|
|
122
|
-
freeCashFlow?: number[];
|
|
123
|
-
eps?: number[];
|
|
124
|
-
}
|
|
125
|
-
```
|
|
126
|
-
|
|
127
|
-
---
|
|
127
|
+
## Quick Start
|
|
128
128
|
|
|
129
|
-
|
|
129
|
+
### The All-in-One API: `analyzeCompany()`
|
|
130
130
|
|
|
131
|
-
|
|
132
|
-
Pass your raw snapshot of a company, and let the engine derive everything at once. Setting `withInsights = true` will automatically translate numbers into human-readable recommendations ("Good", "Bad", "Neutral").
|
|
131
|
+
Pass any subset of a company's fundamentals and get structured analysis across all 7 categories at once:
|
|
133
132
|
|
|
134
133
|
```typescript
|
|
135
134
|
import { analyzeCompany } from 'finance-calculator-pro';
|
|
136
135
|
|
|
137
|
-
|
|
138
|
-
const rawData = {
|
|
136
|
+
const data = {
|
|
139
137
|
price: 150,
|
|
140
|
-
eps: 5,
|
|
138
|
+
eps: 5,
|
|
141
139
|
bookValuePerShare: 20,
|
|
142
140
|
marketCap: 150000,
|
|
143
141
|
totalDebt: 20000,
|
|
144
142
|
cashAndEquivalents: 5000,
|
|
143
|
+
ebitda: 9000,
|
|
145
144
|
netIncome: 5000,
|
|
145
|
+
operatingCashFlow: 7500,
|
|
146
|
+
totalRevenue: 50000,
|
|
146
147
|
totalAssets: 100000,
|
|
147
148
|
totalLiabilities: 60000,
|
|
148
149
|
totalEquity: 40000,
|
|
149
150
|
};
|
|
150
151
|
|
|
151
|
-
//
|
|
152
|
-
const
|
|
153
|
-
|
|
154
|
-
console.log(JSON.stringify(insightAnalysis.valuation, null, 2));
|
|
155
|
-
/*
|
|
156
|
-
{
|
|
157
|
-
"pe": {
|
|
158
|
-
"value": 30,
|
|
159
|
-
"status": "Bad",
|
|
160
|
-
"insight": "Expensive. High growth is priced in."
|
|
161
|
-
},
|
|
162
|
-
"pb": {
|
|
163
|
-
"value": 7.5,
|
|
164
|
-
"status": "Bad",
|
|
165
|
-
"insight": "Trading at a high premium to book value."
|
|
166
|
-
},
|
|
167
|
-
"ps": {
|
|
168
|
-
"value": null,
|
|
169
|
-
"status": "N/A",
|
|
170
|
-
"insight": "Sales data unavailable."
|
|
171
|
-
}
|
|
172
|
-
}
|
|
173
|
-
*/
|
|
174
|
-
```
|
|
152
|
+
// withInsights: true → returns { value, status, insight } for every metric
|
|
153
|
+
const analysis = analyzeCompany(data, true);
|
|
175
154
|
|
|
176
|
-
|
|
177
|
-
|
|
155
|
+
// Valuation
|
|
156
|
+
console.log(analysis.valuation.pe);
|
|
157
|
+
// { value: 30, status: "Bad", insight: "Expensive. High growth is priced in." }
|
|
178
158
|
|
|
179
|
-
|
|
180
|
-
|
|
181
|
-
- `analyzeProfitability(data, withInsights?)`
|
|
182
|
-
- `analyzeLiquidity(data, withInsights?)`
|
|
183
|
-
- `analyzeEfficiency(data, withInsights?)`
|
|
184
|
-
- `analyzeRisk(data, withInsights?)`
|
|
159
|
+
console.log(analysis.valuation.evEbitda);
|
|
160
|
+
// { value: 18.33, status: "Bad", insight: "Expensive relative to cash earnings." }
|
|
185
161
|
|
|
186
|
-
|
|
187
|
-
|
|
162
|
+
// Solvency
|
|
163
|
+
console.log(analysis.solvency.netDebtToEbitda);
|
|
164
|
+
// { value: 1.5, status: "Good", insight: "Low leverage. Manageable debt load." }
|
|
165
|
+
|
|
166
|
+
// Earnings Quality
|
|
167
|
+
console.log(analysis.quality.cashConversionRatio);
|
|
168
|
+
// { value: 1.5, status: "Good", insight: "Cash-backed earnings. Strong quality." }
|
|
188
169
|
|
|
189
|
-
|
|
190
|
-
console.log(
|
|
170
|
+
// Risk
|
|
171
|
+
console.log(analysis.risk.altmanZScore);
|
|
172
|
+
// { value: 3.71, status: "Good", insight: "Safe zone. Low bankruptcy risk." }
|
|
191
173
|
```
|
|
192
174
|
|
|
193
|
-
|
|
194
|
-
If you only need to calculate and evaluate a **single metric** (like P/E), you can combine the pure math modules directly with the `evaluate` engine to get insights without building a full company snapshot!
|
|
175
|
+
Returns 7 analysis categories: `valuation` · `profitability` · `liquidity` · `solvency` · `efficiency` · `risk` · `quality`
|
|
195
176
|
|
|
196
|
-
|
|
197
|
-
import { pe, evaluate } from 'finance-calculator-pro';
|
|
177
|
+
Every field in the input is **optional** — missing fields cause their dependent metrics to return `null` safely. The engine never throws.
|
|
198
178
|
|
|
199
|
-
|
|
200
|
-
const ratio = pe(150 /* price */, 5 /* eps */); // -> 30
|
|
179
|
+
---
|
|
201
180
|
|
|
202
|
-
|
|
203
|
-
const insight = evaluate.pe(ratio);
|
|
181
|
+
### Categorical Analyzers
|
|
204
182
|
|
|
205
|
-
|
|
206
|
-
|
|
207
|
-
|
|
208
|
-
|
|
209
|
-
|
|
210
|
-
|
|
211
|
-
|
|
212
|
-
|
|
183
|
+
Run analysis on a single dimension — useful for dashboards, screeners, or compute-sensitive environments:
|
|
184
|
+
|
|
185
|
+
```typescript
|
|
186
|
+
import {
|
|
187
|
+
analyzeValuation,
|
|
188
|
+
analyzeProfitability,
|
|
189
|
+
analyzeLiquidity,
|
|
190
|
+
analyzeSolvency,
|
|
191
|
+
analyzeEfficiency,
|
|
192
|
+
analyzeRisk,
|
|
193
|
+
analyzeQuality,
|
|
194
|
+
} from 'finance-calculator-pro';
|
|
195
|
+
|
|
196
|
+
const solvency = analyzeSolvency(data, true);
|
|
197
|
+
console.log(solvency.netDebtToEbitda);
|
|
198
|
+
// { value: 1.5, status: "Good", insight: "..." }
|
|
199
|
+
|
|
200
|
+
const quality = analyzeQuality(data, true);
|
|
201
|
+
console.log(quality.cashConversionRatio);
|
|
202
|
+
// { value: 1.5, status: "Good", insight: "Cash-backed earnings. Strong quality." }
|
|
213
203
|
```
|
|
214
204
|
|
|
215
|
-
|
|
216
|
-
|
|
205
|
+
---
|
|
206
|
+
|
|
207
|
+
### Batch Analysis — Stock Screener
|
|
208
|
+
|
|
209
|
+
Evaluate an entire watchlist in one call:
|
|
217
210
|
|
|
218
211
|
```typescript
|
|
219
212
|
import { analyzeBatch } from 'finance-calculator-pro';
|
|
220
213
|
|
|
221
|
-
const
|
|
222
|
-
|
|
214
|
+
const results = analyzeBatch([appleData, msftData, nvidiaData, tcsData], true);
|
|
215
|
+
|
|
216
|
+
// Sort by P/E ascending — cheapest first
|
|
217
|
+
const byPe = results
|
|
218
|
+
.filter(r => r.valuation.pe?.value !== null)
|
|
219
|
+
.sort((a, b) => (a.valuation.pe!.value as number) - (b.valuation.pe!.value as number));
|
|
223
220
|
```
|
|
224
221
|
|
|
225
|
-
|
|
226
|
-
|
|
222
|
+
---
|
|
223
|
+
|
|
224
|
+
### Timeseries & Growth Trend Analysis
|
|
225
|
+
|
|
226
|
+
Pass chronological arrays (oldest → newest) to compute growth rates and margin trends automatically:
|
|
227
227
|
|
|
228
228
|
```typescript
|
|
229
229
|
import { analyzeFundamentalTrends } from 'finance-calculator-pro';
|
|
230
230
|
|
|
231
|
-
const
|
|
232
|
-
revenue:
|
|
233
|
-
netIncome: [
|
|
234
|
-
};
|
|
231
|
+
const trends = analyzeFundamentalTrends({
|
|
232
|
+
revenue: [365_817, 394_328, 383_285],
|
|
233
|
+
netIncome: [ 94_680, 99_803, 96_995],
|
|
234
|
+
}, 'annual');
|
|
235
235
|
|
|
236
|
-
//
|
|
237
|
-
|
|
238
|
-
|
|
239
|
-
console.log(
|
|
240
|
-
/*
|
|
241
|
-
{
|
|
242
|
-
"periodType": "annual",
|
|
243
|
-
"growth": {
|
|
244
|
-
"revenueGrowth": [0.125, 0.111111],
|
|
245
|
-
"netIncomeGrowth": [0.25, 0.20],
|
|
246
|
-
"revenueCagr": 0.118,
|
|
247
|
-
"netIncomeCagr": 0.224
|
|
248
|
-
},
|
|
249
|
-
"margins": {
|
|
250
|
-
"netMargins": [0.1, 0.111, 0.12]
|
|
251
|
-
}
|
|
252
|
-
}
|
|
253
|
-
*/
|
|
236
|
+
console.log(trends.growth.revenueCagr); // -0.022 (-2.2% CAGR)
|
|
237
|
+
console.log(trends.growth.revenueGrowth); // [0.0777, -0.0282]
|
|
238
|
+
console.log(trends.margins.netProfitMargin); // [0.259, 0.253, 0.253]
|
|
239
|
+
console.log(trends.quality.fcfConversion); // FCF / Net Income per period
|
|
254
240
|
```
|
|
255
241
|
|
|
256
|
-
|
|
257
|
-
|
|
242
|
+
---
|
|
243
|
+
|
|
244
|
+
### Individual Math Functions
|
|
258
245
|
|
|
259
|
-
Every function returns
|
|
246
|
+
Import any function directly for lightweight single-metric use. Every function returns `number | null` — `null` means a required input was absent; the library never throws:
|
|
260
247
|
|
|
261
|
-
#### Valuation
|
|
262
248
|
```typescript
|
|
263
|
-
import {
|
|
264
|
-
|
|
265
|
-
|
|
266
|
-
|
|
267
|
-
|
|
268
|
-
|
|
269
|
-
|
|
270
|
-
|
|
271
|
-
|
|
272
|
-
|
|
273
|
-
|
|
274
|
-
|
|
275
|
-
|
|
276
|
-
|
|
277
|
-
|
|
278
|
-
);
|
|
249
|
+
import {
|
|
250
|
+
pe, pb, ps, peg, evEbitda, evRevenue, evFcf,
|
|
251
|
+
priceToCashFlow, earningsYield, grahamNumber, calculateDCF,
|
|
252
|
+
roa, roe, roic, grossMargin, operatingMargin, netProfitMargin,
|
|
253
|
+
currentRatio, quickRatio, debtToEquity, interestCoverage,
|
|
254
|
+
netDebt, netDebtToEbitda, debtToAssets,
|
|
255
|
+
assetTurnover, receivablesTurnover, daysSalesOutstanding,
|
|
256
|
+
payoutRatio, cashConversionRatio,
|
|
257
|
+
altmanZScore, piotroski, sharpe, targetUpside,
|
|
258
|
+
evaluate,
|
|
259
|
+
} from 'finance-calculator-pro';
|
|
260
|
+
|
|
261
|
+
// Valuation
|
|
262
|
+
pe(150, 5); // → 30
|
|
263
|
+
priceToCashFlow(150_000, 7_000); // → 21.43
|
|
264
|
+
earningsYield(5, 150); // → 0.0333 (3.33%)
|
|
265
|
+
grahamNumber(5, 20); // → 47.43 (null if EPS or book ≤ 0)
|
|
266
|
+
|
|
267
|
+
// Solvency
|
|
268
|
+
netDebtToEbitda(20_000, 5_000, 10_000); // → 1.5
|
|
269
|
+
debtToAssets(20_000, 100_000); // → 0.20
|
|
270
|
+
|
|
271
|
+
// Efficiency
|
|
272
|
+
daysSalesOutstanding(50_000, 6_250); // → 45.6 days
|
|
273
|
+
|
|
274
|
+
// Earnings Quality
|
|
275
|
+
cashConversionRatio(7_000, 5_000); // → 1.4
|
|
276
|
+
|
|
277
|
+
// Risk
|
|
278
|
+
altmanZScore(15_000, 20_000, 7_500, 250_000, 50_000, 100_000, 60_000); // → 3.71
|
|
279
|
+
sharpe(0.12, 0.04, 0.15); // → 0.533
|
|
280
|
+
|
|
281
|
+
// Piotroski F-Score
|
|
282
|
+
const result = piotroski({
|
|
283
|
+
netIncome: 5_000, totalAssets: 100_000, operatingCashFlow: 7_000,
|
|
284
|
+
priorNetIncome: 4_000, priorTotalAssets: 100_000,
|
|
285
|
+
});
|
|
286
|
+
result.score; // → 4
|
|
287
|
+
result.maxScore; // → 5
|
|
288
|
+
|
|
289
|
+
// Pair raw math with the Insights Engine
|
|
290
|
+
const ratio = pe(150, 5); // → 30
|
|
291
|
+
evaluate.pe(ratio);
|
|
292
|
+
// { value: 30, status: "Bad", insight: "Expensive. High growth is priced in." }
|
|
279
293
|
```
|
|
280
294
|
|
|
281
|
-
|
|
282
|
-
```typescript
|
|
283
|
-
import { roa, roe, roic, grossMargin, operatingMargin, netProfitMargin, fcfMargin } from 'finance-calculator-pro';
|
|
295
|
+
---
|
|
284
296
|
|
|
285
|
-
|
|
286
|
-
roe(5000 /* netIncome */, 40000 /* totalEquity */); // -> 0.125
|
|
287
|
-
roic(7000 /* operatingIncome */, 0.2 /* taxRate */, 20000 /* debt */, 40000 /* equity */, 5000 /* cash */); // -> 0.1018
|
|
297
|
+
### Works with any data source
|
|
288
298
|
|
|
289
|
-
|
|
290
|
-
grossMargin(50000 /* revenue */, 20000 /* costOfRevenue */); // -> 0.60
|
|
291
|
-
operatingMargin(7000 /* operatingIncome */, 50000 /* revenue */); // -> 0.14
|
|
292
|
-
netProfitMargin(5000 /* netIncome */, 50000 /* revenue */); // -> 0.10
|
|
293
|
-
fcfMargin(3000 /* freeCashFlow */, 50000 /* revenue */); // -> 0.06
|
|
294
|
-
```
|
|
299
|
+
`finance-calculator-pro` accepts plain numbers — no proprietary data format required. Feed it data from `yahoo-finance2`, Alpha Vantage, Financial Modeling Prep, Polygon.io, your own database, or manually entered values. If you can get the numbers, the engine handles the rest.
|
|
295
300
|
|
|
296
|
-
|
|
297
|
-
```typescript
|
|
298
|
-
import { currentRatio, quickRatio, debtToEquity, interestCoverage } from 'finance-calculator-pro';
|
|
301
|
+
---
|
|
299
302
|
|
|
300
|
-
|
|
301
|
-
|
|
302
|
-
|
|
303
|
-
interestCoverage(7500 /* ebit */, 500 /* interestExpense */); // -> 15
|
|
304
|
-
```
|
|
303
|
+
## TypeScript Support
|
|
304
|
+
|
|
305
|
+
Full type declarations included. All input fields are optional:
|
|
305
306
|
|
|
306
|
-
#### Efficiency
|
|
307
307
|
```typescript
|
|
308
|
-
import {
|
|
308
|
+
import type { CompanySnapshotInput, FundamentalTimeseriesInput } from 'finance-calculator-pro';
|
|
309
309
|
|
|
310
|
-
|
|
311
|
-
|
|
310
|
+
const snapshot: CompanySnapshotInput = {
|
|
311
|
+
price: 150,
|
|
312
|
+
eps: 5,
|
|
313
|
+
// Every field is optional — add only what you have
|
|
314
|
+
};
|
|
312
315
|
```
|
|
313
316
|
|
|
314
|
-
|
|
317
|
+
**`CompanySnapshotInput` fields:**
|
|
318
|
+
|
|
315
319
|
```typescript
|
|
316
|
-
|
|
317
|
-
|
|
318
|
-
|
|
319
|
-
|
|
320
|
-
|
|
321
|
-
|
|
322
|
-
|
|
323
|
-
|
|
324
|
-
|
|
325
|
-
|
|
326
|
-
|
|
327
|
-
|
|
328
|
-
|
|
329
|
-
|
|
330
|
-
|
|
331
|
-
|
|
320
|
+
interface CompanySnapshotInput {
|
|
321
|
+
// Pricing
|
|
322
|
+
price?: number;
|
|
323
|
+
marketCap?: number;
|
|
324
|
+
eps?: number;
|
|
325
|
+
bookValuePerShare?: number;
|
|
326
|
+
revenuePerShare?: number;
|
|
327
|
+
annualDividendPerShare?: number;
|
|
328
|
+
analystTargetPrice?: number;
|
|
329
|
+
|
|
330
|
+
// Income Statement
|
|
331
|
+
totalRevenue?: number;
|
|
332
|
+
grossProfit?: number;
|
|
333
|
+
operatingIncome?: number;
|
|
334
|
+
netIncome?: number;
|
|
335
|
+
freeCashFlow?: number;
|
|
336
|
+
operatingCashFlow?: number;
|
|
337
|
+
ebitda?: number;
|
|
338
|
+
ebit?: number;
|
|
339
|
+
costOfRevenue?: number;
|
|
340
|
+
interestExpense?: number;
|
|
341
|
+
expectedEarningsGrowthRate?: number;
|
|
342
|
+
|
|
343
|
+
// Balance Sheet
|
|
344
|
+
totalAssets?: number;
|
|
345
|
+
totalLiabilities?: number;
|
|
346
|
+
totalEquity?: number;
|
|
347
|
+
totalDebt?: number;
|
|
348
|
+
longTermDebt?: number;
|
|
349
|
+
cashAndEquivalents?: number;
|
|
350
|
+
inventory?: number;
|
|
351
|
+
tradeReceivables?: number;
|
|
352
|
+
workingCapital?: number;
|
|
353
|
+
retainedEarnings?: number;
|
|
354
|
+
sharesOutstanding?: number;
|
|
355
|
+
taxRate?: number;
|
|
356
|
+
|
|
357
|
+
// Risk / Portfolio
|
|
358
|
+
returns?: number;
|
|
359
|
+
riskFree?: number;
|
|
360
|
+
stdDev?: number;
|
|
361
|
+
}
|
|
332
362
|
```
|
|
333
363
|
|
|
334
|
-
|
|
335
|
-
|
|
364
|
+
---
|
|
365
|
+
|
|
366
|
+
## API Summary
|
|
367
|
+
|
|
368
|
+
| Function | Category | Description |
|
|
369
|
+
|---|---|---|
|
|
370
|
+
| `analyzeCompany(data, insights?)` | All-in-one | All 7 categories at once |
|
|
371
|
+
| `analyzeValuation(data, insights?)` | Valuation | P/E, P/B, P/S, PEG, EV/EBITDA, Graham, P/CF, EY, EV/Rev, EV/FCF |
|
|
372
|
+
| `analyzeProfitability(data, insights?)` | Profitability | ROA, ROE, ROIC, all margins |
|
|
373
|
+
| `analyzeLiquidity(data, insights?)` | Liquidity | Current, Quick, D/E, Interest Coverage |
|
|
374
|
+
| `analyzeSolvency(data, insights?)` | Solvency | Net Debt, Net Debt/EBITDA, Debt/Assets |
|
|
375
|
+
| `analyzeEfficiency(data, insights?)` | Efficiency | Asset Turnover, Inventory, Receivables, DSO |
|
|
376
|
+
| `analyzeRisk(data, insights?)` | Risk | Altman Z-Score, Sharpe, Piotroski F-Score |
|
|
377
|
+
| `analyzeQuality(data, insights?)` | Quality | Payout Ratio, Cash Conversion Ratio |
|
|
378
|
+
| `analyzeBatch(dataArray, insights?)` | Batch | Array of snapshots → array of analyses |
|
|
379
|
+
| `analyzeFundamentalTrends(data, period)` | Timeseries | YoY/QoQ growth, CAGR, margin trends |
|
|
336
380
|
|
|
337
|
-
|
|
338
|
-
import { calculateGrowthRate, yoyGrowth, qoqGrowth, cagr } from 'finance-calculator-pro';
|
|
381
|
+
---
|
|
339
382
|
|
|
340
|
-
|
|
341
|
-
yoyGrowth([40000, 45000, 50000] /* chronologicalDataPoints */); // -> [0.125, 0.1111]
|
|
383
|
+
## Why finance-calculator-pro?
|
|
342
384
|
|
|
343
|
-
|
|
344
|
-
|
|
385
|
+
| Feature | finance-calculator-pro |
|
|
386
|
+
|---|---|
|
|
387
|
+
| Dependencies | **Zero** |
|
|
388
|
+
| Bundle size | **< 20 KB** (tree-shakeable) |
|
|
389
|
+
| TypeScript | **Full types included** |
|
|
390
|
+
| Return type | `number \| null` (never throws) |
|
|
391
|
+
| Insights engine | **Built-in** (value + status + insight) |
|
|
392
|
+
| Batch processing | **Yes** |
|
|
393
|
+
| Timeseries / growth | **Yes** |
|
|
394
|
+
| Browser / Edge compatible | **Yes** |
|
|
395
|
+
| ESM + CJS | **Both** |
|
|
345
396
|
|
|
346
|
-
|
|
347
|
-
|
|
348
|
-
|
|
397
|
+
---
|
|
398
|
+
|
|
399
|
+
## License
|
|
400
|
+
|
|
401
|
+
MIT © [Boffin Coders](https://boffincoders.com)
|
|
402
|
+
|
|
403
|
+
---
|
|
404
|
+
|
|
405
|
+
## Keywords
|
|
406
|
+
|
|
407
|
+
financial ratios · stock analysis · fundamental analysis · valuation metrics · P/E ratio · price-to-earnings · price-to-book · EV/EBITDA · enterprise value · DCF · discounted cash flow · Graham number · Altman Z-Score · Piotroski F-Score · Sharpe ratio · ROE · ROA · ROIC · profit margin · liquidity ratio · debt-to-equity · solvency · current ratio · quick ratio · asset turnover · days sales outstanding · payout ratio · cash conversion ratio · earnings yield · stock screener · investment analysis · equity analysis · portfolio analysis · FinTech · financial calculator · TypeScript · JavaScript · Node.js
|