dsh-context 0.77.0 → 0.78.0
This diff represents the content of publicly available package versions that have been released to one of the supported registries. The information contained in this diff is provided for informational purposes only and reflects changes between package versions as they appear in their respective public registries.
- package/README.md +3 -3
- package/lib/client.js +31 -19
- package/lib/index.d.ts +44 -12
- package/lib/index.js +7 -7
- package/package.json +15 -15
package/README.md
CHANGED
|
@@ -67,7 +67,7 @@ Click **Context Insights / 上下文洞察** in the sidebar's panel list — the
|
|
|
67
67
|
| **7-day usage chart** | When did I spend what — each of the last 7 days' billed tokens and estimated cost as a bar pair, folded per turn off the sessions' own request times (not the session's last-active day). |
|
|
68
68
|
| **Activity heatmap** | When do I actually work — the last 8 weeks of daily billed tokens; click a day to filter the sessions that were active on it. |
|
|
69
69
|
| **Settings entry** | One row under the heatmap — the same guarded jump to this plugin's preferences as the Context tab's Plugin Info card. |
|
|
70
|
-
| **Context Composition** | Where the picked range's billed tokens went, split by the
|
|
70
|
+
| **Context Composition** | Where the picked range's billed tokens went, split by the Token card's billed categories (Tool Calls, Reasoning, Answers, …). |
|
|
71
71
|
| **Session cards** | Each session's profile: composition ring, billed tokens, turns, cost, and its workspace-group / project breadcrumb — sorted by recency, tokens, or context size, searchable, grouped by workspace. A card click opens the session. |
|
|
72
72
|
|
|
73
73
|
|
|
@@ -80,7 +80,7 @@ Open any session and click the **Context / 上下文** tab:
|
|
|
80
80
|
| Card | The question it answers |
|
|
81
81
|
| --- | --- |
|
|
82
82
|
| **Context Stats** | Turns, steps, human inputs, live tool calls — plus a cost estimated from the models.dev list prices (hover the `?` for per-1M rates; only DeepSeek splits peak/off-peak: its listed rates are the off-peak tier, and peak windows bill at 2×). |
|
|
83
|
-
| **Token Stats** | Where the billed tokens went — the same total as the chat stats line under the composer, split
|
|
83
|
+
| **Token Stats** | Where the billed tokens went — the same total as the chat stats line under the composer, split into System Prompt, Tool Schemas, User Messages, Injected Context, Skill Injections, Tool Calls, Reasoning, and Answers. Tool Calls folds the tool-call names and arguments (replayed in the prompt plus generated in the output) together with the results those tools returned; Answers splits the model's reply prose out of the same assistant content and output; Reasoning splits its thinking the same way; the session's cache-hit rate sits in the corner. |
|
|
84
84
|
| **Timing Stats** | How active time split across model calls, tool runs, and overhead. |
|
|
85
85
|
| **Current Context** | What's in the window *right now*. |
|
|
86
86
|
| **Context Trend** | Every request's size — and its story. |
|
|
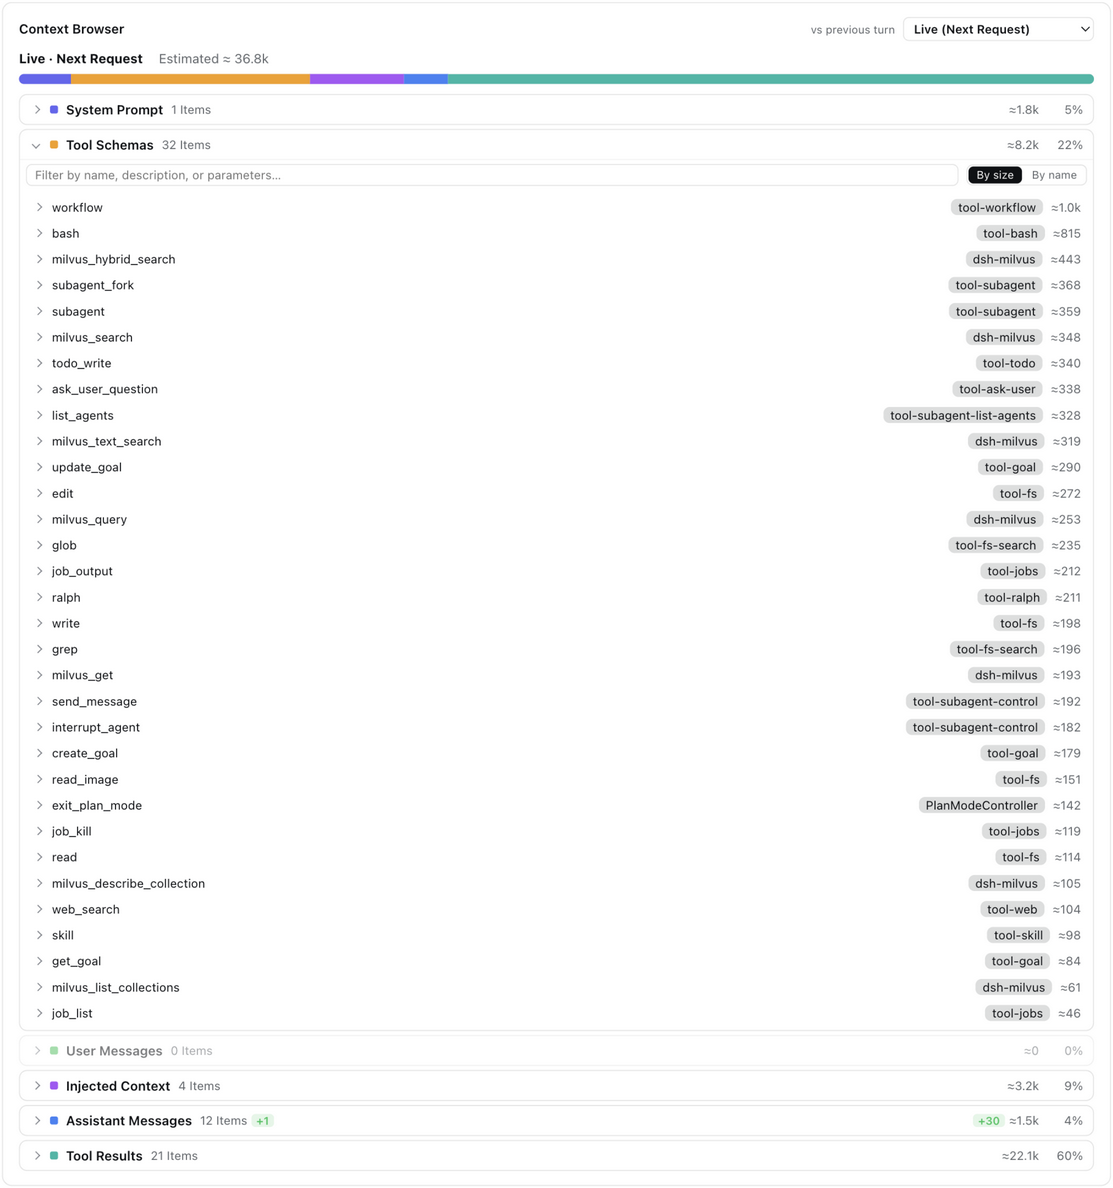
@@ -134,7 +134,7 @@ Pick **Live (next request)** or any retained step, and browse what that request
|
|
|
134
134
|
|
|
135
135
|
|
|
136
136
|
|
|
137
|
-
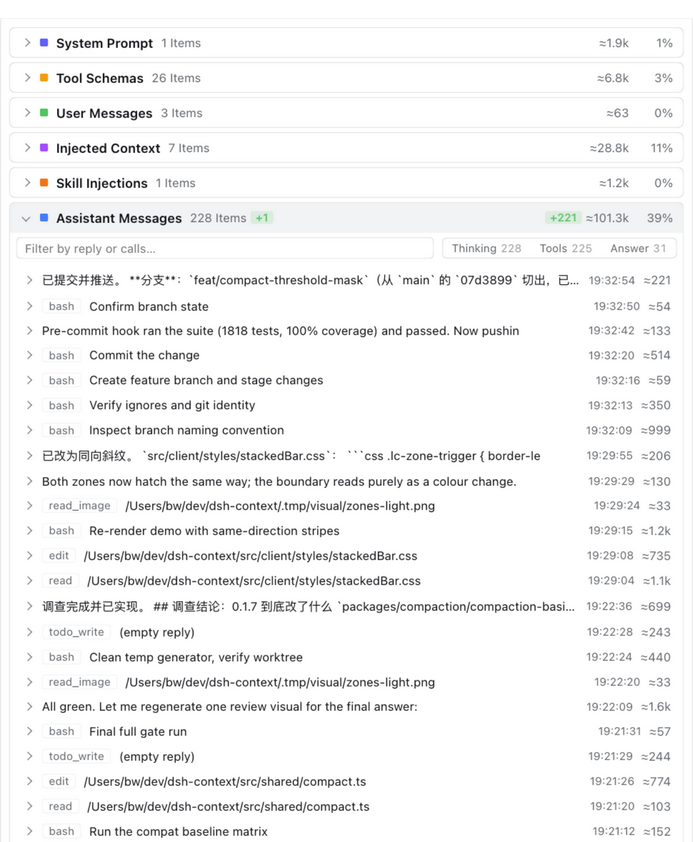
- **Filter assistant replies by kind** — the assistant category's search box carries **Thinking / Tools / Answer** chips, each
|
|
137
|
+
- **Filter assistant replies by kind** — the assistant category's search box carries **Thinking / Tools / Answer** chips, each counting the replies of that kind in the current search results (one reply can carry several); click one to keep only the matching replies, click again to clear:
|
|
138
138
|
|
|
139
139
|
|
|
140
140
|
|