dsh-context 0.73.2 → 0.74.0
This diff represents the content of publicly available package versions that have been released to one of the supported registries. The information contained in this diff is provided for informational purposes only and reflects changes between package versions as they appear in their respective public registries.
- package/README.md +6 -6
- package/lib/client.js +11 -11
- package/lib/index.d.ts +29 -1
- package/lib/index.js +6 -6
- package/package.json +3 -2
package/README.md
CHANGED
|
@@ -63,11 +63,11 @@ Click **Context Insights / 上下文洞察** in the sidebar's panel list — the
|
|
|
63
63
|
|
|
64
64
|
| Section | The question it answers |
|
|
65
65
|
| --- | --- |
|
|
66
|
-
| **KPI band** | How much am I using — sessions, billed tokens, estimated cost,
|
|
66
|
+
| **KPI band** | How much am I using — sessions, billed tokens, estimated cost, cache-hit rate, turns, tool runs, and active time over the picked range (7d / 30d / all), each figure folded by the day its step started. |
|
|
67
67
|
| **7-day usage chart** | When did I spend what — each of the last 7 days' billed tokens and estimated cost as a bar pair, folded per turn off the sessions' own request times (not the session's last-active day). |
|
|
68
68
|
| **Activity heatmap** | When do I actually work — the last 8 weeks of daily billed tokens; click a day to filter the sessions that were active on it. |
|
|
69
69
|
| **Settings entry** | One row under the heatmap — the same guarded jump to this plugin's preferences as the Context tab's Plugin Info card. |
|
|
70
|
-
| **Context Composition** | Where the
|
|
70
|
+
| **Context Composition** | Where the picked range's billed tokens went, split by the Context tab's composition categories. |
|
|
71
71
|
| **Session cards** | Each session's profile: composition ring, billed tokens, turns, cost, and its workspace-group / project breadcrumb — sorted by recency, tokens, or context size, searchable, grouped by workspace. A card click opens the session. |
|
|
72
72
|
|
|
73
73
|
|
|
@@ -79,7 +79,7 @@ Open any session and click the **Context / 上下文** tab:
|
|
|
79
79
|
|
|
80
80
|
| Card | The question it answers |
|
|
81
81
|
| --- | --- |
|
|
82
|
-
| **Context Stats** | Turns, steps, human inputs, live tool calls — plus a cost estimated from the models.dev list prices (hover the `?` for per-1M rates; DeepSeek peak/off-peak
|
|
82
|
+
| **Context Stats** | Turns, steps, human inputs, live tool calls — plus a cost estimated from the models.dev list prices (hover the `?` for per-1M rates; only DeepSeek splits peak/off-peak: its listed rates are the off-peak tier, and peak windows bill at 2×). |
|
|
83
83
|
| **Token Stats** | Where the billed tokens went — the same total as the chat stats line under the composer, split by composition (system, tools, messages…) with the provider-exact output closing the ring, and the session's cache-hit rate in the corner. |
|
|
84
84
|
| **Timing Stats** | How active time split across model calls, tool runs, and overhead. |
|
|
85
85
|
| **Current Context** | What's in the window *right now*. |
|
|
@@ -119,7 +119,7 @@ One stacked bar per model request — finer than per-message — so you watch th
|
|
|
119
119
|
|
|
120
120
|
|
|
121
121
|
|
|
122
|
-
- **Overview** — one toggle squashes the whole session (steps or turns) into the pane's width as a continuous stacked ribbon: every compaction drop and composition shift at a glance, no sideways scrolling, nothing extra to load. Flags mark the quartiles and the full span; hover to scrub,
|
|
122
|
+
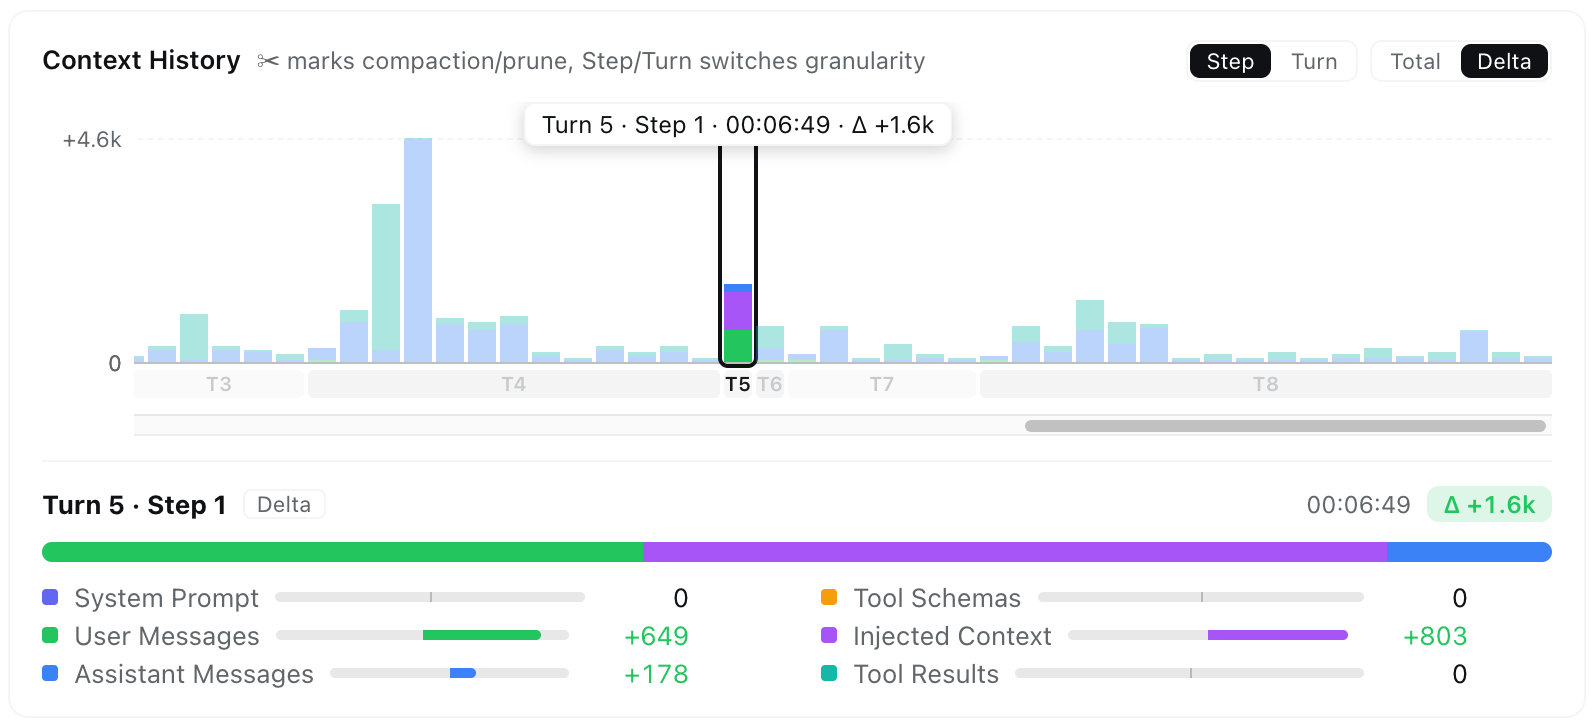
- **Overview** — one toggle squashes the whole session (steps or turns) into the pane's width as a continuous stacked ribbon: every compaction drop and composition shift at a glance, no sideways scrolling, nothing extra to load. Flags mark the quartiles and the full span; hover to scrub, hover a band to light that category across the whole ribbon; click pins the step and opens that band's category in the browser (exclusive with DNA mode and Adaptive).
|
|
123
123
|
- **Hover & pin** — scrub for an instant tooltip; click to pin the full breakdown, with provider-reported **Actual Prompt / Output / Cache** next to the estimates.
|
|
124
124
|
- **Live linkage** — hovering a bar previews that step's assembled context in the Context browser beside the chart; leaving the chart returns to your own pick.
|
|
125
125
|
|
|
@@ -190,11 +190,11 @@ A centered dialog opens with the **Current Composition** card and the **Context
|
|
|
190
190
|
|
|
191
191
|
## ⚙️ Settings
|
|
192
192
|
|
|
193
|
-
The **Context** preferences card holds this plugin's per-user settings — default placement (the **Context** and **Fleet** conversation tabs, the right Sidebar panel, or both), the **Fleet** tab's own Show/Hide switch, trend granularity (Step/Turn), trend mode (Total/Delta), the trend duration curve (shown by default), tool and File Activity sort, and the sidebar insights entry. It lives on the **Plugins** page: the sidebar **Plugins** entry → the **dsh-context** bundle's page → its **Configuration** section (the card is served by the entry's live Config form).
|
|
193
|
+
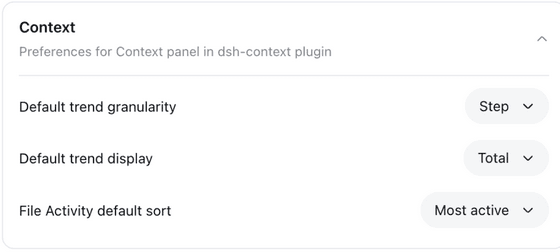
The **Context** preferences card holds this plugin's per-user settings — default placement (the **Context** and **Fleet** conversation tabs, the right Sidebar panel, or both), the **Fleet** tab's own Show/Hide switch, the **Context Insights** default range (Today / Last 7 days / Last 30 days / All, Last 30 days unless changed; picking a preset on the page writes it back), trend granularity (Step/Turn), trend mode (Total/Delta), the trend duration curve (shown by default), tool and File Activity sort, and the sidebar insights entry. It lives on the **Plugins** page: the sidebar **Plugins** entry → the **dsh-context** bundle's page → its **Configuration** section (the card is served by the entry's live Config form).
|
|
194
194
|
|
|
195
195
|
The **System Prompt · Prefix / Suffix** rows hold free text joined at the very start / end of every session's system prompt, for all agents (subagents included) — a per-deployment persona or behavioral rule that rides the harness's own prompt assembly. Edits apply from the next turn; leave a row empty to disable it.
|
|
196
196
|
|
|
197
|
-
|
|
197
|
+
The Context Insights preset buttons write the pick back as the stored default; every other in-chart and in-card toggle stays per-view and never overwrites the stored preference.
|
|
198
198
|
|
|
199
199
|
|
|
200
200
|
|