dsh-context 0.52.1 → 0.53.0
This diff represents the content of publicly available package versions that have been released to one of the supported registries. The information contained in this diff is provided for informational purposes only and reflects changes between package versions as they appear in their respective public registries.
- package/README.md +17 -1
- package/lib/client.js +4678 -3106
- package/lib/index.d.ts +67 -1
- package/lib/index.js +746 -475
- package/package.json +1 -1
package/README.md
CHANGED
|
@@ -9,6 +9,7 @@
|
|
|
9
9
|
**The best [DeepSeek Harness plugin](https://www.deepseek.com/harness/) for Agent's context insights and management.**
|
|
10
10
|
|
|
11
11
|
[`dsh-context`](https://www.npmjs.com/package/dsh-context) provides full context lifecycle management features.
|
|
12
|
+
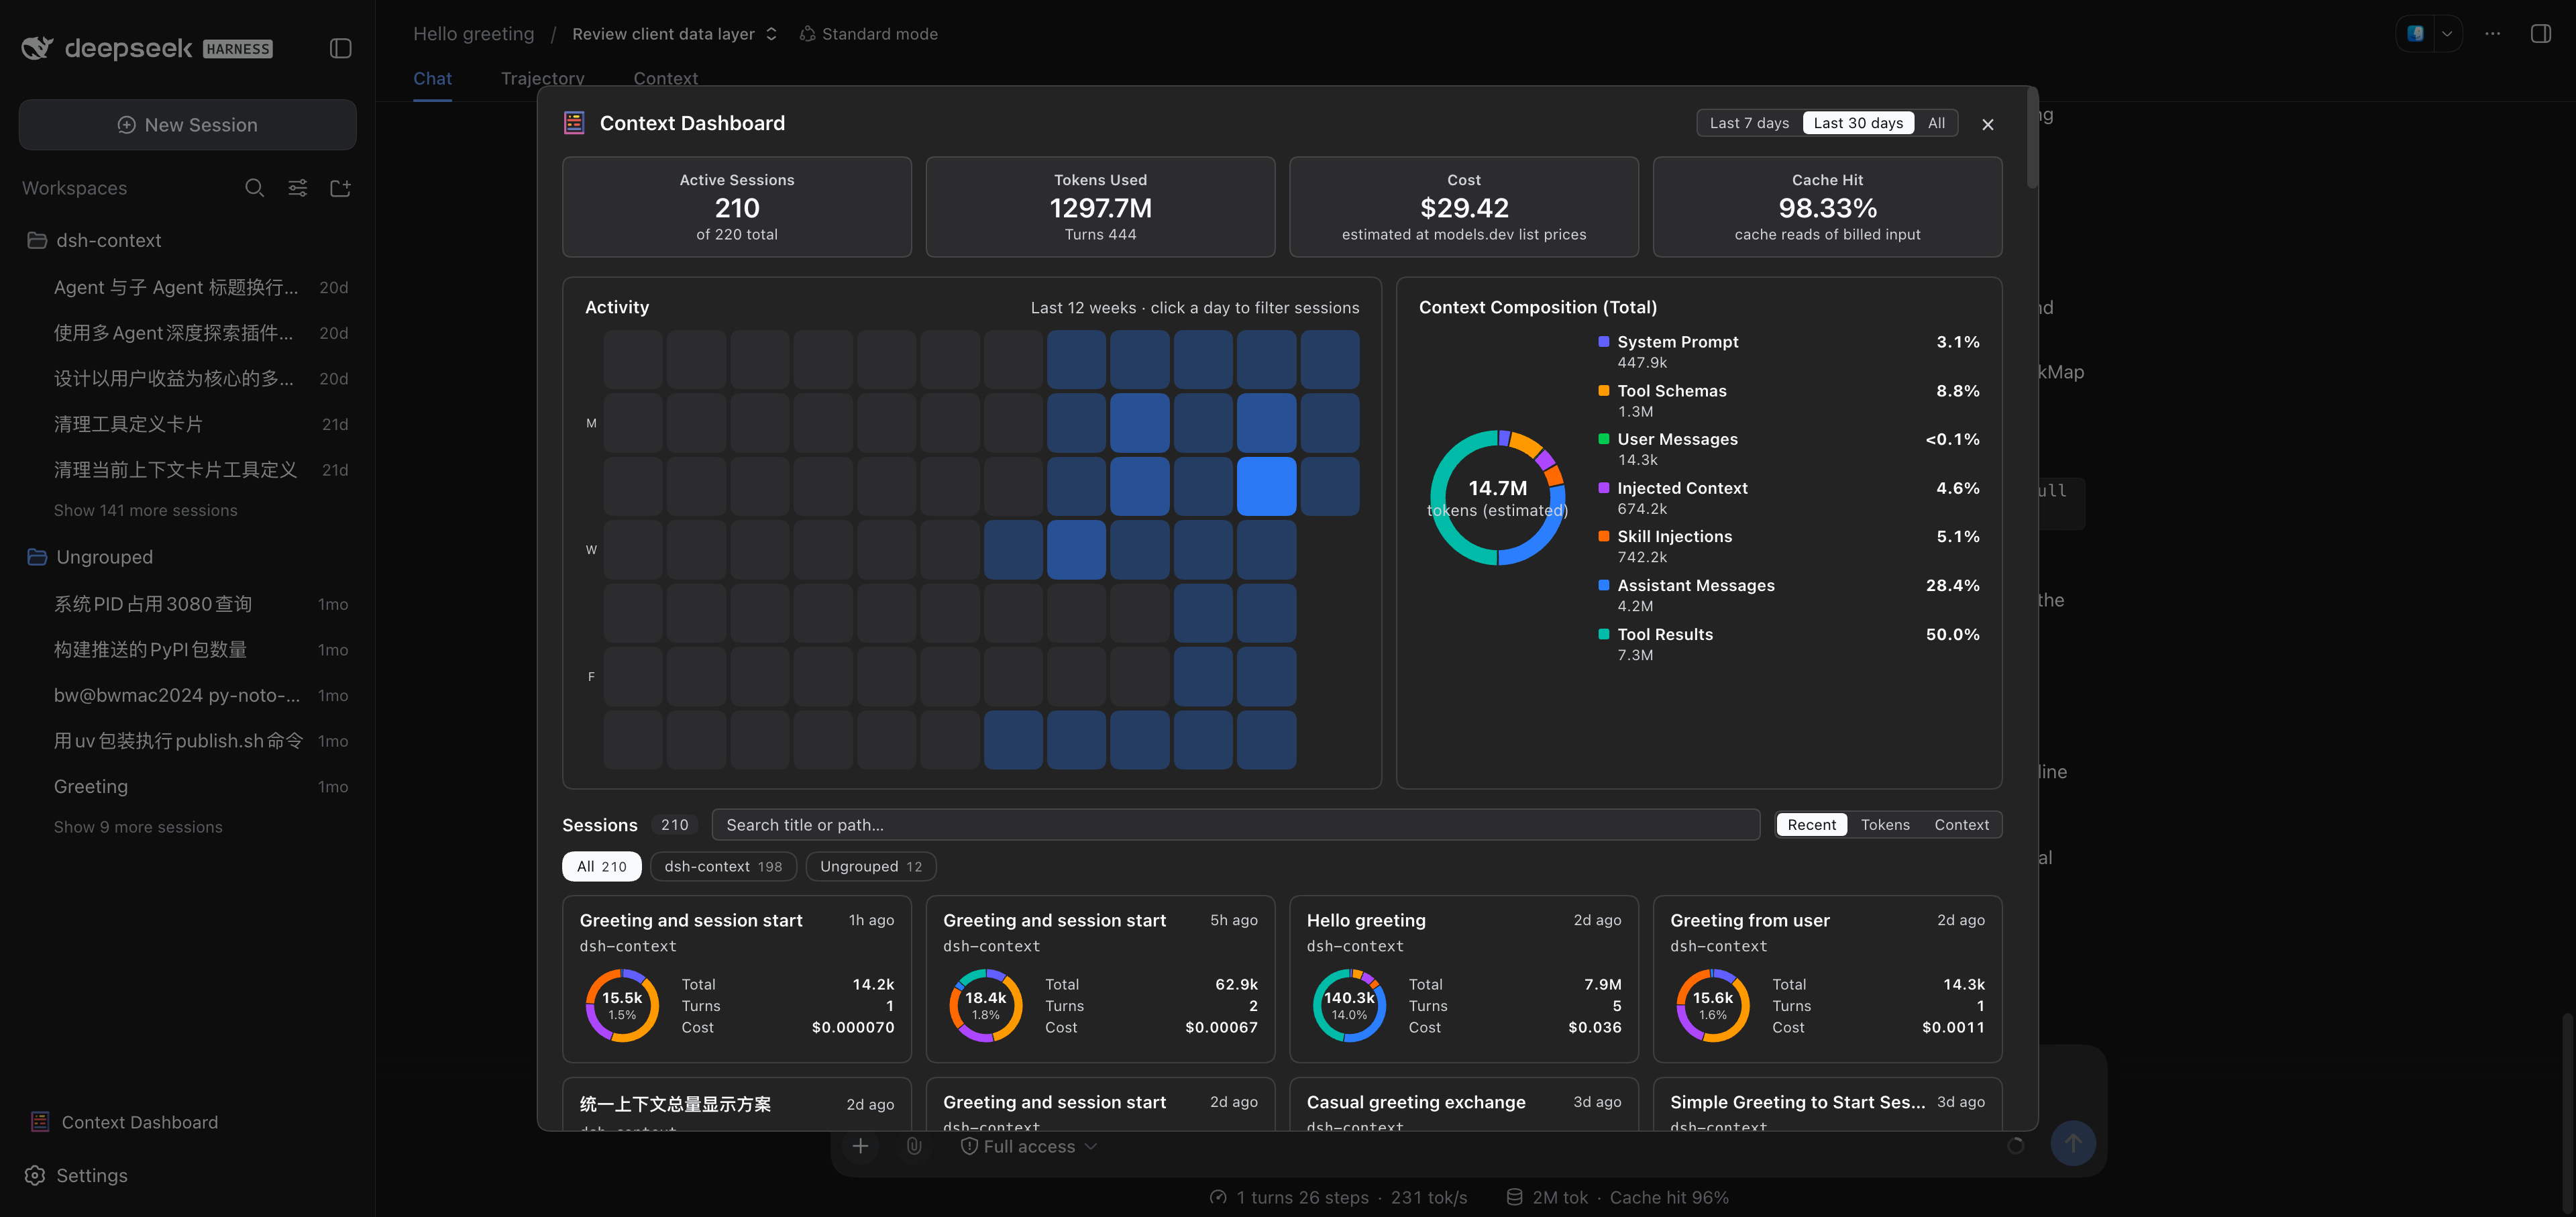
- **Context Dashboard** — the cross-session overview above Settings on the sidebar foot: KPI band, activity heatmap, aggregate composition ring, and filterable session cards that jump straight into any session.
|
|
12
13
|
- **Context tab** — an UI context dashboard for DeepSeek Harness's context stats, composition, trend, events, and messages.
|
|
13
14
|
- **Context panel** — the same dashboard as a right-sidebar tab (dsh 0.1.5-rc.1+): pick **Context** on the sidebar's guide page and the panel opens beside the chat.
|
|
14
15
|
- **`/context` command** — the slash command shows the context model for current context composition and recent context evolution.
|
|
@@ -31,14 +32,29 @@ Then start the web UI with `dsh web`. No build step, no restart.
|
|
|
31
32
|
|
|
32
33
|
## Use it
|
|
33
34
|
|
|
34
|
-
|
|
35
|
+
Four surfaces, one story — what your agent is carrying, how it got there, and what it did with it:
|
|
35
36
|
|
|
36
37
|
| Where | What you get |
|
|
37
38
|
| --- | --- |
|
|
39
|
+
| **Context Dashboard** | Every session at a glance: usage, cost, cache hit, daily activity, and per-session context profiles — filtered by range, day, group, or search, one click to jump in. |
|
|
38
40
|
| **Context tab** | The full dashboard: stats, composition, per-request trend, events, file activity, and the agent network — in every session. |
|
|
39
41
|
| **`/context` command** | A centered modal with the same composition and context browser, without leaving the chat. |
|
|
40
42
|
| **Settings → Plugin configuration** | Per-user defaults: trend granularity & mode, File Activity sort. |
|
|
41
43
|
|
|
44
|
+
## 🗂️ The Context Dashboard
|
|
45
|
+
|
|
46
|
+
Click **Context Dashboard / 上下文仪表盘** at the bottom-left of the sidebar, right above **Settings**:
|
|
47
|
+
|
|
48
|
+
|
|
49
|
+
|
|
50
|
+
| Section | The question it answers |
|
|
51
|
+
| --- | --- |
|
|
52
|
+
| **KPI band** | How much am I using — sessions, billed tokens, estimated cost, and cache-hit rate over the picked range (7d / 30d / all). |
|
|
53
|
+
| **Activity heatmap** | When do I actually work — the last 8 weeks of daily billed tokens; click a day to filter the sessions that were active on it. |
|
|
54
|
+
| **Context Composition** | Where the context windows went, summed over the range's sessions. |
|
|
55
|
+
| **Session cards** | Each session's profile: composition ring, billed tokens, turns, cost, and its workspace-group / project breadcrumb — sorted by recency, tokens, or context size, searchable, grouped by workspace. A card click opens the session. |
|
|
56
|
+
|
|
57
|
+
|
|
42
58
|
## 📊 The Context tab
|
|
43
59
|
|
|
44
60
|
Open any session and click the **Context / 上下文** tab:
|