dsh-context 0.38.0 → 0.38.1
This diff represents the content of publicly available package versions that have been released to one of the supported registries. The information contained in this diff is provided for informational purposes only and reflects changes between package versions as they appear in their respective public registries.
- package/README.md +69 -73
- package/lib/client.js +3 -3
- package/package.json +1 -1
package/README.md
CHANGED
|
@@ -9,7 +9,7 @@
|
|
|
9
9
|
**The best [DeepSeek Harness plugin](https://www.deepseek.com/harness/) for Agent's context insights and management.**
|
|
10
10
|
|
|
11
11
|
`dsh-context` provides full context lifecycle management features.
|
|
12
|
-
- **Context tab** — an UI context dashboard for DeepSeek Harness
|
|
12
|
+
- **Context tab** — an UI context dashboard for DeepSeek Harness's context stats, composition, trend, events, and messages.
|
|
13
13
|
- **`/context` command** — the slash command shows the context model for current context composition and recent context evolution.
|
|
14
14
|
|
|
15
15
|
## Install / Update
|
|
@@ -30,122 +30,118 @@ Then start the web UI with `dsh web`. No build step, no restart.
|
|
|
30
30
|
|
|
31
31
|
## Use it
|
|
32
32
|
|
|
33
|
-
|
|
33
|
+
Three surfaces, one story — what your agent is carrying, how it got there, and what it did with it:
|
|
34
34
|
|
|
35
|
-
|
|
36
|
-
|
|
37
|
-
|
|
38
|
-
|
|
39
|
-
|
|
40
|
-
|
|
41
|
-
Type `/context` (or pick it from the `/` menu) and press Enter: a centered dialog shows the **Current Composition** card and the **Context browser** — the same composition bar, legend, and per-step browsing as the tab, so you can inspect what any request was assembled from without leaving the chat.
|
|
35
|
+
| Where | What you get |
|
|
36
|
+
| --- | --- |
|
|
37
|
+
| **Context tab** | The full dashboard: stats, composition, per-request trend, events, file activity, and the agent network — in every session. |
|
|
38
|
+
| **`/context` command** | A centered modal with the same composition and context browser, without leaving the chat. |
|
|
39
|
+
| **Settings → Plugin configuration** | Per-user defaults: trend granularity & mode, File Activity sort. |
|
|
42
40
|
|
|
43
|
-
|
|
41
|
+
## 📊 The Context tab
|
|
44
42
|
|
|
45
|
-
|
|
46
|
-
|
|
47
|
-
### ⚙️ Settings — per-user preferences
|
|
48
|
-
|
|
49
|
-
In **Settings → Plugins → Plugin configuration**, the **Context / 上下文** card holds this plugin's per-user preferences — the **default trend granularity** (Step/Turn), the **default trend mode** (Total/Delta), and the **File Activity default sort** (Most active / Latest / By path) the Context tab opens with. In-chart and in-card toggling stays per-view and never overwrites the stored preference. The card appears only when the Host half is installed and the settings document is writable (a remote browser keeps settings process-local and shows no card).
|
|
50
|
-
|
|
51
|
-
## What you'll see
|
|
43
|
+
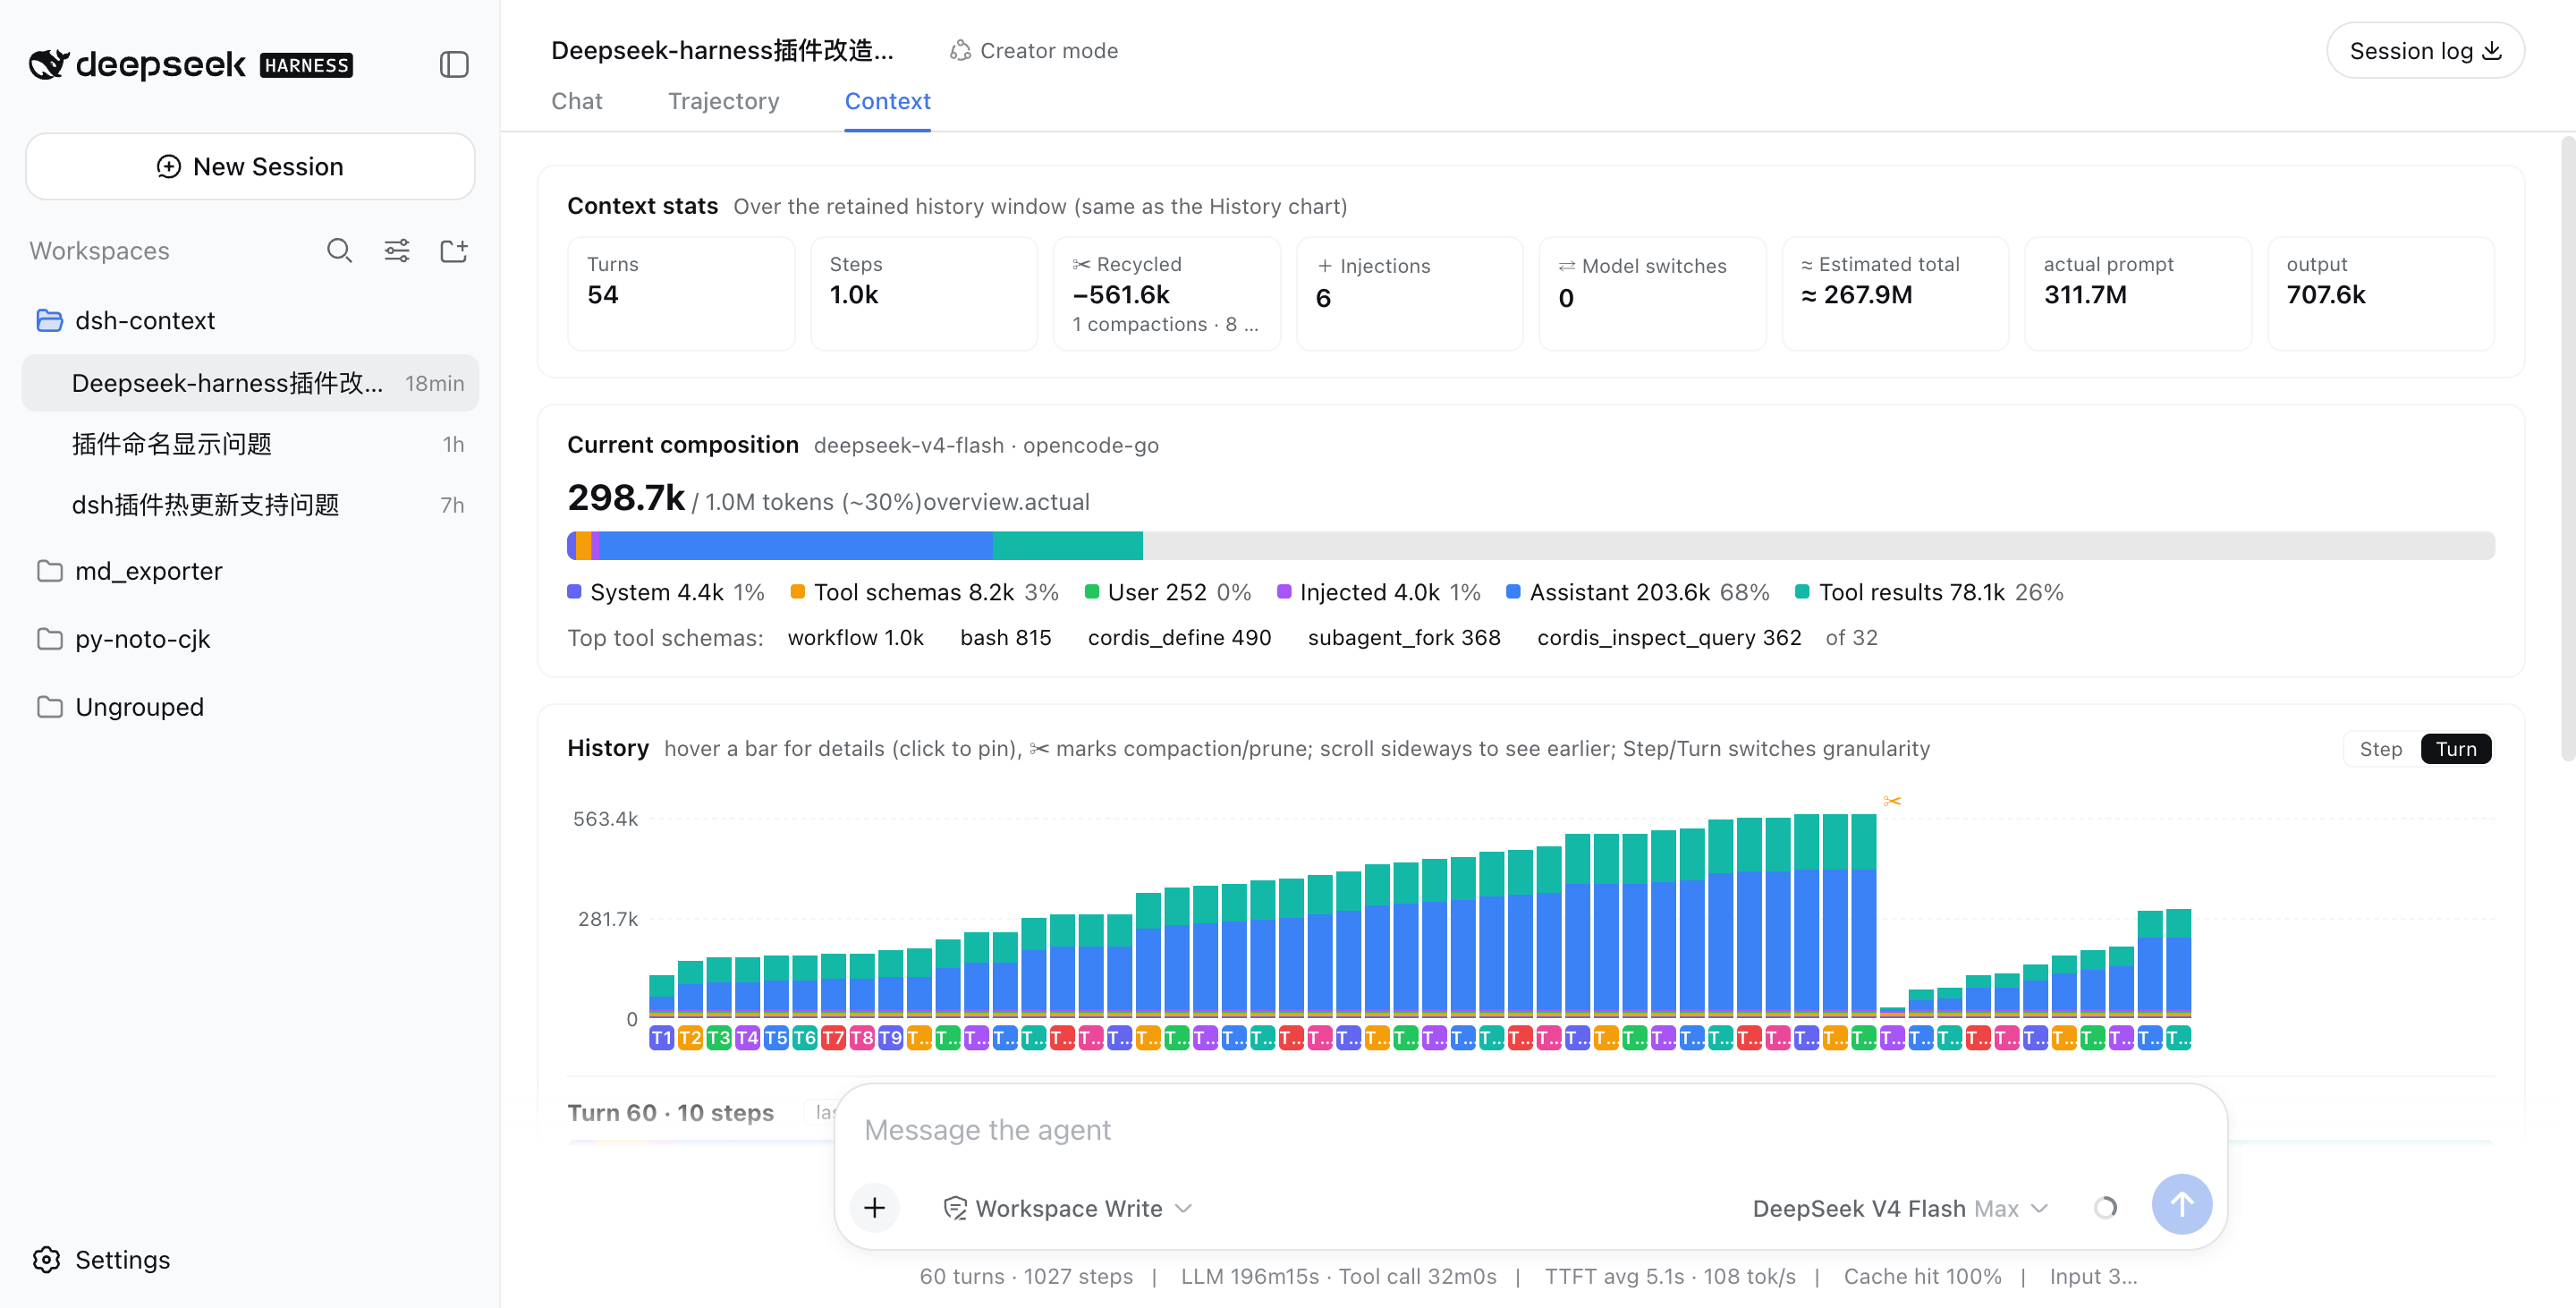
Open any session and click the **Context / 上下文** tab:
|
|
52
44
|
|
|
53
|
-
|
|
45
|
+
|
|
54
46
|
|
|
55
|
-
|
|
47
|
+
| Card | The question it answers |
|
|
48
|
+
| --- | --- |
|
|
49
|
+
| **Context Stats** | Turns, steps, live tool calls & images, context-event tallies — plus a list-price cost estimate (hover the `?` for per-1M rates). |
|
|
50
|
+
| **Token Stats** | Where the billed tokens went: cache read/write, uncached input, output — around the cache-hit ring. |
|
|
51
|
+
| **Timing Stats** | How active time split across model calls, tool runs, and overhead. |
|
|
52
|
+
| **Current Context** | What's in the window *right now*. |
|
|
53
|
+
| **Context Trend** | Every request's size — and its story. |
|
|
54
|
+
| **Context Browser** | What any request was *actually* assembled from. |
|
|
55
|
+
| **Context Events** | When and why the window changed. |
|
|
56
|
+
| **File Activity** | What the agent *did* to your files. |
|
|
57
|
+
| **Agent Network** | The whole agent family, live. |
|
|
56
58
|
|
|
57
|
-
|
|
58
|
-
- **Token Stats** — a ring of the provider-reported billing buckets (cache reads/writes, uncached input, output) around the cache-hit share.
|
|
59
|
-
- **Timing Stats** — a ring splitting the session's active time into model calls vs tool runs (the center shows the total).
|
|
59
|
+
The headline occupancy and composition read the **same official token-meter projections as the chat composer's context ring** (`contextPressure` / `contextBreakdown`), so the figures always match what the ring tells you.
|
|
60
60
|
|
|
61
|
-
### 🧱 Current
|
|
61
|
+
### 🧱 Current Context — who ate the budget
|
|
62
62
|
|
|
63
|
-
|
|
63
|
+

|
|
64
64
|
|
|
65
|
-
|
|
65
|
+
A six-color stacked bar against the model's full window (hatching = free headroom): system prompt, tool schemas, user messages, injected context, assistant replies, tool results — each with its ≈token figure and share. When a conversation starts degrading, this is where you see *which part* is responsible.
|
|
66
66
|
|
|
67
|
-
### 📈 Context Trend — every request
|
|
67
|
+
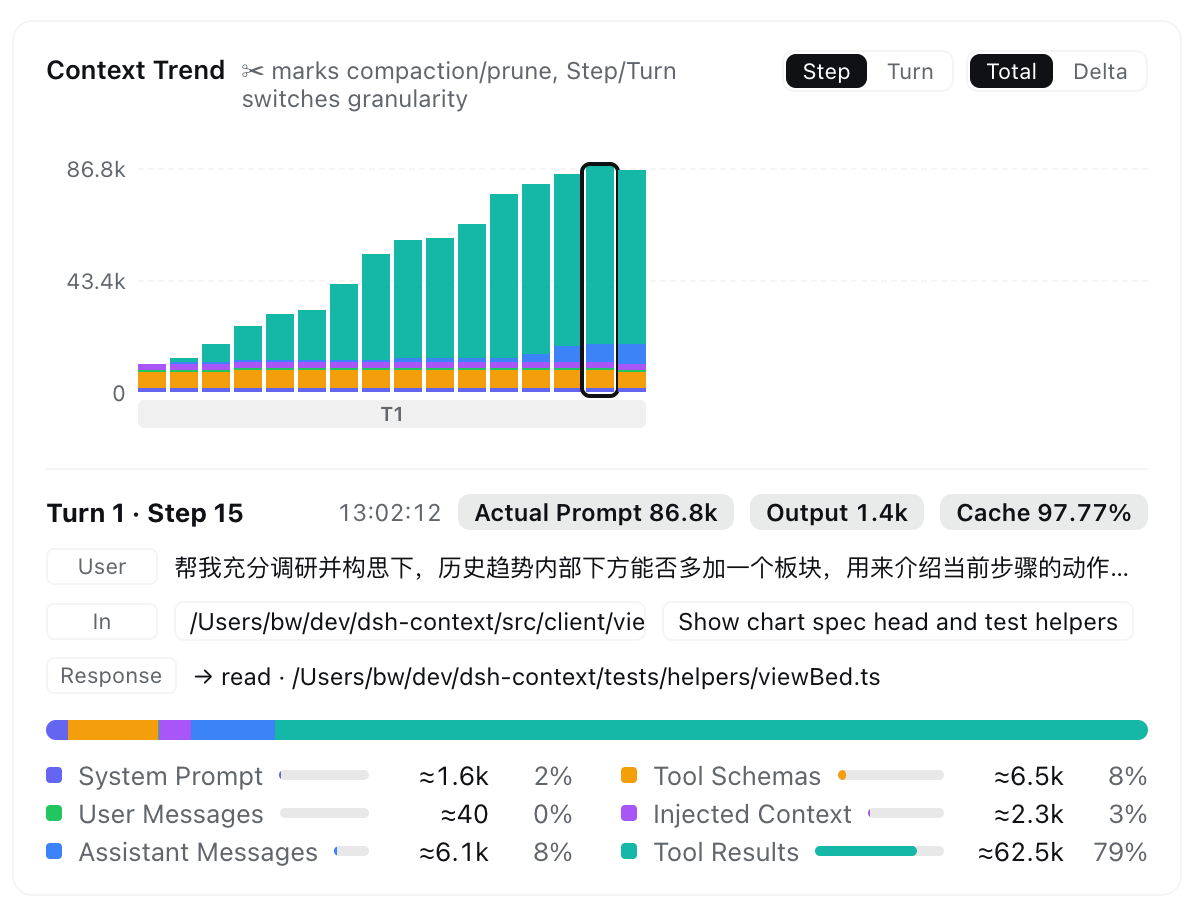
### 📈 Context Trend — every request, sized and explained
|
|
68
68
|
|
|
69
|
-
|
|
69
|
+
|
|
70
70
|
|
|
71
|
-
|
|
71
|
+
One stacked bar per model request — finer than per-message — so you watch the window grow turn by turn:
|
|
72
72
|
|
|
73
|
-
- **✨ Step brief —
|
|
74
|
-
-
|
|
75
|
-
- **
|
|
76
|
-
- **✂ marks the events** — compactions and prunes land exactly where they happened, so the bars' drops explain themselves.
|
|
77
|
-
- **Live linkage** — hovering a bar previews that step's assembled context in the Context browser beside the chart; leave the chart and it returns to your own pick.
|
|
73
|
+
- **✨ Step brief** — three plain-language rows under the chart: **User** recalls the message that opened the turn, **In** lists what newly entered (usually the previous tool results), **Response** shows the reply and/or tools called. Click a row to open that exact message in the Context browser.
|
|
74
|
+
- **✂ marks the events** — compactions and prunes are pinned to the bar where they happened, so the drops explain themselves.
|
|
75
|
+
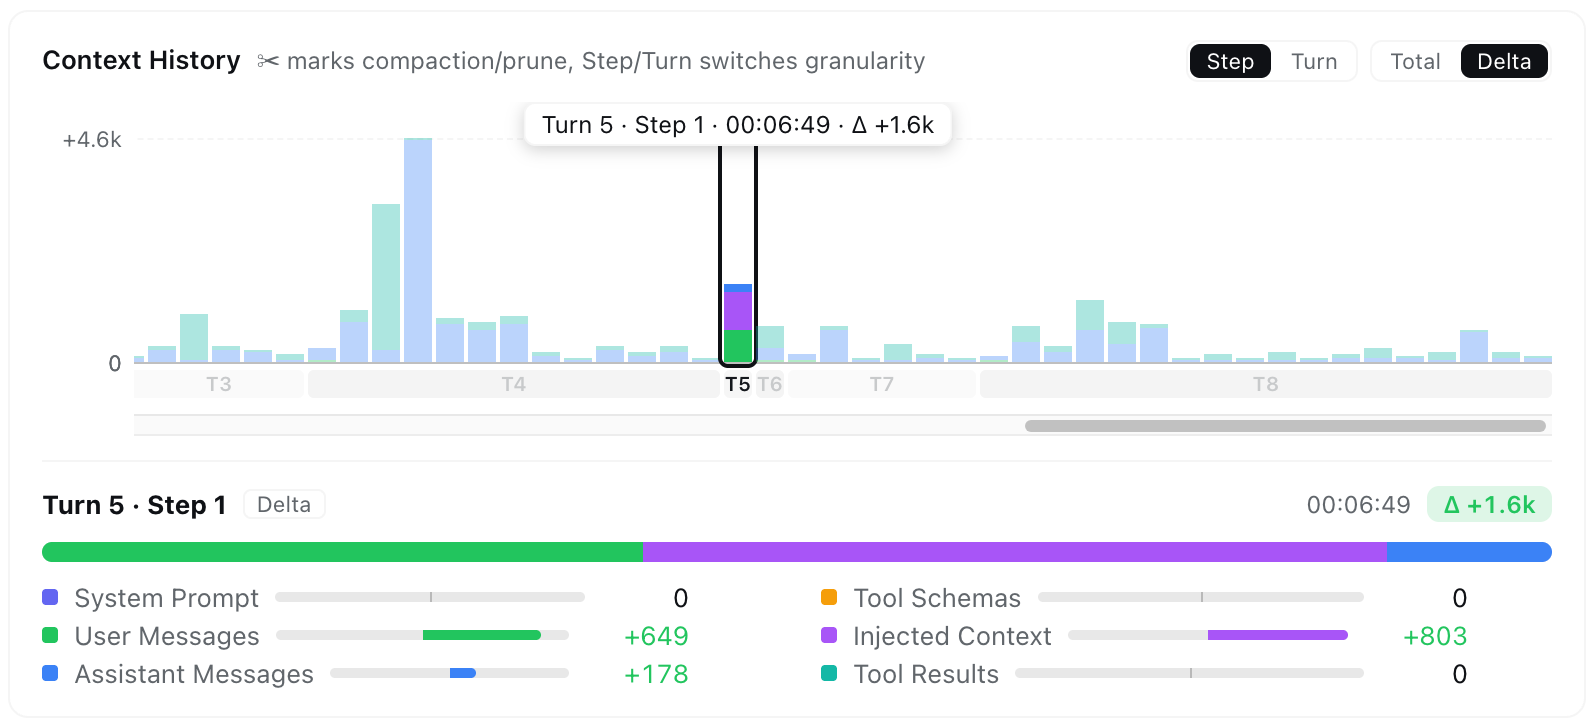
- **Read it your way** — **Step / Turn** granularity, **Total** (cumulative makeup) or **Delta** (each request's signed change), and sideways scrolling through the whole session. In Delta mode, growth piles up above the baseline and a compaction dives below it:
|
|
78
76
|
|
|
79
|
-
|
|
77
|
+
|
|
80
78
|
|
|
81
|
-
|
|
79
|
+
- **Hover & pin** — scrub for an instant tooltip; click to pin the full breakdown, with provider-reported **Actual Prompt / Output / Cache** next to the estimates.
|
|
80
|
+
- **Live linkage** — hovering a bar previews that step's assembled context in the Context browser beside the chart; leaving the chart returns to your own pick.
|
|
82
81
|
|
|
83
|
-
|
|
82
|
+
### 🧭 Context Browser — open the box of any request
|
|
84
83
|
|
|
85
|
-
|
|
84
|
+
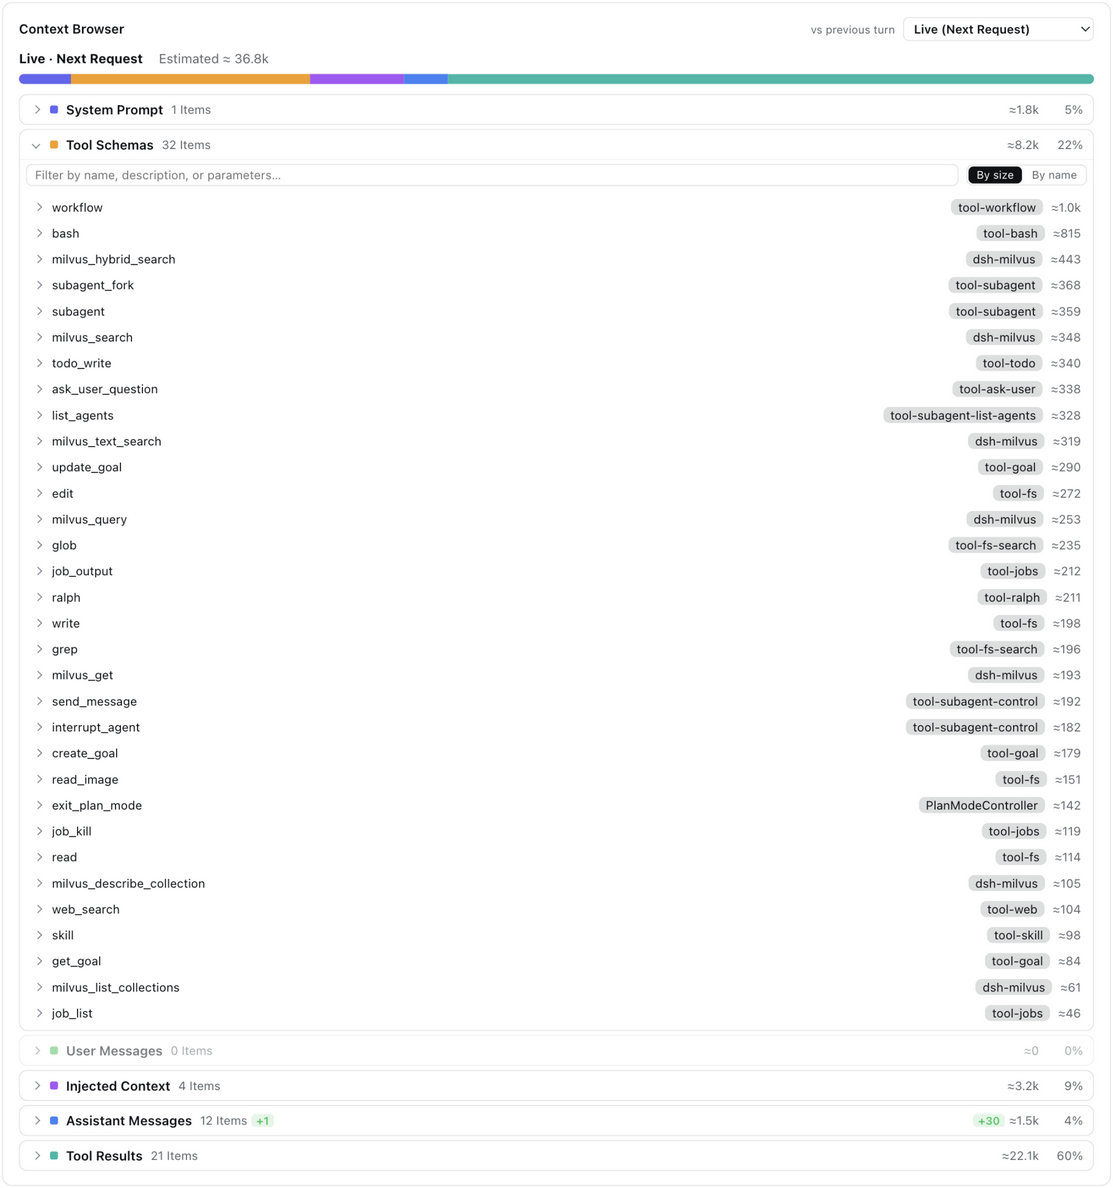
Pick **Live (next request)** or any retained step, and browse what that request was assembled from: six collapsible categories expand into one row per element with its token price, and every element expands again into its **actual content** — the system prompt, each tool's JSON schema, message text, reasoning, tool arguments, and tool outputs.
|
|
86
85
|
|
|
87
|
-
|
|
86
|
+
- **Who provides each tool** — every tool-schema row carries a best-effort source chip: `tool-*` first-party packages, `dsh-*` capability packages, `mcp:<server>` proxies, or the exact plugin watched live from `tools.register()`. Sort by **size / name**, and filter every category by its own searchable fields:
|
|
88
87
|
|
|
89
|
-
|
|
88
|
+
|
|
90
89
|
|
|
91
|
-
|
|
90
|
+
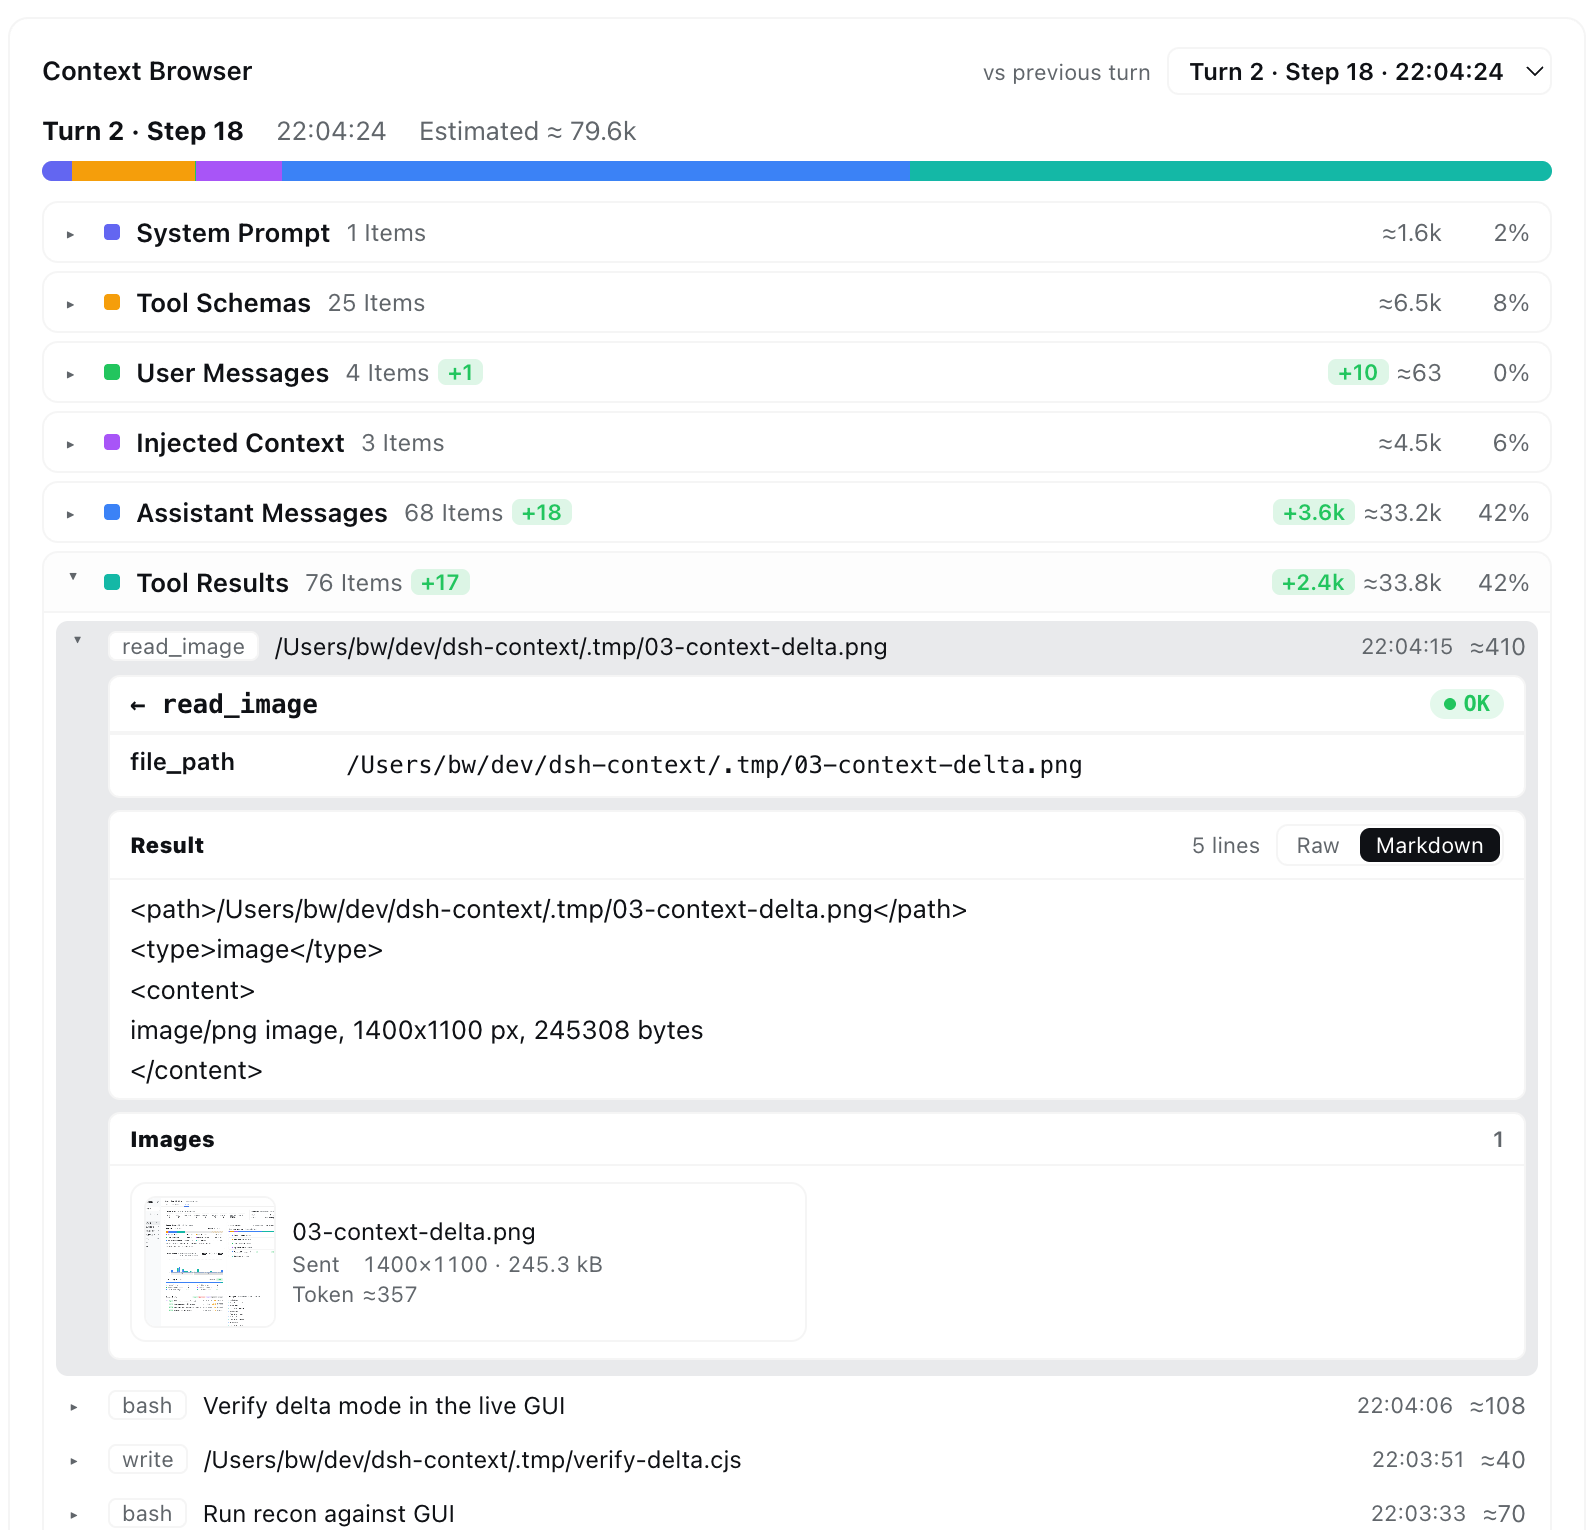
- **Tool results open into the full call** — the tool name and arguments with its **OK/error** status, the result body with line count and a **Raw / Markdown** toggle:
|
|
92
91
|
|
|
93
|
-
|
|
94
93
|
|
|
95
|
-
|
|
94
|
+
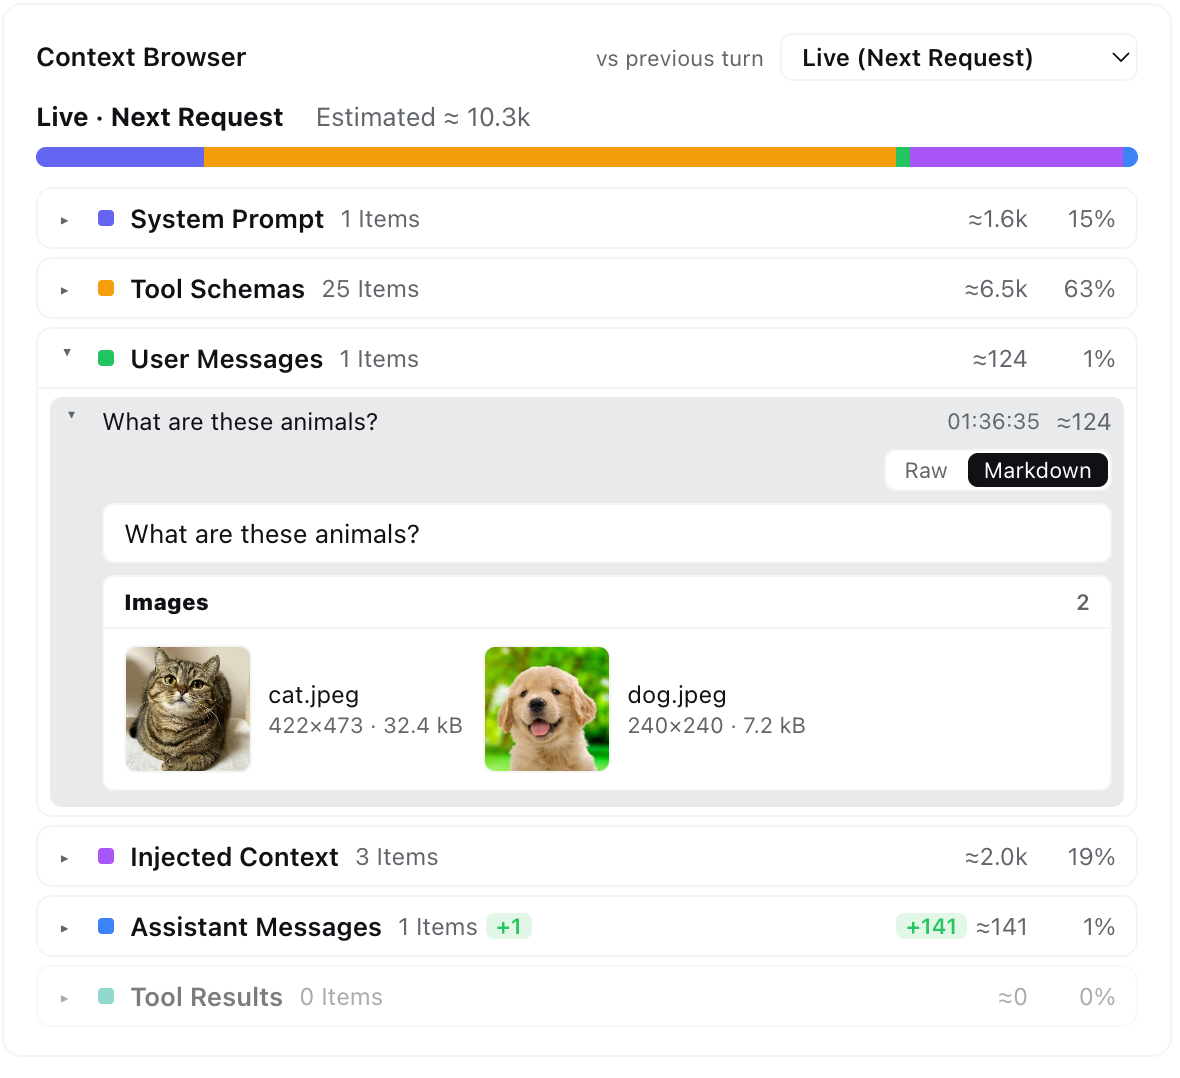
- **Image payloads render as cards** — thumbnails with name, dimensions, stored size, and the official DeepSeek image-token estimate (dsh 0.1.1+ multimodal pipeline, e.g. `read_image` results and image attachments):
|
|
96
95
|
|
|
97
|
-
|
|
96
|
+
|
|
98
97
|
|
|
99
|
-
|
|
98
|
+
- **Diff against the previous turn** — signed delta badges per category (`+N` items, `±Nk` tokens) tell you what a turn added or reclaimed at one glance. Steps older than a compaction are reconstructed from the removed-message archive — and the card says so when a step's makeup is only approximate.
|
|
100
99
|
|
|
101
|
-
|
|
102
|
-
- **Line deltas** — every `edit`/`write` contributes its estimated footprint (`+added / −removed`, read off the call arguments), per file and summed in the header.
|
|
103
|
-
- **Every mode counts** — native tool calls, the Minimal preset's `str_replace_editor`, and the nested `read`/`write`/`edit`/`grep`/`glob` calls a PTC (`run_code`) program makes are all folded: each nested call rows under its own tool, annotated with the program's description, and jumps to the parent `run_code` result.
|
|
104
|
-
- **Searches land on real files** — when a search result carries its matched-file list, the ops row per matched file with the hit count (pattern as detail); only a capped or unknown result falls back to the searched path/pattern itself.
|
|
105
|
-
- **Sorted your way** — **Most active**, **Latest**, or **By path**; each row carries per-purpose badges, its cumulative line delta, the last operation's time, and a red dot when an operation failed.
|
|
106
|
-
- **Click to inspect** — a row expands into the file's own operation log — every operation, no cap (tool, time, per-op delta, search detail, failures flagged); each operation jumps straight to the exact tool result in the Context browser.
|
|
100
|
+
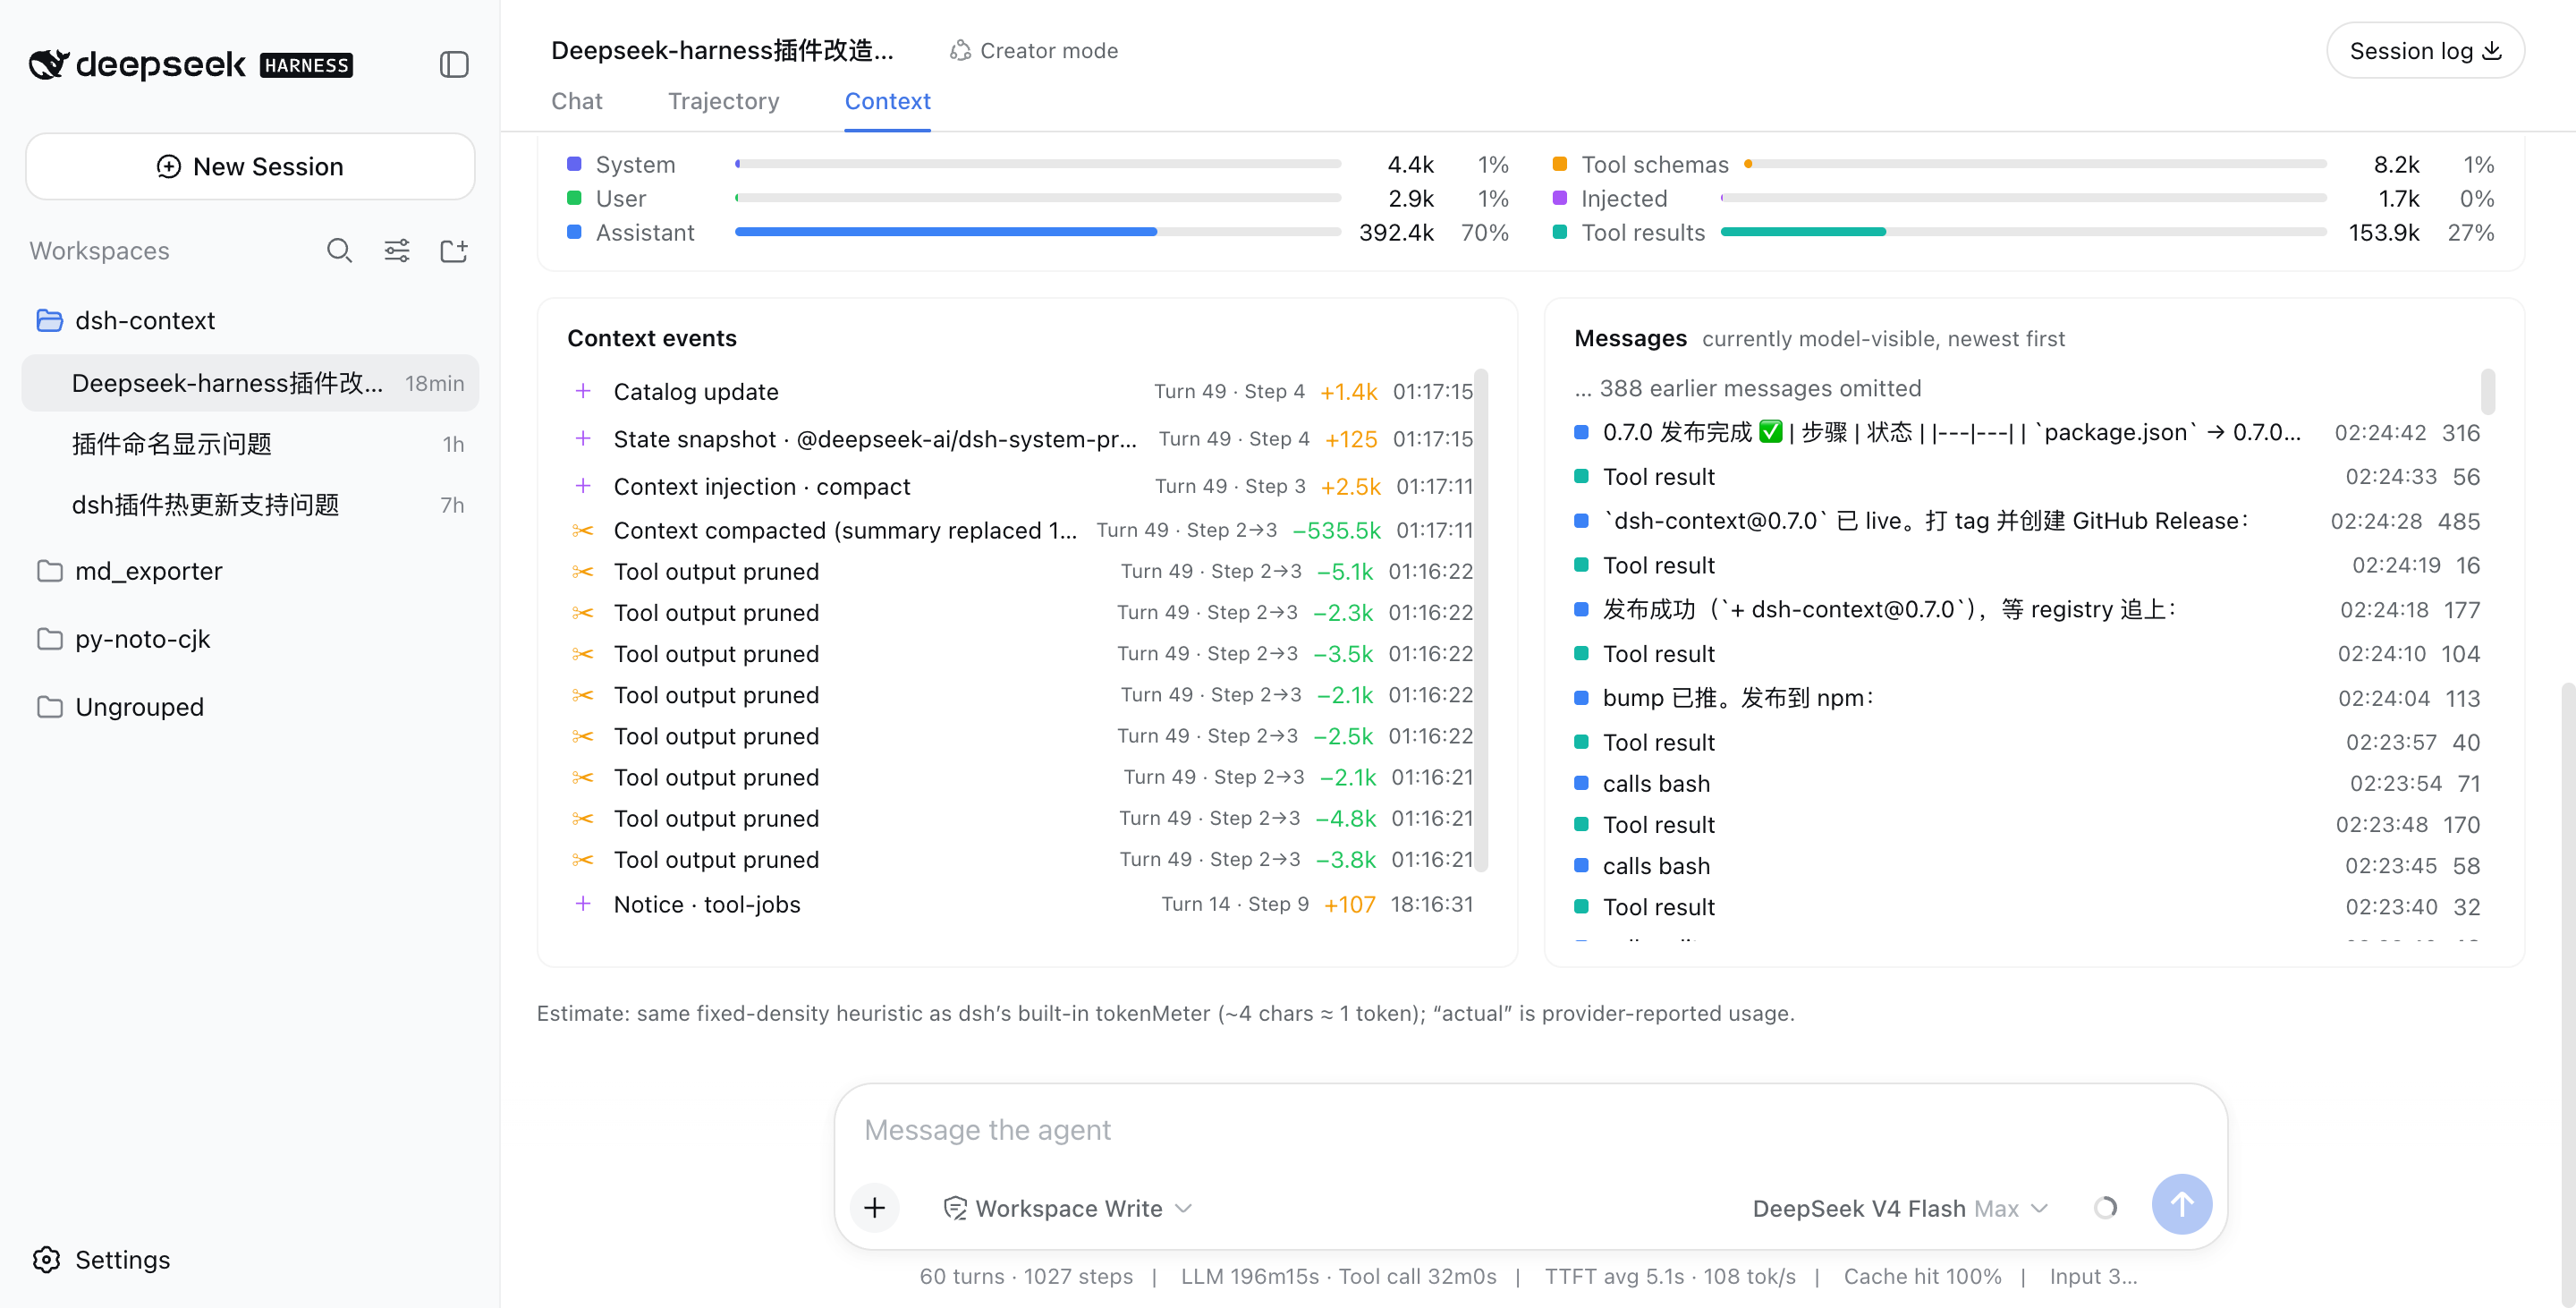
### ⚡ Context Events — when and why the window changed
|
|
107
101
|
|
|
108
|
-
|
|
102
|
+
|
|
109
103
|
|
|
110
|
-
|
|
104
|
+
Every injection, compaction, prune, model switch, and plan-mode toggle — labeled with its producer (instruction file, plugin id, skill name), its net token delta (compactions show what they reclaimed), turn/step, and time. The **Inject / Compact / Prune / Switch / Mode** chips filter the log by kind.
|
|
111
105
|
|
|
112
|
-
|
|
106
|
+
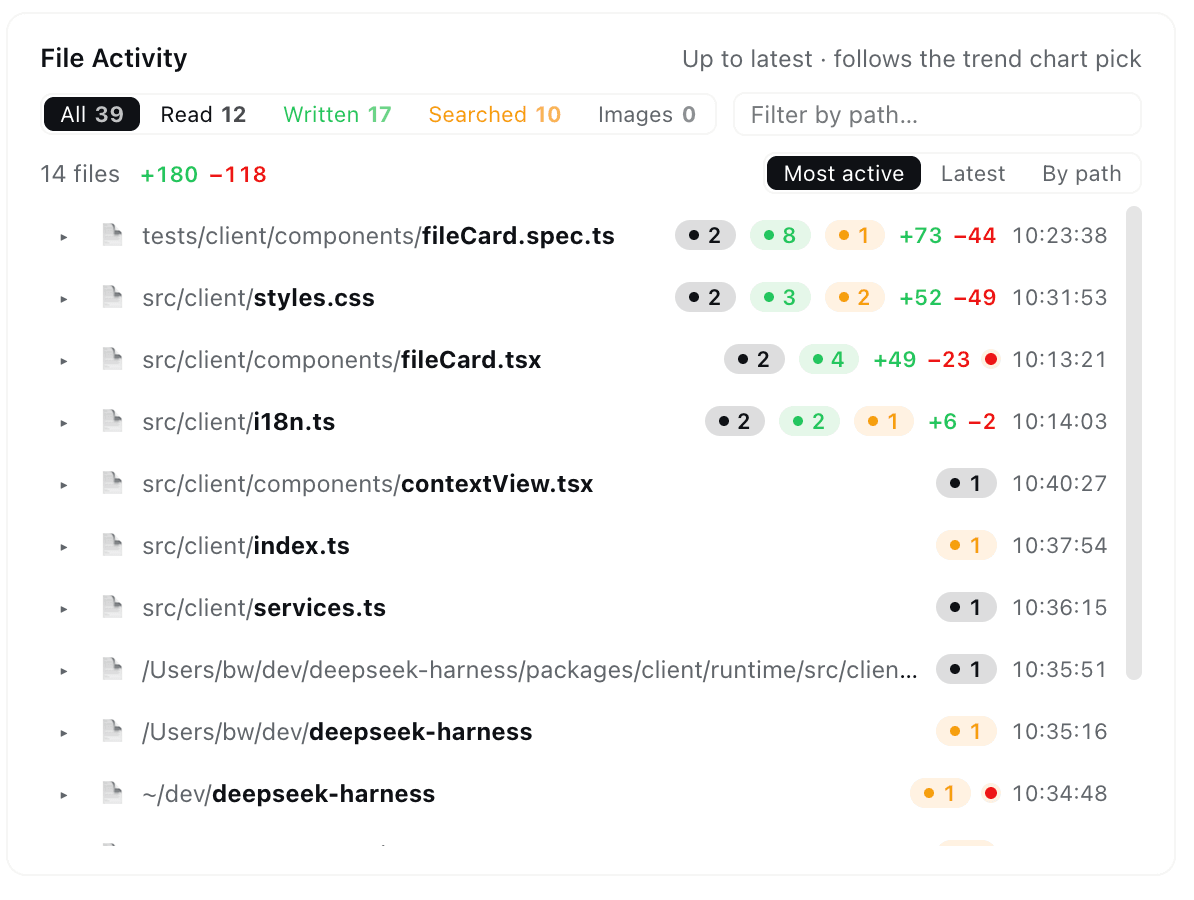
### 📁 File Activity — what the agent did to your files
|
|
113
107
|
|
|
114
|
-
|
|
115
|
-
- **Every node carries that agent's own context** — each ring is one session's composition (the same six categories and estimator as the overview card) scaled to its window occupancy, with the fill percentage at the center. Hover for the full story: name, one-shot / continuable mode, tokens and window, requests, billed, active time.
|
|
116
|
-
- **Click to jump** — any node opens that agent's session, so a subagent's own Context tab (trend, events, file activity, its own sub-network) is one click away. The layout adapts to the card's width, from a solo agent to an 18-agent clan.
|
|
108
|
+
|
|
117
109
|
|
|
118
|
-
|
|
110
|
+
One row per touched file — read, written, or searched — aggregated up to whichever step you pick on the trend chart:
|
|
119
111
|
|
|
120
|
-
|
|
112
|
+
- **Per-purpose counts** with header chips doubling as filters (**Read / Written / Searched / Images**) and a path search box.
|
|
113
|
+
- **Line deltas** — every `edit`/`write` contributes its estimated `+added / −removed` footprint, per file and summed.
|
|
114
|
+
- **Every mode counts** — native tools, the Minimal preset's `str_replace_editor`, and the nested calls inside PTC `run_code` programs are all folded into per-tool rows.
|
|
115
|
+
- **Searches land on real files** — matched files get their own ops rows with hit counts.
|
|
116
|
+
- **Click a row** to expand its full operation log — every op jumps straight to the exact tool result in the Context browser.
|
|
121
117
|
|
|
122
|
-
|
|
118
|
+
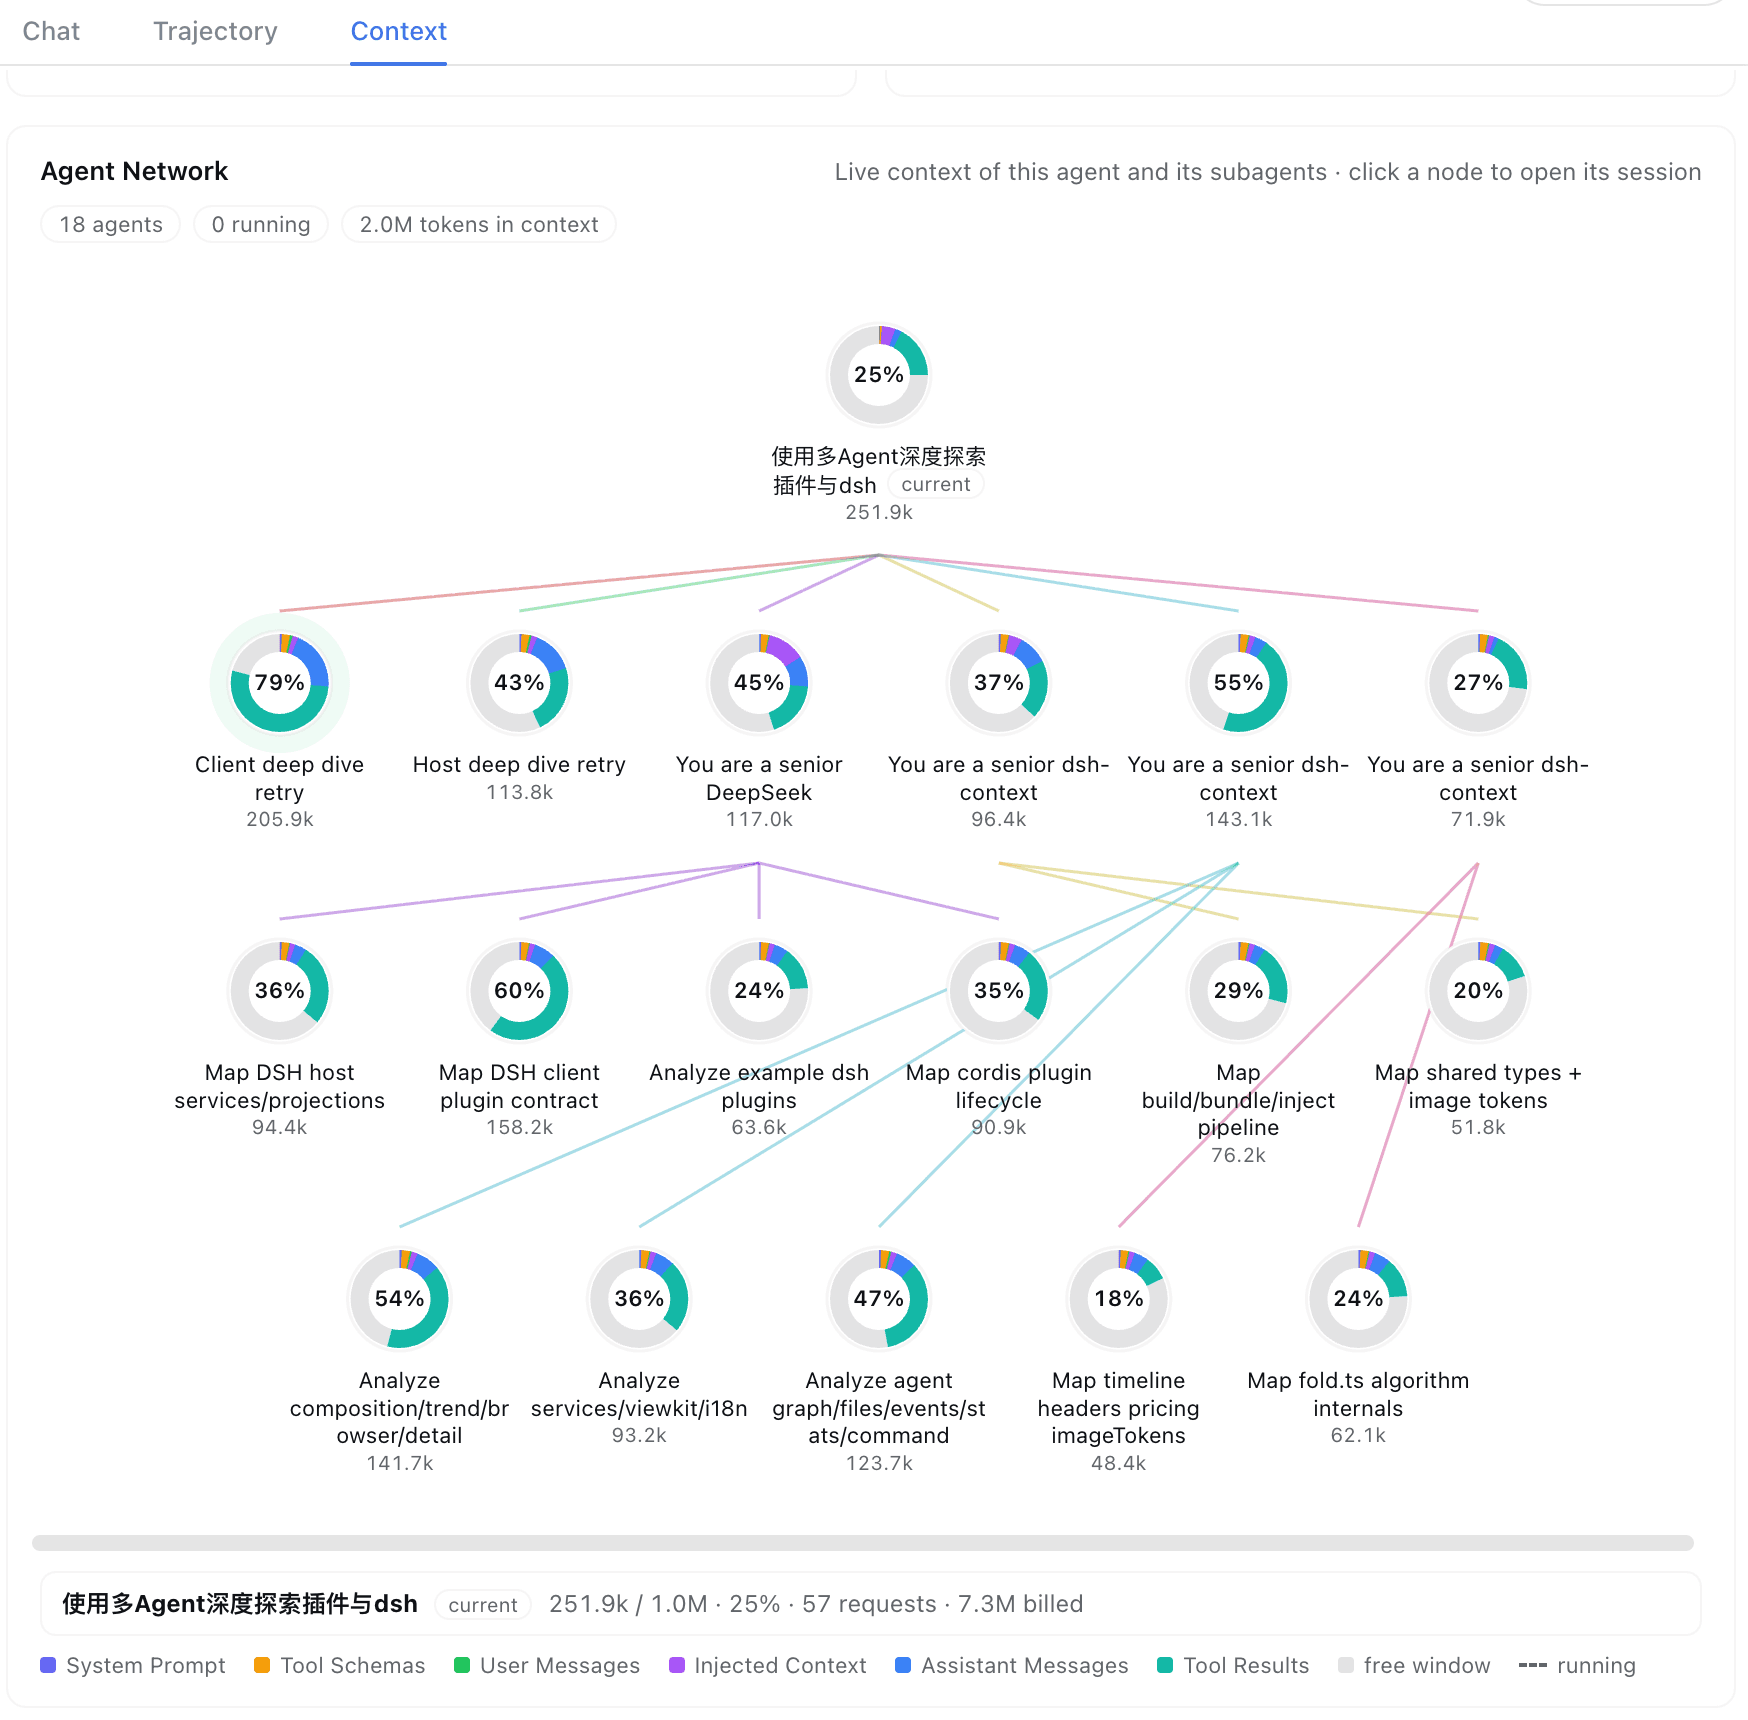
### 🕸 Agent Network — the family portrait
|
|
123
119
|
|
|
124
|
-
|
|
120
|
+
|
|
125
121
|
|
|
126
|
-
|
|
122
|
+
The current agent, its parents, and every subagent — one node per agent, colored edges for the lineage, multi-level delegation on one map. Each ring is that session's composition scaled to its window occupancy; hover for tokens, requests, billing, and active time; click to jump into that session's own Context tab. Running agents breathe with a green pulse.
|
|
127
123
|
|
|
128
|
-
|
|
124
|
+
## ⌨️ `/context` command
|
|
129
125
|
|
|
130
|
-
|
|
126
|
+
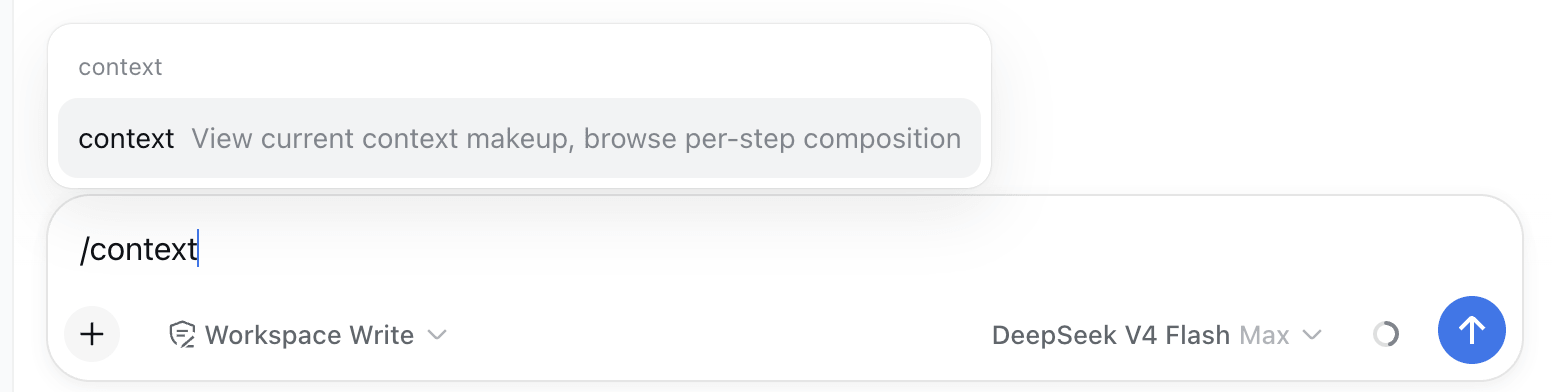
Type `/context` (or pick it from the `/` menu) and press Enter:
|
|
131
127
|
|
|
132
|
-
|
|
133
129
|
|
|
134
|
-
|
|
135
|
-
- **Honest about coverage** — steps before a compaction are reconstructed from the removed-message archive, and the card says so when a step's makeup is only approximate. Elements older than the loaded chat window page older history in automatically when you expand them, and live injections (AGENTS.md, session-start context, …) are always listed — never a token sum without its items.
|
|
136
|
-
- **Diff against the previous turn** — switch the picker to **vs previous turn** and every category gets signed delta badges (`+N` items, `+Nk` tokens), so one glance tells you what the conversation added since the end of the last turn.
|
|
130
|
+
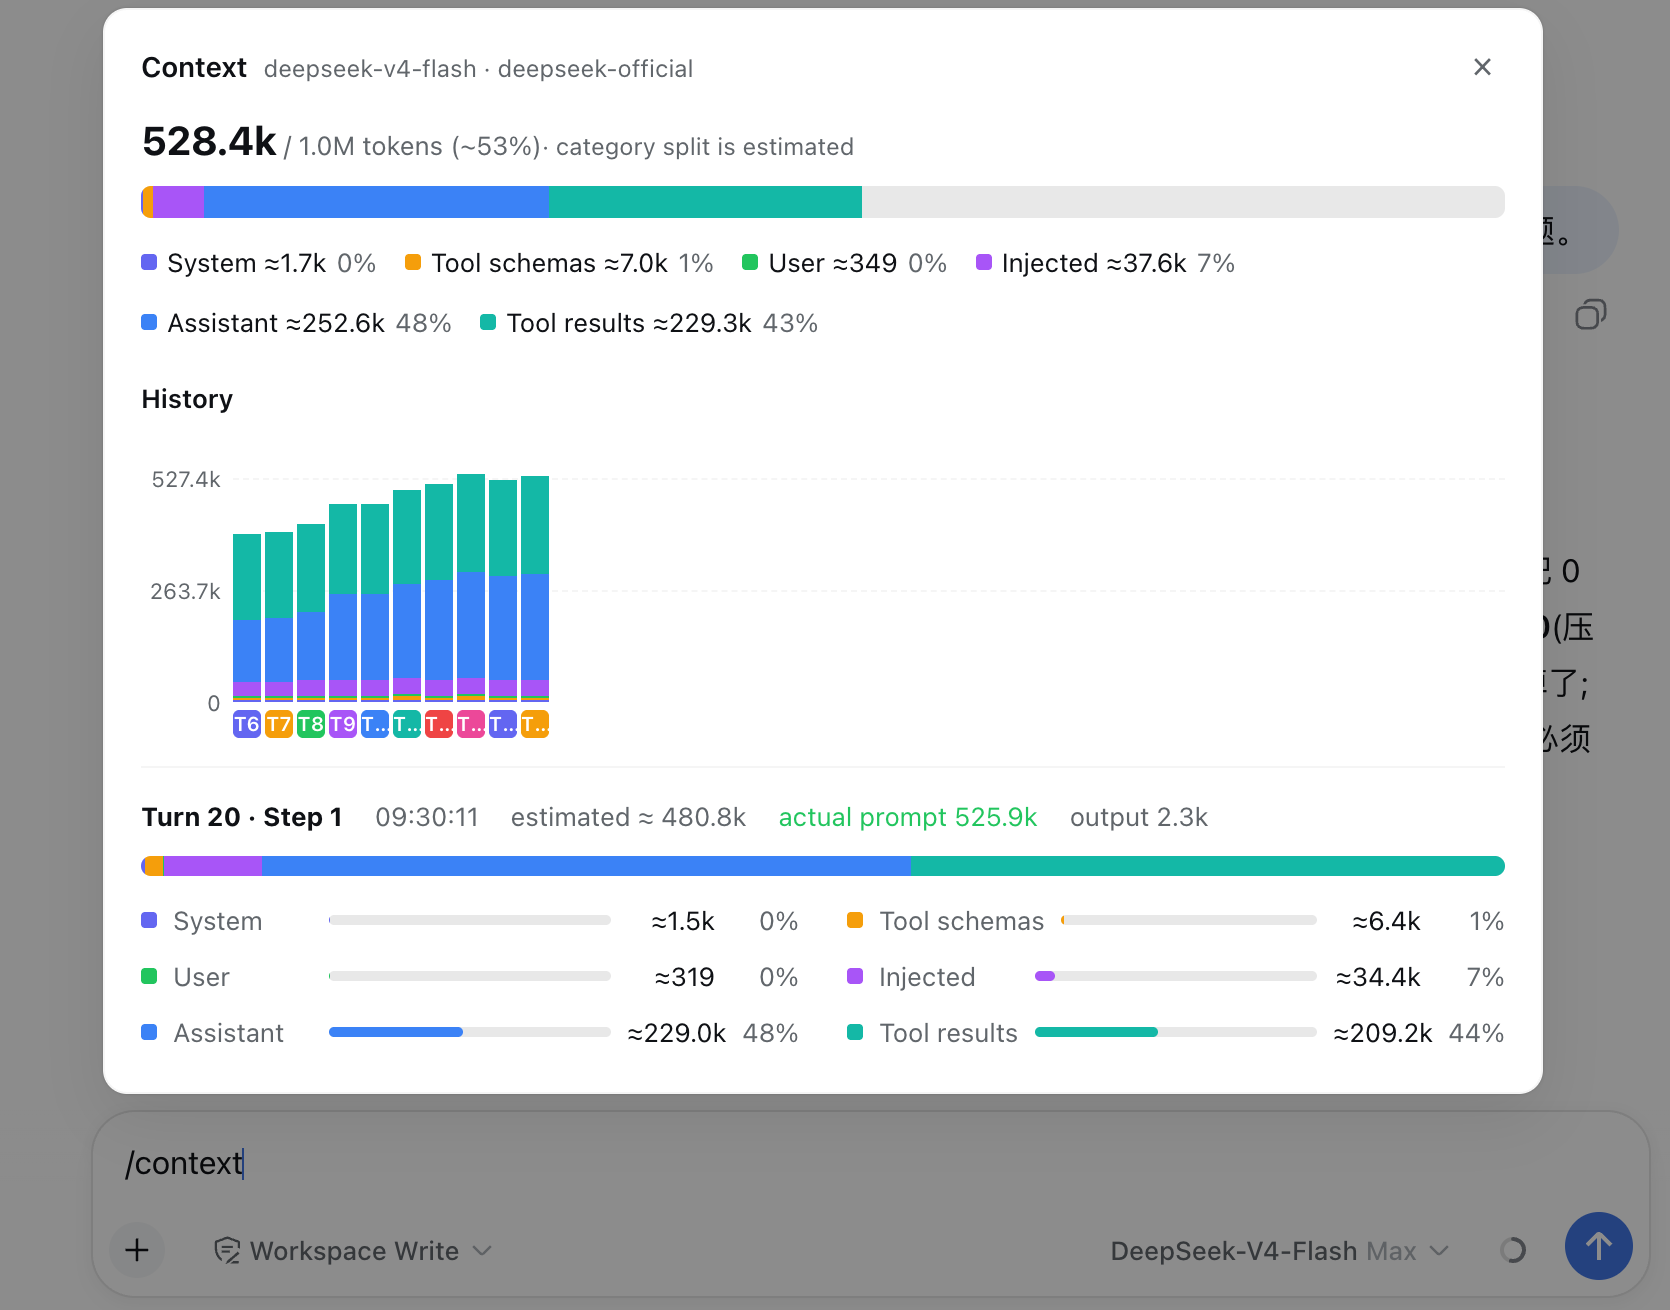
A centered dialog opens with the **Current Composition** card and the **Context browser** — the same composition bar, per-step picker, and `vs previous turn` diff badges as the tab:
|
|
137
131
|
|
|
138
|
-
|
|
132
|
+
|
|
139
133
|
|
|
140
|
-
|
|
134
|
+
## ⚙️ Settings
|
|
141
135
|
|
|
142
|
-
|
|
136
|
+
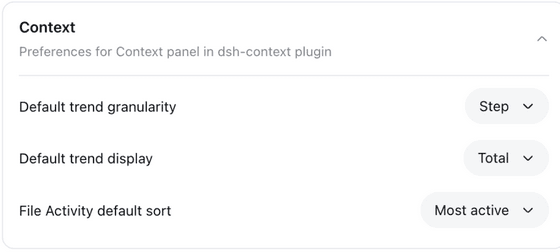
In **Settings → Plugins → Plugin configuration**, the **Context** card holds this plugin's per-user preferences — default trend granularity (Step/Turn), default trend mode (Total/Delta), and the File Activity default sort. In-chart and in-card toggles stay per-view and never overwrite the stored preference.
|
|
143
137
|
|
|
144
|
-
|
|
138
|
+
|
|
145
139
|
|
|
146
|
-
|
|
140
|
+
## Good to know
|
|
147
141
|
|
|
148
|
-
|
|
142
|
+
- **Estimates vs actuals** — category figures use dsh's own fixed-density heuristic (the same one as its built-in token meter); the pinned trend details and Token/Timing rings show provider-reported actuals next to them.
|
|
143
|
+
- **Compatibility** — works on `@deepseek-ai/dsh` **0.1.0-rc7+**, **0.1.1-rc2+**, and **0.1.2-alpha1+**; multimodal rendering requires 0.1.1+.
|
|
144
|
+
- **I18n** — UI in English and 简体中文.
|
|
149
145
|
|
|
150
146
|
## Like it?
|
|
151
147
|
|
package/lib/client.js
CHANGED
|
@@ -4794,7 +4794,7 @@ window.__ModuleLoader__.load({
|
|
|
4794
4794
|
return function PluginInfo() {
|
|
4795
4795
|
const [latest, setLatest] = React.useState(null);
|
|
4796
4796
|
React.useEffect(() => {
|
|
4797
|
-
if ("0.38.
|
|
4797
|
+
if ("0.38.1".includes("-dev")) return;
|
|
4798
4798
|
let on = true;
|
|
4799
4799
|
fetchLatestVersion().then((v) => {
|
|
4800
4800
|
if (on && v) setLatest(v);
|
|
@@ -4803,8 +4803,8 @@ window.__ModuleLoader__.load({
|
|
|
4803
4803
|
on = false;
|
|
4804
4804
|
};
|
|
4805
4805
|
}, []);
|
|
4806
|
-
const update = latest !== null && isNewerVersion(latest, "0.38.
|
|
4807
|
-
const nameValue = ["dsh-context (v0.38.
|
|
4806
|
+
const update = latest !== null && isNewerVersion(latest, "0.38.1") ? latest : null;
|
|
4807
|
+
const nameValue = ["dsh-context (v0.38.1)"];
|
|
4808
4808
|
if (update) nameValue.push(/* @__PURE__ */ React.createElement("span", {
|
|
4809
4809
|
key: "update",
|
|
4810
4810
|
className: "lc-pi-update"
|
package/package.json
CHANGED
|
@@ -1,6 +1,6 @@
|
|
|
1
1
|
{
|
|
2
2
|
"name": "dsh-context",
|
|
3
|
-
"version": "0.38.
|
|
3
|
+
"version": "0.38.1",
|
|
4
4
|
"description": "A DeepSeek Harness plugin for context insight and management, with context dashboard and context command, for understanding how the context is made of, and how it evolves.",
|
|
5
5
|
"author": "bowenliang123",
|
|
6
6
|
"repository": {
|