dsh-context 0.32.0 → 0.34.0
This diff represents the content of publicly available package versions that have been released to one of the supported registries. The information contained in this diff is provided for informational purposes only and reflects changes between package versions as they appear in their respective public registries.
- package/README.md +21 -4
- package/lib/client.js +1532 -258
- package/lib/index.d.ts +0 -8
- package/lib/index.js +14 -17
- package/package.json +8 -3
package/README.md
CHANGED
|
@@ -46,7 +46,7 @@ Type `/context` (or pick it from the `/` menu) and press Enter: a centered dialo
|
|
|
46
46
|
|
|
47
47
|
### ⚙️ Settings — per-user preferences
|
|
48
48
|
|
|
49
|
-
In **Settings → Plugins → Plugin configuration**, the **Context / 上下文** card holds this plugin's per-user preferences — the **default trend granularity** (Step/Turn)
|
|
49
|
+
In **Settings → Plugins → Plugin configuration**, the **Context / 上下文** card holds this plugin's per-user preferences — the **default trend granularity** (Step/Turn), the **default trend mode** (Total/Delta), and the **File Activity default sort** (Most active / Latest / By path) the Context tab opens with. In-chart and in-card toggling stays per-view and never overwrites the stored preference. The card appears only when the Host half is installed and the settings document is writable (a remote browser keeps settings process-local and shows no card).
|
|
50
50
|
|
|
51
51
|
## What you'll see
|
|
52
52
|
|
|
@@ -66,7 +66,7 @@ One stacked bar per model request — finer than per-message — so you watch th
|
|
|
66
66
|
|
|
67
67
|
|
|
68
68
|
|
|
69
|
-
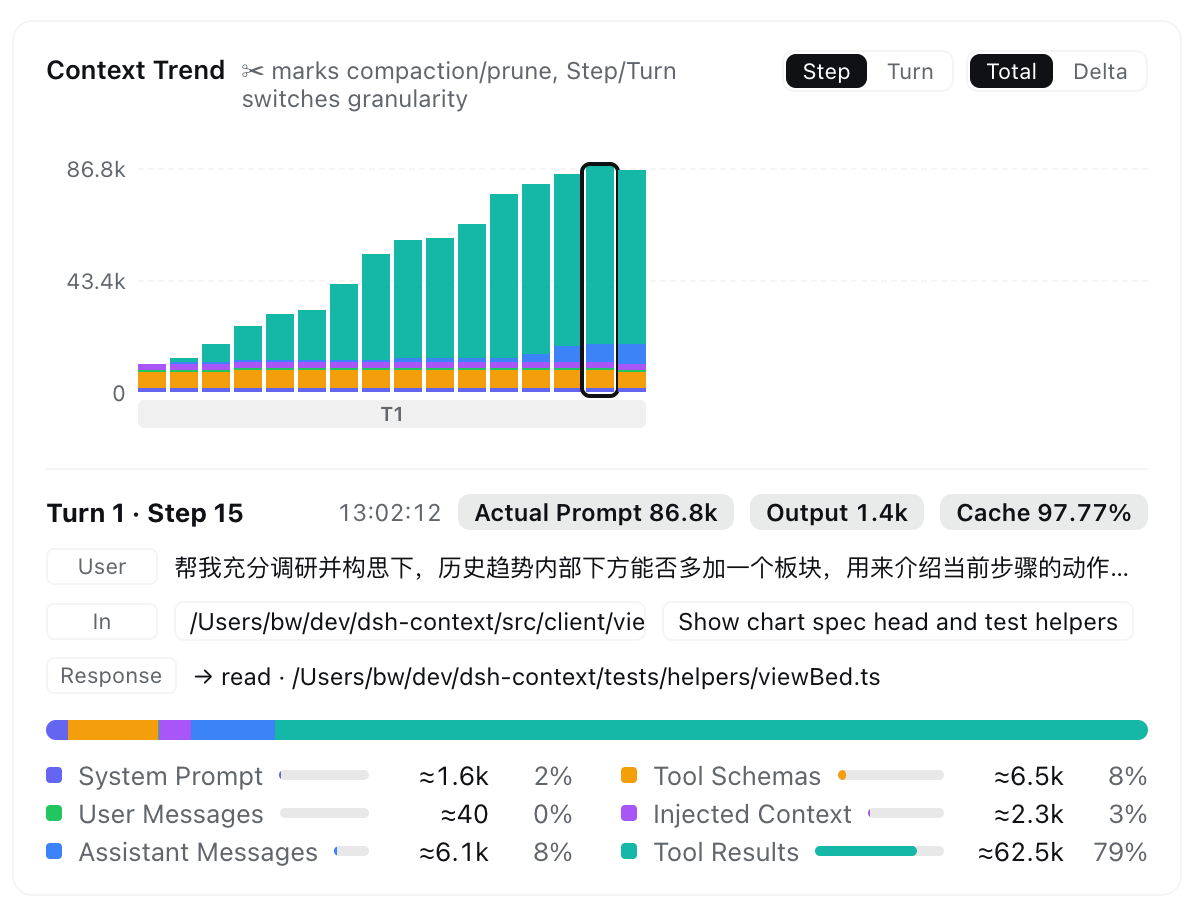
- **✨ Step brief — what a step *was*, not just how big.** Three plain-language rows under the chart: **User** recalls the message that opened the turn (on any of its steps), **In** lists what newly entered the context — usually the previous tool calls' results, failures flagged — and **Response** shows what the model returned: its reply text and/or the tools it called. Hover a row's tag to learn what the row means; click any row to open that exact message in the Context browser.
|
|
69
|
+
- **✨ Step brief — what a step *was*, not just how big.** Three plain-language rows under the chart: **User** recalls the message that opened the turn (on any of its steps), **In** lists what newly entered the context — usually the previous tool calls' results, failures flagged, empty on a turn's opening step — and **Response** shows what the model returned: its reply text and/or the tools it called. Hover a row's tag to learn what the row means; click any row to open that exact message in the Context browser.
|
|
70
70
|
- **Read it your way** — **Step** or **Turn** granularity, **Total** (cumulative makeup) or **Delta** (each request's signed change), and sideways scroll through the whole session.
|
|
71
71
|
- **Hover & pin** — scrub for an instant tooltip (turn/step, time, tokens, a one-line reply preview); click to pin the full category breakdown, with provider-reported actual prompt/output/cache figures next to the estimates.
|
|
72
72
|
- **✂ marks the events** — compactions and prunes land exactly where they happened, so the bars' drops explain themselves.
|
|
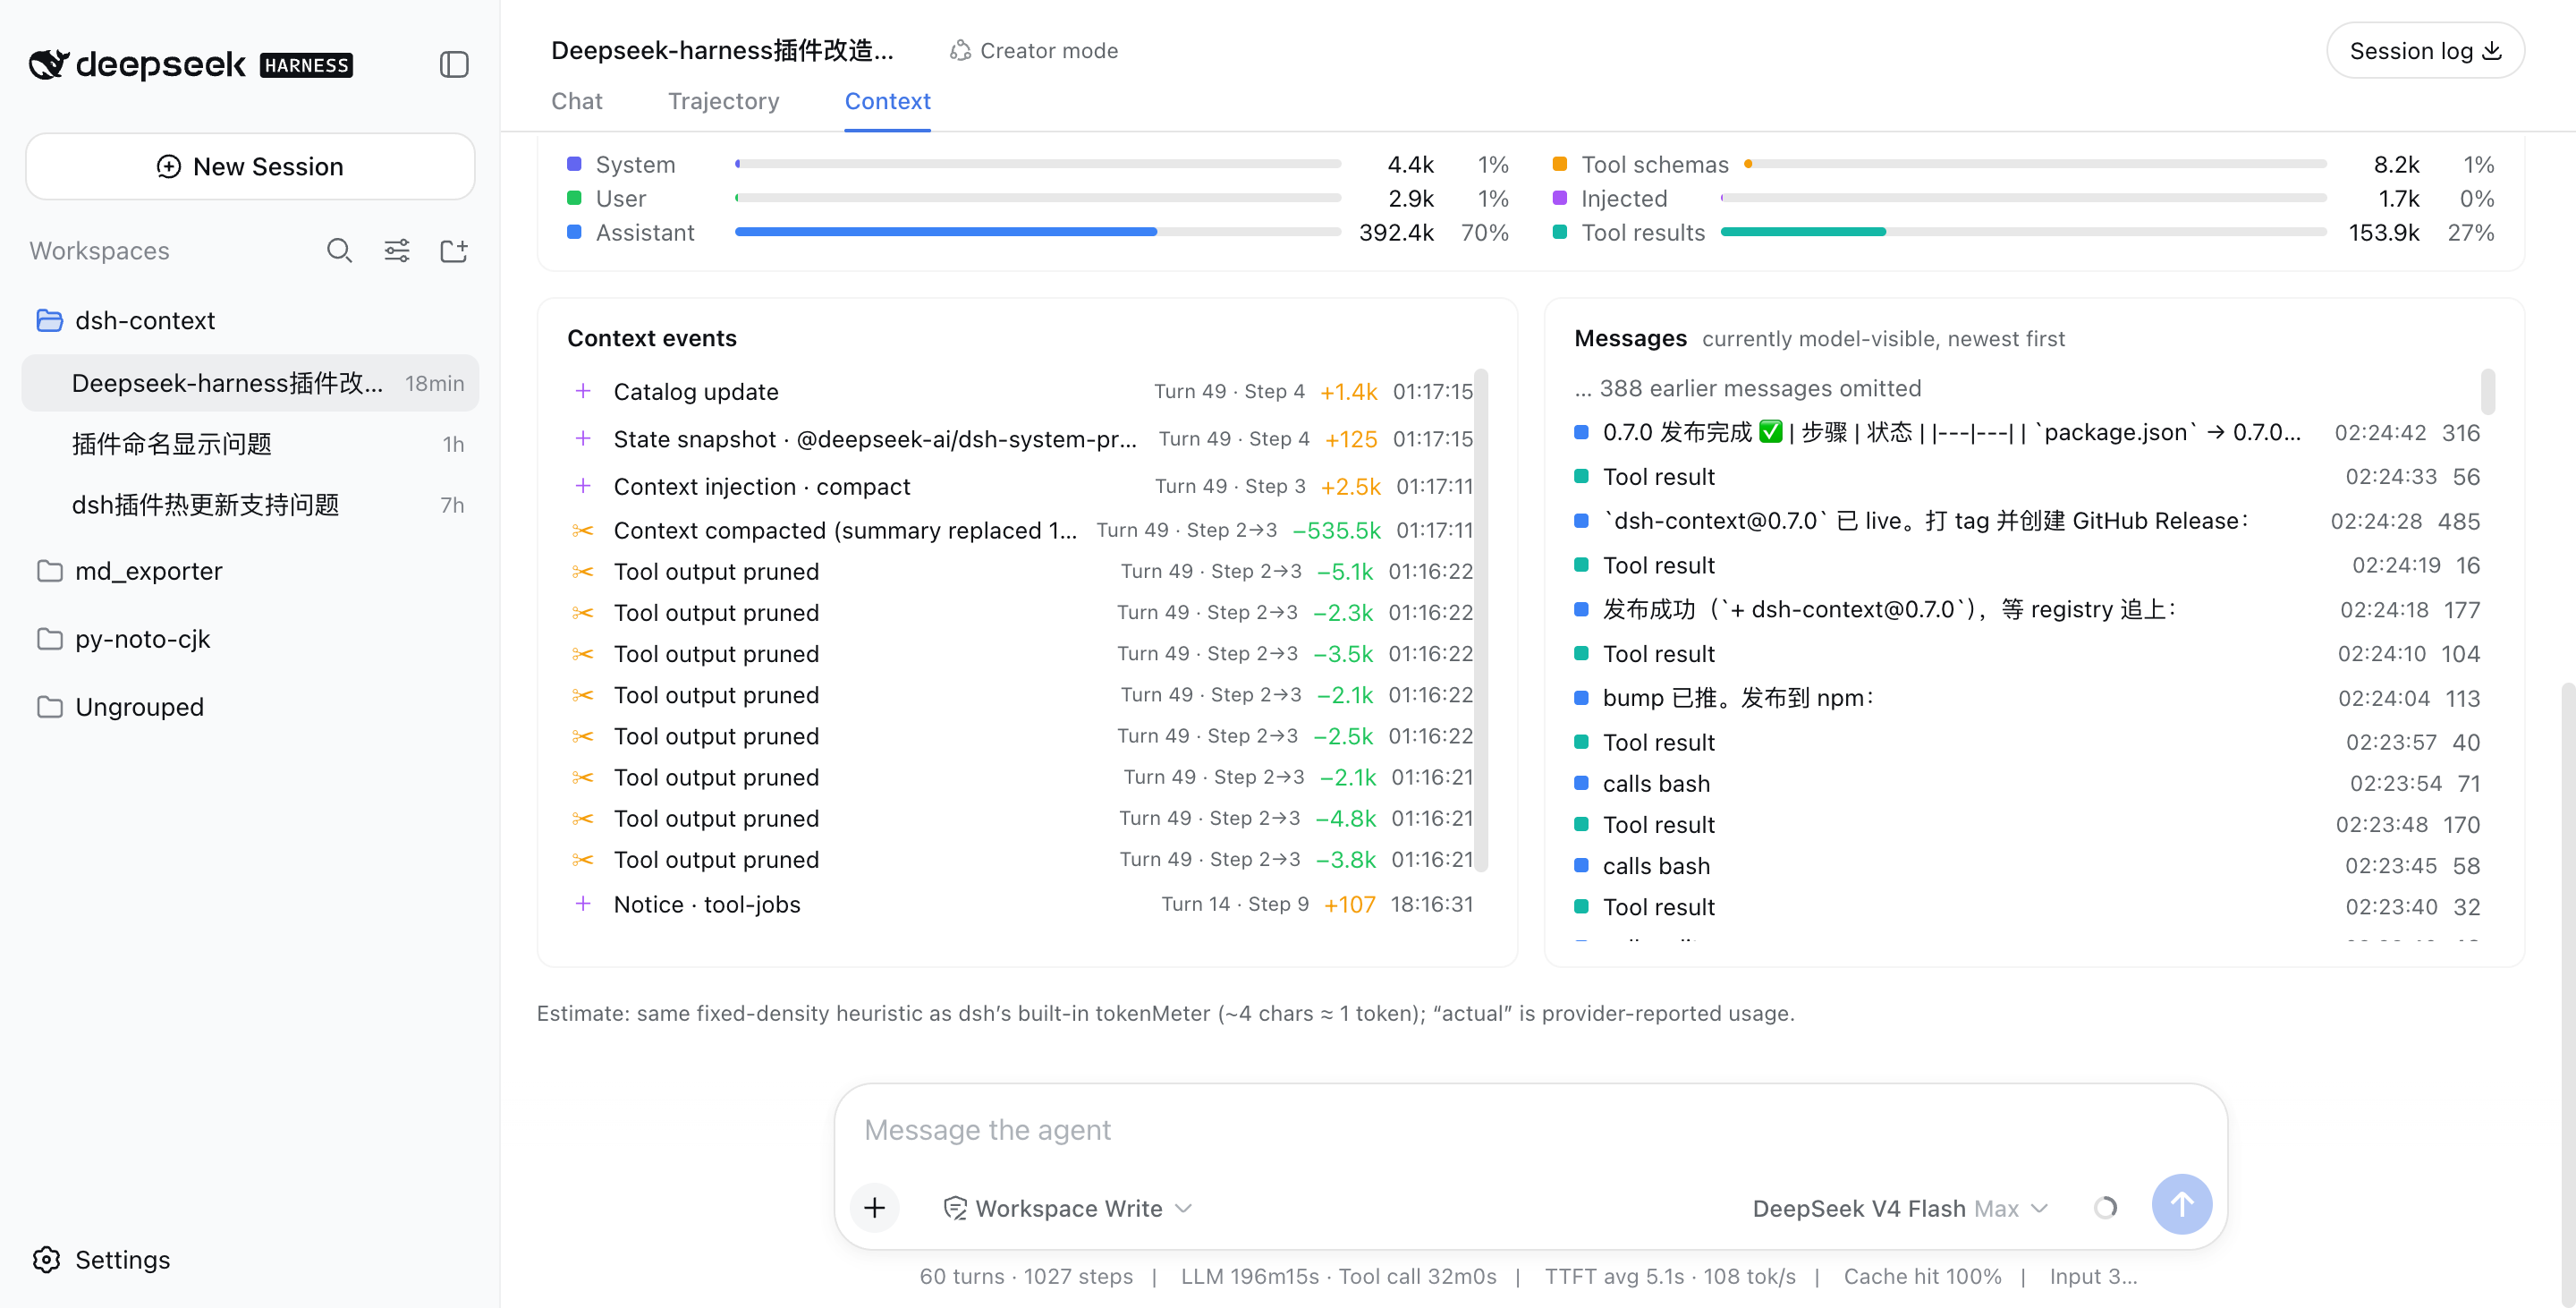
@@ -88,9 +88,26 @@ Every compaction, tool-output prune, skill or plugin context injection, model sw
|
|
|
88
88
|
|
|
89
89
|
|
|
90
90
|
|
|
91
|
-
###
|
|
91
|
+
### 📁 File Activity — what the agent *did* to your files
|
|
92
92
|
|
|
93
|
-
|
|
93
|
+
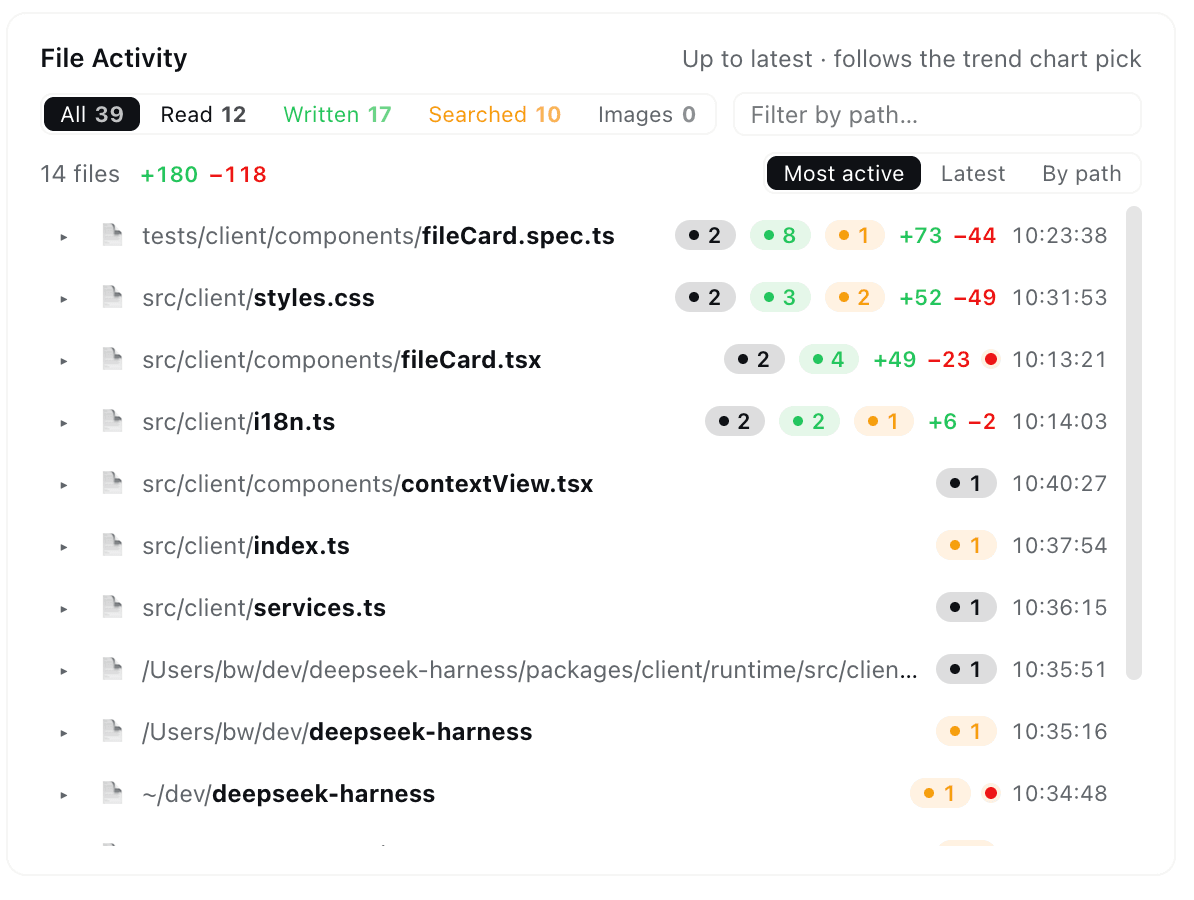
Not what the context is made of, but what it was good for: one row per touched file — read, written, or searched — aggregated up to the step you pick on the trend chart (the card scrubs live as you hover the bars; the default is the whole session to date):
|
|
94
|
+
|
|
95
|
+
|
|
96
|
+
|
|
97
|
+
- **Per-purpose counts** — how many times each file was read, written, and searched, with the header chips doubling as purpose filters (**Read / Written / Searched**), an **Images** chip for the multimodal view (`read_image` calls and image extensions), and a path search box.
|
|
98
|
+
- **Line deltas** — every `edit`/`write` contributes its estimated footprint (`+added / −removed`, read off the call arguments), per file and summed in the header.
|
|
99
|
+
- **Sorted your way** — **Most active**, **Latest**, or **By path**; each row carries per-purpose badges, its cumulative line delta, the last operation's time, and a red dot when an operation failed.
|
|
100
|
+
- **Click to inspect** — a row expands into the file's own operation log — every operation, no cap (tool, time, per-op delta, failures flagged); each operation jumps straight to the exact tool result in the Context browser.
|
|
101
|
+
|
|
102
|
+
### 🕸 Agent Network — the whole agent family at the foot of the tab
|
|
103
|
+
|
|
104
|
+
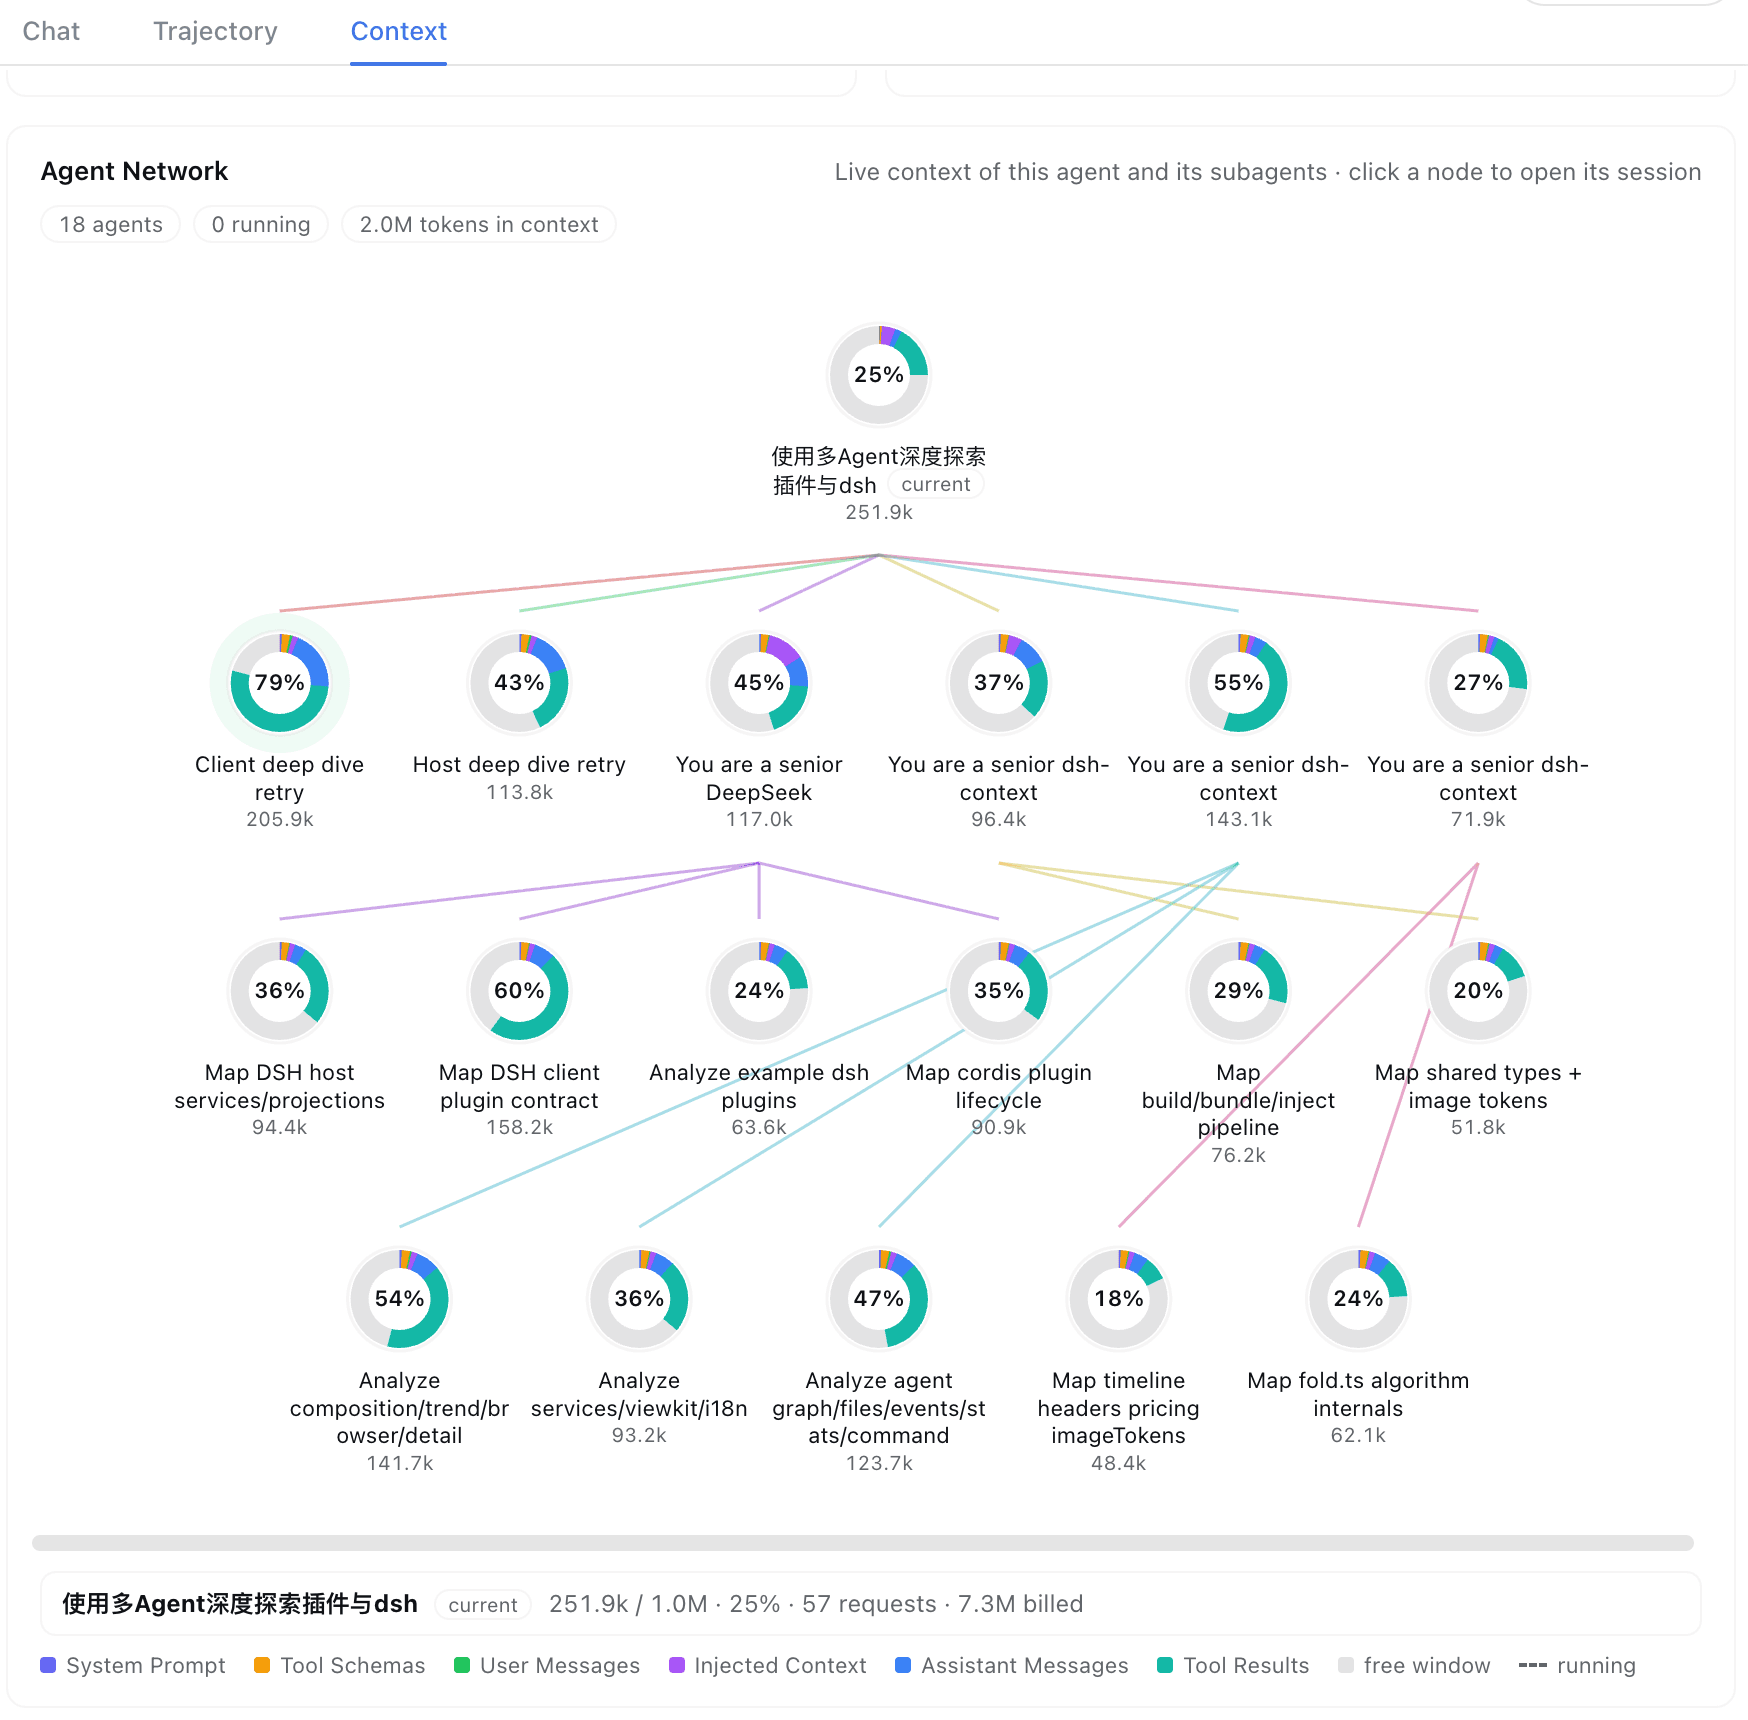
The current agent, its parents, and every subagent it spawned — one node per agent, colored edges for the parent→child lineage:
|
|
105
|
+
|
|
106
|
+
|
|
107
|
+
|
|
108
|
+
- **Subagents and multi-level delegation, on one live map** — the card walks the `parentId` chain to the topmost ancestor and lays out the whole family at any depth: ancestors, siblings, grandchildren. Each level-1 subtree owns a hue, so a node's allegiance reads from its link color; running agents breathe with a green halo and a flowing pulse on their edge.
|
|
109
|
+
- **Every node carries that agent's own context** — each ring is one session's composition (the same six categories and estimator as the overview card) scaled to its window occupancy, with the fill percentage at the center. Hover for the full story: name, one-shot / continuable mode, tokens and window, requests, billed, active time.
|
|
110
|
+
- **Click to jump** — any node opens that agent's session, so a subagent's own Context tab (trend, events, file activity, its own sub-network) is one click away. The layout adapts to the card's width, from a solo agent to an 18-agent clan.
|
|
94
111
|
|
|
95
112
|
### 🧭 Context browser — open the box of any request
|
|
96
113
|
|