claude-inspect 0.4.1 → 0.5.1
This diff represents the content of publicly available package versions that have been released to one of the supported registries. The information contained in this diff is provided for informational purposes only and reflects changes between package versions as they appear in their respective public registries.
- package/README.de.md +29 -9
- package/README.md +31 -20
- package/dist/app/server/history/aggregator.js +73 -21
- package/dist/app/server/http.js +5 -0
- package/dist/app/server/inspector.js +123 -0
- package/dist/web/assets/index-CpYuiE4Y.js +16 -0
- package/dist/web/assets/index-Jv_qFlIw.css +1 -0
- package/dist/web/index.html +2 -2
- package/package.json +9 -3
- package/dist/web/assets/index-CMrlQKvN.css +0 -1
- package/dist/web/assets/index-CjzXdcSM.js +0 -16
package/README.de.md
CHANGED
|
@@ -1,17 +1,33 @@
|
|
|
1
|
-
# claude-inspect
|
|
1
|
+
# claude-inspect – Claude-Code-Dashboard & Monitor für Agenten, Subagenten und Verbrauch
|
|
2
2
|
|
|
3
|
-
|
|
3
|
+
[](https://www.npmjs.com/package/claude-inspect)
|
|
4
|
+
[](https://www.npmjs.com/package/claude-inspect)
|
|
5
|
+
[](https://github.com/brokoskokoli/claude_inspect/actions/workflows/ci.yml)
|
|
6
|
+
[](https://github.com/brokoskokoli/claude_inspect/blob/main/LICENSE)
|
|
7
|
+
[](https://github.com/brokoskokoli/claude_inspect)
|
|
8
|
+
|
|
9
|
+
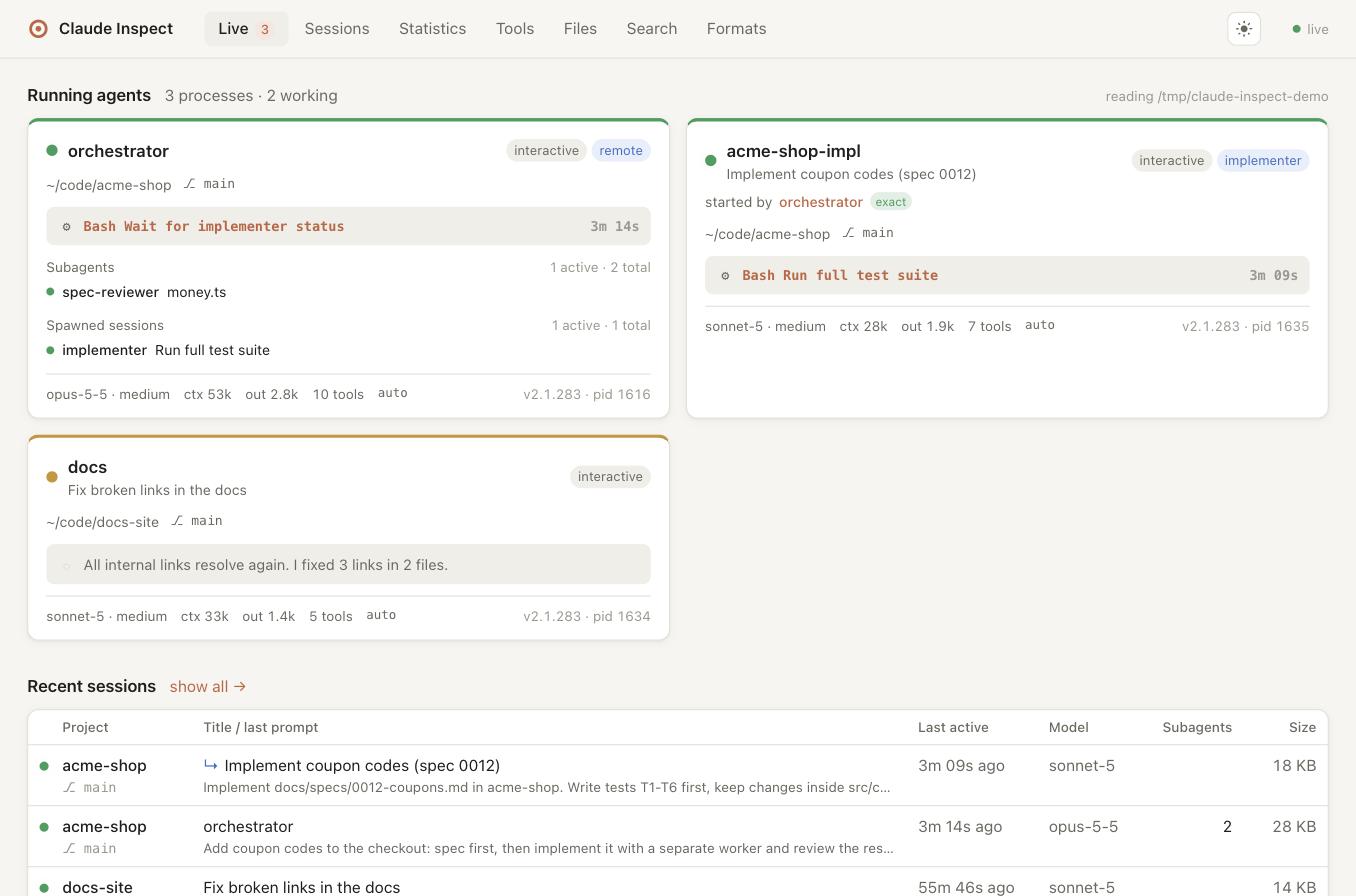
**htop plus Flugschreiber für Claude Code. Keine Hooks, kein Proxy, ein `npx`.**
|
|
10
|
+
|
|
11
|
+
Lokales Live-Dashboard und Monitor für Claude-Code-Agenten: laufende Sessions, Subagenten,
|
|
12
|
+
per `claude -p` gestartete Worker, Tool-Aufrufe, Zeitleisten, CPU- und Token-Verbrauch
|
|
13
|
+
und ein Transcript-Viewer mit durchsuchbarer History.
|
|
14
|
+
|
|
15
|
+
```bash
|
|
16
|
+
npx claude-inspect --open # Node.js ≥ 22 · macOS, Linux, Windows
|
|
17
|
+
```
|
|
18
|
+
|
|
19
|
+
Liest **passiv** die Dateien unter `~/.claude`, ohne Hooks und ohne Konfigurationsänderung.
|
|
20
|
+
Das Einzige, was es schreibt, ist ein CPU-Protokoll im eigenen Datenverzeichnis (siehe *CPU*).
|
|
21
|
+
|
|
22
|
+
> English: [README.md](https://github.com/brokoskokoli/claude_inspect/blob/main/README.md) · Website: [brokoskokoli.github.io/claude_inspect](https://brokoskokoli.github.io/claude_inspect/) · Mitmachen: [CONTRIBUTING.md](https://github.com/brokoskokoli/claude_inspect/blob/main/CONTRIBUTING.md)
|
|
4
23
|
>
|
|
5
24
|
> Die Oberfläche ist englisch; hell, dunkel oder nach Systemeinstellung (Umschalter oben rechts).
|
|
6
25
|
|
|
7
|
-
|
|
8
|
-
`~/.claude`, ohne Hooks und ohne Konfigurationsänderung. Das Einzige, was es schreibt, ist ein
|
|
9
|
-
CPU-Protokoll im eigenen Datenverzeichnis (siehe *CPU*).
|
|
26
|
+
|
|
10
27
|
|
|
11
|
-
##
|
|
28
|
+
## Installation
|
|
12
29
|
|
|
13
30
|
```bash
|
|
14
|
-
npx claude-inspect --open # einmal ausprobieren
|
|
15
31
|
npm install -g claude-inspect # dauerhaft installieren
|
|
16
32
|
claude-inspect service install # Autostart → http://localhost:47717 (Lesezeichen)
|
|
17
33
|
claude-inspect demo --open # ohne eigene Daten ausprobieren
|
|
@@ -47,6 +63,10 @@ Aus den Quellen: `git clone …`, `npm install`, `npm run build`, `npm start`
|
|
|
47
63
|
- *Tasks*: Task-Liste der Session als Board
|
|
48
64
|
- *CPU*: Auslastung des Claude-Prozesses samt aller Unterprozesse (Shells, Builds, Tests,
|
|
49
65
|
MCP-Server …) als gestapelter Verlauf je Programmname, dazu die Prozesse mit der meisten CPU-Zeit
|
|
66
|
+
- *Cost*: geschätzte Kosten (API-Listenpreis) der Session samt aller Subagenten und per
|
|
67
|
+
`claude` gestarteten Sitzungen, je Agent und je Modell mit Tokens (Input, Output, Cache)
|
|
68
|
+
und als Zeitleiste mit den teuersten Momenten
|
|
69
|
+
- Beim Hochscrollen blendet sich eine kompakte Kopfzeile mit Sprung nach oben/unten ein
|
|
50
70
|
- **CPU**: alle 3 s aus der Prozesstabelle gemessen (100 % = ein Kern), Verlaufslinie auf der
|
|
51
71
|
Dashboard-Karte. Pro Session eine CSV-Datei im App-Datenverzeichnis (macOS
|
|
52
72
|
`~/Library/Application Support/claude-inspect/cpu`, Linux `~/.local/share/claude-inspect/cpu`,
|
|
@@ -90,11 +110,11 @@ tests/ Fixtures je Claude-Code-Version, Snapshots, Tests
|
|
|
90
110
|
scripts/ Fixture-Generator
|
|
91
111
|
```
|
|
92
112
|
|
|
93
|
-
Neue Dateiformate: siehe [docs/FORMATS.md](docs/FORMATS.md). Gesamtkonzept: [KONZEPT.md](KONZEPT.md).
|
|
113
|
+
Neue Dateiformate: siehe [docs/FORMATS.md](https://github.com/brokoskokoli/claude_inspect/blob/main/docs/FORMATS.md). Gesamtkonzept: [KONZEPT.md](https://github.com/brokoskokoli/claude_inspect/blob/main/KONZEPT.md).
|
|
94
114
|
|
|
95
115
|
## Speicher & Leistung
|
|
96
116
|
|
|
97
|
-
|
|
117
|
+
Außer dem CPU-Log im eigenen Datenverzeichnis wird nichts auf Platte geschrieben. Beim Start liest der Server nur Prozess-, Job- und
|
|
98
118
|
Kopfdaten (unter 1 s); die komplette History (hier ~600 MB) wird im Hintergrund in
|
|
99
119
|
2–3 s aggregiert und danach nur noch inkrementell nachgeführt. Vollständige Verläufe
|
|
100
120
|
werden erst beim Öffnen geladen und mit einer Obergrenze im Speicher gehalten.
|
package/README.md
CHANGED
|
@@ -1,23 +1,33 @@
|
|
|
1
|
-
# claude-inspect –
|
|
1
|
+
# claude-inspect – Claude Code dashboard & monitor for agents, subagents and usage
|
|
2
2
|
|
|
3
|
-
[](LICENSE)
|
|
4
3
|
[](https://www.npmjs.com/package/claude-inspect)
|
|
4
|
+
[](https://www.npmjs.com/package/claude-inspect)
|
|
5
|
+
[](https://github.com/brokoskokoli/claude_inspect/actions/workflows/ci.yml)
|
|
6
|
+
[](https://github.com/brokoskokoli/claude_inspect/blob/main/LICENSE)
|
|
7
|
+
[](https://github.com/brokoskokoli/claude_inspect)
|
|
5
8
|

|
|
6
|
-

|
|
7
|
-

|
|
8
9
|

|
|
9
10
|
|
|
10
|
-
**
|
|
11
|
-
|
|
11
|
+
**htop plus a flight recorder for [Claude Code](https://claude.com/claude-code). No hooks, no proxy, one `npx`.**
|
|
12
|
+
|
|
13
|
+
claude-inspect is a local Claude Code dashboard and monitor that reads the files Claude Code already writes to `~/.claude`
|
|
12
14
|
and shows running sessions, subagents, `claude -p` worker sessions started by other agents,
|
|
13
|
-
every tool call with its result, timelines, a call graph,
|
|
15
|
+
every tool call with its result, timelines, a call graph, CPU and token usage
|
|
16
|
+
and a transcript viewer with a searchable history.
|
|
17
|
+
|
|
18
|
+
```bash
|
|
19
|
+
npx claude-inspect --open # Node.js ≥ 22 · macOS, Linux, Windows
|
|
20
|
+
```
|
|
21
|
+
|
|
22
|
+
No Claude Code data at hand? `npx claude-inspect demo --open` starts it with a fictional data set.
|
|
23
|
+
Permanent install with autostart: see [Installation](#installation).
|
|
14
24
|
|
|
15
25
|
It is **read-only and passive** towards `~/.claude`: no hooks, no settings changes, no proxy, no data leaves
|
|
16
26
|
your machine. The only thing it writes is a CPU log in its own data directory (see *CPU usage*).
|
|
17
27
|
|
|
18
|
-
> Website: [brokoskokoli.github.io/claude_inspect](https://brokoskokoli.github.io/claude_inspect/) · Deutsch: [README.de.md](README.de.md) · Design notes (German): [KONZEPT.md](KONZEPT.md)
|
|
28
|
+
> Website: [brokoskokoli.github.io/claude_inspect](https://brokoskokoli.github.io/claude_inspect/) · Deutsch: [README.de.md](https://github.com/brokoskokoli/claude_inspect/blob/main/README.de.md) · Design notes (German): [KONZEPT.md](https://github.com/brokoskokoli/claude_inspect/blob/main/KONZEPT.md) · [Contributing](https://github.com/brokoskokoli/claude_inspect/blob/main/CONTRIBUTING.md)
|
|
19
29
|
|
|
20
|
-

|
|
30
|
+

|
|
21
31
|
|
|
22
32
|
## Why
|
|
23
33
|
|
|
@@ -40,6 +50,7 @@ becomes hard to tell *who is doing what*. claude-inspect answers:
|
|
|
40
50
|
| **Agent tree & call graph** | Main agent → subagents (nested) → `claude` sessions started via Bash, including fork/resume relations. Finished agents are greyed out. |
|
|
41
51
|
| **Timeline** | One lane per agent, tool calls as bars, spawn links between lanes, idle gaps > 10 min collapsed, zoom. Click a bar to jump to the call. |
|
|
42
52
|
| **Spawn linking** | Links sessions started by `claude -p …` to the calling tool use via the process tree (exact), `--session-id`, prompt text, `--agent`, time window and working directory – with a confidence label. |
|
|
53
|
+
| **Cost per agent tree** | Cost tab per session: API list-price estimate for the main agent plus all its subagents and spawned `claude` sessions, per agent and per model with input, output and cache tokens, plus a cost timeline with the most expensive moments. |
|
|
43
54
|
| **Statistics** | API list-price estimate, tokens per model/day/project, cache share, activity heatmap, tool statistics with error rate and p95 duration. |
|
|
44
55
|
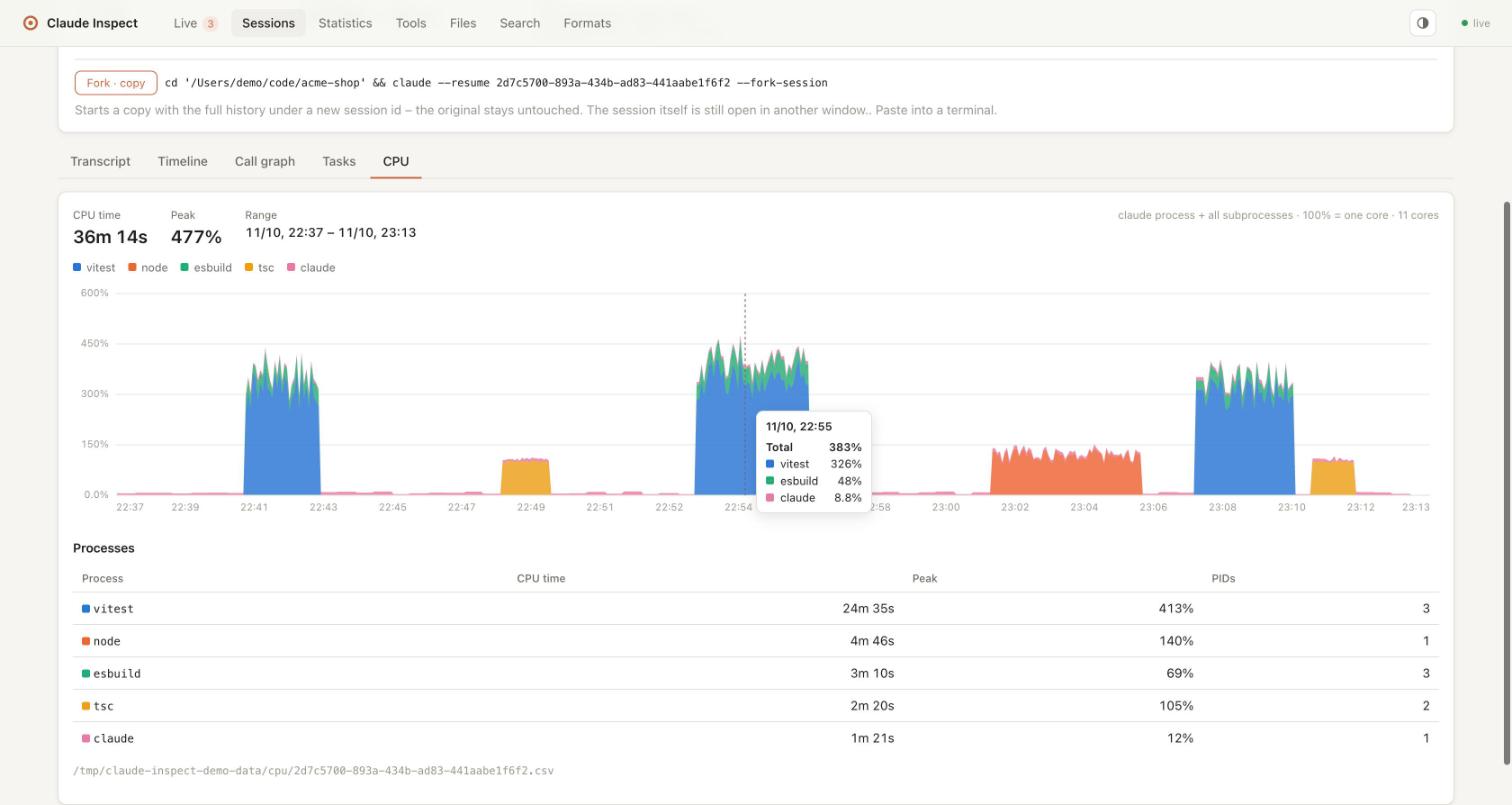
| **CPU usage** | CPU of each Claude Code process plus all its subprocesses (shells, builds, test runners, MCP servers …), measured every 3 s from the process table. Sparkline on the dashboard card, a *CPU* tab per session with a stacked chart by process name and the processes that used the most CPU time. Recorded as one CSV per session in the app data directory (`~/Library/Application Support/claude-inspect/cpu` on macOS, `~/.local/share/claude-inspect/cpu` on Linux, `%LOCALAPPDATA%\claude-inspect\cpu` on Windows), so it stays available after the session ended; files older than 30 days are deleted. Only measured while claude-inspect runs; processes that live less than 3 s are missed. `--no-cpu-log` turns recording off. |
|
|
45
56
|
| **Tool explorer & files** | Every tool call across all sessions, filterable; which files agents read, edited or wrote. |
|
|
@@ -49,29 +60,29 @@ becomes hard to tell *who is doing what*. claude-inspect answers:
|
|
|
49
60
|
| **Dark mode** | Light, dark or system theme, remembered per browser. |
|
|
50
61
|
| **Phone-friendly** | On narrow screens (phones, small iframes) the navigation collapses into a menu, tables turn into compact lists, the session view is single-column and long code, paths and JSON scroll inside their block. The server still listens on 127.0.0.1 only – to open it from a phone you need your own tunnel or reverse proxy that forwards to it with a local `Host` header (other hosts are rejected). |
|
|
51
62
|
|
|
52
|
-

|
|
63
|
+
|
|
53
64
|
|
|
54
65
|
<table>
|
|
55
66
|
<tr>
|
|
56
|
-
<td><img src="docs/screenshots/timeline.jpg" alt="Timeline of an orchestrator with subagents and a spawned worker session"></td>
|
|
57
|
-
<td><img src="docs/screenshots/call-graph.jpg" alt="Call graph: main agent, subagents and a claude -p worker session"></td>
|
|
67
|
+
<td><img src="https://raw.githubusercontent.com/brokoskokoli/claude_inspect/main/docs/screenshots/timeline.jpg" alt="Timeline of an orchestrator with subagents and a spawned worker session"></td>
|
|
68
|
+
<td><img src="https://raw.githubusercontent.com/brokoskokoli/claude_inspect/main/docs/screenshots/call-graph.jpg" alt="Call graph: main agent, subagents and a claude -p worker session"></td>
|
|
58
69
|
</tr>
|
|
59
70
|
<tr>
|
|
60
|
-
<td><img src="docs/screenshots/transcript.jpg" alt="Transcript viewer with an expanded Edit tool call shown as diff"></td>
|
|
61
|
-
<td><img src="docs/screenshots/statistics.jpg" alt="Statistics: API cost estimate per day and model, activity heatmap"></td>
|
|
71
|
+
<td><img src="https://raw.githubusercontent.com/brokoskokoli/claude_inspect/main/docs/screenshots/transcript.jpg" alt="Transcript viewer with an expanded Edit tool call shown as diff"></td>
|
|
72
|
+
<td><img src="https://raw.githubusercontent.com/brokoskokoli/claude_inspect/main/docs/screenshots/statistics.jpg" alt="Statistics: API cost estimate per day and model, activity heatmap"></td>
|
|
62
73
|
</tr>
|
|
63
74
|
</table>
|
|
64
75
|
|
|
65
76
|
<table>
|
|
66
77
|
<tr>
|
|
67
|
-
<td><img src="docs/screenshots/tool-explorer.jpg" alt="Tool explorer listing tool calls across all sessions"></td>
|
|
68
|
-
<td><img src="docs/screenshots/dashboard-dark.jpg" alt="Live dashboard in dark mode"></td>
|
|
78
|
+
<td><img src="https://raw.githubusercontent.com/brokoskokoli/claude_inspect/main/docs/screenshots/tool-explorer.jpg" alt="Tool explorer listing tool calls across all sessions"></td>
|
|
79
|
+
<td><img src="https://raw.githubusercontent.com/brokoskokoli/claude_inspect/main/docs/screenshots/dashboard-dark.jpg" alt="Live dashboard in dark mode"></td>
|
|
69
80
|
</tr>
|
|
70
81
|
</table>
|
|
71
82
|
|
|
72
83
|
*All screenshots show the built-in demo data set (`claude-inspect demo`), not real sessions.*
|
|
73
84
|
|
|
74
|
-
##
|
|
85
|
+
## Installation
|
|
75
86
|
|
|
76
87
|
Requirements: Node.js ≥ 22, macOS, Linux or Windows, Claude Code writing to `~/.claude`. On Windows, live process status is read via PowerShell; the autostart service and the live `demo` are macOS/Linux only (`demo --out <dir>` works everywhere).
|
|
77
88
|
|
|
@@ -129,7 +140,7 @@ Light, dark or follow the OS – switch with the button in the header (the choic
|
|
|
129
140
|
FormatRegistry → versioned decoders → normalized model → REST + SSE → Svelte UI
|
|
130
141
|
```
|
|
131
142
|
|
|
132
|
-
- **Per-record format detection:** every decoder scores a record (`type`, version range, structure); the best one wins, a fallback keeps unknown records. Adding support for a new Claude Code version = adding a decoder file. See [docs/FORMATS.md](docs/FORMATS.md).
|
|
143
|
+
- **Per-record format detection:** every decoder scores a record (`type`, version range, structure); the best one wins, a fallback keeps unknown records. Adding support for a new Claude Code version = adding a decoder file. See [docs/FORMATS.md](https://github.com/brokoskokoli/claude_inspect/blob/main/docs/FORMATS.md).
|
|
133
144
|
- **In memory only:** startup reads process/job data and file heads (< 1 s); the full history (hundreds of MB) is aggregated in the background in a few seconds and then followed incrementally.
|
|
134
145
|
- **Privacy & security:** listens on `127.0.0.1` only (never reachable from the network), rejects requests whose `Host` header isn't `localhost`/`127.0.0.1` (DNS rebinding), sends no CORS headers (other websites in your browser can't read the API), is read-only towards `~/.claude` (the CPU log goes to its own data directory and contains only timestamps, PIDs, program names and CPU percentages – no command lines), never reads credential files (`*.key`, `daemon/auth`, `ide/*.lock`, …) and masks token/secret fields in the raw view. The access token is an extra layer against *other local processes or users* on the same machine; on a single-user machine `--no-auth` (used by the autostart service) is a reasonable trade-off. Cost figures are estimates from public API list prices – with a subscription you do not pay these amounts directly.
|
|
135
146
|
|
|
@@ -159,7 +170,7 @@ tests/ anonymized fixtures per Claude Code version, snapshots, tests
|
|
|
159
170
|
scripts/ fixture generator (demo data: src/server/cli/demo.ts)
|
|
160
171
|
```
|
|
161
172
|
|
|
162
|
-
Contributions welcome – especially decoders for new Claude Code versions (run `npm run fixtures` and
|
|
173
|
+
Contributions welcome – see [CONTRIBUTING.md](https://github.com/brokoskokoli/claude_inspect/blob/main/CONTRIBUTING.md), especially decoders for new Claude Code versions (run `npm run fixtures` and
|
|
163
174
|
`npm test`, then check the *Formats* page for unknown fields).
|
|
164
175
|
|
|
165
176
|
## Disclaimer
|
|
@@ -169,4 +180,4 @@ may change at any time; claude-inspect is designed to degrade gracefully (unknow
|
|
|
169
180
|
|
|
170
181
|
## License
|
|
171
182
|
|
|
172
|
-
[MIT](LICENSE)
|
|
183
|
+
[MIT](https://github.com/brokoskokoli/claude_inspect/blob/main/LICENSE)
|
|
@@ -42,27 +42,7 @@ export class HistoryIndex {
|
|
|
42
42
|
seen.add(p);
|
|
43
43
|
continue;
|
|
44
44
|
}
|
|
45
|
-
|
|
46
|
-
let names = [];
|
|
47
|
-
try {
|
|
48
|
-
names = await readdir(dir);
|
|
49
|
-
}
|
|
50
|
-
catch {
|
|
51
|
-
/* keine Subagenten */
|
|
52
|
-
}
|
|
53
|
-
for (const n of names) {
|
|
54
|
-
const m = /^agent-(.+)\.jsonl$/.exec(n);
|
|
55
|
-
if (!m)
|
|
56
|
-
continue;
|
|
57
|
-
const path = join(dir, n);
|
|
58
|
-
seen.add(path);
|
|
59
|
-
try {
|
|
60
|
-
await this.scan(path, (await stat(path)).size, f.sessionId, m[1], project);
|
|
61
|
-
}
|
|
62
|
-
catch {
|
|
63
|
-
/* gelöscht */
|
|
64
|
-
}
|
|
65
|
-
}
|
|
45
|
+
await this.scanSubagents(f, project, seen);
|
|
66
46
|
}
|
|
67
47
|
// Von Claude Code aufgeräumte Dateien vergessen
|
|
68
48
|
for (const p of [...this.files.keys()])
|
|
@@ -71,7 +51,52 @@ export class HistoryIndex {
|
|
|
71
51
|
this.totalFiles = this.files.size;
|
|
72
52
|
this.ready = true;
|
|
73
53
|
}
|
|
54
|
+
async scanSubagents(f, project, seen) {
|
|
55
|
+
const dir = subagentDir(f.path);
|
|
56
|
+
let names = [];
|
|
57
|
+
try {
|
|
58
|
+
names = await readdir(dir);
|
|
59
|
+
}
|
|
60
|
+
catch {
|
|
61
|
+
/* keine Subagenten */
|
|
62
|
+
}
|
|
63
|
+
for (const n of names) {
|
|
64
|
+
const m = /^agent-(.+)\.jsonl$/.exec(n);
|
|
65
|
+
if (!m)
|
|
66
|
+
continue;
|
|
67
|
+
const path = join(dir, n);
|
|
68
|
+
seen?.add(path);
|
|
69
|
+
try {
|
|
70
|
+
await this.scan(path, (await stat(path)).size, f.sessionId, m[1], project);
|
|
71
|
+
}
|
|
72
|
+
catch {
|
|
73
|
+
/* gelöscht */
|
|
74
|
+
}
|
|
75
|
+
}
|
|
76
|
+
}
|
|
77
|
+
/**
|
|
78
|
+
* Eine Session samt Subagenten sofort auf Stand bringen, ohne auf den ersten
|
|
79
|
+
* vollständigen Scan zu warten (für die Kostenansicht direkt nach dem Start).
|
|
80
|
+
*/
|
|
81
|
+
async ensureSession(f, project) {
|
|
82
|
+
try {
|
|
83
|
+
await this.scan(f.path, (await stat(f.path)).size, f.sessionId, undefined, project);
|
|
84
|
+
}
|
|
85
|
+
catch {
|
|
86
|
+
return; // gelöscht
|
|
87
|
+
}
|
|
88
|
+
await this.scanSubagents(f, project);
|
|
89
|
+
}
|
|
90
|
+
/** Läuft parallel zum Hintergrund-Scan: pro Datei nur ein Lesevorgang gleichzeitig. */
|
|
91
|
+
scanning = new Map();
|
|
74
92
|
async scan(path, size, sessionId, agentId, project) {
|
|
93
|
+
for (let running = this.scanning.get(path); running; running = this.scanning.get(path))
|
|
94
|
+
await running;
|
|
95
|
+
const p = this.scanUnlocked(path, size, sessionId, agentId, project).finally(() => this.scanning.delete(path));
|
|
96
|
+
this.scanning.set(path, p);
|
|
97
|
+
return p;
|
|
98
|
+
}
|
|
99
|
+
async scanUnlocked(path, size, sessionId, agentId, project) {
|
|
75
100
|
let agg = this.files.get(path);
|
|
76
101
|
if (agg && agg.size === size)
|
|
77
102
|
return;
|
|
@@ -261,6 +286,33 @@ export class HistoryIndex {
|
|
|
261
286
|
heat,
|
|
262
287
|
};
|
|
263
288
|
}
|
|
289
|
+
/**
|
|
290
|
+
* Tokens je Modell eines Transkripts (Hauptagent oder Subagent) für die Kostenansicht.
|
|
291
|
+
* `seen` enthält bereits gezählte Message-Ids, damit bei Fork/Resume kopierte Antworten
|
|
292
|
+
* im selben Baum nicht doppelt zählen.
|
|
293
|
+
*/
|
|
294
|
+
usageOf(sessionId, agentId, seen, each) {
|
|
295
|
+
const out = new Map();
|
|
296
|
+
for (const a of this.files.values()) {
|
|
297
|
+
if (a.sessionId !== sessionId || a.agentId !== agentId)
|
|
298
|
+
continue;
|
|
299
|
+
for (const [messageId, u] of a.usage) {
|
|
300
|
+
if (seen.has(messageId))
|
|
301
|
+
continue;
|
|
302
|
+
seen.add(messageId);
|
|
303
|
+
let t = out.get(u.model);
|
|
304
|
+
if (!t)
|
|
305
|
+
out.set(u.model, (t = emptyTotals()));
|
|
306
|
+
addUsage(t, u.usage);
|
|
307
|
+
if (each) {
|
|
308
|
+
const one = emptyTotals();
|
|
309
|
+
addUsage(one, u.usage);
|
|
310
|
+
each(u.model, u.ts, one);
|
|
311
|
+
}
|
|
312
|
+
}
|
|
313
|
+
}
|
|
314
|
+
return out;
|
|
315
|
+
}
|
|
264
316
|
toolCalls(q) {
|
|
265
317
|
const { aggs, since } = this.selected(q);
|
|
266
318
|
const needle = q.q?.toLowerCase();
|
package/dist/app/server/http.js
CHANGED
|
@@ -155,6 +155,11 @@ export function startServer(inspector, opts) {
|
|
|
155
155
|
m = /^\/api\/cpu\/([\w-]+)$/.exec(p);
|
|
156
156
|
if (m)
|
|
157
157
|
return json(res, 200, await inspector.cpuHistory(m[1]));
|
|
158
|
+
m = /^\/api\/cost\/([\w-]+)$/.exec(p);
|
|
159
|
+
if (m) {
|
|
160
|
+
const cost = await inspector.sessionCost(m[1]);
|
|
161
|
+
return cost ? json(res, 200, cost) : json(res, 404, { error: 'unknown session' });
|
|
162
|
+
}
|
|
158
163
|
m = /^\/api\/flow\/([\w-]+)$/.exec(p);
|
|
159
164
|
if (m) {
|
|
160
165
|
const flow = await inspector.flow(m[1]);
|
|
@@ -6,6 +6,7 @@ import { CLAUDE_DIR, relToClaude } from './config.js';
|
|
|
6
6
|
import { CpuMonitor } from './cpu-monitor.js';
|
|
7
7
|
import { registry } from './formats/index.js';
|
|
8
8
|
import { HistoryIndex } from './history/aggregator.js';
|
|
9
|
+
import { emptyTotals, estimateCost, mergeTotals } from '../shared/pricing.js';
|
|
9
10
|
import { search } from './history/search.js';
|
|
10
11
|
import { analyze } from './model/analyze.js';
|
|
11
12
|
import { laneData } from './model/flow.js';
|
|
@@ -500,7 +501,129 @@ export class Inspector extends EventEmitter {
|
|
|
500
501
|
}
|
|
501
502
|
return { rootSessionId, lanes, origin };
|
|
502
503
|
}
|
|
504
|
+
/**
|
|
505
|
+
* Geschätzte Kosten einer Session samt aller Subagenten und per `claude` gestarteten
|
|
506
|
+
* Sitzungen (rekursiv, gleicher Baum wie Zeitleiste und Graph).
|
|
507
|
+
*/
|
|
508
|
+
async sessionCost(rootSessionId) {
|
|
509
|
+
const flow = await this.flow(rootSessionId);
|
|
510
|
+
if (!flow)
|
|
511
|
+
return undefined;
|
|
512
|
+
// nur die Dateien dieses Baums einlesen, statt auf den ersten vollständigen History-Scan zu warten
|
|
513
|
+
for (const sid of new Set(flow.lanes.map((l) => l.sessionId))) {
|
|
514
|
+
const f = this.index.get(sid);
|
|
515
|
+
if (f)
|
|
516
|
+
await this.history.ensureSession(f, await this.projectOf(f));
|
|
517
|
+
}
|
|
518
|
+
const seen = new Set();
|
|
519
|
+
const total = emptyTotals();
|
|
520
|
+
const byModel = new Map();
|
|
521
|
+
const unpriced = new Set();
|
|
522
|
+
let costUSD = 0;
|
|
523
|
+
const points = [];
|
|
524
|
+
const rows = flow.lanes.map((lane) => {
|
|
525
|
+
const usage = this.history.usageOf(lane.sessionId, lane.agentId, seen, (model, ts, one) => {
|
|
526
|
+
if (ts)
|
|
527
|
+
points.push({ ts, cost: estimateCost(model, one) ?? 0, output: one.output, model, lane });
|
|
528
|
+
});
|
|
529
|
+
const tokens = emptyTotals();
|
|
530
|
+
let cost = 0;
|
|
531
|
+
const models = [...usage.entries()].map(([model, t]) => {
|
|
532
|
+
mergeTotals(tokens, t);
|
|
533
|
+
let m = byModel.get(model);
|
|
534
|
+
if (!m)
|
|
535
|
+
byModel.set(model, (m = emptyTotals()));
|
|
536
|
+
mergeTotals(m, t);
|
|
537
|
+
const c = estimateCost(model, t);
|
|
538
|
+
if (c === undefined)
|
|
539
|
+
unpriced.add(model);
|
|
540
|
+
else
|
|
541
|
+
cost += c;
|
|
542
|
+
return { model, tokens: t, costUSD: c };
|
|
543
|
+
});
|
|
544
|
+
mergeTotals(total, tokens);
|
|
545
|
+
costUSD += cost;
|
|
546
|
+
return {
|
|
547
|
+
id: lane.id,
|
|
548
|
+
sessionId: lane.sessionId,
|
|
549
|
+
agentId: lane.agentId,
|
|
550
|
+
kind: lane.kind,
|
|
551
|
+
label: lane.label,
|
|
552
|
+
sublabel: lane.sublabel,
|
|
553
|
+
parentId: lane.parentId,
|
|
554
|
+
depth: lane.depth,
|
|
555
|
+
status: lane.status,
|
|
556
|
+
byModel: models.sort((a, b) => (b.costUSD ?? 0) - (a.costUSD ?? 0)),
|
|
557
|
+
tokens,
|
|
558
|
+
costUSD: cost,
|
|
559
|
+
};
|
|
560
|
+
});
|
|
561
|
+
const rootFile = this.index.get(rootSessionId);
|
|
562
|
+
return {
|
|
563
|
+
rootSessionId,
|
|
564
|
+
rows,
|
|
565
|
+
total,
|
|
566
|
+
costUSD,
|
|
567
|
+
byModel: [...byModel.entries()]
|
|
568
|
+
.map(([model, tokens]) => ({ model, tokens, costUSD: estimateCost(model, tokens) }))
|
|
569
|
+
.sort((a, b) => (b.costUSD ?? 0) - (a.costUSD ?? 0)),
|
|
570
|
+
unpricedModels: [...unpriced],
|
|
571
|
+
reportedCostUSD: rootFile ? (await this.index.summary(rootFile)).costUSD : undefined,
|
|
572
|
+
timeline: costTimeline(points),
|
|
573
|
+
};
|
|
574
|
+
}
|
|
503
575
|
formats() {
|
|
504
576
|
return registry.report();
|
|
505
577
|
}
|
|
506
578
|
}
|
|
579
|
+
const MIN = 60_000;
|
|
580
|
+
const BUCKET_SIZES = [1, 2, 5, 10, 15, 30, 60, 120, 180, 360, 720, 1440].map((m) => m * MIN);
|
|
581
|
+
/** Verteilt die Modellantworten auf höchstens ~120 gleich lange Zeitabschnitte. */
|
|
582
|
+
function costTimeline(points) {
|
|
583
|
+
if (!points.length)
|
|
584
|
+
return { bucketMs: MIN, buckets: [] };
|
|
585
|
+
let first = Infinity;
|
|
586
|
+
let last = -Infinity;
|
|
587
|
+
for (const p of points) {
|
|
588
|
+
first = Math.min(first, p.ts);
|
|
589
|
+
last = Math.max(last, p.ts);
|
|
590
|
+
}
|
|
591
|
+
const span = last - first;
|
|
592
|
+
const bucketMs = BUCKET_SIZES.find((b) => span / b <= 120) ?? Math.ceil(span / 120 / (1440 * MIN)) * 1440 * MIN;
|
|
593
|
+
// an der lokalen Uhr ausrichten (volle Minuten/Stunden/Tage)
|
|
594
|
+
const offset = new Date(first).getTimezoneOffset() * MIN;
|
|
595
|
+
const start = Math.floor((first - offset) / bucketMs) * bucketMs + offset;
|
|
596
|
+
const n = Math.floor((last - start) / bucketMs) + 1;
|
|
597
|
+
const buckets = Array.from({ length: n }, (_, i) => ({
|
|
598
|
+
start: start + i * bucketMs,
|
|
599
|
+
costUSD: 0,
|
|
600
|
+
outputTokens: 0,
|
|
601
|
+
requests: 0,
|
|
602
|
+
byKind: {},
|
|
603
|
+
byModel: {},
|
|
604
|
+
top: [],
|
|
605
|
+
lanes: new Map(),
|
|
606
|
+
}));
|
|
607
|
+
for (const p of points) {
|
|
608
|
+
const b = buckets[Math.floor((p.ts - start) / bucketMs)];
|
|
609
|
+
b.costUSD += p.cost;
|
|
610
|
+
b.outputTokens += p.output;
|
|
611
|
+
b.requests++;
|
|
612
|
+
b.byKind[p.lane.kind] = (b.byKind[p.lane.kind] ?? 0) + p.cost;
|
|
613
|
+
b.byModel[p.model] = (b.byModel[p.model] ?? 0) + p.cost;
|
|
614
|
+
let l = b.lanes.get(p.lane.id);
|
|
615
|
+
if (!l)
|
|
616
|
+
b.lanes.set(p.lane.id, (l = { label: p.lane.label, sublabel: p.lane.sublabel, costUSD: 0 }));
|
|
617
|
+
l.costUSD += p.cost;
|
|
618
|
+
}
|
|
619
|
+
return {
|
|
620
|
+
bucketMs,
|
|
621
|
+
buckets: buckets.map(({ lanes, ...b }) => ({
|
|
622
|
+
...b,
|
|
623
|
+
top: [...lanes.entries()]
|
|
624
|
+
.map(([id, l]) => ({ id, ...l }))
|
|
625
|
+
.sort((x, y) => y.costUSD - x.costUSD)
|
|
626
|
+
.slice(0, 3),
|
|
627
|
+
})),
|
|
628
|
+
};
|
|
629
|
+
}
|