chrome-debugger-mcp 1.0.1 → 1.0.3
This diff represents the content of publicly available package versions that have been released to one of the supported registries. The information contained in this diff is provided for informational purposes only and reflects changes between package versions as they appear in their respective public registries.
- package/README.md +85 -435
- package/package.json +45 -30
package/README.md
CHANGED
|
@@ -2,33 +2,23 @@
|
|
|
2
2
|
|
|
3
3
|
[English](#english) | [中文](#chinese)
|
|
4
4
|
|
|
5
|
-
<a id="english"></a
|
|
5
|
+
<a id="english"></a>
|
|
6
6
|
|
|
7
7
|
## English
|
|
8
8
|
|
|
9
|
-
|
|
9
|
+
Breakpoint-driven Chrome debugging for MCP clients.
|
|
10
10
|
|
|
11
|
-
`chrome-debugger-mcp` exposes Chrome DevTools Protocol primitives as MCP tools
|
|
11
|
+
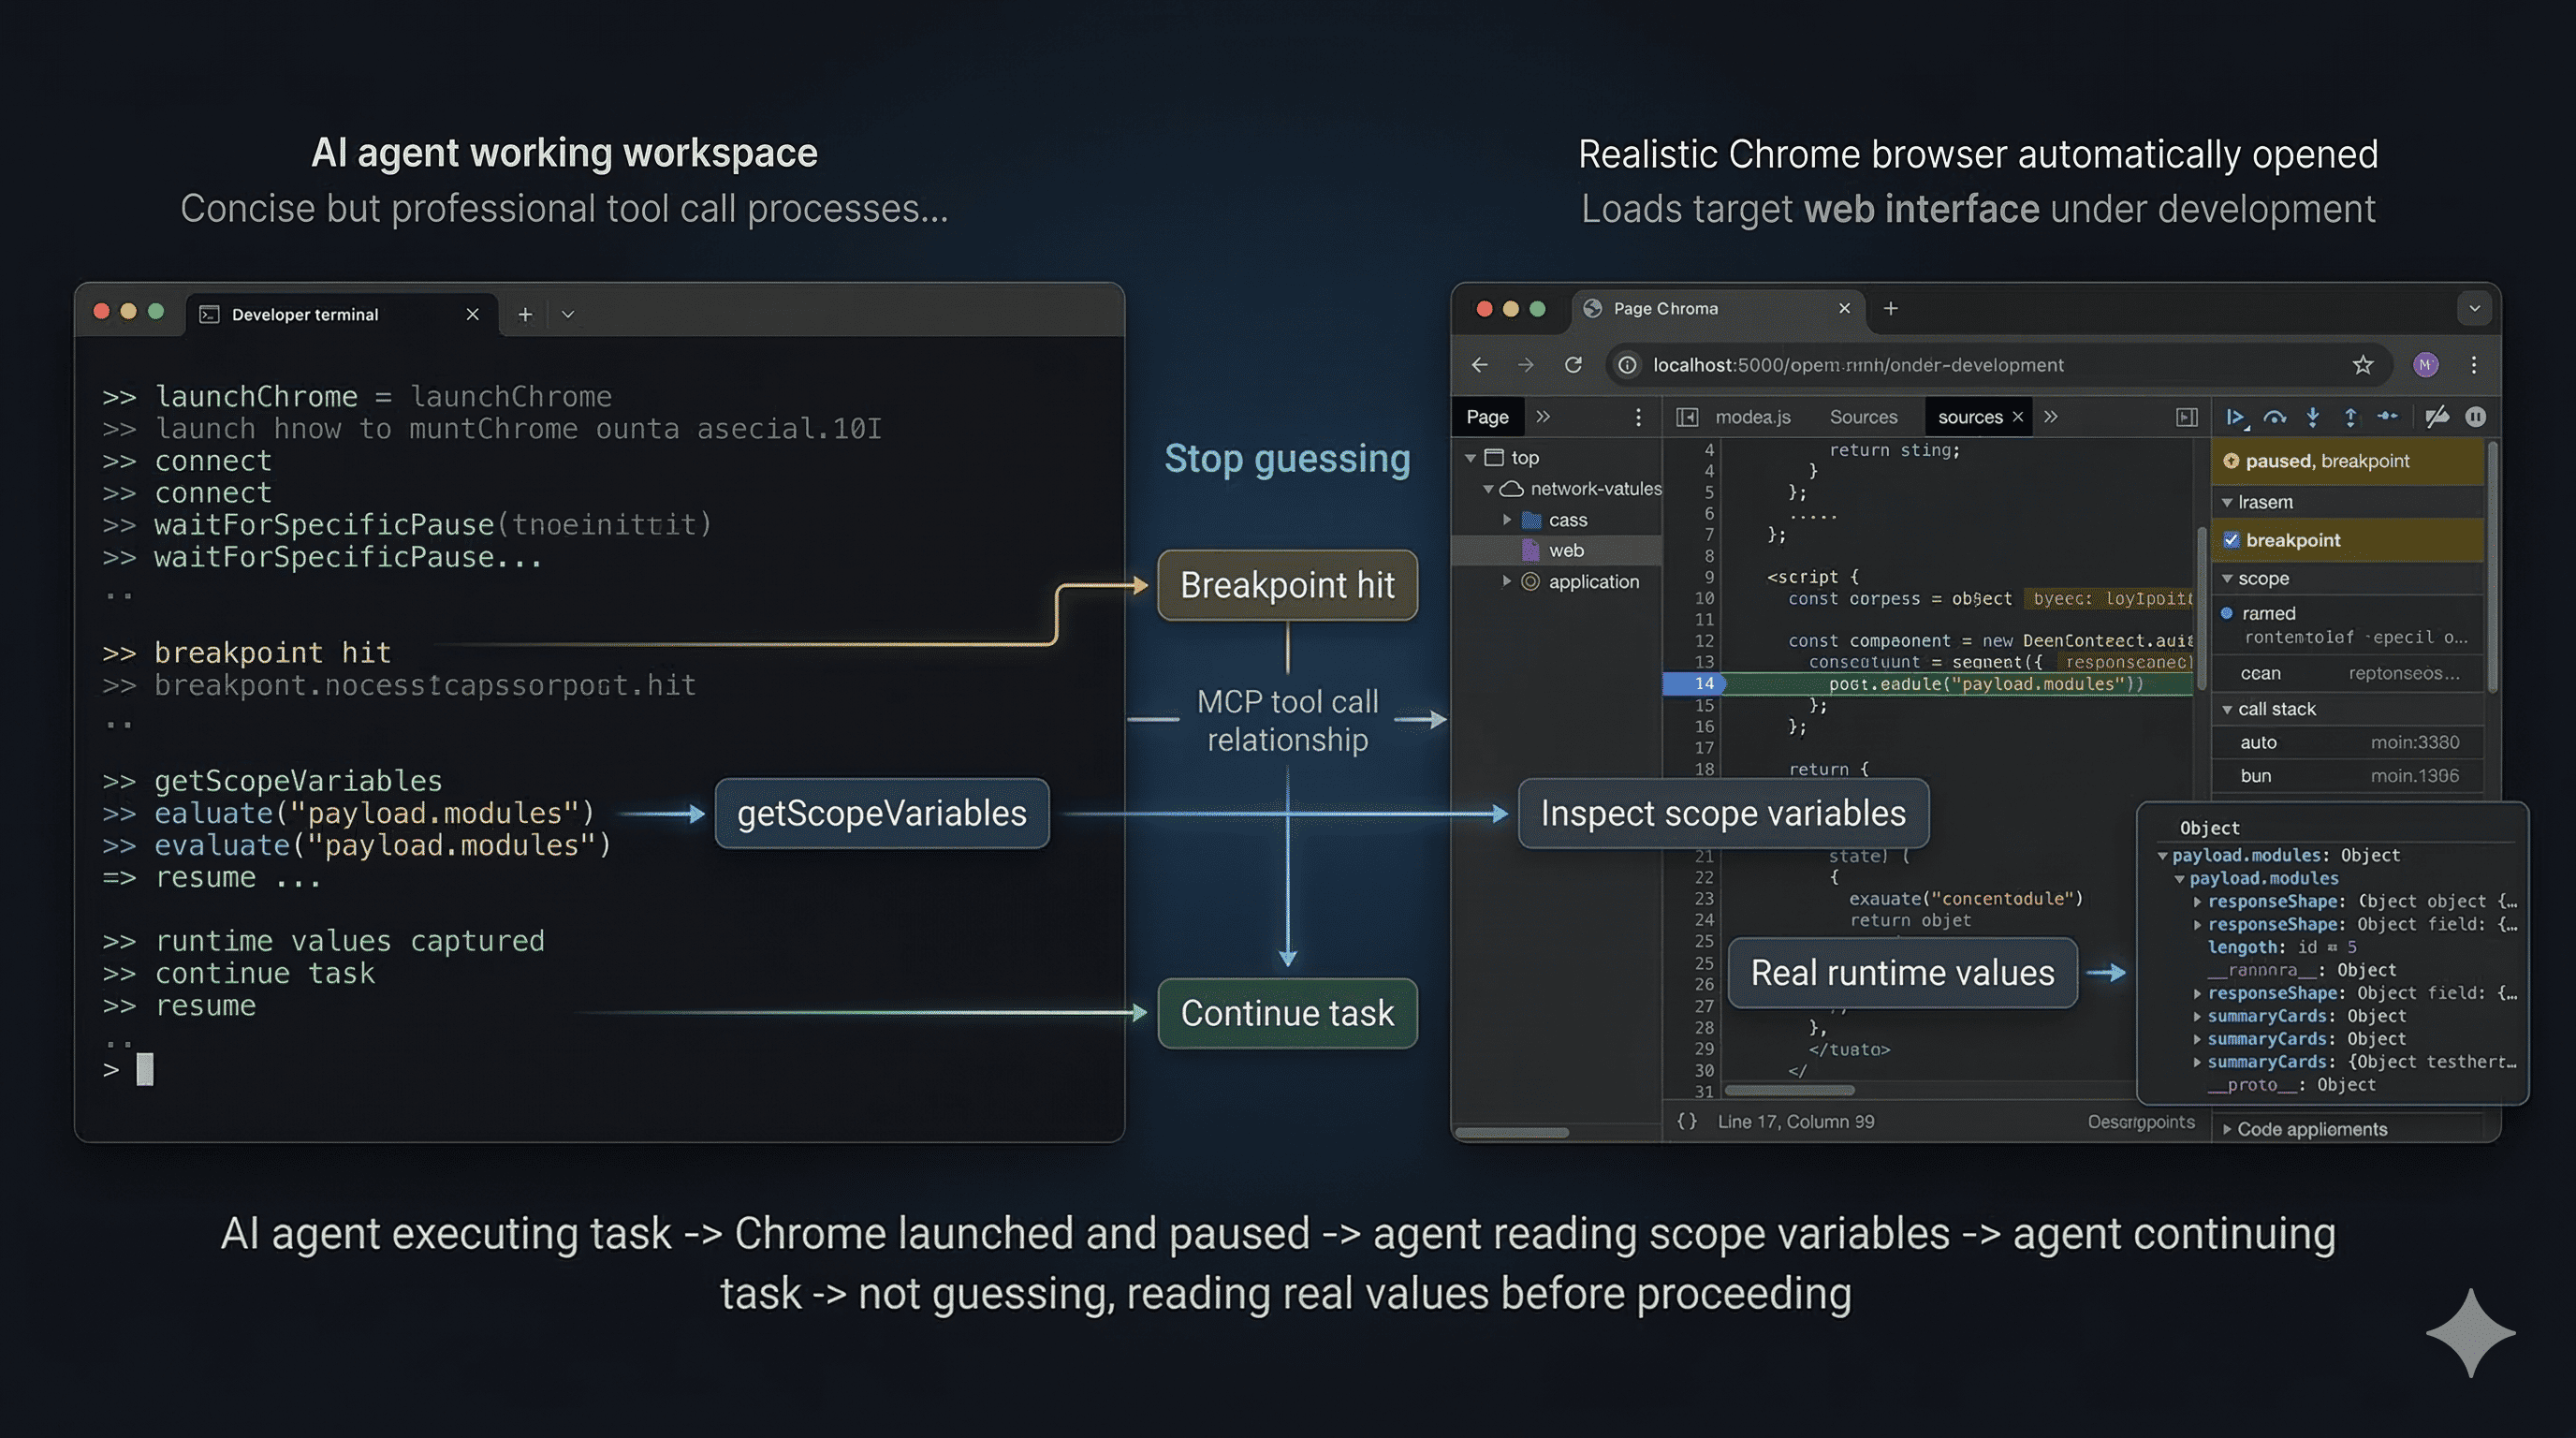
`chrome-debugger-mcp` exposes Chrome DevTools Protocol debugging primitives as MCP tools. It lets an agent attach to a real Chrome tab, pause on breakpoints or `debugger;`, inspect scope variables, evaluate expressions inside the paused frame, step through code, and resume with runtime facts instead of guessing from static source.
|
|
12
12
|
|
|
13
13
|
It is not a general browser automation server. The focus is runtime debugging.
|
|
14
14
|
|
|
15
|
-
### Core Capabilities
|
|
16
|
-
|
|
17
|
-
- Attach to a real Chrome tab over CDP after explicit user confirmation
|
|
18
|
-
- Pause at breakpoints or `debugger;` statements and wait for the exact pause you expect
|
|
19
|
-
- Read local, closure, and module scope values from the paused frame
|
|
20
|
-
- Evaluate JavaScript in the current call frame and step execution forward
|
|
21
|
-
- Resume cleanly so the agent can continue with actual runtime values
|
|
22
|
-
|
|
23
|
-
### Demo
|
|
24
|
-
|
|
25
15
|
|
|
26
16
|
|
|
27
|
-
|
|
17
|
+
_Demo: the agent launches Chrome, waits for a breakpoint, inspects real scope variables, and resumes with runtime facts._
|
|
28
18
|
|
|
29
19
|
### MCP Client Configuration
|
|
30
20
|
|
|
31
|
-
|
|
21
|
+
Use the published package directly:
|
|
32
22
|
|
|
33
23
|
```json
|
|
34
24
|
{
|
|
@@ -41,256 +31,81 @@ It is not a general browser automation server. The focus is runtime debugging.
|
|
|
41
31
|
}
|
|
42
32
|
```
|
|
43
33
|
|
|
34
|
+
No local build step is required for normal usage.
|
|
44
35
|
|
|
45
|
-
###
|
|
36
|
+
### Quick Start
|
|
46
37
|
|
|
47
|
-
|
|
48
|
-
|
|
49
|
-
|
|
50
|
-
|
|
51
|
-
|
|
38
|
+
1. Add the MCP config above and reload your MCP client.
|
|
39
|
+
2. Ask the agent to start a debugging session and show the available Chrome tabs before connecting.
|
|
40
|
+
3. Confirm the exact target page URL when the agent calls `listTargets()`.
|
|
41
|
+
4. Add a temporary `debugger;` statement in local source code, or ask the agent to call `setBreakpoint()`.
|
|
42
|
+
5. Reload the page and immediately wait for the pause with `waitForSpecificPause()` or `waitForPause()`.
|
|
43
|
+
6. Inspect runtime state with `getScopeVariables()` and `evaluate()`, step if needed, then call `resume()`.
|
|
52
44
|
|
|
53
|
-
|
|
45
|
+
Example prompt:
|
|
54
46
|
|
|
55
|
-
```
|
|
56
|
-
|
|
47
|
+
```text
|
|
48
|
+
Use chrome-debugger-mcp to debug my app.
|
|
49
|
+
Start with startDebuggingSession(), list the available Chrome tabs, wait for my confirmation before connect(), then help me pause in App.jsx, inspect runtime values, and resume when done.
|
|
57
50
|
```
|
|
58
51
|
|
|
59
|
-
|
|
60
|
-
|
|
61
|
-
```bash
|
|
62
|
-
pnpm install
|
|
63
|
-
pnpm build
|
|
64
|
-
node dist/index.js
|
|
65
|
-
```
|
|
66
|
-
|
|
67
|
-
### Other Highlights
|
|
68
|
-
|
|
69
|
-
- Launch a dedicated Chrome instance with remote debugging enabled
|
|
70
|
-
- Set and remove DevTools breakpoints without editing source code
|
|
71
|
-
- Reload the page through CDP so breakpoints reliably bind after navigation
|
|
72
|
-
- Poll debugger state when the MCP client has short request timeouts
|
|
73
|
-
- Emit `_ui` payloads and logging messages that clients can surface to the user
|
|
74
|
-
|
|
75
|
-
### Why It Helps
|
|
76
|
-
|
|
77
|
-
Many browser-focused MCP tools are strong at DOM interaction and network inspection, but weak at runtime debugging. This server gives an MCP client the missing loop you would normally use in Chrome DevTools: attach to the right tab, pause at the right time, inspect real values, step if needed, and resume cleanly.
|
|
78
|
-
|
|
79
|
-
It also adds guardrails that prevent common agent mistakes:
|
|
80
|
-
|
|
81
|
-
- guessing which tab to attach to
|
|
82
|
-
- concluding behavior without inspecting runtime values
|
|
83
|
-
- ending the turn between `reloadPage()` and `waitForSpecificPause()`
|
|
84
|
-
|
|
85
|
-
### Requirements
|
|
86
|
-
|
|
87
|
-
- Google Chrome installed locally
|
|
88
|
-
- An MCP client that supports stdio servers and tool calling
|
|
89
|
-
- Access to the application you want to debug
|
|
90
|
-
- Local source access if you plan to insert temporary `debugger;` statements
|
|
91
|
-
|
|
92
|
-
### Tooling Model
|
|
93
|
-
|
|
94
|
-
The server runs over stdio and exposes MCP tools. The most important tools are:
|
|
52
|
+
### Core Tools
|
|
95
53
|
|
|
96
|
-
- `startDebuggingSession`: returns the recommended debugging
|
|
54
|
+
- `startDebuggingSession`: returns the recommended debugging flow and behavior rules for the agent
|
|
97
55
|
- `launchChrome`: launches a dedicated Chrome instance with remote debugging enabled
|
|
98
|
-
- `listTargets`: lists available Chrome tabs and requires
|
|
99
|
-
- `connect`: attaches to the confirmed tab
|
|
100
|
-
- `setBreakpoint`:
|
|
101
|
-
- `removeBreakpoint`: removes a breakpoint created by `setBreakpoint`
|
|
56
|
+
- `listTargets`: lists available Chrome tabs and requires explicit user selection
|
|
57
|
+
- `connect`: attaches to the confirmed target tab
|
|
58
|
+
- `setBreakpoint` and `removeBreakpoint`: manage CDP breakpoints without editing source files
|
|
102
59
|
- `reloadPage`: reloads the current page through CDP
|
|
103
|
-
- `waitForSpecificPause`: waits for the next pause and
|
|
104
|
-
- `waitForPause`: waits for any pause
|
|
60
|
+
- `waitForSpecificPause`: waits for the next pause and matches by file plus line tolerance or `debugger-statement`
|
|
61
|
+
- `waitForPause`: waits for any pause when exact location matching is not needed
|
|
105
62
|
- `getScopeVariables`: reads local, closure, and module scope values from the paused frame
|
|
106
|
-
- `evaluate`:
|
|
107
|
-
- `stepInto`, `stepOver`, `stepOut`: standard
|
|
63
|
+
- `evaluate`: runs JavaScript in the paused call frame
|
|
64
|
+
- `stepInto`, `stepOver`, `stepOut`: standard step controls
|
|
108
65
|
- `resume`: resumes execution after inspection
|
|
109
|
-
- `getStatus`:
|
|
66
|
+
- `getStatus`: polls connected and paused state for clients with short request timeouts
|
|
110
67
|
- `forcePause`: requests a pause at the next JavaScript statement
|
|
111
68
|
|
|
112
|
-
###
|
|
113
|
-
|
|
114
|
-
For AI clients, the intended flow is:
|
|
115
|
-
|
|
116
|
-
1. Call `startDebuggingSession()`.
|
|
117
|
-
2. Call `launchChrome()` or use an already-running Chrome instance with a CDP port.
|
|
118
|
-
3. Call `listTargets()` and show the full tab list to the user.
|
|
119
|
-
4. Wait for the user to confirm the exact page URL.
|
|
120
|
-
5. Call `connect({ targetUrl })`.
|
|
121
|
-
6. Insert a temporary `debugger;` statement in local source code, or call `setBreakpoint()`.
|
|
122
|
-
7. Call `reloadPage()`.
|
|
123
|
-
8. Immediately call `waitForSpecificPause()` in the same turn.
|
|
124
|
-
9. Call `getScopeVariables()` and `evaluate()` to inspect runtime values.
|
|
125
|
-
10. Step if necessary with `stepInto()`, `stepOver()`, or `stepOut()`.
|
|
126
|
-
11. Call `resume()`.
|
|
127
|
-
12. Remove any temporary `debugger;` statements from source code.
|
|
128
|
-
|
|
129
|
-
### Important Rules For Agent Authors
|
|
130
|
-
|
|
131
|
-
This server is designed for tool-using agents, not only for humans. If you are integrating it into an MCP client, keep these rules:
|
|
132
|
-
|
|
133
|
-
- Never skip `listTargets()`.
|
|
134
|
-
- Never guess the target URL, even if only one tab is open.
|
|
135
|
-
- Always wait for explicit user confirmation before `connect()`.
|
|
136
|
-
- After `reloadPage()`, immediately call `waitForSpecificPause()` or `waitForPause()` in the same turn.
|
|
137
|
-
- Do not explain behavior from static code when runtime values can be inspected directly.
|
|
138
|
-
- Always `resume()` after inspection.
|
|
139
|
-
- If you added temporary `debugger;` statements to source code, remove them before finishing.
|
|
140
|
-
|
|
141
|
-
### How `waitForSpecificPause` Matches
|
|
142
|
-
|
|
143
|
-
`waitForSpecificPause` is the preferred waiting primitive because it is more reliable than waiting for an arbitrary pause.
|
|
144
|
-
|
|
145
|
-
It matches a pause using two strategies:
|
|
146
|
-
|
|
147
|
-
1. URL fragment plus line tolerance
|
|
148
|
-
2. URL fragment plus `debugger-statement` pause reason
|
|
149
|
-
|
|
150
|
-
The second path matters when source maps, transpilation, or bundling shift compiled line numbers away from editor line numbers.
|
|
151
|
-
|
|
152
|
-
### Example Tool Sequence
|
|
153
|
-
|
|
154
|
-
An agent debugging a local Vite app might do something like this:
|
|
155
|
-
|
|
156
|
-
1. `launchChrome({ dryRun: true })`
|
|
157
|
-
2. `launchChrome()`
|
|
158
|
-
3. `listTargets()`
|
|
159
|
-
4. Wait for the user to confirm `http://127.0.0.1:5173`
|
|
160
|
-
5. `connect({ targetUrl: "127.0.0.1:5173" })`
|
|
161
|
-
6. Insert `debugger;` in `App.jsx`
|
|
162
|
-
7. `reloadPage()`
|
|
163
|
-
8. `waitForSpecificPause({ urlFragment: "App.jsx", line: 62, actionHint: "click the Refetch payloads button" })`
|
|
164
|
-
9. `getScopeVariables()`
|
|
165
|
-
10. `evaluate({ expression: "payload.modules" })`
|
|
166
|
-
11. `resume()`
|
|
167
|
-
|
|
168
|
-
### Chrome Launch Behavior
|
|
169
|
-
|
|
170
|
-
`launchChrome()` uses a dedicated profile so it does not interfere with the user's normal browser session.
|
|
171
|
-
|
|
172
|
-
Defaults:
|
|
69
|
+
### Usage Guidance
|
|
173
70
|
|
|
174
|
-
-
|
|
175
|
-
-
|
|
176
|
-
|
|
177
|
-
|
|
178
|
-
|
|
179
|
-
-
|
|
180
|
-
-
|
|
181
|
-
- Windows: `C:\Program Files\Google\Chrome\Application\chrome.exe`
|
|
182
|
-
|
|
183
|
-
If automatic launch fails, the tool returns a command the user can run manually.
|
|
184
|
-
|
|
185
|
-
### Local Playground
|
|
186
|
-
|
|
187
|
-
This repository includes a disposable test app under [`test/`](./test) so you can exercise the debugger server against a realistic browser workflow.
|
|
188
|
-
|
|
189
|
-
#### Start the mock service
|
|
190
|
-
|
|
191
|
-
```bash
|
|
192
|
-
cd test/service
|
|
193
|
-
node src/server.js
|
|
194
|
-
```
|
|
195
|
-
|
|
196
|
-
The service listens on `http://127.0.0.1:3030`.
|
|
197
|
-
|
|
198
|
-
#### Start the web app
|
|
199
|
-
|
|
200
|
-
```bash
|
|
201
|
-
cd test/web
|
|
202
|
-
pnpm install
|
|
203
|
-
pnpm dev
|
|
204
|
-
```
|
|
205
|
-
|
|
206
|
-
The web app runs on `http://127.0.0.1:5173`.
|
|
207
|
-
|
|
208
|
-
Useful places to pause:
|
|
209
|
-
|
|
210
|
-
- `test/web/src/App.jsx` inside `loadWorkbench`
|
|
211
|
-
- `test/web/src/App.jsx` inside `loadModuleDetail`
|
|
212
|
-
- `test/web/src/App.jsx` around the unfinished detail sections
|
|
213
|
-
|
|
214
|
-
Runtime payload areas worth inspecting:
|
|
215
|
-
|
|
216
|
-
- `summaryCards`
|
|
217
|
-
- `modules`
|
|
218
|
-
- `apiContracts`
|
|
219
|
-
- `nextActions`
|
|
220
|
-
- `responseShape`
|
|
221
|
-
|
|
222
|
-
### Troubleshooting
|
|
223
|
-
|
|
224
|
-
#### No targets found
|
|
225
|
-
|
|
226
|
-
Make sure Chrome is running with `--remote-debugging-port=9222` and the target page is open.
|
|
227
|
-
|
|
228
|
-
#### More than one tab matches `targetUrl`
|
|
229
|
-
|
|
230
|
-
Pass a more specific substring so the match becomes unique.
|
|
231
|
-
|
|
232
|
-
#### `waitForPause` or `waitForSpecificPause` times out
|
|
233
|
-
|
|
234
|
-
This can happen when:
|
|
235
|
-
|
|
236
|
-
- the page action was never triggered
|
|
237
|
-
- the wrong breakpoint was set
|
|
238
|
-
- the MCP client itself has a shorter request timeout than the tool call
|
|
239
|
-
|
|
240
|
-
If your client times out quickly, use `getStatus()` to poll or increase the client timeout.
|
|
241
|
-
|
|
242
|
-
#### The paused line number does not match the editor line
|
|
243
|
-
|
|
244
|
-
Bundlers and transpilers can shift compiled line numbers. Use `waitForSpecificPause()` and rely on URL fragment matching plus `debugger-statement` semantics.
|
|
245
|
-
|
|
246
|
-
#### Chrome does not launch automatically
|
|
247
|
-
|
|
248
|
-
The machine may use a non-default Chrome install path. Run the returned launch command manually or adjust the implementation to match your environment.
|
|
249
|
-
|
|
250
|
-
### Development
|
|
251
|
-
|
|
252
|
-
```bash
|
|
253
|
-
pnpm install
|
|
254
|
-
pnpm build
|
|
255
|
-
node dist/index.js
|
|
256
|
-
```
|
|
71
|
+
- Start with `startDebuggingSession()` when integrating this server into an agent workflow.
|
|
72
|
+
- Always call `listTargets()` and wait for explicit user confirmation before `connect()`.
|
|
73
|
+
- Prefer `waitForSpecificPause()` when you know the target file or line.
|
|
74
|
+
- After `reloadPage()`, call `waitForSpecificPause()` or `waitForPause()` in the same turn.
|
|
75
|
+
- Use `getScopeVariables()` and `evaluate()` before drawing conclusions from static source.
|
|
76
|
+
- Always call `resume()` after inspection.
|
|
77
|
+
- Remove any temporary `debugger;` statements before finishing.
|
|
257
78
|
|
|
258
|
-
|
|
79
|
+
### Important Notes
|
|
259
80
|
|
|
260
|
-
-
|
|
261
|
-
-
|
|
81
|
+
- Requirements: local Google Chrome, an MCP client that supports stdio servers and tool calling, and source access if you plan to insert `debugger;`.
|
|
82
|
+
- `launchChrome()` uses a dedicated profile so it does not interfere with the user's normal browser session.
|
|
83
|
+
- Default launch settings are remote debugging port `9222` and profile directory `~/.chrome-debug-profile`.
|
|
84
|
+
- If automatic launch fails, the tool returns a command you can run manually.
|
|
85
|
+
- Bundlers and source maps can shift compiled line numbers, so `waitForSpecificPause()` also matches `debugger-statement` pauses.
|
|
86
|
+
- If your MCP client has short request timeouts, use `getStatus()` to poll state.
|
|
262
87
|
|
|
263
88
|
### License
|
|
264
89
|
|
|
265
90
|
MIT
|
|
266
91
|
|
|
267
|
-
<a id="chinese"></a
|
|
92
|
+
<a id="chinese"></a>
|
|
268
93
|
|
|
269
94
|
## 中文
|
|
270
95
|
|
|
271
|
-
一个面向
|
|
96
|
+
一个面向 MCP 客户端的 Chrome 断点调试服务。
|
|
272
97
|
|
|
273
|
-
`chrome-debugger-mcp` 把 Chrome DevTools Protocol 的核心调试能力暴露为 MCP 工具,让
|
|
98
|
+
`chrome-debugger-mcp` 把 Chrome DevTools Protocol 的核心调试能力暴露为 MCP 工具,让 agent 可以连接真实的 Chrome 标签页,在断点或 `debugger;` 处暂停,读取作用域变量,在当前暂停帧中执行表达式,单步跟踪代码,并基于真实运行时值继续工作,而不是只靠静态源码猜测行为。
|
|
274
99
|
|
|
275
|
-
|
|
276
|
-
|
|
277
|
-
### 核心能力
|
|
278
|
-
|
|
279
|
-
- 在用户明确确认后,通过 CDP 连接真实的 Chrome 标签页
|
|
280
|
-
- 在断点或 `debugger;` 命中时暂停,并等待指定文件和行附近的 pause
|
|
281
|
-
- 读取当前暂停帧中的 local、closure、module 作用域变量
|
|
282
|
-
- 在当前调用帧里执行 JavaScript,并继续单步跟踪
|
|
283
|
-
- 检查完成后恢复执行,让 agent 基于真实运行时值继续工作
|
|
284
|
-
|
|
285
|
-
### 功能演示
|
|
100
|
+
它不是通用浏览器自动化服务。它的重点是运行时调试。
|
|
286
101
|
|
|
287
102
|

|
|
288
103
|
|
|
289
|
-
|
|
104
|
+
_演示流程:agent 拉起 Chrome,等待断点命中,读取真实作用域变量,再基于运行时事实继续执行。_
|
|
290
105
|
|
|
291
106
|
### MCP 客户端配置
|
|
292
107
|
|
|
293
|
-
|
|
108
|
+
直接使用已发布包:
|
|
294
109
|
|
|
295
110
|
```json
|
|
296
111
|
{
|
|
@@ -303,224 +118,59 @@ MIT
|
|
|
303
118
|
}
|
|
304
119
|
```
|
|
305
120
|
|
|
121
|
+
正常使用时不需要本地构建。
|
|
306
122
|
|
|
307
|
-
###
|
|
123
|
+
### 快速使用
|
|
308
124
|
|
|
309
|
-
|
|
310
|
-
|
|
311
|
-
|
|
312
|
-
|
|
313
|
-
|
|
125
|
+
1. 添加上面的 MCP 配置,并重新加载你的 MCP 客户端。
|
|
126
|
+
2. 让 agent 先启动调试会话,并在连接前展示可用的 Chrome 标签页。
|
|
127
|
+
3. 当 agent 调用 `listTargets()` 后,明确确认要调试的页面 URL。
|
|
128
|
+
4. 在本地源码里临时加入 `debugger;`,或者让 agent 调用 `setBreakpoint()`。
|
|
129
|
+
5. 重载页面后,立刻调用 `waitForSpecificPause()` 或 `waitForPause()` 等待暂停。
|
|
130
|
+
6. 用 `getScopeVariables()` 和 `evaluate()` 检查运行时状态,必要时单步跟踪,最后调用 `resume()`。
|
|
314
131
|
|
|
315
|
-
|
|
132
|
+
示例提示词:
|
|
316
133
|
|
|
317
|
-
```
|
|
318
|
-
|
|
134
|
+
```text
|
|
135
|
+
使用 chrome-debugger-mcp 帮我调试这个应用。
|
|
136
|
+
先调用 startDebuggingSession(),列出可用的 Chrome 标签页,在我确认之前不要 connect(),然后帮我在 App.jsx 里暂停、检查运行时值,最后恢复执行。
|
|
319
137
|
```
|
|
320
138
|
|
|
321
|
-
|
|
322
|
-
|
|
323
|
-
```bash
|
|
324
|
-
pnpm install
|
|
325
|
-
pnpm build
|
|
326
|
-
node dist/index.js
|
|
327
|
-
```
|
|
328
|
-
|
|
329
|
-
### 其他特点
|
|
330
|
-
|
|
331
|
-
- 启动带远程调试端口的独立 Chrome 实例
|
|
332
|
-
- 无需修改源码即可设置和移除断点
|
|
333
|
-
- 通过 CDP 重载页面,确保跳转后断点可靠绑定
|
|
334
|
-
- 当 MCP 客户端请求超时较短时,可轮询调试器状态
|
|
335
|
-
- 输出 `_ui` 结果和 logging 消息,方便客户端展示给用户
|
|
336
|
-
|
|
337
|
-
### 为什么适合这个场景
|
|
338
|
-
|
|
339
|
-
很多浏览器方向的 MCP 工具更擅长 DOM 操作和网络请求观察,但不擅长回答运行时调试问题。这个服务补上的是 Chrome DevTools 里最关键的那条链路:连接正确标签页、在正确时机暂停、读取真实值、必要时单步跟踪、最后恢复执行。
|
|
340
|
-
|
|
341
|
-
它也内置了几条 guardrails,避免 agent 出现这些常见错误:
|
|
342
|
-
|
|
343
|
-
- 猜测应该连接哪个标签页
|
|
344
|
-
- 没看运行时值就直接下结论
|
|
345
|
-
- 在 `reloadPage()` 和 `waitForSpecificPause()` 之间错误地结束当前轮次
|
|
346
|
-
|
|
347
|
-
### 运行要求
|
|
348
|
-
|
|
349
|
-
- 本机安装了 Google Chrome
|
|
350
|
-
- 使用支持 stdio MCP server 和工具调用的 MCP 客户端
|
|
351
|
-
- 可以访问你要调试的应用
|
|
352
|
-
- 如果要插入临时 `debugger;`,需要能访问本地源码
|
|
353
|
-
|
|
354
|
-
### 工具模型
|
|
355
|
-
|
|
356
|
-
这个服务通过 stdio 运行,并暴露一组 MCP tools。最核心的工具有:
|
|
139
|
+
### 核心工具
|
|
357
140
|
|
|
358
|
-
- `startDebuggingSession`:返回推荐调试流程和 agent
|
|
141
|
+
- `startDebuggingSession`:返回推荐调试流程和 agent 行为规则
|
|
359
142
|
- `launchChrome`:启动带远程调试能力的独立 Chrome 实例
|
|
360
|
-
- `listTargets
|
|
361
|
-
- `connect
|
|
362
|
-
- `setBreakpoint
|
|
363
|
-
- `removeBreakpoint`:移除通过 `setBreakpoint` 创建的断点
|
|
143
|
+
- `listTargets`:列出可调试的 Chrome 标签页,并要求用户明确选择
|
|
144
|
+
- `connect`:连接到已经确认的目标标签页
|
|
145
|
+
- `setBreakpoint` 和 `removeBreakpoint`:无需改源码即可管理 CDP 断点
|
|
364
146
|
- `reloadPage`:通过 CDP 重载当前页面
|
|
365
|
-
- `waitForSpecificPause
|
|
366
|
-
- `waitForPause
|
|
367
|
-
- `getScopeVariables
|
|
368
|
-
- `evaluate
|
|
147
|
+
- `waitForSpecificPause`:等待下一次暂停,并按文件加行号容差或 `debugger-statement` 进行匹配
|
|
148
|
+
- `waitForPause`:在不需要精确位置匹配时等待任意暂停
|
|
149
|
+
- `getScopeVariables`:读取当前暂停帧中的 local、closure、module 作用域变量
|
|
150
|
+
- `evaluate`:在当前暂停调用帧中执行 JavaScript
|
|
369
151
|
- `stepInto`、`stepOver`、`stepOut`:标准单步控制
|
|
370
152
|
- `resume`:检查完毕后恢复执行
|
|
371
|
-
- `getStatus
|
|
153
|
+
- `getStatus`:给超时较短的客户端轮询连接和暂停状态
|
|
372
154
|
- `forcePause`:请求在下一条 JavaScript 语句处暂停
|
|
373
155
|
|
|
374
|
-
###
|
|
375
|
-
|
|
376
|
-
对于 AI 客户端,建议流程是:
|
|
377
|
-
|
|
378
|
-
1. 调用 `startDebuggingSession()`。
|
|
379
|
-
2. 调用 `launchChrome()`,或直接复用已经开启 CDP 端口的 Chrome。
|
|
380
|
-
3. 调用 `listTargets()`,并把完整标签页列表展示给用户。
|
|
381
|
-
4. 等待用户明确确认要调试的页面 URL。
|
|
382
|
-
5. 调用 `connect({ targetUrl })`。
|
|
383
|
-
6. 在本地源码插入临时 `debugger;`,或者调用 `setBreakpoint()`。
|
|
384
|
-
7. 调用 `reloadPage()`。
|
|
385
|
-
8. 在同一轮里立刻调用 `waitForSpecificPause()`。
|
|
386
|
-
9. 调用 `getScopeVariables()` 和 `evaluate()` 检查运行时值。
|
|
387
|
-
10. 必要时使用 `stepInto()`、`stepOver()`、`stepOut()` 继续跟踪。
|
|
388
|
-
11. 调用 `resume()`。
|
|
389
|
-
12. 删除源码里临时加入的 `debugger;`。
|
|
390
|
-
|
|
391
|
-
### 给 Agent 作者的重要规则
|
|
392
|
-
|
|
393
|
-
这个服务首先是为会调用工具的 agent 设计的,而不仅仅是给人手动点工具用。如果你要把它接入自己的 MCP 客户端,建议遵守这些规则:
|
|
394
|
-
|
|
395
|
-
- 不要跳过 `listTargets()`。
|
|
396
|
-
- 即使只看到一个标签页,也不要猜测目标 URL。
|
|
397
|
-
- 一定要等用户明确确认后再调用 `connect()`。
|
|
398
|
-
- 调用 `reloadPage()` 后,必须在同一轮里立刻调用 `waitForSpecificPause()` 或 `waitForPause()`。
|
|
399
|
-
- 能读取运行时值时,不要只根据静态代码解释行为。
|
|
400
|
-
- 检查完之后一定要 `resume()`。
|
|
401
|
-
- 如果向源码里插入了临时 `debugger;`,结束前要清理掉。
|
|
402
|
-
|
|
403
|
-
### `waitForSpecificPause` 如何匹配
|
|
404
|
-
|
|
405
|
-
`waitForSpecificPause` 是首选的等待工具,因为它比“等待任意暂停”更可靠。
|
|
406
|
-
|
|
407
|
-
它有两层匹配策略:
|
|
408
|
-
|
|
409
|
-
1. URL 片段加行号容差
|
|
410
|
-
2. URL 片段加 `debugger-statement` 暂停原因
|
|
411
|
-
|
|
412
|
-
第二层匹配对经过 source map、转译、打包后的代码尤其重要,因为编译后的行号可能和编辑器行号不完全一致。
|
|
413
|
-
|
|
414
|
-
### 调用序列示例
|
|
415
|
-
|
|
416
|
-
一个 agent 调试本地 Vite 应用时,调用顺序大致会像这样:
|
|
417
|
-
|
|
418
|
-
1. `launchChrome({ dryRun: true })`
|
|
419
|
-
2. `launchChrome()`
|
|
420
|
-
3. `listTargets()`
|
|
421
|
-
4. 等用户确认 `http://127.0.0.1:5173`
|
|
422
|
-
5. `connect({ targetUrl: "127.0.0.1:5173" })`
|
|
423
|
-
6. 在 `App.jsx` 插入 `debugger;`
|
|
424
|
-
7. `reloadPage()`
|
|
425
|
-
8. `waitForSpecificPause({ urlFragment: "App.jsx", line: 62, actionHint: "click the Refetch payloads button" })`
|
|
426
|
-
9. `getScopeVariables()`
|
|
427
|
-
10. `evaluate({ expression: "payload.modules" })`
|
|
428
|
-
11. `resume()`
|
|
429
|
-
|
|
430
|
-
### Chrome 启动行为
|
|
431
|
-
|
|
432
|
-
`launchChrome()` 会使用独立 profile,不会影响用户平时正在用的浏览器会话。
|
|
433
|
-
|
|
434
|
-
默认值:
|
|
156
|
+
### 使用建议
|
|
435
157
|
|
|
436
|
-
-
|
|
437
|
-
-
|
|
438
|
-
|
|
439
|
-
|
|
440
|
-
|
|
441
|
-
-
|
|
442
|
-
-
|
|
443
|
-
- Windows:`C:\Program Files\Google\Chrome\Application\chrome.exe`
|
|
444
|
-
|
|
445
|
-
如果自动启动失败,工具会返回一条可供用户手动执行的启动命令。
|
|
446
|
-
|
|
447
|
-
### 本地 Playground
|
|
448
|
-
|
|
449
|
-
仓库里带了一个可丢弃的测试应用,目录在 [`test/`](./test)。你可以直接用它验证这个调试 MCP 的完整链路。
|
|
450
|
-
|
|
451
|
-
#### 启动 mock service
|
|
452
|
-
|
|
453
|
-
```bash
|
|
454
|
-
cd test/service
|
|
455
|
-
node src/server.js
|
|
456
|
-
```
|
|
457
|
-
|
|
458
|
-
服务监听在 `http://127.0.0.1:3030`。
|
|
459
|
-
|
|
460
|
-
#### 启动 web app
|
|
461
|
-
|
|
462
|
-
```bash
|
|
463
|
-
cd test/web
|
|
464
|
-
pnpm install
|
|
465
|
-
pnpm dev
|
|
466
|
-
```
|
|
467
|
-
|
|
468
|
-
Web 应用运行在 `http://127.0.0.1:5173`。
|
|
469
|
-
|
|
470
|
-
建议下断点的位置:
|
|
471
|
-
|
|
472
|
-
- `test/web/src/App.jsx` 里的 `loadWorkbench`
|
|
473
|
-
- `test/web/src/App.jsx` 里的 `loadModuleDetail`
|
|
474
|
-
- `test/web/src/App.jsx` 里尚未完成的 detail 区域附近
|
|
475
|
-
|
|
476
|
-
值得在运行时查看的 payload 字段:
|
|
477
|
-
|
|
478
|
-
- `summaryCards`
|
|
479
|
-
- `modules`
|
|
480
|
-
- `apiContracts`
|
|
481
|
-
- `nextActions`
|
|
482
|
-
- `responseShape`
|
|
483
|
-
|
|
484
|
-
### 故障排查
|
|
485
|
-
|
|
486
|
-
#### 找不到 targets
|
|
487
|
-
|
|
488
|
-
确认 Chrome 是用 `--remote-debugging-port=9222` 启动的,并且目标页面已经打开。
|
|
489
|
-
|
|
490
|
-
#### `targetUrl` 匹配到多个标签页
|
|
491
|
-
|
|
492
|
-
传入更具体的 URL 子串,保证匹配结果唯一。
|
|
493
|
-
|
|
494
|
-
#### `waitForPause` 或 `waitForSpecificPause` 超时
|
|
495
|
-
|
|
496
|
-
常见原因包括:
|
|
497
|
-
|
|
498
|
-
- 页面操作没有真正触发
|
|
499
|
-
- 断点位置不对
|
|
500
|
-
- MCP 客户端自身的请求超时时间比工具调用更短
|
|
501
|
-
|
|
502
|
-
如果客户端超时比较短,可以改用 `getStatus()` 轮询,或者调大客户端超时。
|
|
503
|
-
|
|
504
|
-
#### 暂停时的行号和编辑器对不上
|
|
505
|
-
|
|
506
|
-
打包和转译会导致编译后的行号偏移。优先使用 `waitForSpecificPause()`,并依赖 URL 片段匹配加 `debugger-statement` 语义匹配。
|
|
507
|
-
|
|
508
|
-
#### Chrome 无法自动启动
|
|
509
|
-
|
|
510
|
-
机器上的 Chrome 安装路径可能不是默认值。可以直接运行工具返回的启动命令,或者按你的环境调整实现。
|
|
511
|
-
|
|
512
|
-
### 开发
|
|
513
|
-
|
|
514
|
-
```bash
|
|
515
|
-
pnpm install
|
|
516
|
-
pnpm build
|
|
517
|
-
node dist/index.js
|
|
518
|
-
```
|
|
158
|
+
- 在把这个服务接入 agent 工作流时,先调用 `startDebuggingSession()`。
|
|
159
|
+
- 调用 `connect()` 之前一定先执行 `listTargets()`,并等待用户明确确认。
|
|
160
|
+
- 已知目标文件或行号时,优先使用 `waitForSpecificPause()`。
|
|
161
|
+
- 调用 `reloadPage()` 后,要在同一轮里立刻调用 `waitForSpecificPause()` 或 `waitForPause()`。
|
|
162
|
+
- 能读取运行时值时,优先使用 `getScopeVariables()` 和 `evaluate()`,不要只看静态代码下结论。
|
|
163
|
+
- 检查完成后一定要调用 `resume()`。
|
|
164
|
+
- 如果加入了临时 `debugger;`,结束前要清理掉。
|
|
519
165
|
|
|
520
|
-
|
|
166
|
+
### 注意事项
|
|
521
167
|
|
|
522
|
-
-
|
|
523
|
-
-
|
|
168
|
+
- 运行要求:本机安装 Google Chrome,MCP 客户端支持 stdio server 和工具调用;如果要插入 `debugger;`,还需要能访问本地源码。
|
|
169
|
+
- `launchChrome()` 使用独立 profile,不会影响用户平时正在使用的浏览器会话。
|
|
170
|
+
- 默认启动参数是远程调试端口 `9222`,profile 目录是 `~/.chrome-debug-profile`。
|
|
171
|
+
- 如果自动启动失败,工具会返回一条可以手动执行的命令。
|
|
172
|
+
- 打包和 source map 可能导致编译后行号偏移,所以 `waitForSpecificPause()` 也会匹配 `debugger-statement` 暂停。
|
|
173
|
+
- 如果 MCP 客户端请求超时时间较短,可以用 `getStatus()` 轮询状态。
|
|
524
174
|
|
|
525
175
|
### 许可证
|
|
526
176
|
|
package/package.json
CHANGED
|
@@ -1,31 +1,46 @@
|
|
|
1
1
|
{
|
|
2
|
-
|
|
3
|
-
|
|
4
|
-
|
|
5
|
-
|
|
6
|
-
|
|
7
|
-
|
|
8
|
-
|
|
9
|
-
|
|
10
|
-
|
|
11
|
-
|
|
12
|
-
|
|
13
|
-
|
|
14
|
-
"
|
|
15
|
-
|
|
16
|
-
|
|
17
|
-
|
|
18
|
-
|
|
19
|
-
|
|
20
|
-
|
|
21
|
-
"
|
|
22
|
-
|
|
23
|
-
|
|
24
|
-
|
|
25
|
-
|
|
26
|
-
|
|
27
|
-
"
|
|
28
|
-
|
|
29
|
-
|
|
30
|
-
|
|
31
|
-
|
|
2
|
+
"name": "chrome-debugger-mcp",
|
|
3
|
+
"version": "1.0.3",
|
|
4
|
+
"mcpName": "io.github.bitepro/chrome-debugger-mcp",
|
|
5
|
+
"description": "MCP server for Chrome breakpoint debugging – set breakpoints, inspect scope variables, step through code",
|
|
6
|
+
"type": "module",
|
|
7
|
+
"main": "dist/index.js",
|
|
8
|
+
"repository": {
|
|
9
|
+
"type": "git",
|
|
10
|
+
"url": "https://github.com/BitePro/chrome-debugger-mcp.git"
|
|
11
|
+
},
|
|
12
|
+
"homepage": "https://github.com/BitePro/chrome-debugger-mcp",
|
|
13
|
+
"bugs": {
|
|
14
|
+
"url": "https://github.com/BitePro/chrome-debugger-mcp/issues"
|
|
15
|
+
},
|
|
16
|
+
"files": [
|
|
17
|
+
"dist",
|
|
18
|
+
"README.md"
|
|
19
|
+
],
|
|
20
|
+
"bin": {
|
|
21
|
+
"chrome-debugger-mcp": "dist/index.js"
|
|
22
|
+
},
|
|
23
|
+
"scripts": {
|
|
24
|
+
"build": "tsc",
|
|
25
|
+
"start": "node dist/index.js",
|
|
26
|
+
"dev": "tsc --watch",
|
|
27
|
+
"test": "tsc && node --test test/unit/*.test.mjs"
|
|
28
|
+
},
|
|
29
|
+
"keywords": [
|
|
30
|
+
"mcp",
|
|
31
|
+
"chrome",
|
|
32
|
+
"debugger",
|
|
33
|
+
"cdp",
|
|
34
|
+
"breakpoint"
|
|
35
|
+
],
|
|
36
|
+
"license": "MIT",
|
|
37
|
+
"dependencies": {
|
|
38
|
+
"@modelcontextprotocol/sdk": "^1.12.1",
|
|
39
|
+
"chrome-remote-interface": "^0.33.2",
|
|
40
|
+
"zod": "^3.24.2"
|
|
41
|
+
},
|
|
42
|
+
"devDependencies": {
|
|
43
|
+
"@types/node": "^22.13.10",
|
|
44
|
+
"typescript": "^5.8.2"
|
|
45
|
+
}
|
|
46
|
+
}
|